From the free course AP Comparative Government and Politics on Lykke
AP Practice 5
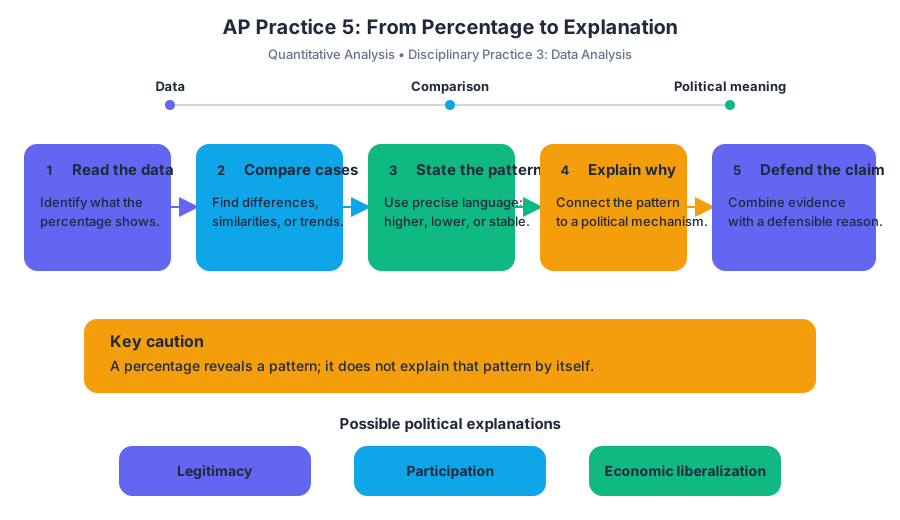
A percentage can reveal a political pattern, but it cannot explain that pattern by itself: comparison requires identifying what the data show and connecting the pattern to a defensible political explanation.
AP Practice 5
A percentage can reveal a political pattern, but it cannot explain that pattern by itself: comparison requires identifying what the data show and connecting the pattern to a defensible political explanation.
This original, unofficial practice targets the Quantitative Analysis free-response task and develops Disciplinary Practice 3: Data Analysis. It also reinforces Concept Application when you connect a numerical pattern to ideas such as legitimacy, participation, or economic liberalization.
The task
Use the table to answer all four parts. The figures are invented for practice and represent the percentage of citizens in four selected countries who reported that they trusted the national legislature in two survey years.
| Country | 2015 | 2023 |
|---|---|---|
| United Kingdom | $42%$ | $48%$ |
| Mexico | $36%$ | $29%$ |
| Nigeria | $31%$ | $37%$ |
| Iran | $54%$ | $46%$ |
(a) Identify the country with the greatest increase in legislative trust between $2015$ and $2023$.
(b) Describe the overall change in legislative trust in Mexico and Iran.
(c) Explain one possible political reason why legislative trust might increase in one country while decreasing in another.
(d) Draw one conclusion about the relationship between legislative trust and political legitimacy, using evidence from the table.
Timing strategy
Allow approximately $12$ minutes. Spend the first $2$ minutes reading the title, variables, years, countries, and units. Use the next $7$ minutes to answer the four parts directly, then reserve $3$ minutes to check that every explanation includes a political mechanism rather than merely repeating a number.
A useful visual routine is:
$$ \text{Read variables} \rightarrow \text{Compare values} \rightarrow \text{State pattern} \rightarrow \text{Explain mechanism} \rightarrow \text{Qualify conclusion} $$
Worked reasoning
(a) Point earned: identify the correct value comparison. Nigeria has the greatest increase: $37%-31%=6$ percentage points. The United Kingdom increases by $6$ percentage points as well, so the table actually shows a tie. A precise answer is therefore: Nigeria and the United Kingdom have the greatest increase, each rising by $6$ percentage points.
(b) Point earned: accurately describe both directions. Mexico’s legislative trust decreases from $36%$ to $29%$, a decline of $7$ percentage points. Iran’s trust decreases from $54%$ to $46%$, a decline of $8$ percentage points. Both countries experience declines, but Iran’s decline is larger.
(c) Point earned: connect the pattern to a plausible political cause. Legislative trust may increase when citizens view the legislature as responsive—for example, when it passes visible policies that address unemployment or corruption. Trust may decrease when citizens associate lawmakers with corruption, ineffective policy, or political conflict. The explanation earns its strength from the mechanism: institutional performance or perceived responsiveness changes citizens’ evaluations of the legislature.
(d) Point earned: make a supported, qualified conclusion. The data suggest that legislative trust can change in different directions across countries: trust rises in the United Kingdom and Nigeria but falls in Mexico and Iran. This may affect political legitimacy because citizens who believe institutions are responsive may be more willing to accept governmental authority. However, the table does not prove that trust alone determines legitimacy; legitimacy can also depend on elections, ideology, economic performance, or coercion.
Misconception check
Misconception: “The highest percentage means the greatest increase.” Iran has the highest 2015 value, but it experiences the largest decline. Always distinguish an absolute level from a change over time. Also distinguish percentage points from percent change: moving from $31%$ to $37%$ is an increase of $6$ percentage points, not simply “$6%$.”
Error-review routine
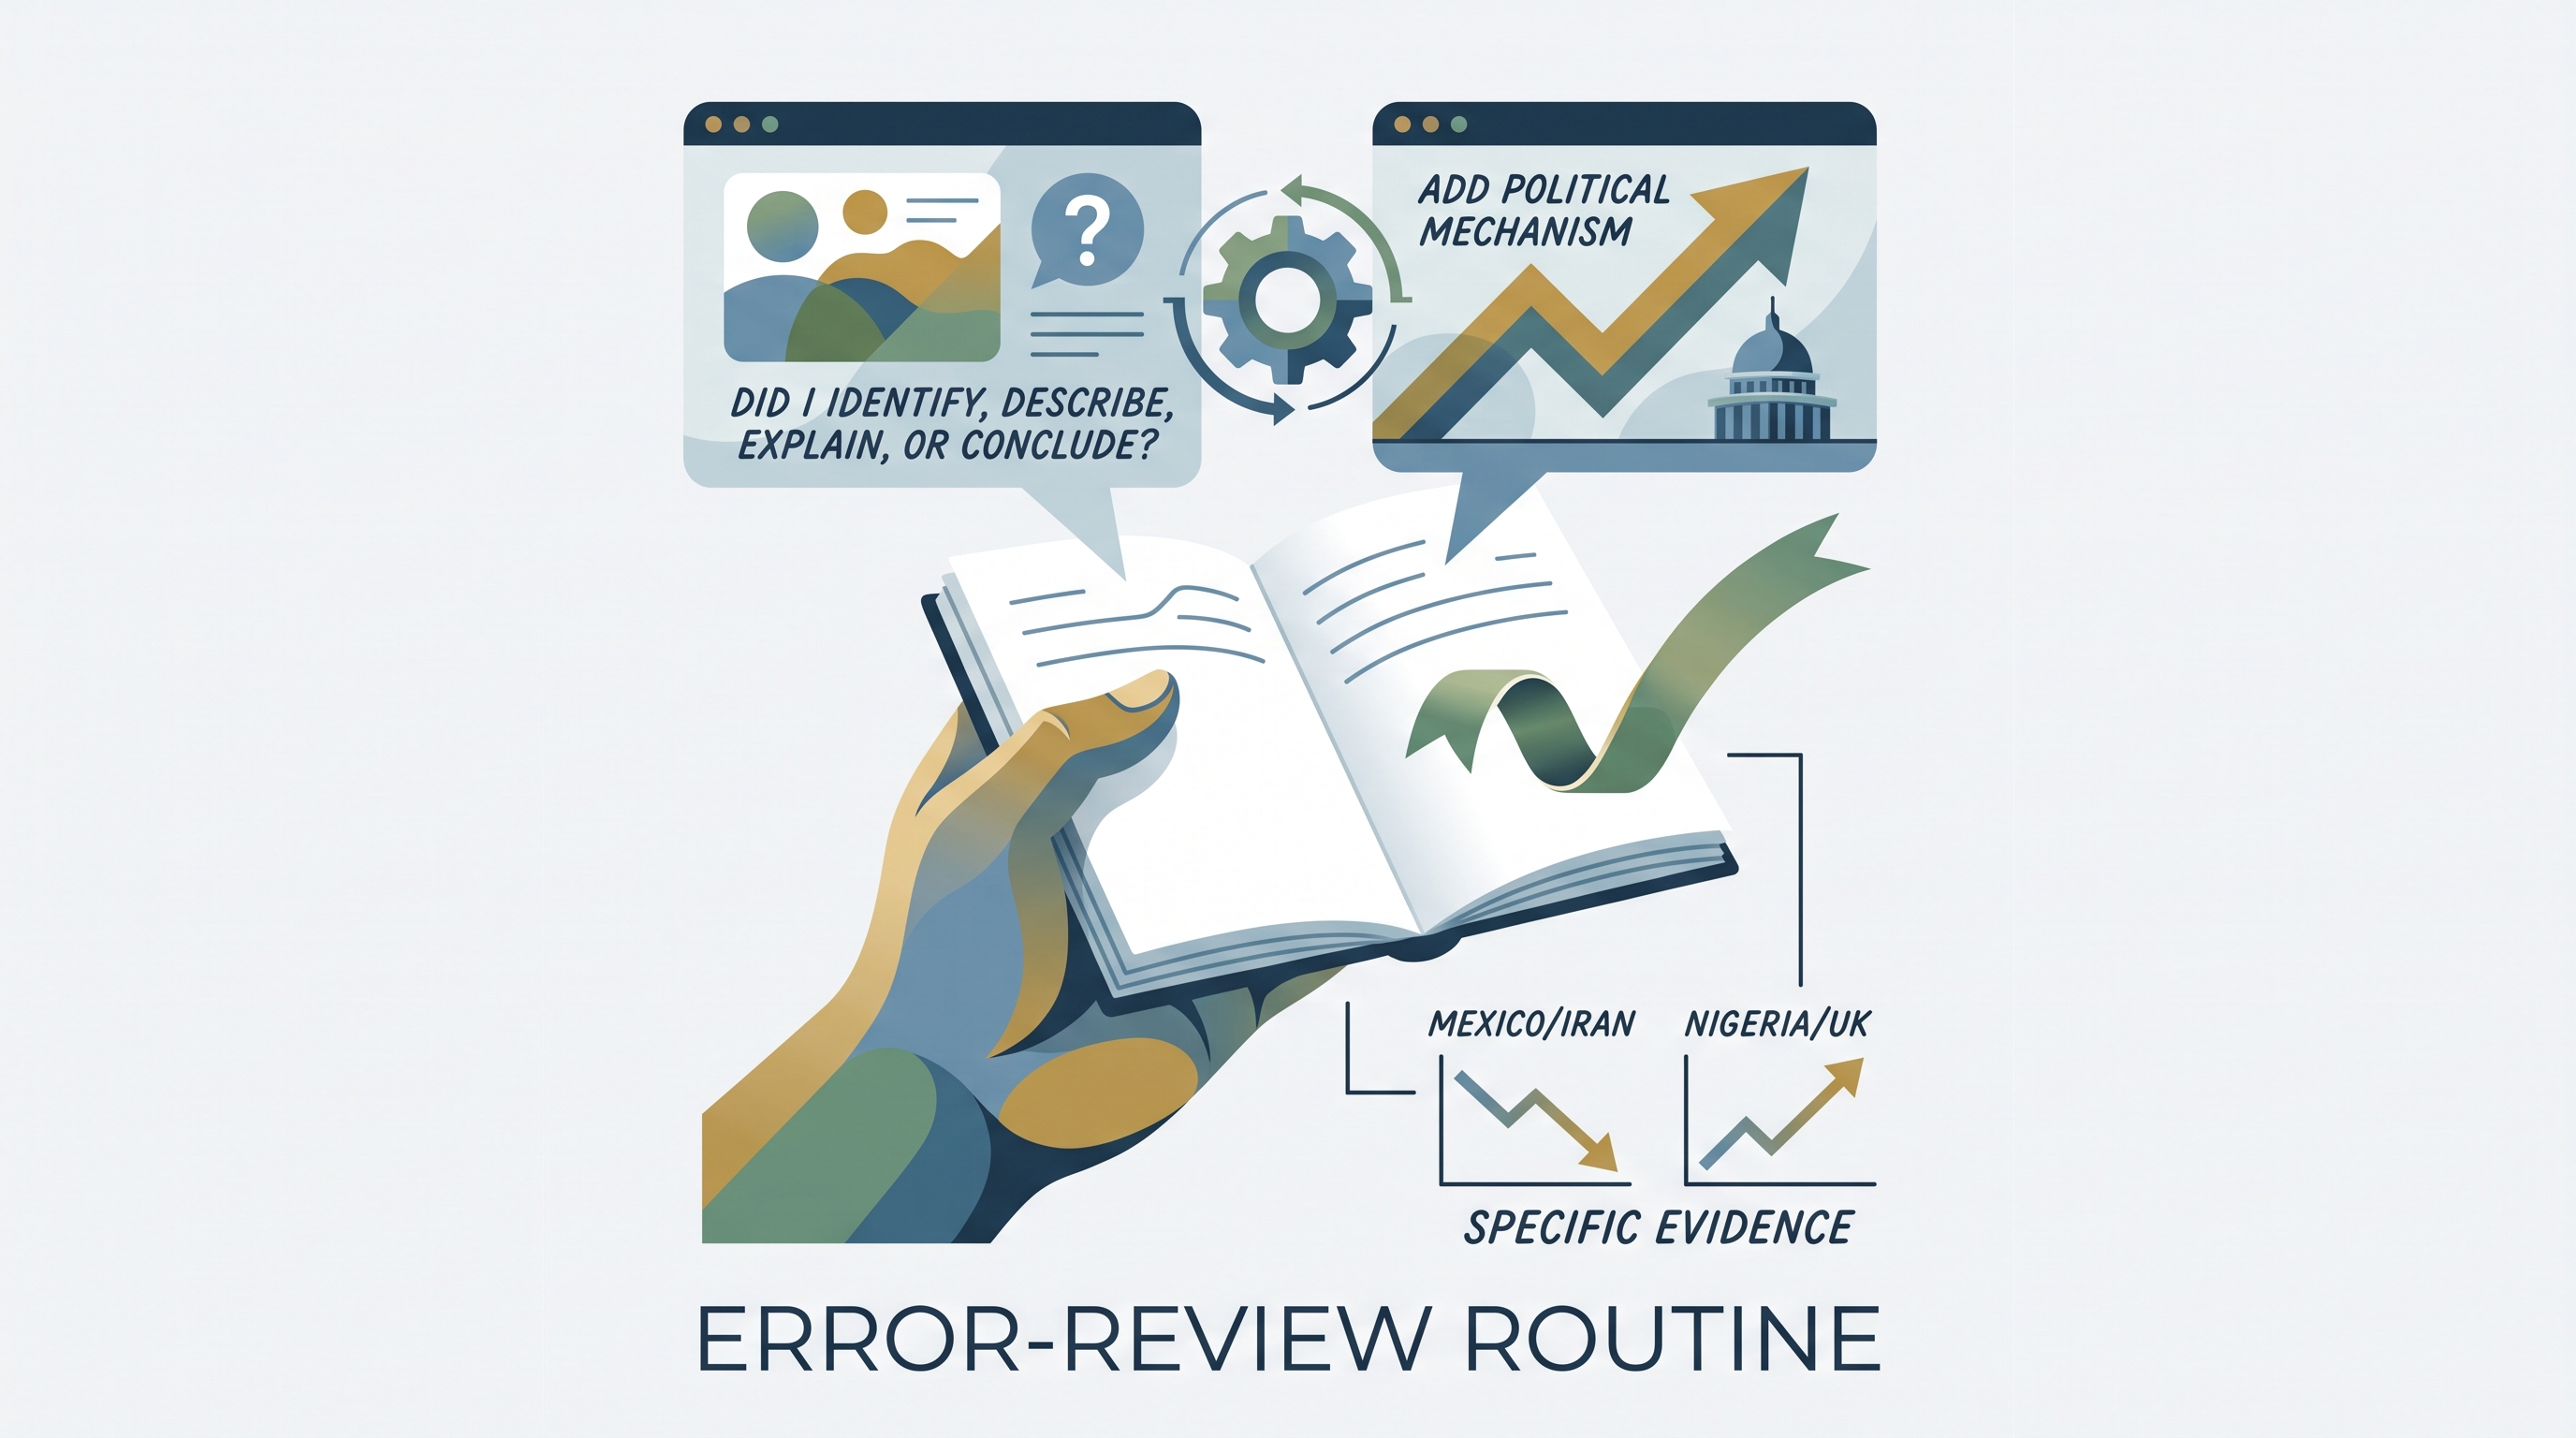
After completing the task, label each response with one question: Did I identify, describe, explain, or conclude? If an explanation only restates the data, add a political mechanism. If a conclusion claims causation, revise it to “suggests” unless the evidence establishes more than association.
Retrieval check: Which response would lose credit: “Trust changed differently,” or “Trust rose in Nigeria and the United Kingdom but fell in Mexico and Iran”? The second is stronger because it names the countries, directions, and evidence-based comparison.
Source Materials
- AP Comparative Government and Politics Course and Exam Description
- AP Comparative Government and Politics Course and Exam Description Clarifications and Corrections
- AP Comparative Government and Politics Course Overview
- AP Comparative Government and Politics Course at a Glance
- AP Comparative Government and Politics Course at a Glance Poster
- AP Comparative Government and Politics
- AP Comparative Government and Politics
- AP Comparative Government and Politics Sample Syllabus 1
- AP Comparative Government and Politics-AP Students-College Board
- AP Comparative Government and Politics-Wikipedia
- AP Comparative Government and Politics Cheat <http://sheets-albert.io>Sheets-Albert.io
- AP Comparative Government and Politics-GOA