From the free course AP Comparative Government and Politics on Lykke
AP Practice 2
Key concepts: Regime stability and control of the military · Transitions from dictatorship to theocracy · Representation of religious, ethnic, and minority groups · Contradictory policies and challenges of policy implementation · Civil service and executive leadership changes · The United Kingdom’s ceremonial monarchy · Single-member and multimember electoral districts · Two-round elections and candidate vetting · One-party dominance and Mexico’s multiparty system · Using data on human development, wealth, and inequality to analyze political consequences
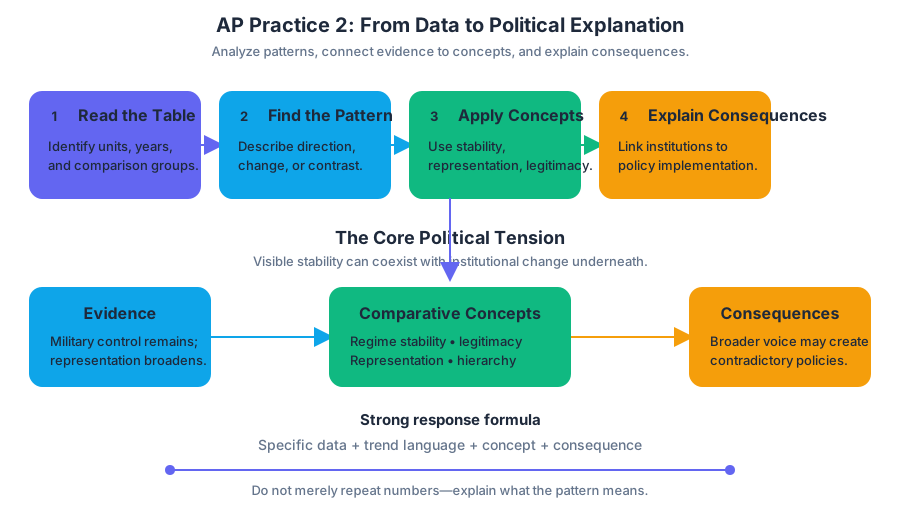
A political system can look stable while changing underneath: a ruling party may retain military control, a monarch may remain politically ceremonial, and regional institutions may broaden representation while also producing contradictory policies.
AP Practice 2
A political system can look stable while changing underneath: a ruling party may retain military control, a monarch may remain politically ceremonial, and regional institutions may broaden representation while also producing contradictory policies. This practice is an original quantitative analysis task built around that tension.
Exam task: analyze a data table, identify patterns, describe a trend, and use comparative-government concepts to explain consequences. A strong response does more than repeat numbers: it connects evidence to concepts such as regime stability, representation, legitimacy, and policy implementation.
The analytical map
Use this sequence when reading quantitative evidence:
| Step | Question to ask | What earns credit |
|---|---|---|
| 1. Identify | What category or country fits the prompt? | A precise selection |
| 2. Describe | What changes, remains stable, or differs? | Numbers and direction |
| 3. Explain | Why might the pattern exist? | A defensible political mechanism |
| 4. Compare | How does one case differ from another? | A meaningful similarity or difference |
| 5. Evaluate | What consequence follows? | A link to legitimacy, stability, representation, or implementation |
The task draws on Practice 3: Data Analysis, especially identifying patterns, describing quantitative information, drawing conclusions, and supporting an explanation with evidence. It also activates Practice 1: Concept Application and Practice 2: Country Comparison.
Original quantitative-analysis task
The following constructed dataset shows the percentage of legislative seats held by the largest party, an index of minority representation, and an index of policy-consistency problems. The representation and policy indices range from $0$ to $100$; higher values indicate more representation or more contradictory policy outcomes.
| Country | Largest-party seats, Year 1 | Largest-party seats, Year 2 | Minority-representation index | Policy-contradiction index |
|---|---|---|---|---|
| China | $92%$ | $93%$ | $18$ | $12$ |
| Iran | $55%$ | $57%$ | $31$ | $28$ |
| Mexico | $68%$ | $47%$ | $54$ | $39$ |
| Nigeria | $51%$ | $46%$ | $62$ | $58$ |
| Russia | $56%$ | $76%$ | $24$ | $21$ |
| United Kingdom | $52%$ | $49%$ | $71$ | $46$ |
The dataset is designed for practice, not as a factual measurement of the six countries. Treat every number as evidence supplied by the prompt; do not replace it with outside knowledge.
Questions
A. Identify the country with the greatest increase in the largest party’s share of legislative seats from Year 1 to Year 2.
B. Describe one trend in the largest party’s legislative-seat share for China, Mexico, or Russia.
C. Using the data, explain how an electoral system can affect representation of religious, ethnic, or minority groups.
D. Explain one way devolution or regional representation could improve legitimacy and one way it could make policy implementation more difficult.
E. Compare China and the United Kingdom with respect to regime stability and executive authority. Use one quantitative difference and one substantive country example.
Worked reasoning
A — Identify the largest increase. Calculate the change for each country:
- China: $93% - 92% = 1$ percentage point
- Iran: $57% - 55% = 2$ percentage points
- Mexico: $47% - 68% = -21$ percentage points
- Nigeria: $46% - 51% = -5$ percentage points
- Russia: $76% - 56% = 20$ percentage points
- United Kingdom: $49% - 52% = -3$ percentage points
Russia has the greatest increase, at $20$ percentage points. Notice the distinction between a percentage-point change and a percentage increase: the table asks for the former.
B — Describe a trend. A complete response includes both endpoints and the direction of change. For example: “Russia’s largest party increased its legislative-seat share from $56%$ in Year 1 to $76%$ in Year 2, a rise of $20$ percentage points.” This is stronger than “Russia became more dominant,” because it proves the claim with data.
C — Explain representation. Election rules shape who converts votes into seats. Single-member districts may reward the strongest candidate in each district, while multimember or proportional systems can allow smaller parties and dispersed religious, ethnic, or socioeconomic groups to gain representation. A second round of voting can also change which candidates survive and which coalitions form. This connects directly to DEM-2.B.6, because election-rule changes affect the representation of different groups.
D — Explain the trade-off. Devolution can improve legitimacy by matching policies to local needs, increasing participation, checking central power, and improving representation of religious, ethnic, or minority groups. However, regional governments may adopt contradictory policies, creating uneven rules and making national implementation more complicated or inefficient. This is the double-edged logic of LEG-1.B.4: decentralization can strengthen legitimacy while weakening coordination.
E — Compare cases. China’s largest party holds $93%$ of seats in Year 2, compared with $49%$ for the United Kingdom’s largest party. China’s Communist Party also maintains control over the military, strengthening regime stability and central authority. In the United Kingdom, the monarch serves ceremonially as head of state, while the prime minister leads the government and oversees the civil service. Thus, both systems may be stable, but their sources of authority differ: centralized party control in China versus parliamentary government operating alongside a ceremonial monarchy in the United Kingdom.
Connected case knowledge
The cases illustrate why data must be interpreted through institutions. Iran’s transition after the 1979 Revolution moved from dictatorial rule to a theocracy based on Islamic principles. Mexico’s party system includes the National Action Party, or PAN, and the Party of the Democratic Revolution, or PRD, within a broader transition away from historically sustained one-party dominance. In some governments, top leadership changes occur behind closed doors while the civil service continues to be overseen, allowing administrative continuity even when executive leadership changes.
Political institutions can broaden representation, but representation does not automatically produce agreement. Governments, citizens, and groups inside and outside government influence policy; contradictory policies may reveal competing centers of authority rather than simple governmental failure. Data on human development, wealth, or inequality can help identify the consequences of those arrangements, but correlation alone does not prove causation.
Misconception check
Misconception: “A high largest-party seat share automatically proves democratic legitimacy.” It does not. A dominant party may reflect popular support, electoral rules, restricted competition, or a managed political system. Similarly, a lower seat share does not automatically prove instability. Always explain the institutional mechanism before making a claim about legitimacy or regime stability.
Timing and error review
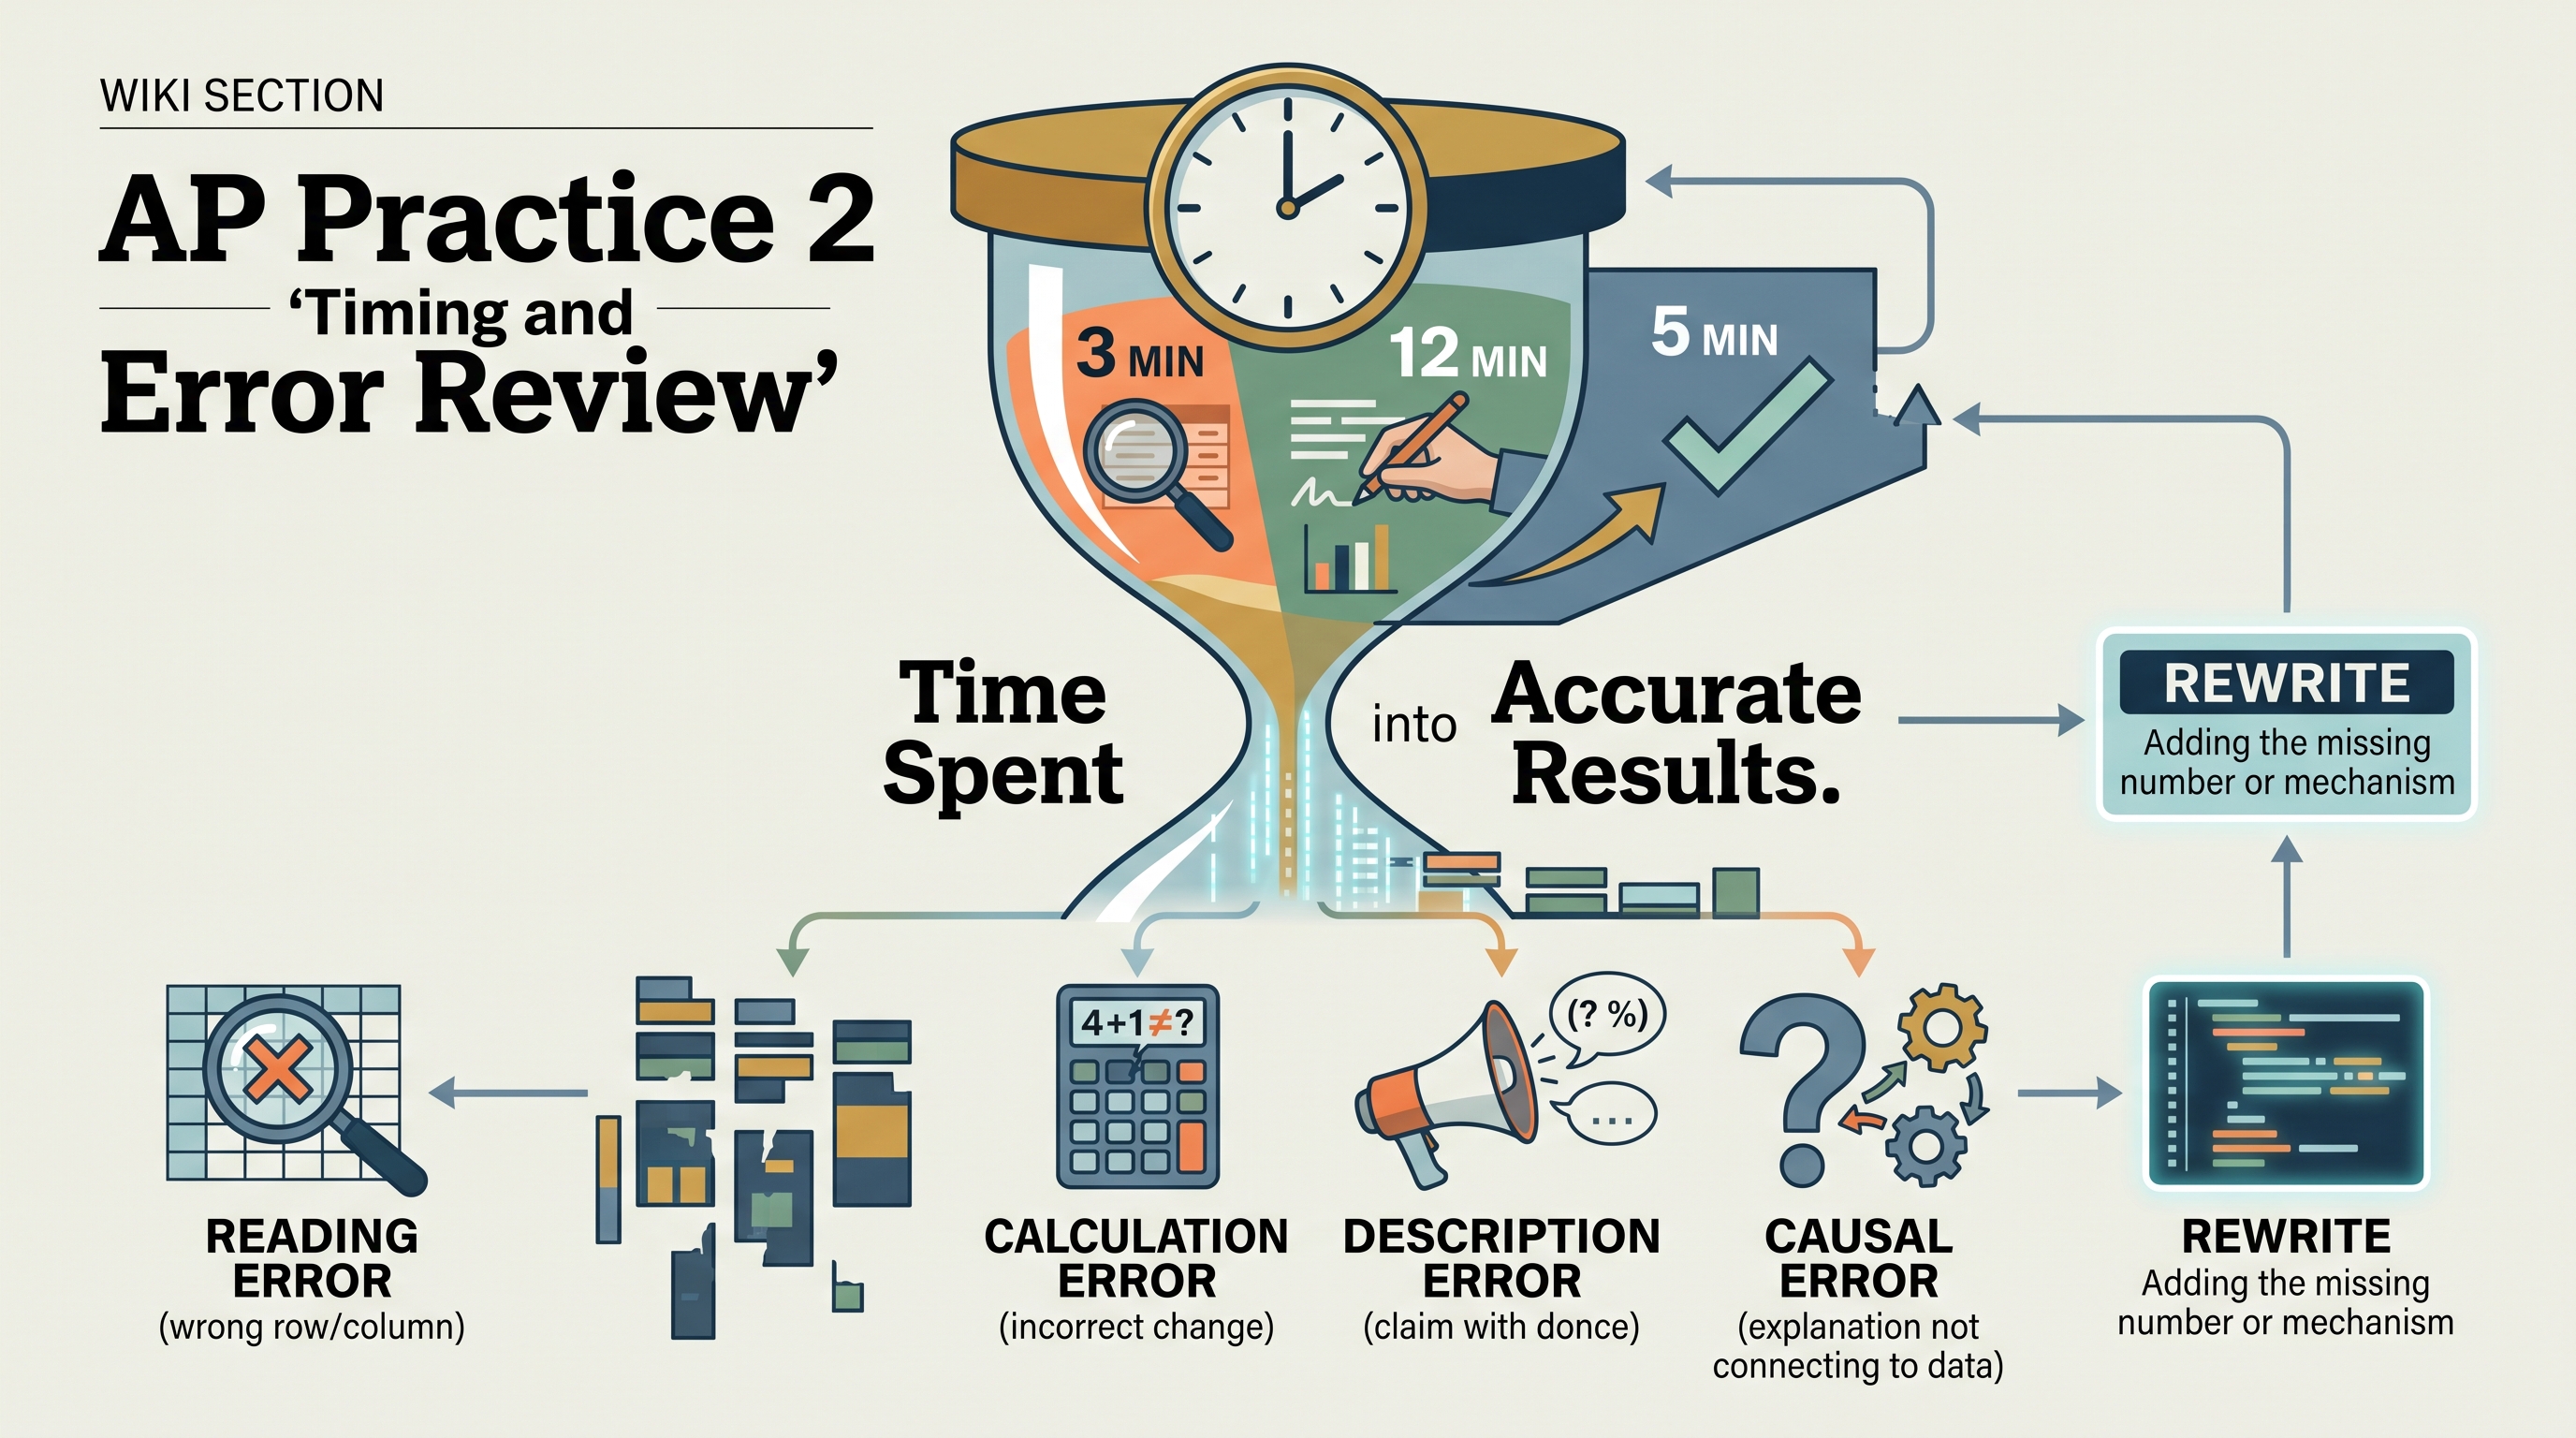
For a quantitative-analysis question, aim to spend approximately $20$ minutes: $3$ minutes reading the table, $12$ minutes answering, and $5$ minutes checking. Underline every requested operation—identify, describe, explain, compare—and verify that each numerical claim includes a country, category, direction, and value.
Afterward, label each missed point as one of four errors: reading error—the wrong row or column; calculation error—incorrect change; description error—a claim without evidence; or causal error—a political explanation that does not connect to the data. Rewrite only the weak sentence, adding the missing number or mechanism.
Source Materials
- AP Comparative Government and Politics Course and Exam Description
- AP Comparative Government and Politics Course and Exam Description Clarifications and Corrections
- AP Comparative Government and Politics Course Overview
- AP Comparative Government and Politics Course at a Glance
- AP Comparative Government and Politics Course at a Glance Poster
- AP Comparative Government and Politics
- AP Comparative Government and Politics
- AP Comparative Government and Politics Sample Syllabus 1
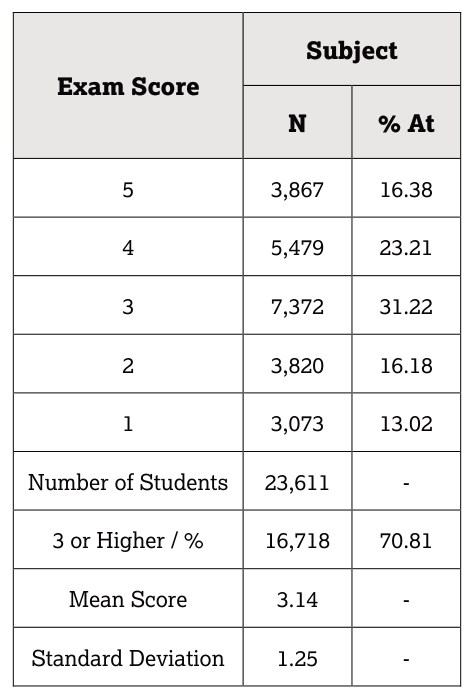
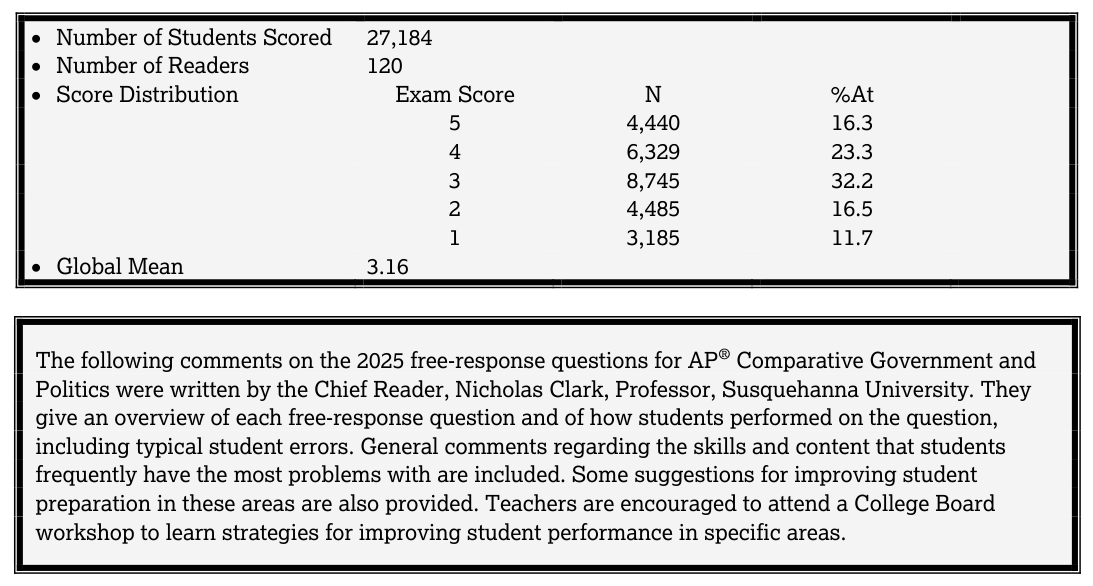
- Figure — Score Distributions (p. 1)
- 5 4,440 16.3
- Figure — Chief Reader Report - Set 2 (p. 1)
- © 2025 College Board.