From the free course AP Physics 1 on Lykke
8.1 Internal Structure and Density
Key concepts: Internal structure and density · Fluids as the subject of Unit 8
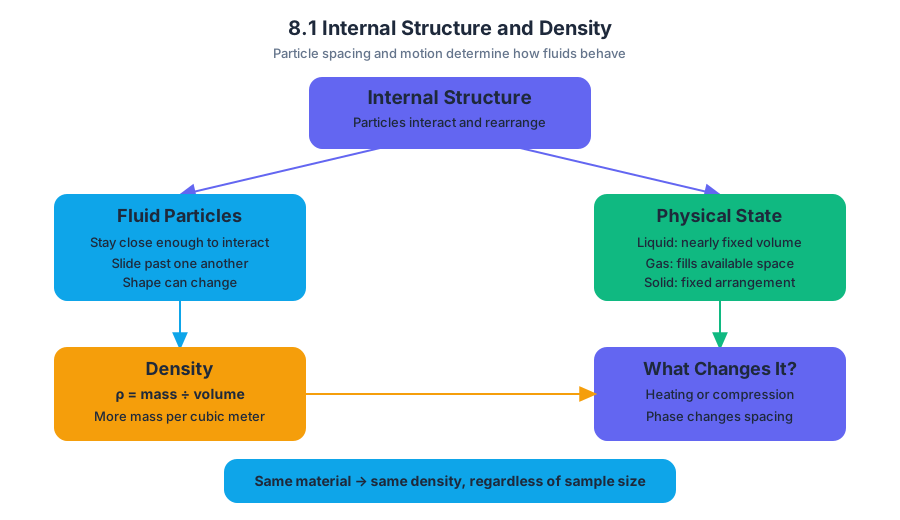
A fluid can flow because its particles are not locked into a fixed shape, but the particles still occupy space and contribute mass. Density measures how much mass is packed into a given volume:
8.1 Internal Structure and Density
A fluid can flow because its particles are not locked into a fixed shape, but the particles still occupy space and contribute mass. Density measures how much mass is packed into a given volume:
$$\rho=\frac{m}{V}$$
where $\rho$ is density, $m$ is mass, and $V$ is volume. Density is therefore an intensive property: doubling the amount of a uniform material doubles both its mass and volume, leaving $\rho$ unchanged.
Internal structure: what makes a fluid a fluid?
Imagine a crowd of people in a room. In a solid, each person is constrained to a particular position relative to nearby people; the group keeps its shape. In a fluid, the particles remain close enough to interact but can rearrange and slide past one another. A liquid keeps nearly the same volume while changing shape to fit its container; a gas spreads out to occupy the available container volume.
The microscopic picture explains why density depends on both the material and its physical state. A tightly packed sample has more mass in each cubic meter than a loosely packed sample. Heating, compressing, or changing a substance’s phase can alter the spacing of its particles and therefore change its density.
Density is mass per unit volume, not simply “how heavy something feels.”
A large block and a small block made from the same uniform material have the same density, even though the larger block has greater mass. Density describes the material’s structure; mass describes the total amount of material present.
Measuring density from mass and volume
For a regular object, measure its dimensions, calculate its volume, and divide its mass by that volume. For a rectangular sample,
$$V=\ell w h$$
so its density is
$$\rho=\frac{m}{\ell w h}.$$
For an irregular object, the volume can be found from the amount of fluid displaced when the object is submerged, provided the object does not absorb the fluid and is fully covered.
Worked example: identifying a material
A solid sample has mass $540\ \text{g}$ and volume $200\ \text{cm}^3$. Its density is
$$\rho=\frac{540\ \text{g}}{200\ \text{cm}^3} =2.7\ \text{g/cm}^3.$$
To express this in SI units, use $1\ \text{g}=10^{-3}\ \text{kg}$ and $1\ \text{cm}^3=10^{-6}\ \text{m}^3$:
$$2.7\ \text{g/cm}^3=2.7\times10^3\ \text{kg/m}^3.$$
The result can be compared with known material densities. The calculation is meaningful only when the units of mass and volume are stated and handled consistently.
Density from a data graph
When several samples of the same material are measured, graph mass on the vertical axis and volume on the horizontal axis. If the material is uniform, the data should follow a line through or near the origin:
$$m=\rho V.$$
This has the form $y=mx+b$, so the slope of a mass-versus-volume graph is density:
$$\text{slope}=\frac{\Delta m}{\Delta V}=\rho.$$
Suppose measurements produce a best-fit slope of $1.18\ \text{g/cm}^3$. The density is therefore $1.18\ \text{g/cm}^3$, even if individual measurements do not lie exactly on the line. A best-fit slope uses the overall pattern rather than trusting one pair of measurements.
Science Practice 1.B — Create quantitative graphs with appropriate scales and units, including plotting data. Choose an axis scale that spreads the data across the graph, label each axis with its quantity and unit, and plot measured points carefully.
Science Practice 2.B — Calculate or estimate an unknown quantity with units from known quantities, by selecting and following a logical computational pathway. In this application, the pathway is: identify mass and volume, place mass versus volume if using a graph, determine the slope, and report density with units.
Misconception check: “heavier means denser”
A kilogram of aluminum is heavier than a gram of gold, but gold is denser because the same volume of gold contains more mass. The correct comparison keeps volume fixed: ask which sample has greater mass for equal volume, or calculate $\rho=m/V$.
Another common error is placing volume on the vertical axis and mass on the horizontal axis, then calling the slope density. That slope would be
$$\frac{\Delta V}{\Delta m}=\frac{1}{\rho},$$
not $\rho$. The graph’s axis choice determines the physical meaning of its slope.
Retrieval check
A sample has mass $150\ \text{g}$ and volume $50\ \text{cm}^3$. What is its density, and what would the slope represent if mass were graphed against volume?
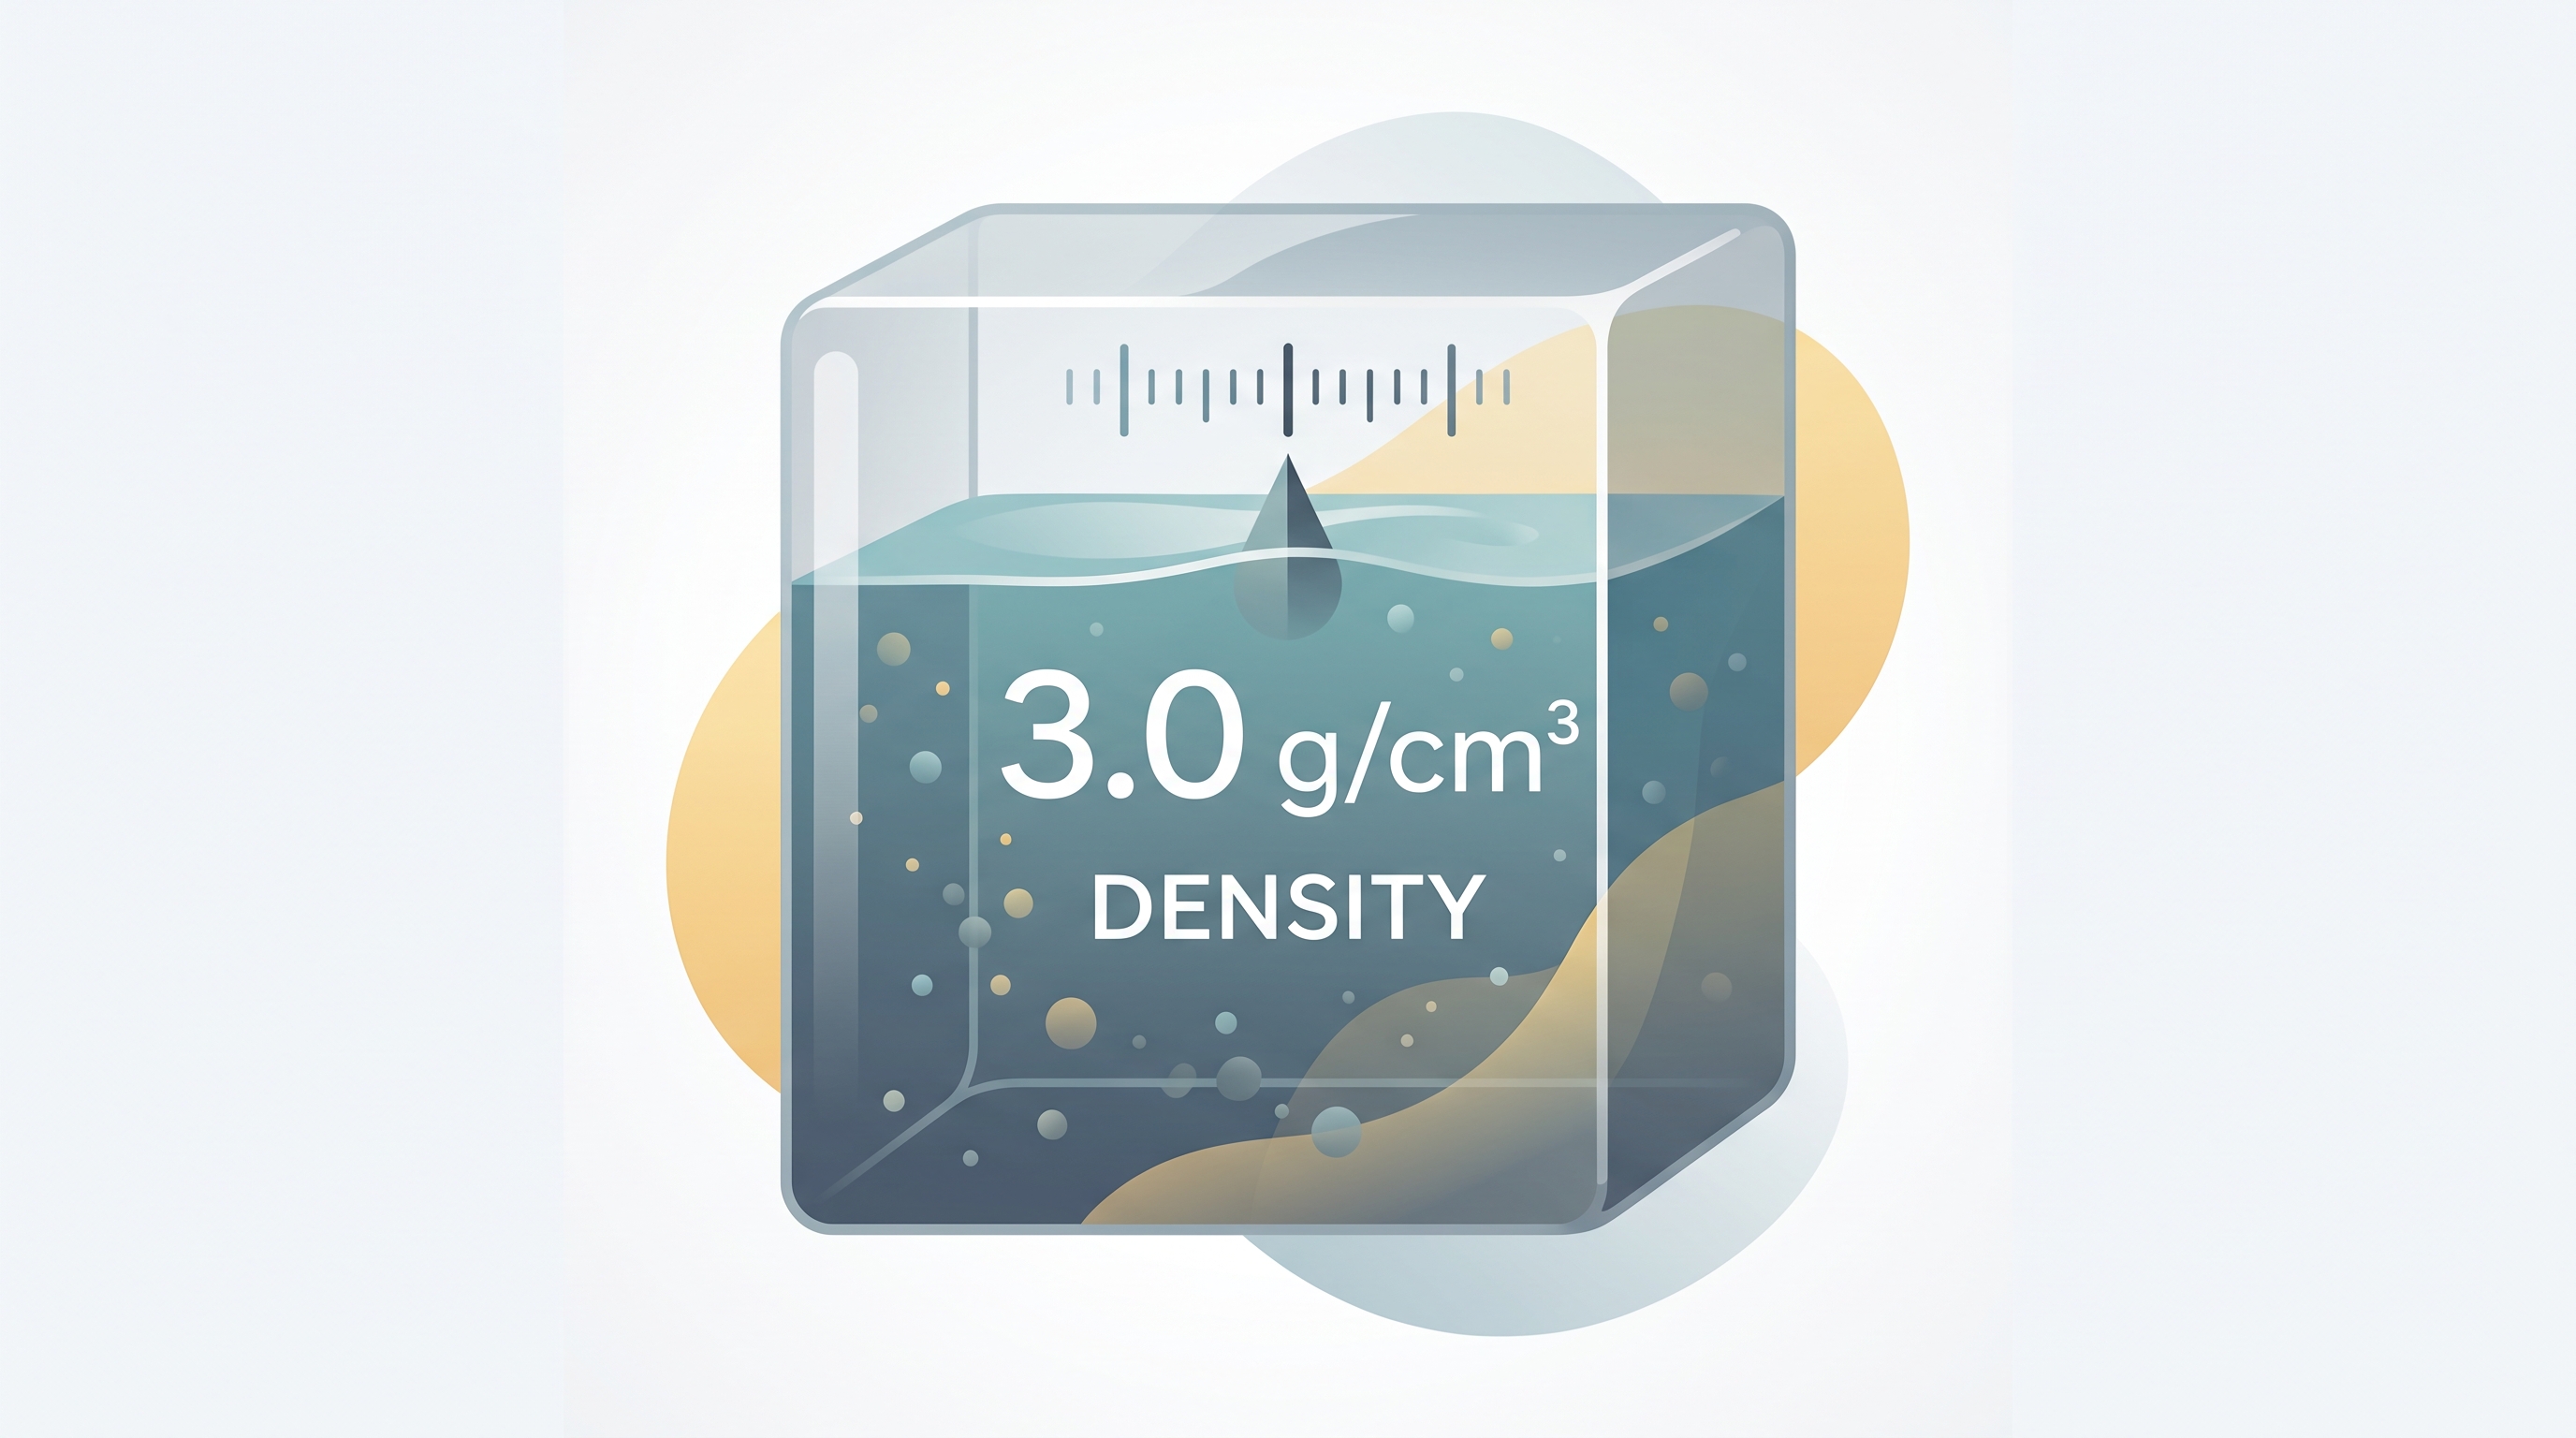
Answer: $\rho=3.0\ \text{g/cm}^3$; the mass-versus-volume slope would also be $3.0\ \text{g/cm}^3$. This density becomes essential when relating a fluid’s amount of matter to later fluid relationships such as pressure.
Source Materials
- Review the Exam Updates (.pdf)
- AP Physics 1: Algebra-Based Course and Exam Description
- AP Physics 1 Course Overview
- AP Physics 1 Course at a Glance
- AP Physics 1 Course at a Glance Poster
- Adopt AP Physics 1: Algebra-Based
- AP Physics 1: Algebra-Based
- AP Physics 1: Algebra-Based
- AP Physics 1 Past Exam Questions — AP Central
- Khan Academy — AP/College Physics 1
- AP Physics 1 — AP Students
- YouTube — Flipping Physics