From the free course AP Physics 1 on Lykke
1.3 Representing Motion
Key concepts: Representing physical situations with diagrams, tables, charts, and schematics · Creating qualitative sketches of graphs to show features of a model or behavior · Applying physical laws, definitions, theoretical relationships, and models to make claims · Simple harmonic motion of a mass-spring oscillator · Energy bar charts for a spring oscillator · Rolling without slipping · Rotational inertia of a uniform disk · Inelastic collision of a falling block with a moving cart · Pulley systems with a lightweight string · Interpreting motion through experimental setups and labeled force diagrams
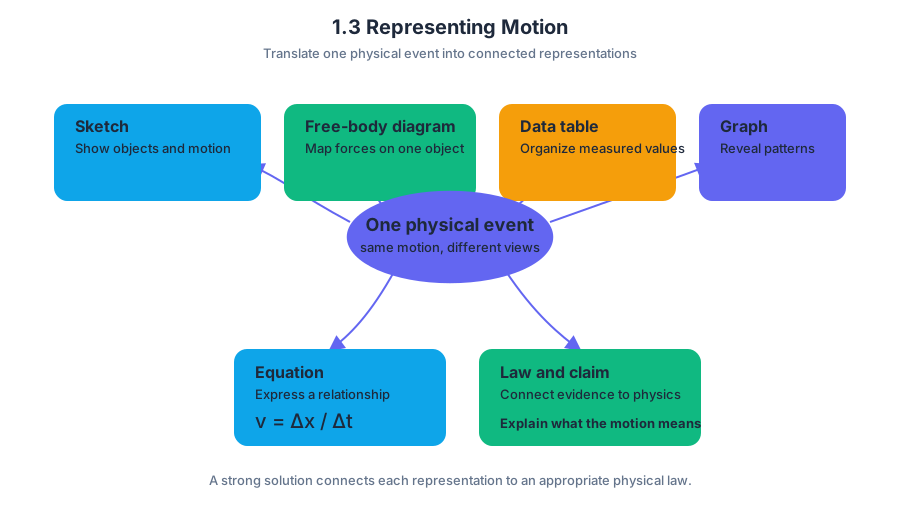
A motion problem becomes much easier when the physical situation is translated into several representations: a sketch of the objects, a free-body diagram, a data table, a graph, and an equation.
1.3 Representing Motion
A motion problem becomes much easier when the physical situation is translated into several representations: a sketch of the objects, a free-body diagram, a data table, a graph, and an equation. Each representation highlights a different feature of the same event.
Learning Objective 1.3.A: Represent the motion of an object using diagrams, graphs, charts, and mathematical representations.
The essential knowledge for this topic is commonly identified through the idea that physical situations can be represented in multiple forms. A strong solution does not merely draw or calculate; it connects the representation to an appropriate physical law and uses that law to support a claim.
From physical scene to physical model
Begin with a system sketch: identify the relevant objects, the surface or environment, the direction of motion, and important dimensions or angles. Then construct a free-body diagram, which shows only the chosen object and the external forces acting on it. The diagram should make directions explicit rather than relying on the reader to infer them.
For example, a disk rolls down an incline without slipping. Its rotational inertia is
$$ I_{\text{disk}}=\frac{1}{2}MR^2. $$
A useful representation includes the disk, the incline angle $\theta$, the radius $R$, the mass $M$, the direction down the ramp, the normal force, the gravitational force, and static friction $F_f$. The phrase without slipping is not decorative: it supplies the model relationship
$$ v=R\omega, $$
where $v$ is the center-of-mass speed and $\omega$ is the angular speed. Applying this relationship supports the claim that the disk has both translational and rotational motion.
Qualitative graphs show behavior
A qualitative graph shows important features—such as increasing, decreasing, constant, maximum, minimum, or changing slope—without requiring exact numerical values. For a spring oscillator, position varies periodically, velocity is greatest near equilibrium, and acceleration points toward equilibrium.
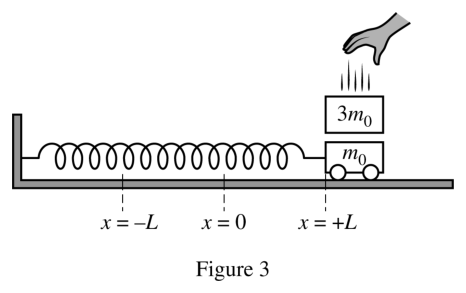
A horizontal mass-spring system consists of a mass $m$ attached to a wall by a spring. If the mass is displaced to $x=-x_0$ and released, the spring pulls it toward the equilibrium position $x=0$. The motion is simple harmonic motion, a special type of periodic motion in which the restoring force is proportional to displacement and directed toward equilibrium:
$$ F_x=-kx. $$
The minus sign is essential. If $x$ is positive, the force is negative; if $x$ is negative, the force is positive. A graph of $F_x$ versus $x$ is therefore a straight line through the origin with slope $-k$.
Energy bar charts: a visual conservation law
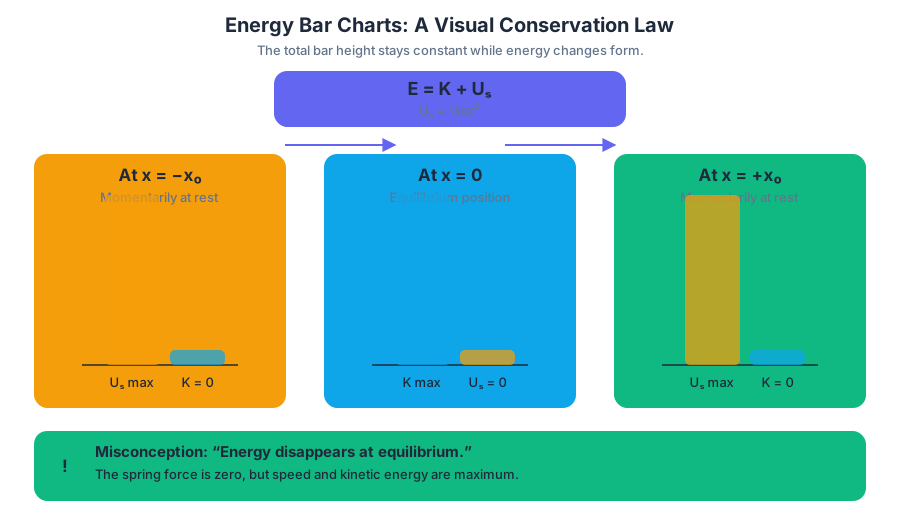
An energy bar chart represents how the system’s energy is distributed at selected moments. For an ideal spring oscillator, the total mechanical energy remains constant:
$$ E=K+U_s, \qquad U_s=\frac{1}{2}kx^2. $$
At $x=-x_0$, the mass is momentarily at rest, so the chart contains maximum spring potential energy and zero kinetic energy. At $x=0$, the spring potential energy is zero relative to that equilibrium reference, and kinetic energy is maximum. The total height of the bars must remain unchanged unless energy enters or leaves the chosen system.
Misconception check — “The energy disappears at equilibrium.” At equilibrium, the spring force is zero, but the mass is moving fastest. Energy has changed form from spring potential energy to kinetic energy; it has not vanished.
Linking representations in a collision
Suppose a cart moves horizontally at constant speed and a block is dropped vertically onto it from rest. The block sticks to the cart. A before-and-after sketch should show the cart’s initial horizontal velocity, the block’s zero initial horizontal velocity, and the shared final velocity.
Because there is no horizontal sliding after impact, the cart and block move together horizontally. For the cart-block system, horizontal momentum is conserved if the external horizontal impulse is negligible:
$$ m_c v_{c,i}+m_b v_{b,i}
(m_c+m_b)v_f. $$
Since the block is dropped from rest, $v_{b,i}=0$, giving
$$ v_f=\frac{m_c v_{c,i}}{m_c+m_b}. $$
Misconception check — “Sticking collisions conserve kinetic energy.” They generally do not. Momentum can be conserved while kinetic energy decreases because energy is transferred to deformation, sound, and thermal energy.
A pulley representation
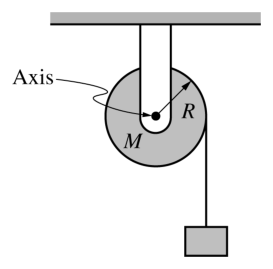
A lightweight string wrapped around a pulley and connected to a hanging block provides another translation between representations. The block’s downward displacement corresponds to the pulley’s angular displacement. If the string remains taut and does not slip,
$$ v=R\omega, \qquad a=R\alpha. $$
A complete diagram identifies the block, pulley, string, directions of motion, tension, gravity, and axle forces. The correct rotational model then connects torque and angular acceleration rather than treating the pulley as a point mass.
AP skills used in this topic
The principal science practices are:
- 1.A — Create diagrams, tables, charts, or schematics to represent physical situations.
- 1.C — Create qualitative sketches of graphs that represent features of a model or the behavior of a physical system.
- 2.A — Derive a symbolic expression from known quantities by selecting and following a logical mathematical pathway.
- 2.B — Calculate or estimate an unknown quantity with units using a logical computational pathway.
- 2.D — Predict new values or factors of change of physical quantities using functional dependence between variables.
- 3.B — Apply an appropriate law, definition, theoretical relationship, or model to make a claim.
- 3.C — Justify or support a claim using evidence from experimental data, physical representations, or physical principles or laws.
Retrieval check
A disk rolls down an incline without slipping. Which representation must show rotational inertia, and which relationship connects its linear and angular motion? Why can a spring oscillator have zero spring force while possessing maximum kinetic energy?

Source Materials
- Review the Exam Updates (.pdf)
- AP Physics 1: Algebra-Based Course and Exam Description
- AP Physics 1 Course Overview
- AP Physics 1 Course at a Glance
- AP Physics 1 Course at a Glance Poster
- Adopt AP Physics 1: Algebra-Based
- AP Physics 1: Algebra-Based
- AP Physics 1: Algebra-Based
- When the cart is at +L and momentarily at rest, a block is dropped onto the cart, as shown in Figure 3. The block
- A block of unknown mass is attached to a long, lightweight string that is wrapped several turns around a pulley
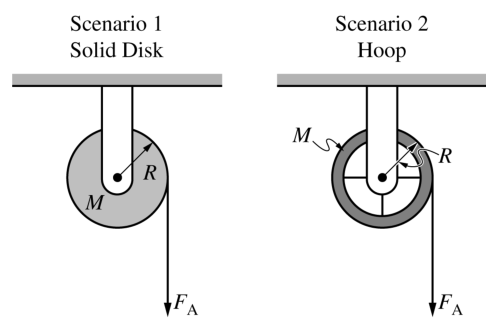
- Scenarios 1 and 2 show two different pulleys. In Scenario 1, the pulley is the same solid disk referenced in part (a). In Scenario 2, the pulley is a hoop that has the same mass M and radius R as the
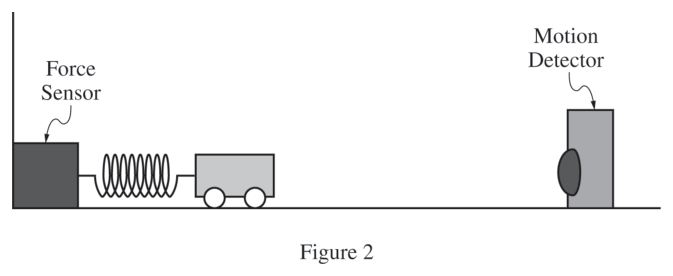
- In a different experiment, the student attaches one end of a spring to a force sensor that is attached to a wall. The other end of the spring is attached to a cart with mass m 0.25 kg = . The student