From the free course AP Psychology on Lykke
Science Practice 3: Data Interpretation (Skills 3.A-3.C)
A psychology data display is not merely a collection of numbers: it is evidence about behavior and mental processes. Your job is to move from what the display shows to which psychological concept it represents, what the statistics mean, and how strongly the evidence supports a conclusion.
Science Practice 3: Data Interpretation (Skills 3.A–3.C)
A psychology data display is not merely a collection of numbers: it is evidence about behavior and mental processes. Your job is to move from what the display shows to which psychological concept it represents, what the statistics mean, and how strongly the evidence supports a conclusion.
Science Practice 3: Data Interpretation means using tables, graphs, charts, figures, diagrams, and qualitative descriptions to identify psychological concepts, calculate or interpret descriptive statistics, and evaluate inferential evidence.
These skills are assessed alongside psychological content in both exam sections. They are reasoning tools: you may interpret a graph about reinforcement, a table about memory, a scatterplot about stress and sleep, or a qualitative description of participants’ experiences.
3.A — Identify psychology-related concepts represented in data
Skill 3.A: Identify psychology-related concepts represented in descriptions or representations of data. Begin by asking: What psychological process could have produced this pattern? Then inspect the display’s axes, labels, groups, timing, and direction of change.
For example, an original graph shows the number of button presses made by rats across four reinforcement schedules. One line rises quickly and steadily; another shows brief pauses after reinforcement followed by bursts of responding. The data may represent operant conditioning, but the exact schedule depends on the pattern: a variable-ratio schedule typically produces a high, steady response rate, whereas a fixed-ratio schedule often produces a post-reinforcement pause.
Do not identify a concept from a familiar keyword alone. If the horizontal axis shows “trials” and the vertical axis shows “fear response,” a decline after repeated presentations of a stimulus without the expected outcome may indicate extinction. If the response later returns after a rest period, the more precise concept is spontaneous recovery.
3.B — Calculate and interpret statistical measures
Skill 3.B: Calculate and interpret statistical measures. Descriptive statistics summarize a set of observations. Measures of central tendency locate a typical score; measures of variation show how spread out the scores are.
Consider this original, unofficial data set representing reaction-time scores in milliseconds:
$$2,\ 4,\ 4,\ 6,\ 9$$
The mean is the arithmetic average:
$$\bar{x}=\frac{2+4+4+6+9}{5}=5$$
The median is the middle score after ordering the data, so the median is $4$. The mode, or most frequent score, is also $4$. The range is the highest score minus the lowest score:
$$9-2=7$$
Using the population standard-deviation calculation for this instructional example, the deviations from the mean are $-3,-1,-1,1,4$. Squaring and averaging them gives:
$$\sigma^2=\frac{9+1+1+1+16}{5}=5.6$$
Therefore:
$$\sigma=\sqrt{5.6}\approx2.37$$
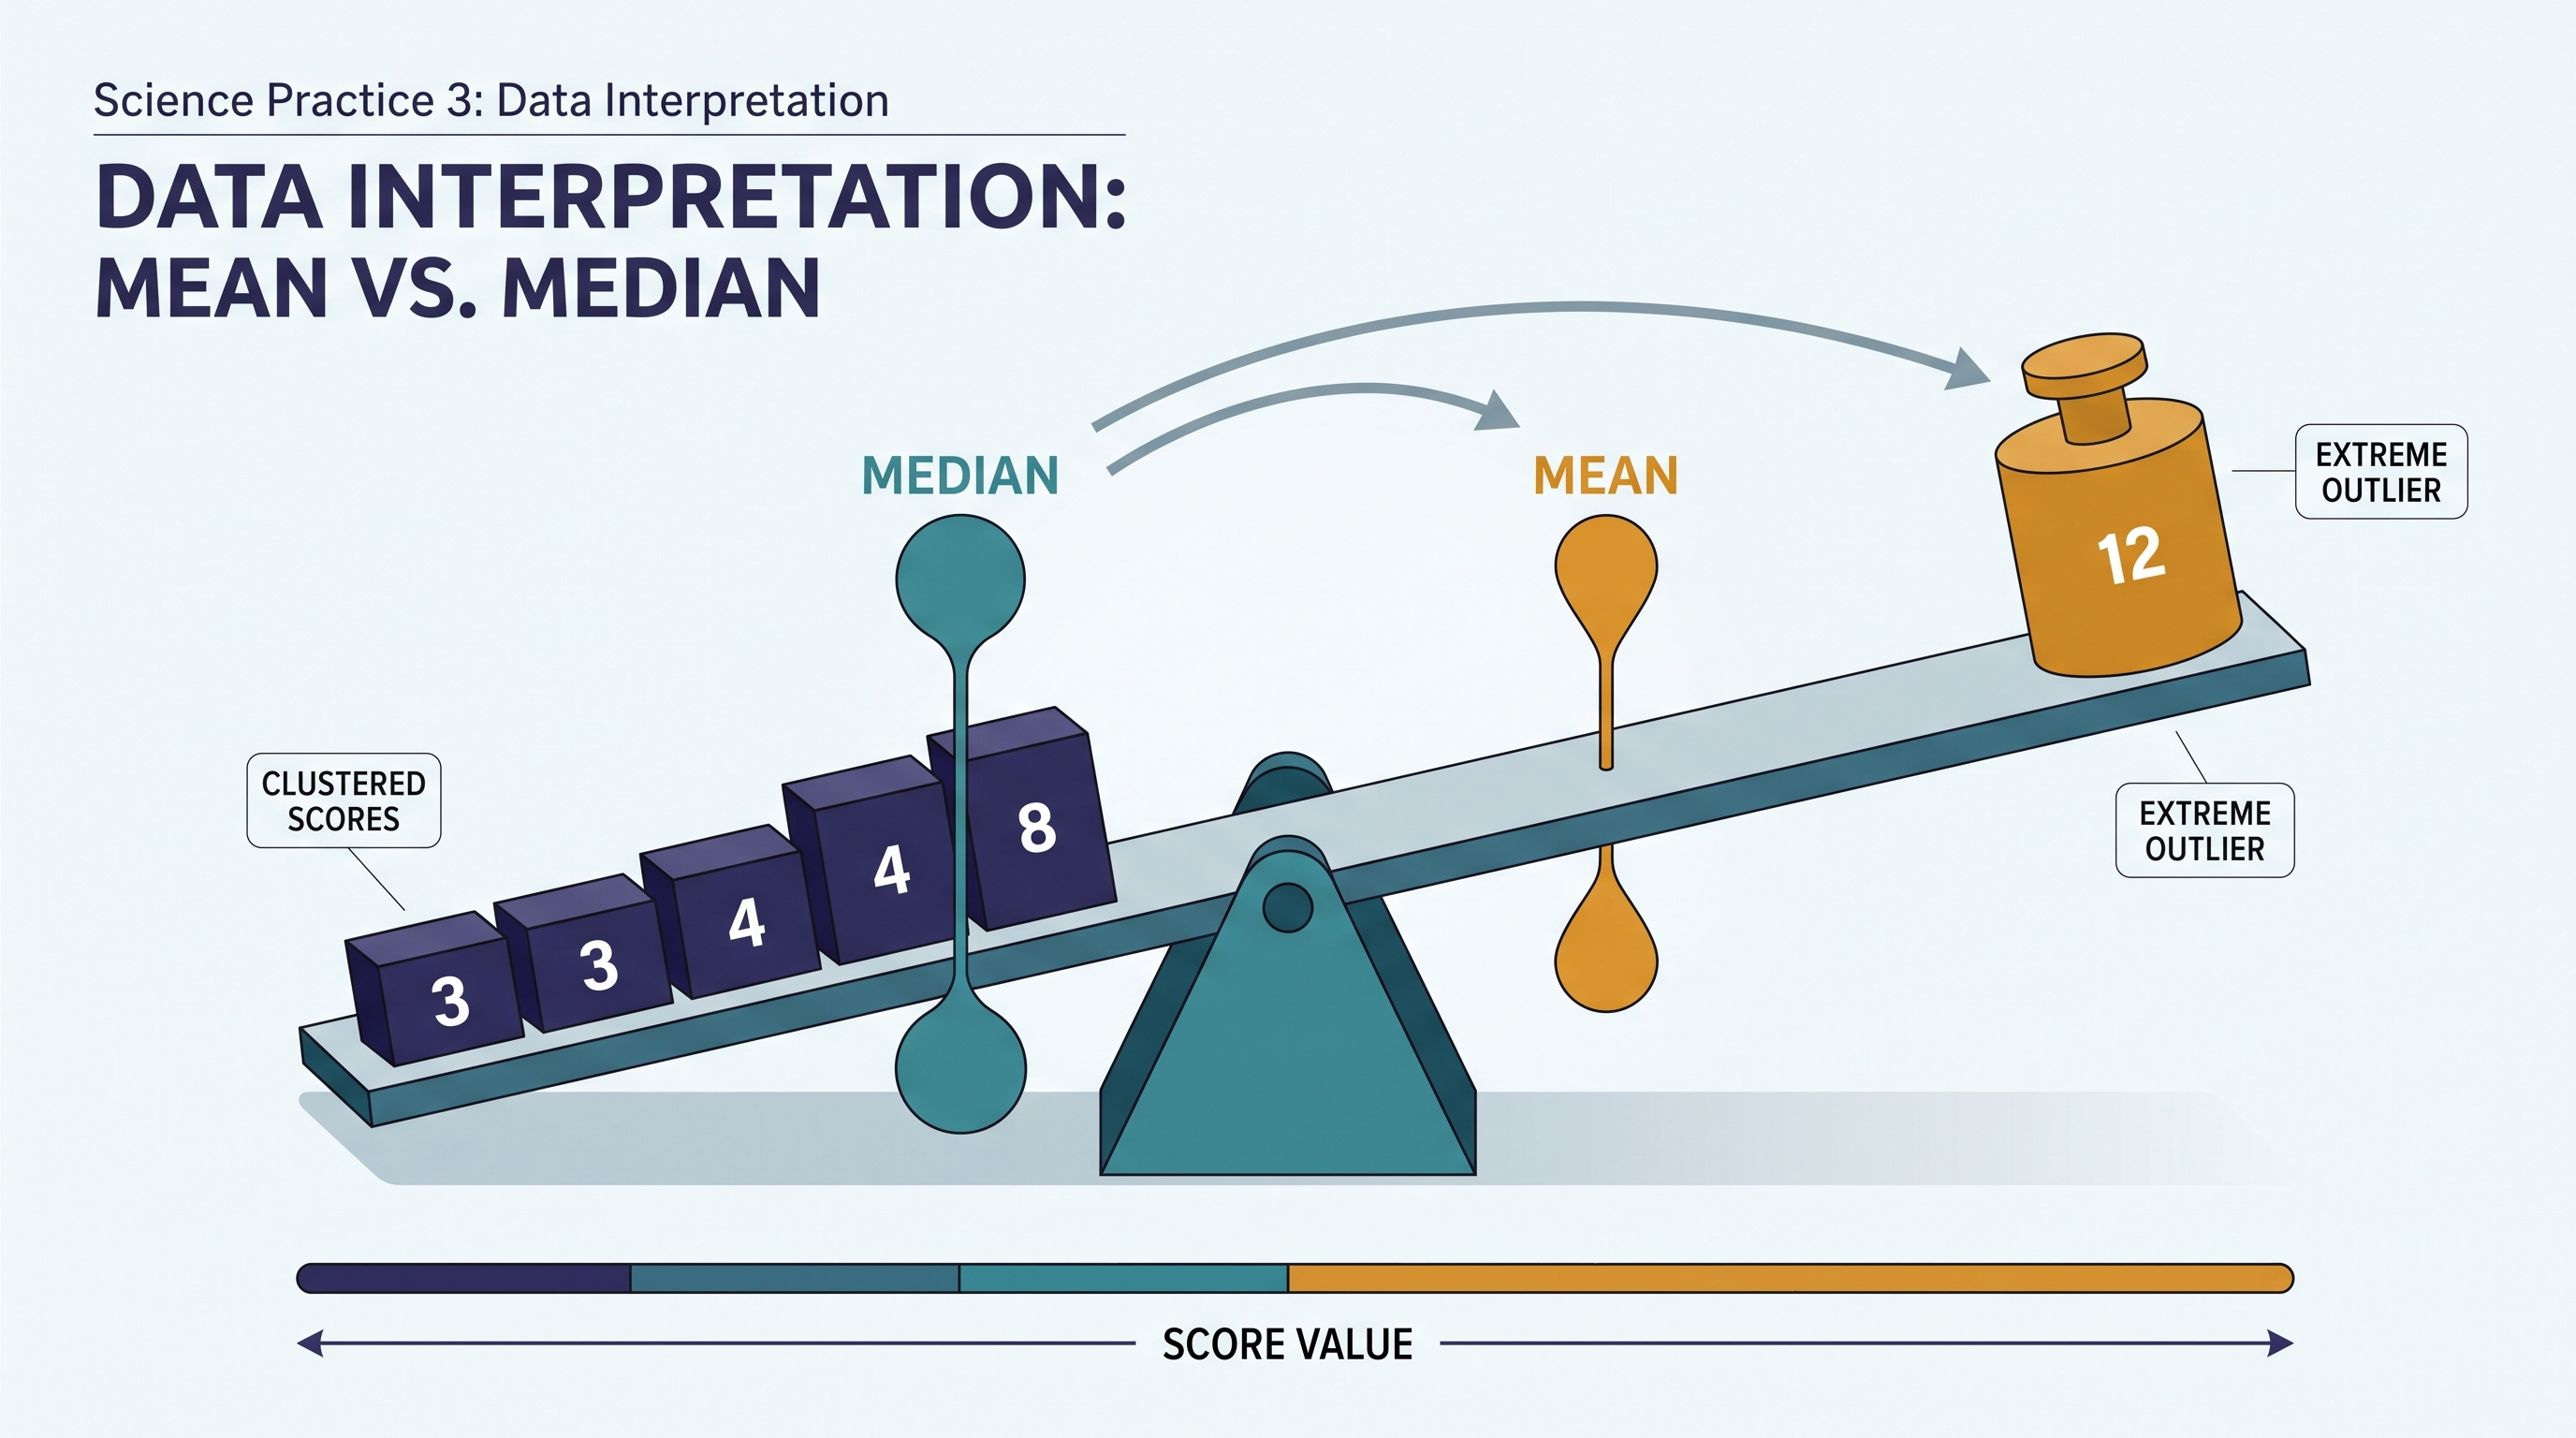
Interpretation matters more than producing a number. The mean reaction-time score is $5$ units, but scores vary by approximately $2.37$ units around that mean. Because the score $9$ is relatively high, the mean is pulled upward; the median of $4$ may better represent the typical score.
A common misconception is that the mean is always the “best” average. It is not. A skewed distribution or an extreme outlier can make the median more representative. Likewise, a small standard deviation does not mean scores are “better”; it means they are more tightly clustered.
3.C — Interpret quantitative or qualitative inferential data
Skill 3.C: Interpret quantitative or qualitative inferential data from a given table, graph, chart, figure, or diagram. Inferential interpretation asks what the observed pattern suggests beyond the individual scores. You may need to describe a trend, interpret a relationship, or judge whether a result is statistically significant.
A correlation coefficient, written as $r$, describes the direction and strength of a linear relationship between two variables. Its values range from $-1.00$ to $+1.00$. A value of $r=+0.80$ indicates a strong positive relationship: as one variable increases, the other tends to increase. A value of $r=-0.80$ indicates a strong negative relationship: as one increases, the other tends to decrease. A value near $0$ indicates little linear relationship.
Correlation does not establish causation. If students who sleep more report lower stress, the relationship could reflect many explanations: sleep may reduce stress, lower stress may improve sleep, or a third variable—such as workload—may affect both.
A percentile rank tells you the percentage of scores at or below a particular score. A score at the $75$th percentile is higher than or equal to approximately $75%$ of the comparison group; it does not mean the person answered $75%$ of questions correctly.
A stated $p$-value estimates how unlikely the observed result would be if there were no real effect or relationship in the population. If a study reports $p<.05$, the result is commonly described as statistically significant under a conventional criterion. Statistical significance does not automatically mean the effect is large, important, or causal.
Worked interpretation: from display to conclusion
An original study reports that students assigned to a brief breathing exercise averaged $18$ stress points, while a comparison group averaged $24$. The researchers report $r=-.46$ between weekly sleep hours and stress scores, with $p=.02$.
A strong response separates the claims. The breathing group had a lower mean stress score, so the groups differed descriptively. The correlation indicates a moderate negative relationship between sleep and stress: students who slept more tended to report less stress. Because $p=.02$ is below $.05$, the reported relationship would commonly be considered statistically significant. However, the correlation alone does not prove that additional sleep caused lower stress.
Misconception check
Error: “A statistically significant result proves the hypothesis.”
Correction: Statistical significance indicates that the observed result would be relatively unlikely under a null explanation. You must still examine the direction, strength, design, measurement, possible confounds, and practical importance of the finding.
Retrieval check
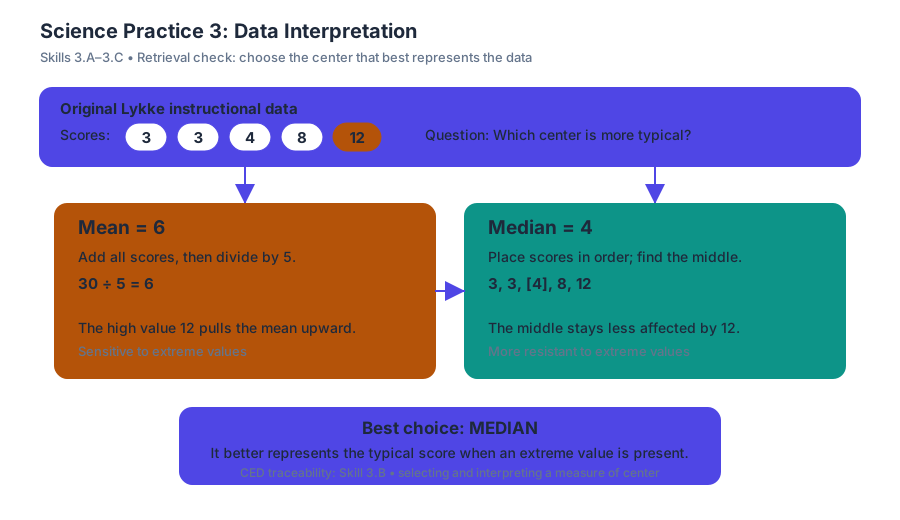
A data set contains the scores $3, 3, 4, 8,$ and $12$. Which measure of central tendency is likely to represent the typical score better: the mean or the median, and why?
Answer: The median is likely better because the high score of $12$ pulls the mean upward, while the median remains less affected by the extreme value. This applies 3.B by selecting and interpreting the measure of center that best represents the data.
Source Materials
- Ap Psychology Course And Exam Description
- Ap Psychology Course At A Glance
- AP Psychology CED: Student Responses and Scoring Commentary
- AP Psychology Exam Questions
- Free-Response Questions
- Free-Response Questions - Set 1
- Free-Response Questions - Set 2
- Figure — Score Distributions (p. 1)
- Part A Dr. Dawson is a psychologist who believes that students who read motivational