From the free course AP Microeconomics on Lykke
6.5 Inequality** `[POL]`
Key concepts: Inequality
Economic inequality is the unequal distribution of income or wealth among individuals or households. A society may produce substantial total income while distributing that income very unevenly, so economists need measures that describe how much inequality exists rather than relying only on average income.
6.5 Inequality** [POL]
Economic inequality is the unequal distribution of income or wealth among individuals or households. A society may produce substantial total income while distributing that income very unevenly, so economists need measures that describe how much inequality exists rather than relying only on average income.
Investigative question: How can we represent the distribution of income, compare inequality across economies, and evaluate policies intended to reduce it?
Measuring inequality with the Lorenz curve
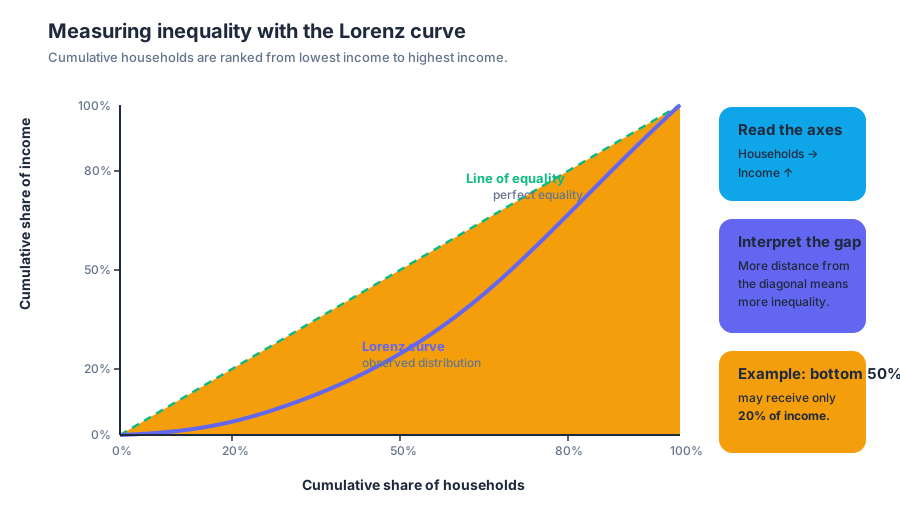
The Lorenz curve shows the cumulative share of total income received by the cumulative share of households, ranked from the lowest-income household to the highest-income household. The horizontal axis measures the cumulative percentage of households; the vertical axis measures the cumulative percentage of income.
A diagonal line of equality represents a perfectly equal distribution. If the bottom $20%$ of households received $20%$ of income, the bottom $50%$ received $50%$, and so on, the Lorenz curve would lie on that diagonal. In reality, the Lorenz curve generally lies below it: the bottom $50%$ of households might receive only $20%$ of income.
Worked interpretation
Suppose an economy’s Lorenz curve passes through these points:
| Cumulative households | Cumulative income |
|---|---|
| $20%$ | $5%$ |
| $40%$ | $15%$ |
| $60%$ | $30%$ |
| $80%$ | $55%$ |
| $100%$ | $100%$ |
The point $\left(60%,30%\right)$ means that the lowest-income $60%$ of households receive $30%$ of total income. It does not mean that the average household in that group earns $30%$ of the average household’s income. The curve describes cumulative shares, not individual earnings.
The Gini coefficient
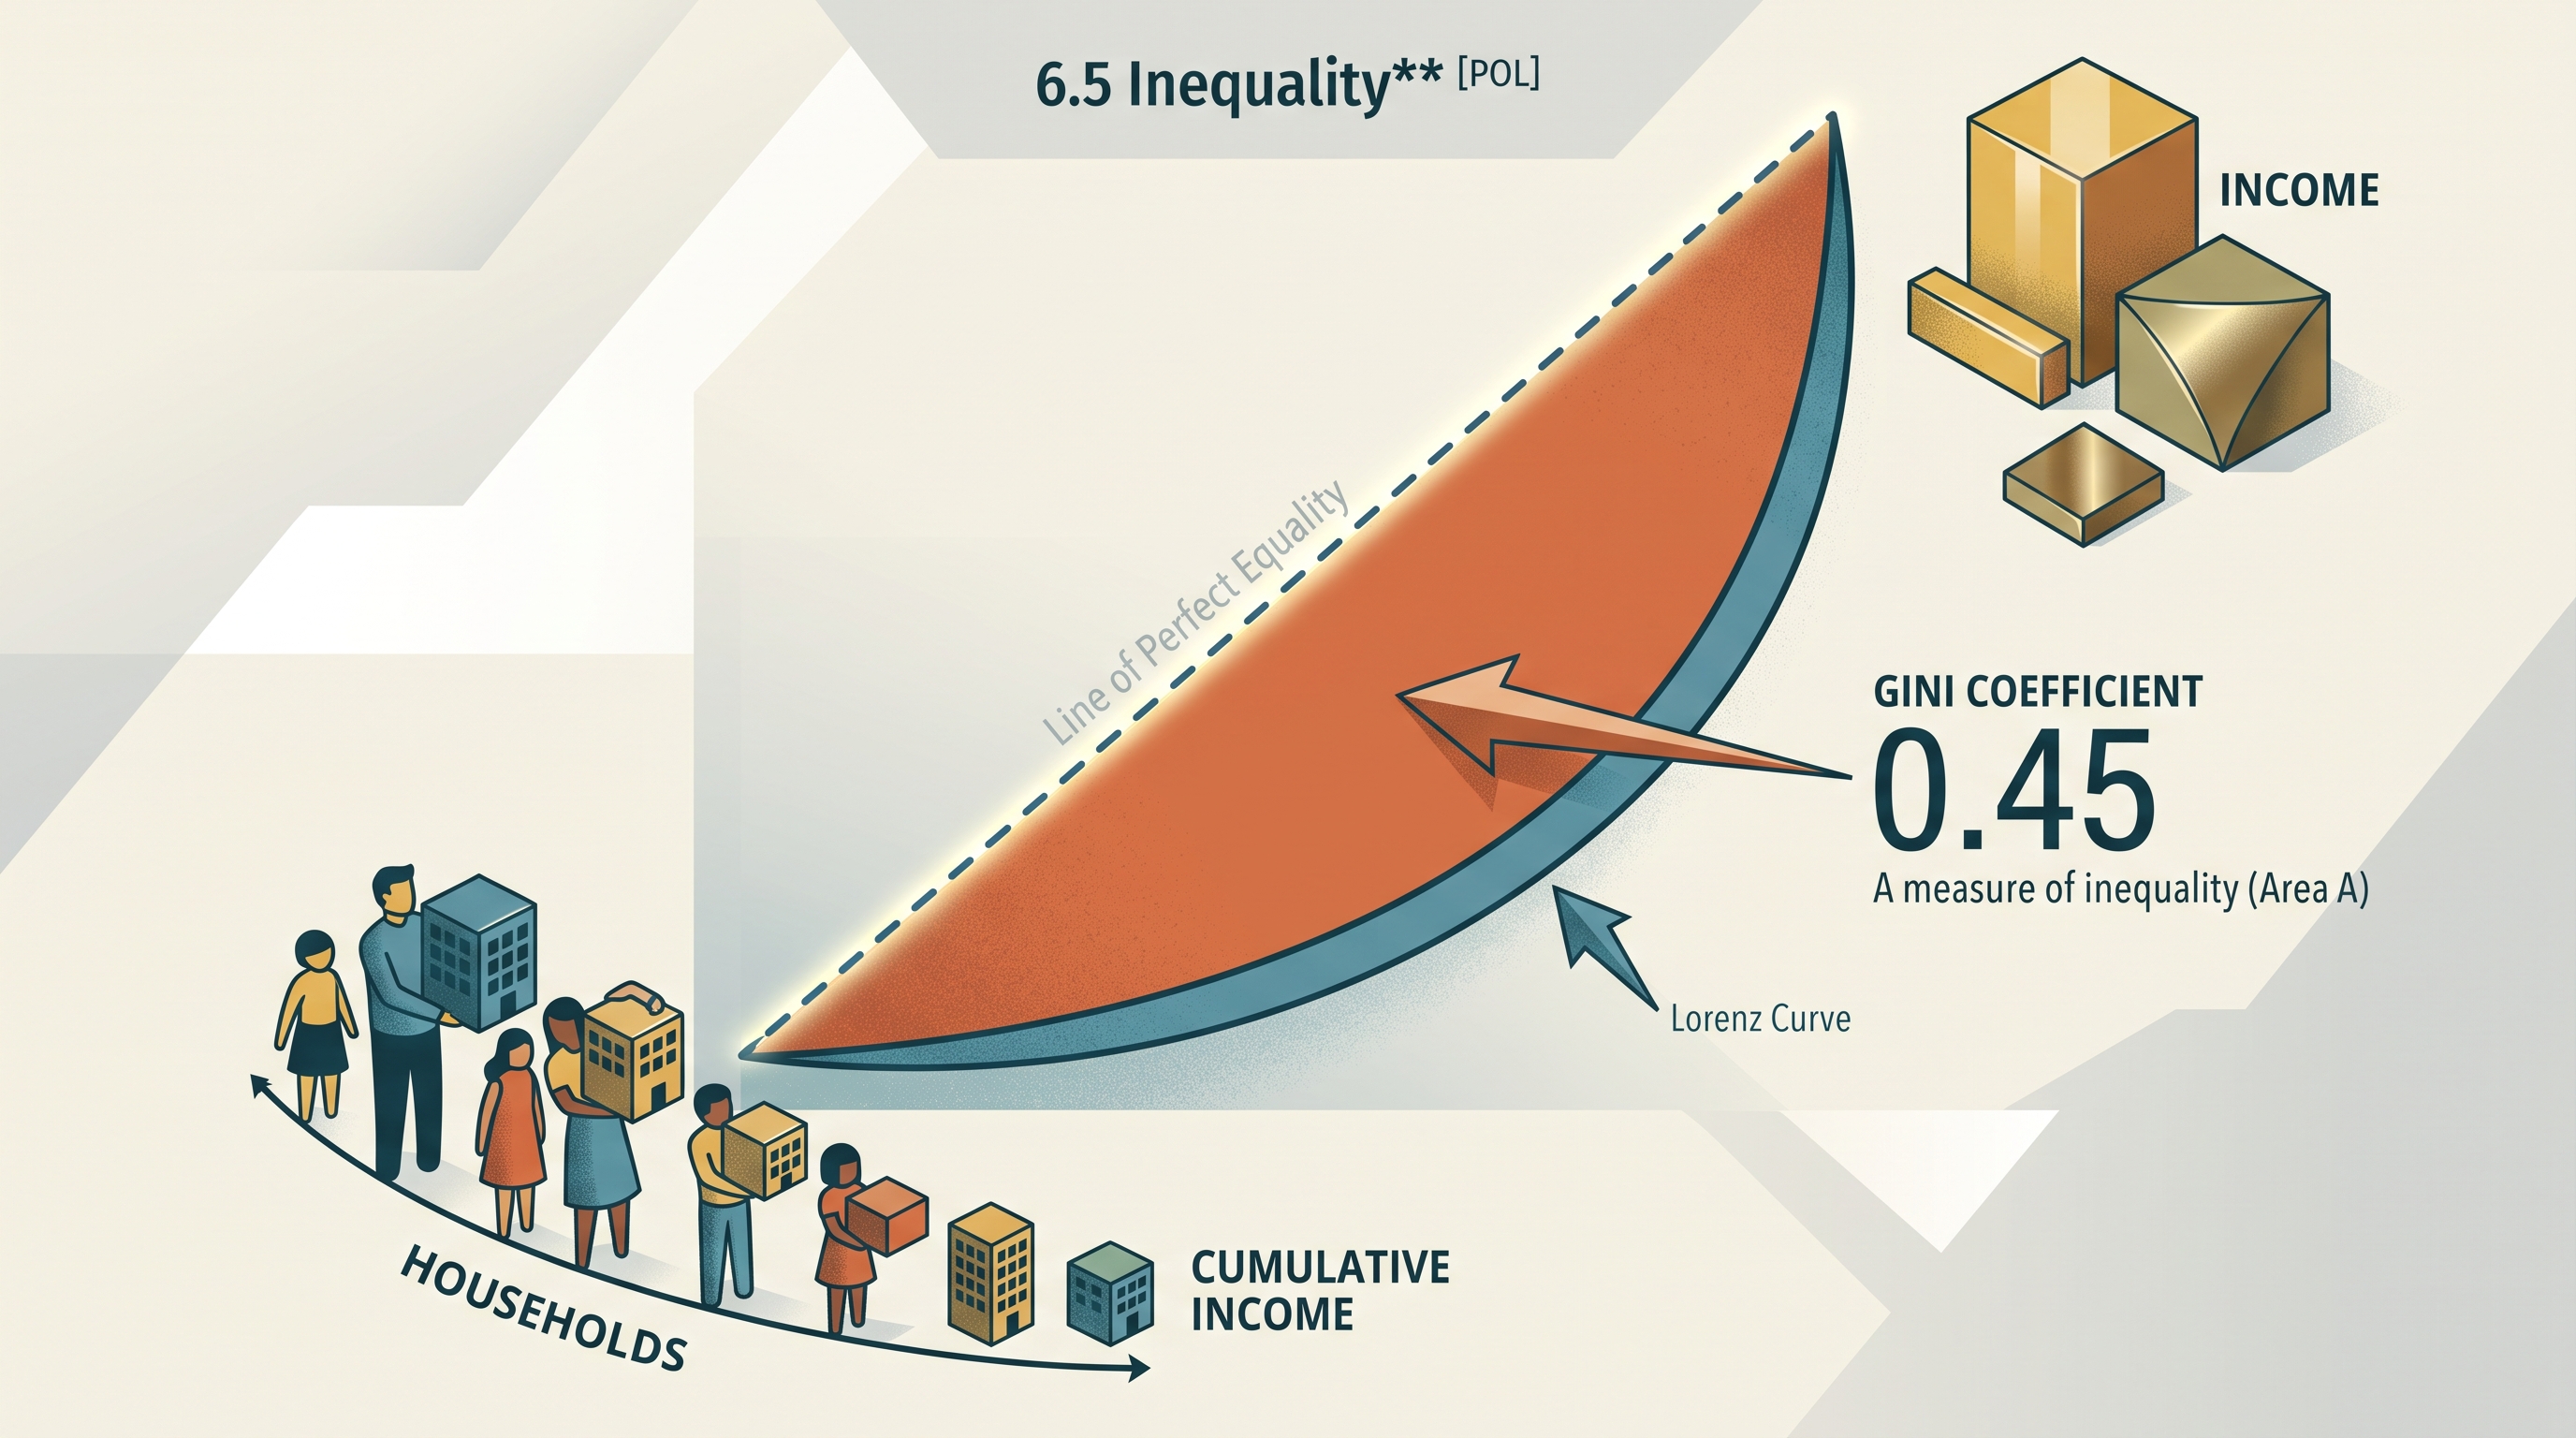
The Gini coefficient is a numerical measure of income inequality. It compares the area between the line of equality and the Lorenz curve with the entire area beneath the line of equality.
$$ \text{Gini coefficient}
\frac{\text{area between line of equality and Lorenz curve}} {\text{area beneath line of equality}} $$
A Gini coefficient of $0$ represents perfect equality. A coefficient closer to $1$ represents greater inequality. Therefore, if Country A has a Gini coefficient of $0.30$ and Country B has a Gini coefficient of $0.45$, Country B has the more unequal income distribution.
Misconception check — “A higher Gini coefficient means higher income.”
The Gini coefficient measures the distribution of income, not the economy’s income level. A high-income country can have a relatively unequal distribution, while a lower-income country can have a relatively equal distribution. The coefficient also does not identify who receives the income or explain why inequality exists.
Policies that affect inequality
Governments can alter the distribution of after-tax income through progressive taxation and transfer payments. A progressive tax takes a larger percentage of income from higher-income households than from lower-income households. Transfer payments, such as income assistance, provide resources to eligible households without requiring a current payment for a good or service.
Policy chain
$$ \text{progressive taxes and transfers} \rightarrow \text{less unequal disposable income} \rightarrow \text{possible tradeoffs} $$
Redistribution can reduce inequality and help households obtain necessities. However, taxes may change incentives to work, save, invest, or start a business, while transfer programs can involve administrative costs and eligibility tradeoffs. The economic effect depends on the policy’s design, not merely on its stated goal.
For example, if a government raises taxes on high-income households and uses the revenue for targeted transfers, the lowest-income households may receive a larger share of disposable income. On a Lorenz diagram, the resulting curve would move closer to the line of equality, and the Gini coefficient would generally fall.
AP reasoning in this topic
Skill Category 1: Principles and Models — Skill 1.A, “Define economic principles and models.” Define income inequality, the Lorenz curve, the line of equality, and the Gini coefficient precisely before interpreting a graph.
Skill Category 2: Interpretation — Skill 2.A, “Explain economic concepts, principles, and models.” Translate a point such as $\left(40%,15%\right)$ into a complete verbal statement about cumulative households and cumulative income.
Skill Category 3: Manipulation — Skill 3.A, “Determine the effects of economic changes.” Predict how progressive taxation or transfer payments affect disposable-income inequality, the Lorenz curve, and the Gini coefficient.
Skill Category 4: Graphing and Visuals — Skill 4.A, “Create graphs and visual representations.” Correctly label cumulative households, cumulative income, the line of equality, and the Lorenz curve; then use the graph to compare distributions.
Retrieval check: An economy’s Gini coefficient rises from $0.30$ to $0.45$. Has income inequality increased or decreased? What would you expect to happen to its Lorenz curve relative to the line of equality?
Answer: Inequality has increased. The Lorenz curve would lie farther below the line of equality, indicating that lower-income households receive a smaller cumulative share of total income.
Source Materials
- AP Microeconomics Course and Exam Description
- AP Microeconomics Course and Exam Description Clarifications and Corrections
- AP Microeconomics Course Overview
- AP Microeconomics Course at a Glance
- AP Microeconomics Course at a Glance Poster
- AP Microeconomics
- AP Microeconomics
- AP Microeconomics Sample Syllabus 1