From the free course AP Microeconomics on Lykke
2.8 The Effects of Government Intervention in Markets** `[POL]`
Key concepts: Government intervention in markets · Taxes and subsidies · Incentives and shifts in supply and demand · Effects on price and consumer surplus · Total economic surplus · Positive and negative externalities · Deadweight loss · Environmental regulation and public provision · Property rights · Monopsonistic labor markets
A government intervention changes the incentives, prices, quantities, or rules that guide buyers and sellers. A per-unit tax makes each transaction more costly; a per-unit subsidy makes each transaction more rewarding.
2.8 The Effects of Government Intervention in Markets** [POL]
A government intervention changes the incentives, prices, quantities, or rules that guide buyers and sellers. A per-unit tax makes each transaction more costly; a per-unit subsidy makes each transaction more rewarding. The central question is not merely whether a policy changes equilibrium, but whether it moves production toward the allocatively efficient quantity—the quantity that maximizes total economic surplus.
Taxes and subsidies change incentives
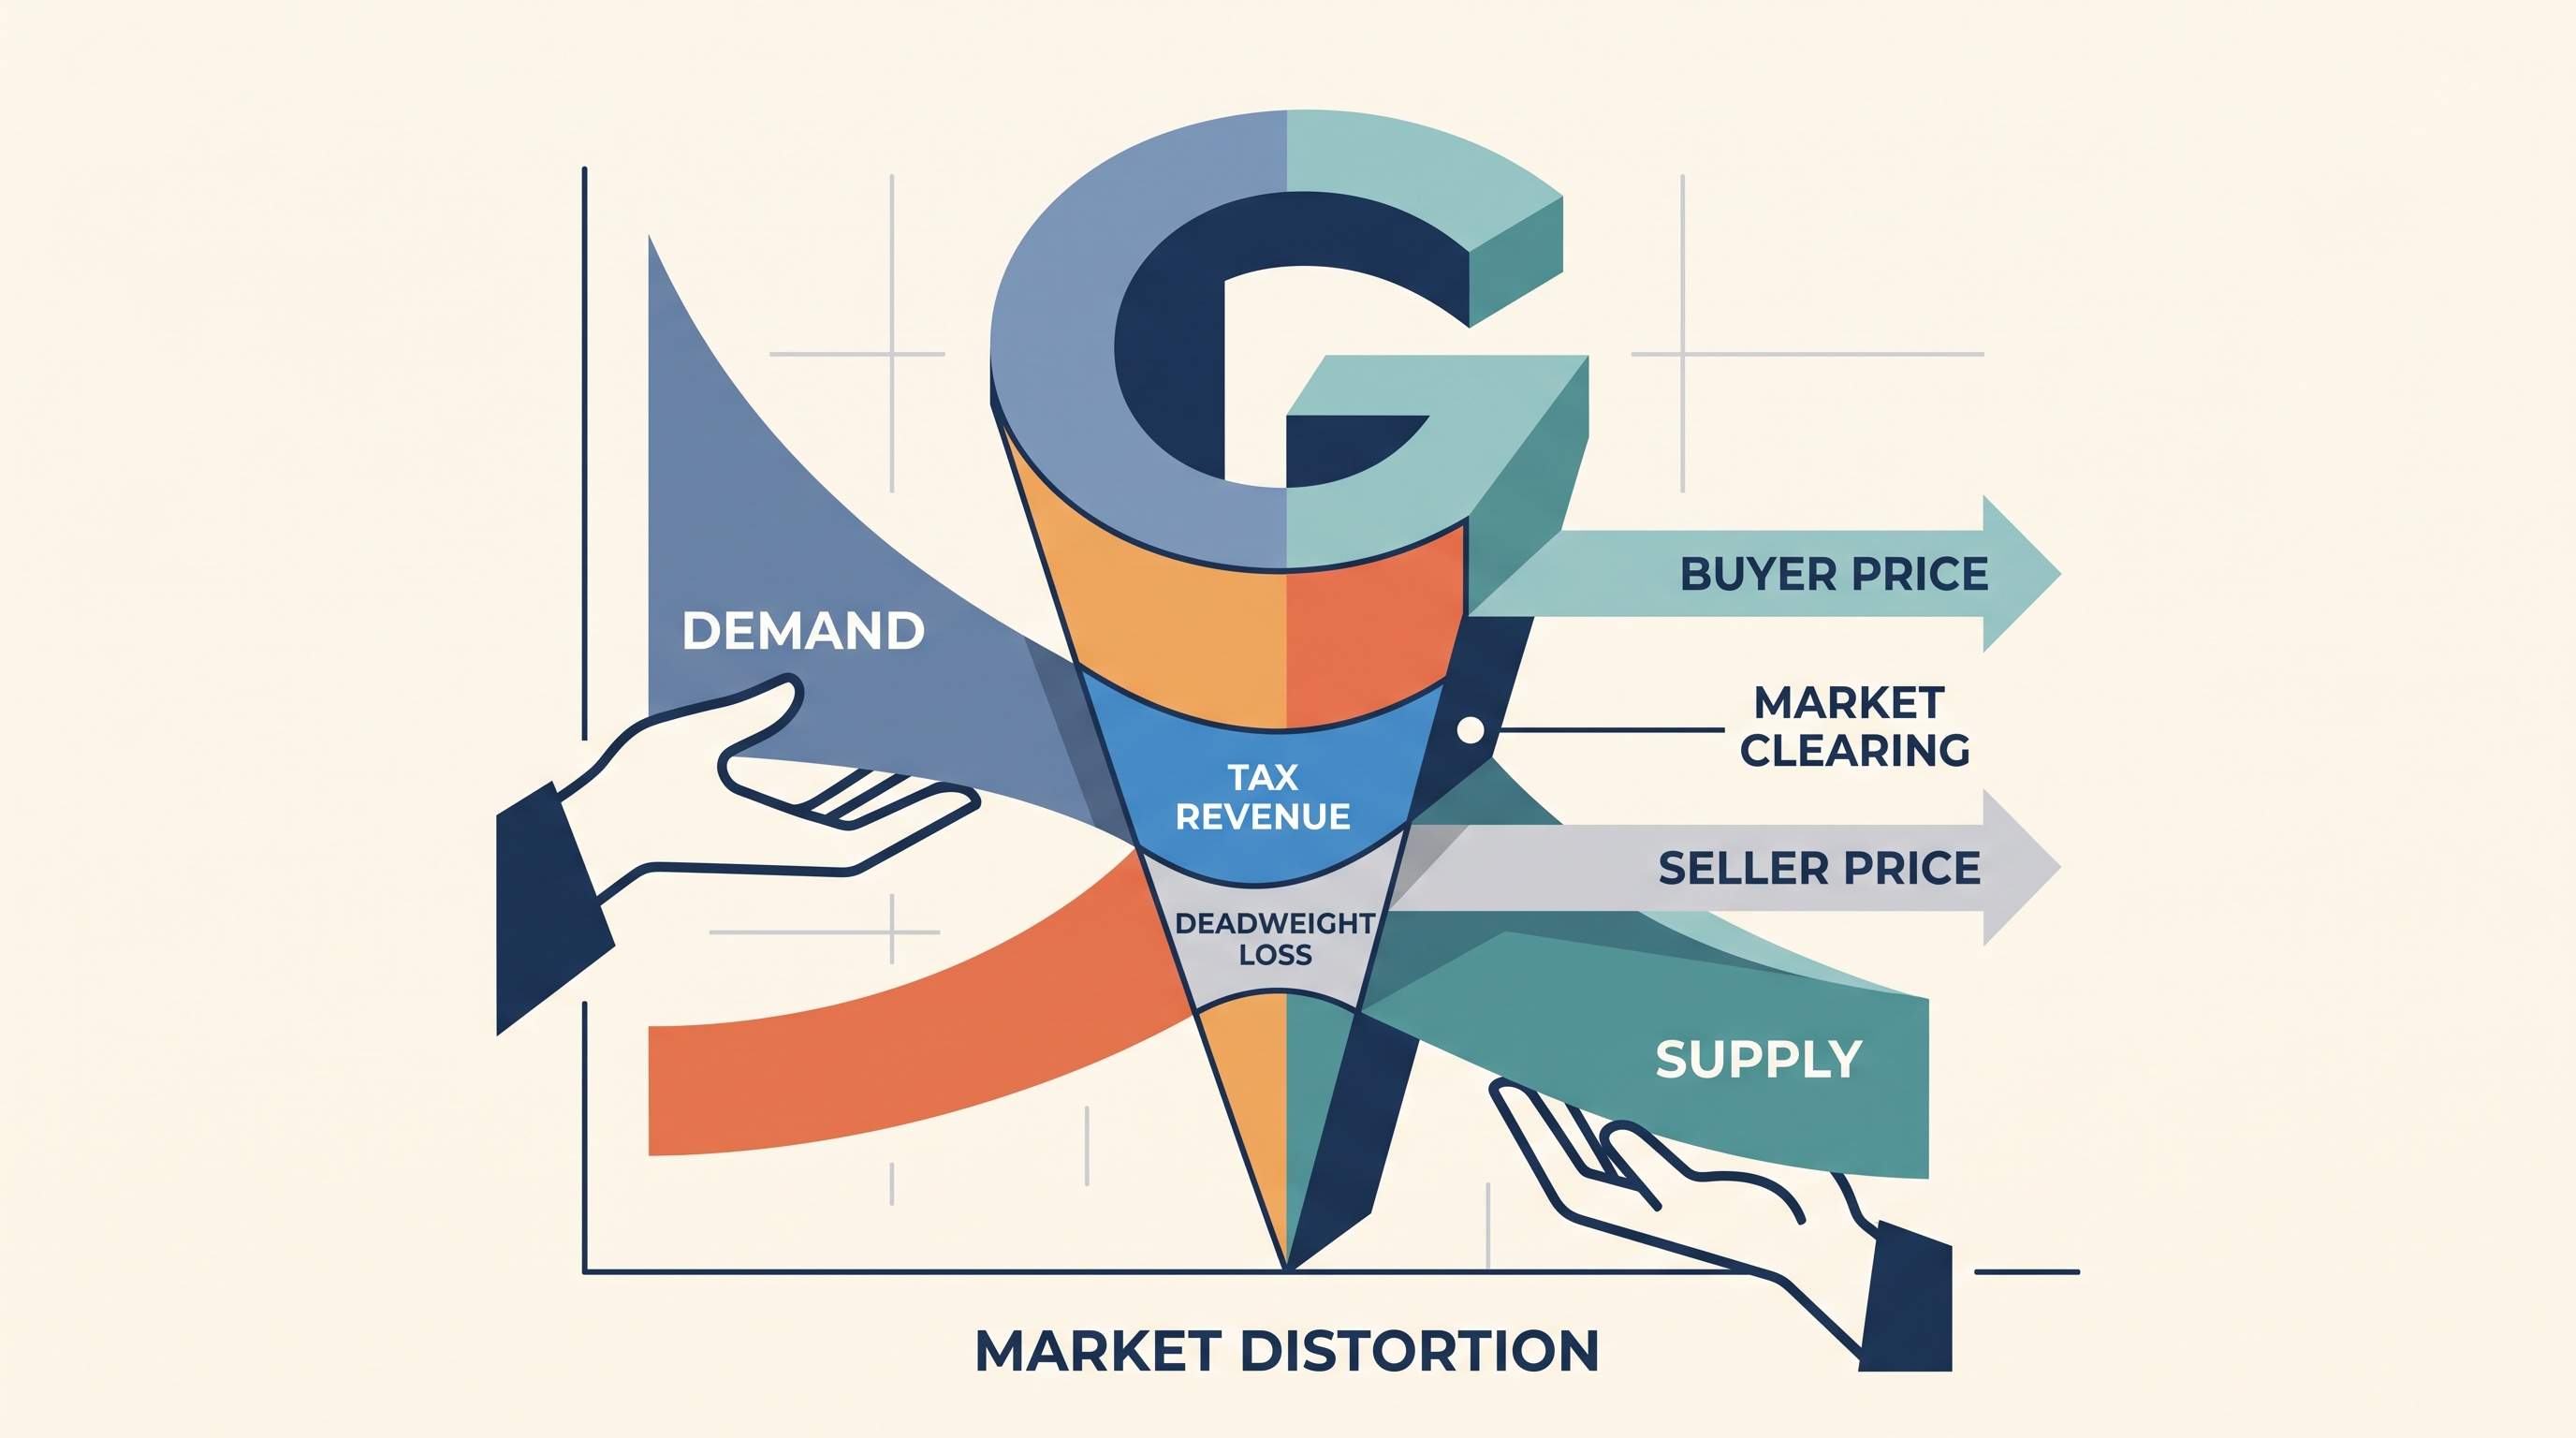
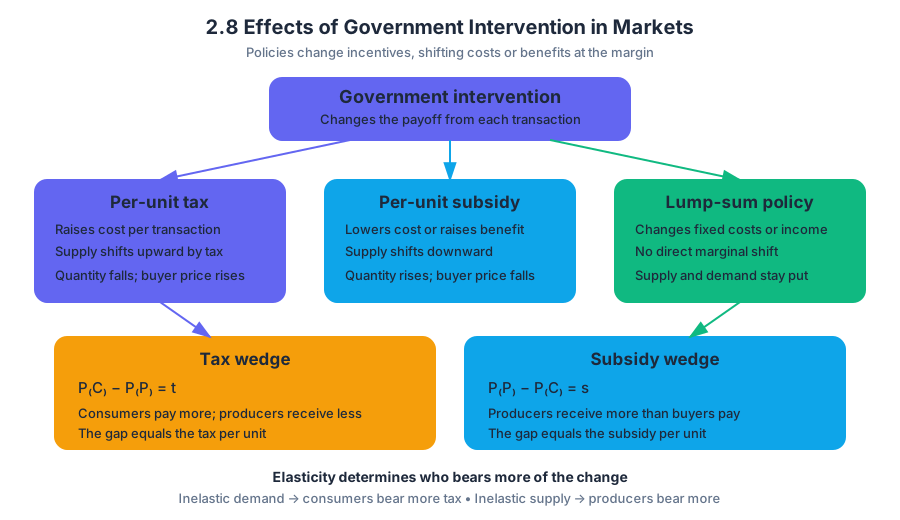
A per-unit tax is a payment collected for every unit bought or sold. It raises the marginal cost of supplying the product, so the supply curve shifts upward by the amount of the tax. A per-unit subsidy is a payment for every unit bought or sold; it lowers the effective marginal cost of production or raises the effective benefit of consumption, shifting supply downward or demand upward.
| Policy | Incentive effect | Typical market result |
|---|---|---|
| Per-unit tax | Raises the cost of each transaction | Buyer price rises, seller price net of tax falls, quantity falls |
| Per-unit subsidy | Lowers the cost or raises the benefit of each transaction | Buyer price falls, seller receipt rises, quantity rises |
| Lump-sum tax or subsidy | Changes fixed costs or income, not marginal cost or benefit | Does not directly shift supply or demand |
The tax creates a wedge between the price paid by consumers, $P_C$, and the price received by producers, $P_P$:
$$P_C-P_P=t$$
A subsidy creates the opposite wedge:
$$P_P-P_C=s$$
The size of the changes depends on the price elasticity of demand and supply. When demand is relatively inelastic, consumers bear more of a tax and their consumer surplus falls sharply; when supply is relatively inelastic, producers bear more of it.
Consumer surplus, producer surplus, and deadweight loss
Consumer surplus is the difference between what buyers are willing to pay and what they actually pay. A tax generally reduces consumer surplus in two ways: the buyer price rises, and fewer mutually beneficial trades occur. A subsidy generally increases consumer surplus because the buyer price falls and consumption expands, although the exact change depends on how the subsidy is divided between buyers and sellers.
Producer surplus is the difference between the price sellers receive and their minimum acceptable price. A tax generally reduces producer surplus because sellers receive a lower net price and sell fewer units. A subsidy generally raises producer surplus because sellers receive a higher effective price and produce more.
Total economic surplus equals consumer surplus plus producer surplus plus government revenue, minus government expenditure:
$$TES=CS+PS+\text{government revenue}-\text{government expenditure}$$
In a market that was already producing the efficient quantity, a tax or subsidy usually creates deadweight loss: the lost gains from trades that no longer occur or from resources devoted to units whose social benefit is below their social cost. This is the meaning of POL-1.A.4 and POL-1.A.5: intervention in an already efficient market can only reduce allocative efficiency.
Worked example: a subsidy for a positive externality
Suppose vaccinations create benefits for both the person vaccinated and nearby people who are less likely to become infected. The private market considers only the buyer’s private benefit, so the market quantity is too low. A per-unit subsidy to consumers shifts demand rightward, raises the quantity purchased, and can move output toward the socially efficient quantity. The policy may increase consumer surplus and producer surplus, but it also creates a government cost equal to:
$$\text{government expenditure}=s\times Q_s$$
If the subsidy exactly corrects the external benefit, the resulting quantity can maximize total economic surplus rather than create deadweight loss.
Externalities and market failure
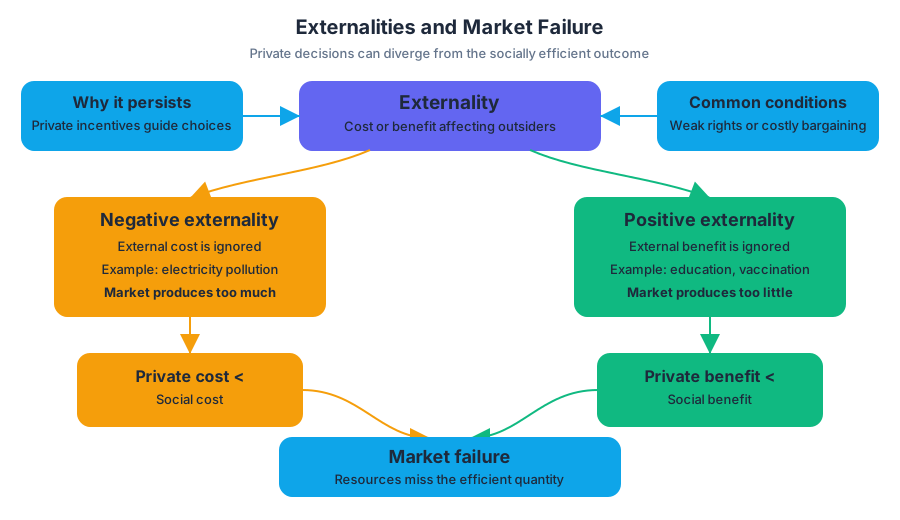
An externality is a cost or benefit imposed on someone who is not directly involved in a transaction. A negative externality, such as pollution from electricity generation, causes the market to produce more than the socially efficient quantity because firms and consumers consider private costs but ignore external costs. A positive externality, such as education or vaccination, causes the market to produce less than the socially efficient quantity because private decision-makers ignore external benefits.
Externalities can arise from poorly defined property rights or high transaction costs, as identified by POL-3.A.2. If no one clearly owns the right to clean air, affected people may be unable to negotiate with a polluting firm. Rational agents respond to the private costs and benefits they face, not automatically to external ones, which produces market failure under POL-3.A.3.
Policy responses to externalities
For a negative externality, government can impose a corrective tax, establish environmental standards, create tradable emissions permits, or assign property rights. An emissions tax makes pollution more expensive and encourages firms to adopt cleaner production methods. Environmental regulation can directly limit emissions, while tradable permits allow firms with lower cleanup costs to reduce more pollution and sell permits to firms with higher cleanup costs.
For a positive externality, government can provide a subsidy or directly provide the good. Public provision of schools, vaccination programs, or public transportation can increase consumption when private demand understates the full social benefit. Assignment or reassignment of property rights can also help: when rights are clear and bargaining costs are low, private parties may negotiate toward an efficient outcome, consistent with the property-rights approach in POL-3.B.
Intervention in imperfect markets
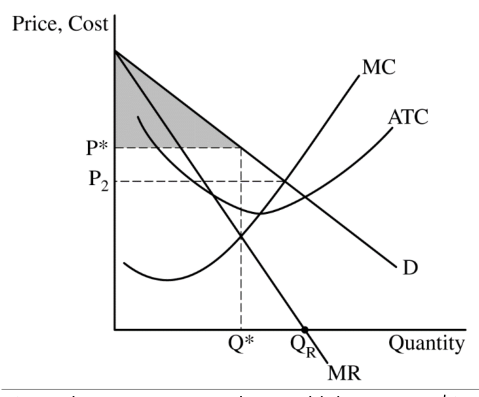
Government policies must be analyzed within the market structure. In a monopoly, a subsidy that lowers marginal cost can increase the firm’s profit-maximizing output; regulation may instead impose a price or quantity rule. In a monopsony labor market, a policy affecting the firm’s cost of hiring can change employment, while a carefully designed minimum wage may increase employment rather than reduce it. The outcome depends on the relevant supply, demand, and marginal curves—not on the policy label alone.
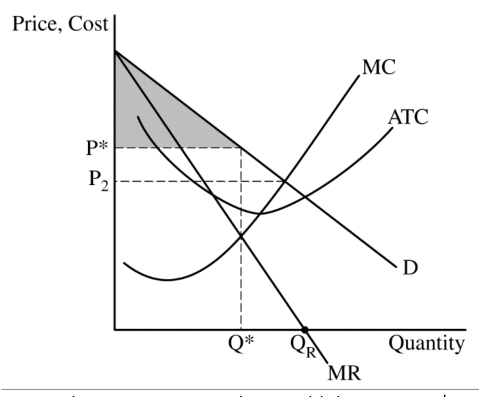
For every policy graph, label both axes, the original and shifted curves, the initial and new equilibrium, buyer and seller prices when a wedge exists, and any surplus or deadweight-loss regions. POL-4.A requires explaining policy effects in perfectly and imperfectly competitive markets, while POL-4.A.1 emphasizes changes in price, quantity, surplus, deadweight loss, and government revenue.
Misconception check: A lower legal price does not automatically create the socially optimal quantity. A binding price ceiling may create a shortage, while a subsidy changes incentives and can expand output. Always compare the policy outcome with the efficient quantity.
Retrieval check: A city taxes gasoline to reduce pollution. State the likely effects on the buyer price, quantity consumed, consumer surplus, and pollution. Then identify one graph feature showing why the tax may improve allocative efficiency rather than create a policy-induced deadweight loss.
Source Materials
- AP Microeconomics Course and Exam Description
- AP Microeconomics Course and Exam Description Clarifications and Corrections
- AP Microeconomics Course Overview
- AP Microeconomics Course at a Glance
- AP Microeconomics Course at a Glance Poster
- AP Microeconomics
- AP Microeconomics
- AP Microeconomics Sample Syllabus 1
- (ii) State that consumer surplus would decrease to $0 and explain that Arzeye is able to charge the maximum price each consumer is willing to pay.
- Figure — Sample Responses Q3 - Set 1 (p. 3)
- Figure — Sample Responses Q3 - Set 1 (p. 4)
- Figure — Sample Responses Q3 - Set 1 (p. 5)