From the free course AP Microeconomics on Lykke
AP Practice 6
A market can produce the wrong quantity even when every buyer and seller is acting in their own interest. The exam skill is to identify the wedge between private and social incentives, represent it accurately, and explain the policy result in economic language.
AP Practice 6
A market can produce the wrong quantity even when every buyer and seller is acting in their own interest. The exam skill is to identify the wedge between private and social incentives, represent it accurately, and explain the policy result in economic language.
This original, unofficial practice uses a free-response question requiring graphing, numerical analysis, assertions, and explanations. It integrates Unit 2 supply and demand with Unit 6 market failure and the role of government.
Task profile and timing
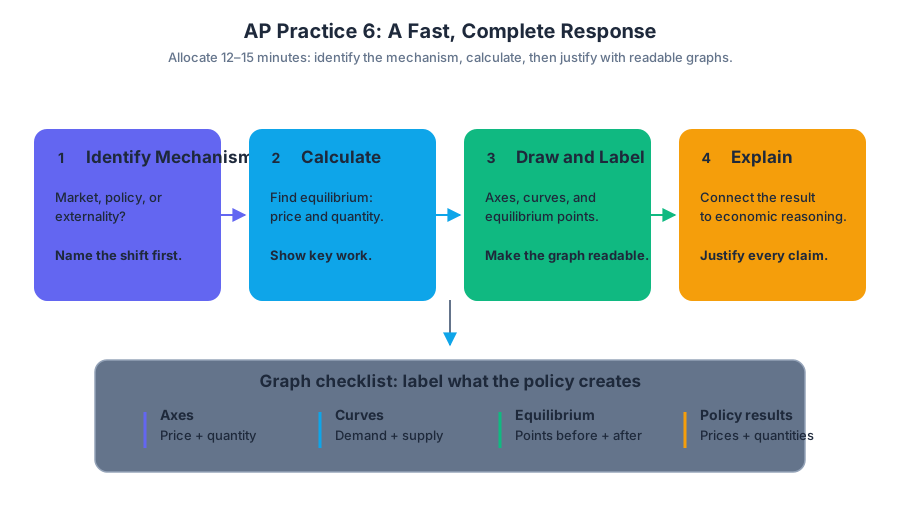
Allocate about $12$–$15$ minutes. First identify the market mechanism, then calculate before writing explanations. For every graph, label both axes, curves, equilibrium points, and any policy-created quantities or prices. A correct idea without a readable graph or economic justification may not earn the associated point.
Original practice prompt
A city’s market for reusable delivery containers is competitive. The private marginal benefit and private marginal cost are represented by:
$$ Q_D = 120 - 2P $$
$$ Q_S = 3P $$
Production creates a constant marginal external cost of $10$ per container because cleaning and disposal impose costs on nearby residents.
(a)
Calculate the competitive equilibrium price and quantity. Show your work.
(b)
Draw a correctly labeled graph of the market. Show the demand curve, the private marginal-cost curve, the social marginal-cost curve, the market equilibrium, and the socially efficient quantity.
(c)
Calculate the socially efficient quantity.
(d)
The city imposes a per-unit corrective tax equal to the marginal external cost. Explain what happens to the market quantity and why the tax improves allocative efficiency.
(e)
Suppose demand is relatively inelastic while supply is relatively elastic. Which side of the market bears more of the tax burden? Explain.
Worked reasoning
(a) Competitive equilibrium
At equilibrium, quantity demanded equals quantity supplied:
$$ 120 - 2P = 3P $$
$$ 120 = 5P $$
$$ P = 24 $$
Substitute $P=24$ into either equation:
$$ Q = 3(24) = 72 $$
Therefore, the competitive equilibrium is $P=$24$ and $Q=72$.
Scoring target: The response must include the equilibrium condition, a correct solution for price, and a correct solution for quantity. Writing only the final coordinates does not demonstrate the required numerical reasoning as clearly as showing the equations.
(b) Market-failure graph
The supply curve represents private marginal cost, or the cost directly faced by producers. Because production creates an external cost of $10$, social marginal cost lies exactly $10$ above private marginal cost at every quantity:
$$ SMC = PMC + 10 $$
The demand curve represents marginal private benefit and, under the stated conditions, also represents marginal social benefit. The market equilibrium occurs where demand intersects $PMC$ at $(72,24)$. The efficient quantity occurs where demand intersects $SMC$.
Scoring target: A complete graph labels the vertical axis as price or cost and the horizontal axis as quantity; includes $D$, $PMC$, and $SMC$; places $SMC$ above $PMC$; identifies the market quantity $Q_M$ and efficient quantity $Q^*$; and shows the relevant intersections. A graph with curves but no labels is incomplete.
(c) Efficient quantity
Rewrite the private supply equation as an inverse supply equation:
$$ Q_S=3P $$
$$ P=\frac{Q}{3} $$
Thus:
$$ PMC=\frac{Q}{3} $$
Because the marginal external cost is $10$:
$$ SMC=\frac{Q}{3}+10 $$
Rewrite demand as inverse demand:
$$ Q_D=120-2P $$
$$ P=60-\frac{Q}{2} $$
At the efficient quantity, marginal social benefit equals social marginal cost:
$$ 60-\frac{Q}{2}=\frac{Q}{3}+10 $$
$$ 50=\frac{5Q}{6} $$
$$ Q^*=60 $$
The market produces $72$ containers, but the socially efficient quantity is $60$ containers. The market therefore overproduces by $12$ containers because producers and consumers do not fully account for the external cost.
(d) Corrective tax and efficiency
A corrective tax equal to the marginal external cost shifts the producer’s effective cost curve upward by $10$. The new market supply curve corresponds to $SMC$, so the after-tax equilibrium occurs at $Q=60$, the socially efficient quantity.
A strong explanation makes the causal chain explicit: production creates a negative externality; the market quantity is greater than the efficient quantity; the tax makes producers face the previously unpriced external cost; the supply curve shifts upward; and quantity falls from $72$ to $60$. Because the tax aligns private marginal cost with social marginal cost, the market eliminates the overproduction caused by the externality.
(e) Tax incidence
The side of the market that is relatively more inelastic bears more of the tax burden. Since demand is relatively inelastic and supply is relatively elastic, consumers bear more of the tax through a larger increase in the price they pay.
Named misconception — “The tax burden always falls on sellers.” Legal responsibility for sending the tax payment to the government does not determine economic incidence. Relative elasticity determines who can avoid the tax more easily: the less responsive side has fewer alternatives and therefore absorbs more of the burden.
Examiner-reward reasoning
| Response feature | What earns credit |
|---|---|
| Assertion | States the direction of the outcome, such as “the market overproduces.” |
| Explanation | Connects the outcome to marginal social benefit, marginal social cost, or the externality. |
| Numerical analysis | Shows equations and reaches the correct values. |
| Graphing and Visuals — Skill 4 | Uses accurate labels, correctly positioned curves, and identifiable equilibrium points. |
| Manipulation — Skill 3 | Determines how the tax changes the supply relationship and market outcome. |
Error-review routine
After completing the question, classify each error rather than merely marking it wrong:
- Model error: Did you confuse $PMC$ with $SMC$?
- Algebra error: Did you set quantity demanded equal to quantity supplied correctly?
- Graph error: Did you shift the supply curve vertically by the tax rather than moving demand?
- Explanation error: Did you state the result without explaining the marginal incentive?
- Incidence error: Did you use elasticity, or did you rely on who is legally taxed?
Retrieval check: If the external cost rose from $10$ to $15$, would the $SMC$ curve shift upward or downward, and would the efficient quantity rise or fall? The answer is upward and fall: a larger unpriced harm creates a larger gap between private and social cost, so the efficient output is lower.

Source Materials
- AP Microeconomics Course and Exam Description
- AP Microeconomics Course and Exam Description Clarifications and Corrections
- AP Microeconomics Course Overview
- AP Microeconomics Course at a Glance
- AP Microeconomics Course at a Glance Poster
- AP Microeconomics
- AP Microeconomics
- AP Microeconomics Sample Syllabus 1
- AP Microeconomics-AP Students-College Board
- AP/College Microeconomics-Khan Academy
- AP Microeconomics Exam Questions-AP Central-College Board
- AP Microeconomics Practice FRQ Questions-ReviewEcon