From the free course AP Microeconomics on Lykke
5.1 Introduction to Factor Markets** `[PRD]`
Key concepts: Factor Markets · Factor demand · Labor market equilibrium · Productivity · Pricing · Quantitative problems · Learning Objectives (PRD-4.A) · Unit 5 of AP Microeconomics
A firm does not hire labor because workers are “part of the business”; it hires a worker when that worker adds more revenue than the worker costs.
5.1 Introduction to Factor Markets** [PRD]
A firm does not hire labor because workers are “part of the business”; it hires a worker when that worker adds more revenue than the worker costs. That simple comparison connects production, product prices, wages, and labor-market equilibrium.
Factor markets: where firms buy productive resources
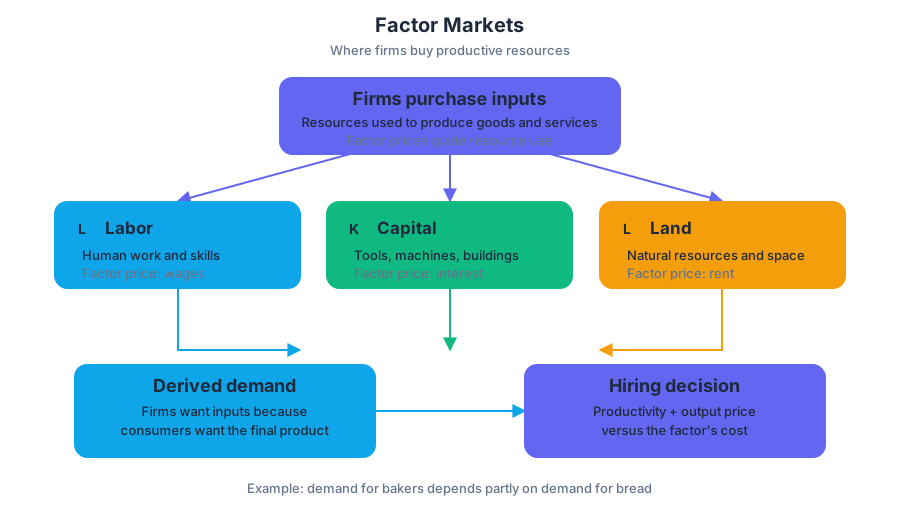
A factor market is a market in which firms purchase the resources used to produce goods and services. The major factors of production are labor, capital, and land. Their factor prices are, respectively, wages, interest, and rent.
PRD-4.A.1: Factors of production respond to factor prices, and firms decide how much of a factor to hire based on the factor’s productivity, the price of the firm’s output, and the factor’s cost.
The demand for a factor is derived demand: firms want workers, machines, or land because those resources help produce a product that consumers want. A bakery’s demand for bakers depends partly on the demand for bread; a quartz-mining company’s demand for miners depends partly on the demand and price of quartz.
From productivity to factor demand
The key productivity measure is marginal product of labor ($MP_L$), the additional output created by hiring one more unit of labor while other inputs remain fixed:
$$ MP_L=\frac{\Delta Q}{\Delta L} $$
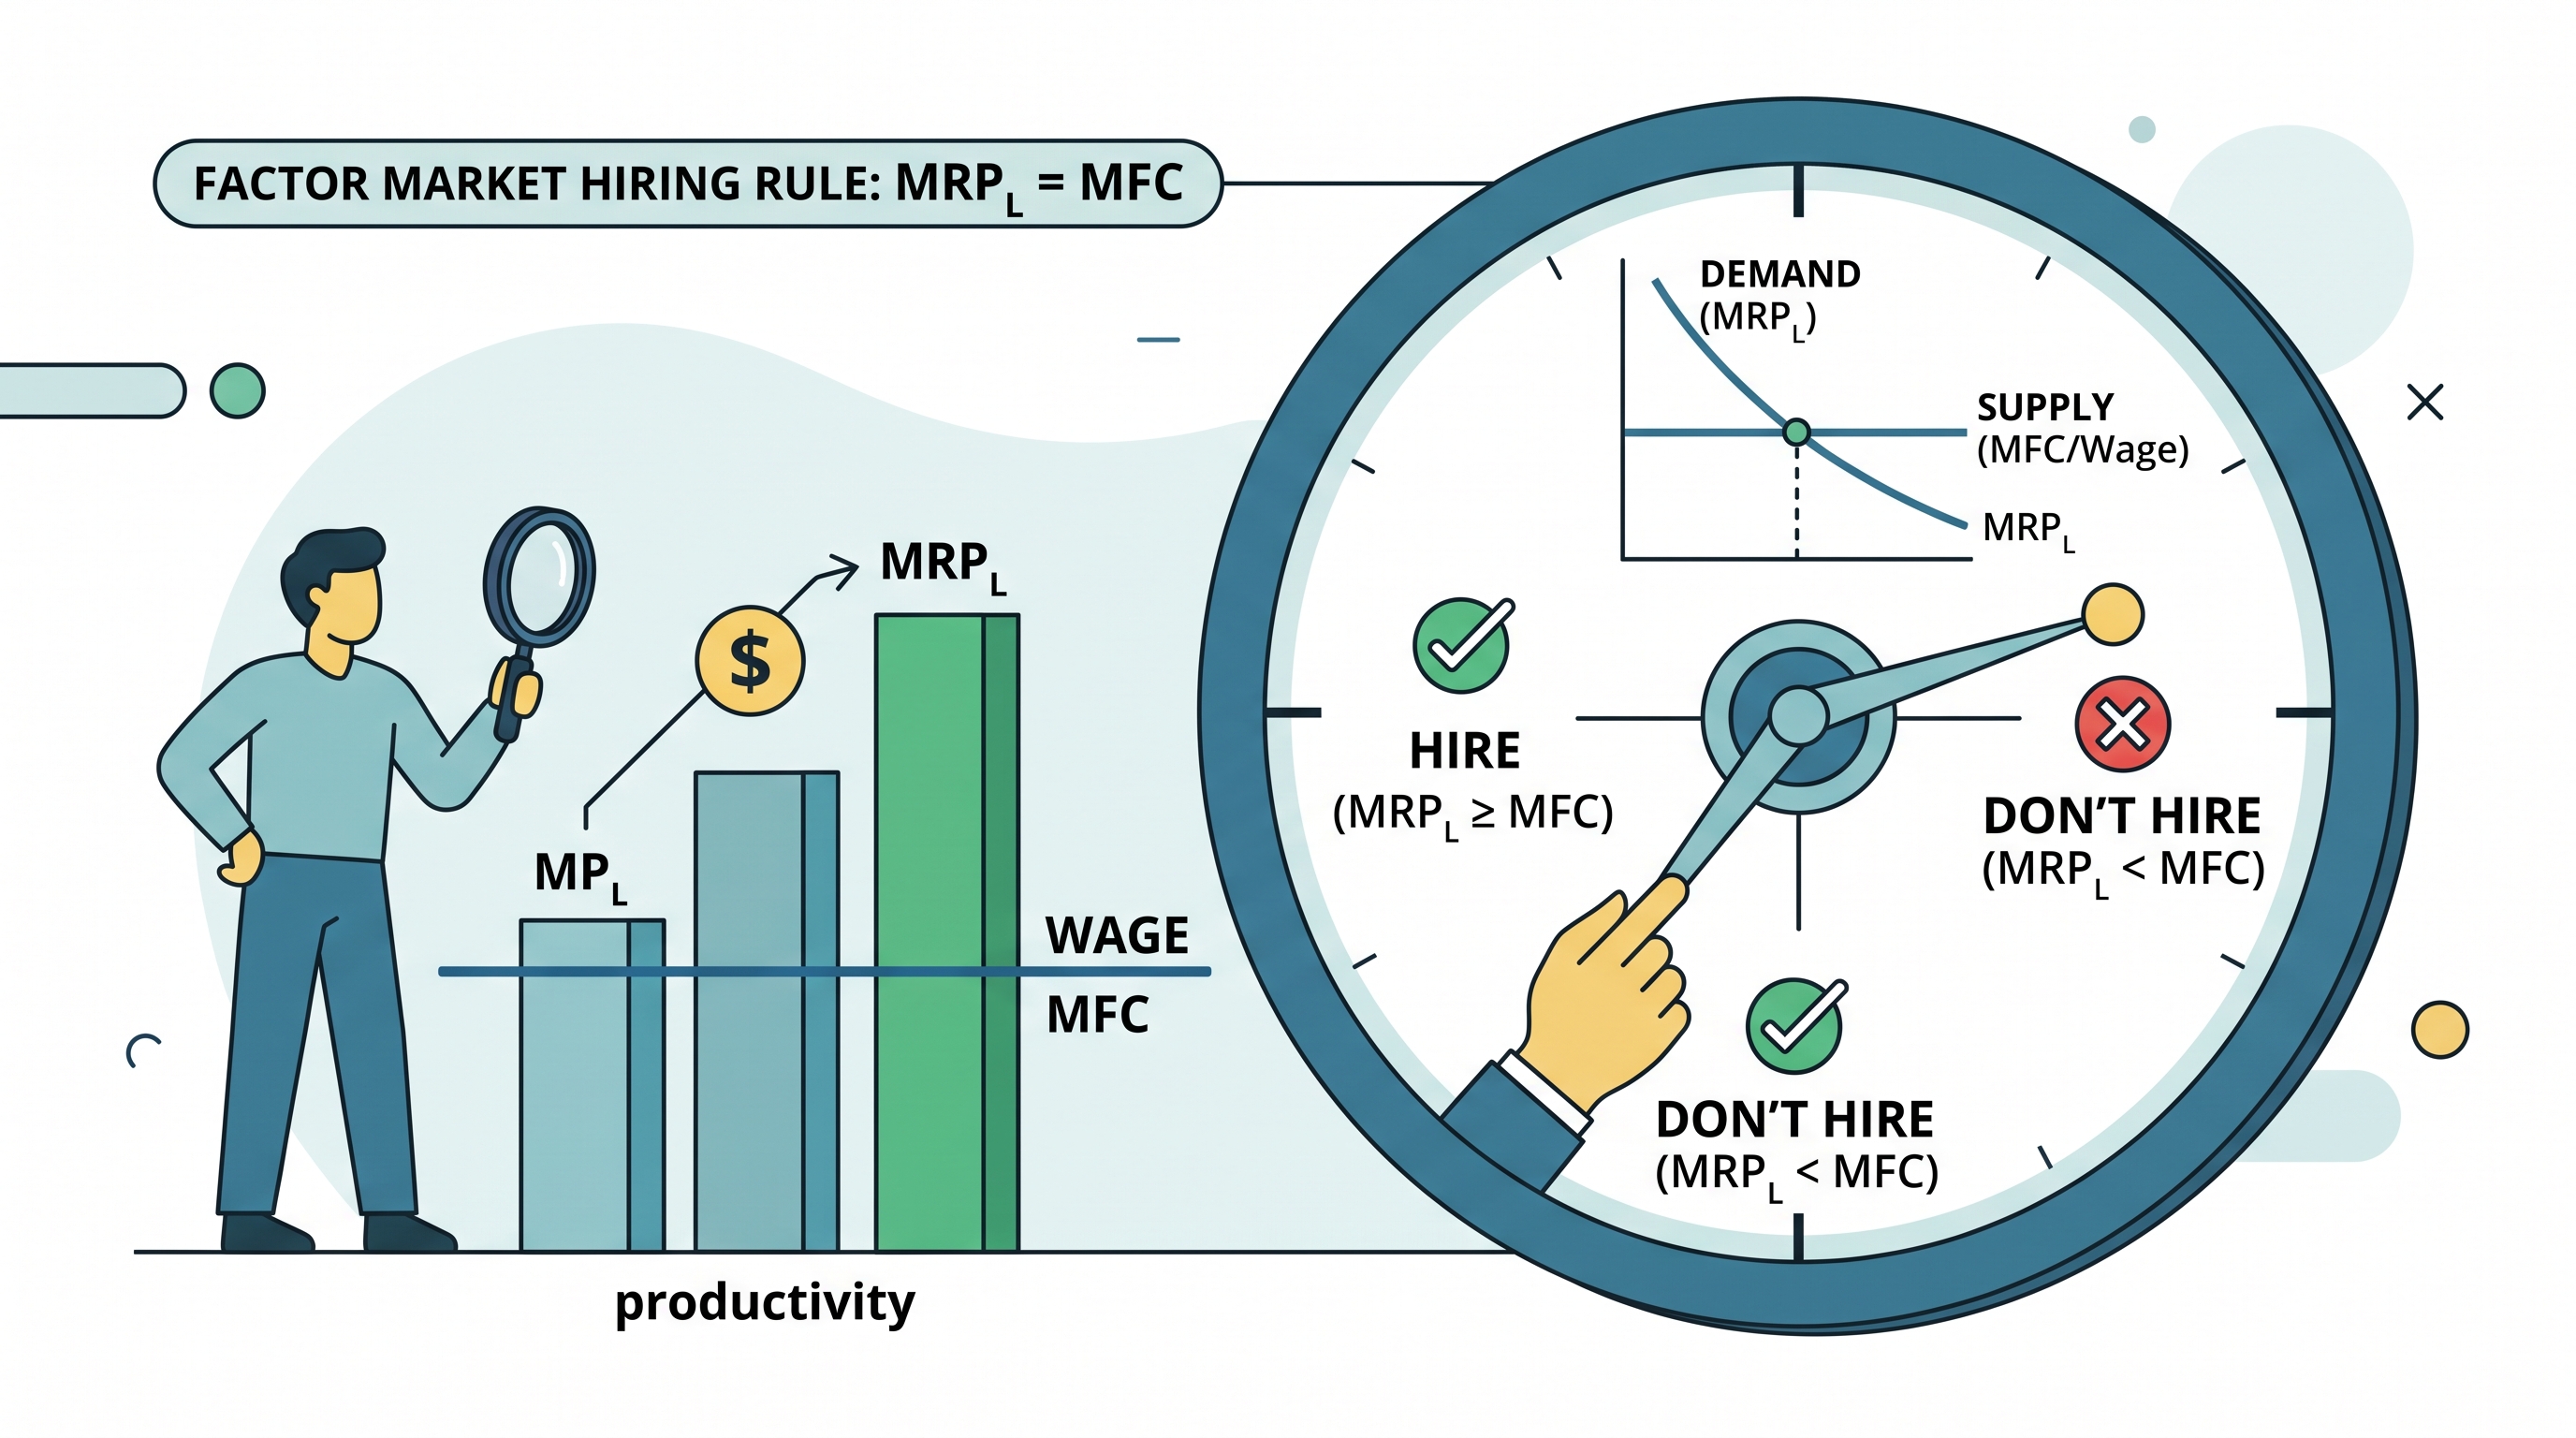
To convert additional output into additional revenue, multiply $MP_L$ by the product’s price. The result is marginal revenue product of labor ($MRP_L$), the additional revenue generated by one more worker:
$$ MRP_L=MP_L\times P $$
For a price-taking firm, the $MRP_L$ curve is the firm’s labor-demand curve. Because the marginal product of labor generally falls as more workers are added to fixed inputs, $MRP_L$ typically slopes downward. The firm is willing to pay up to the revenue generated by the next worker—not the worker’s total contribution from all previous workers.
Worked example: a bakery’s hiring decision
A bakery sells each loaf for $4. Its fourth worker raises daily output from $70 loaves to $82 loaves. Therefore:
$$ MP_L=82-70=12\text{ loaves} $$
$$ MRP_L=12\times $4=$48 $$
If the wage is $40, the fourth worker adds $$48$ in revenue but costs $$40$, so hiring the worker increases profit by $$8$. If the wage is $$55$, hiring that worker would reduce profit by $$7$. The firm continues hiring while:
$$ MRP_L\geq MFC $$
Here, marginal factor cost ($MFC$) means the additional cost of obtaining one more unit of a factor. In a perfectly competitive labor market, the firm can hire workers at the market wage, so:
$$ MFC=w $$
The profit-maximizing employment level occurs where:
$$ MRP_L=MFC $$
If the curves do not intersect exactly at a whole number of workers, hire the last worker whose $MRP_L$ is at least as large as the wage.
Labor-market equilibrium
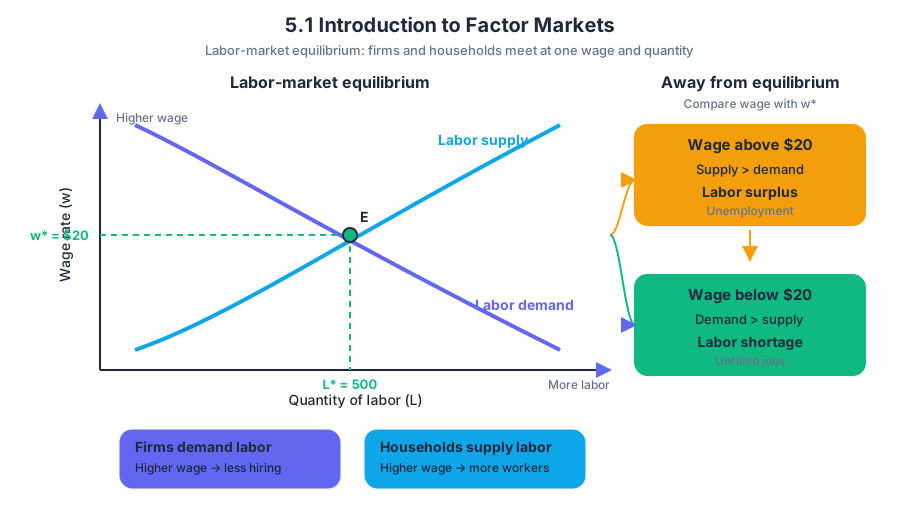
The labor-market demand curve shows the quantities of labor firms are willing and able to hire at different wage rates. The labor-market supply curve shows the quantities of labor households are willing and able to offer at different wage rates.
PRD-4.A.2: The quantity of labor demanded is negatively related to the wage rate, while the quantity of labor supplied is positively related to the wage rate, other things constant.
The intersection of labor demand and labor supply establishes the equilibrium wage and equilibrium quantity of labor. At that point, the number of workers firms want to hire equals the number of workers willing to work.
Suppose the labor market has equilibrium wage $w^=$20$ and equilibrium employment $L^=500$. At $$20$, firms demand exactly $500$ workers and households supply exactly $500$ workers. A wage above $$20$ creates a surplus of labor—unemployment—because quantity supplied exceeds quantity demanded. A wage below $$20$ creates a shortage because firms want more workers than households offer.
AP reasoning and quantitative precision
This topic develops Skill Category 1: Principles and Models, especially 1.A Define Economic Principles and Models and 1.B Explain Economic Principles and Models: identify factor markets, distinguish $MP_L$ from $MRP_L$, and explain why a firm hires labor until $MRP_L=MFC$. It also uses Skill Category 2: Interpretation, especially 2.A Using economic concepts, principles, or models, explain how a specific economic outcome occurs, when connecting a wage to employment or profit.
Graphing uses Skill Category 4: Graphing and Visuals, especially 4.A Represent economic concepts, principles, or models using graphs, by labeling wage on the vertical axis, labor quantity on the horizontal axis, labor demand, labor supply, and equilibrium values. In a table problem, calculate each worker’s $MP_L$, then $MRP_L$, compare $MRP_L$ with the wage, and identify the final worker hired.
Misconception check — “The firm hires workers whenever they increase output.” Output alone is not enough. A worker may increase production but still lower profit if the worker’s $MRP_L$ is less than the wage.
Retrieval check: A worker adds $6$ units of output, and the product sells for $$10$ per unit. The wage is $$70$. What are $MP_L$, $MRP_L$, and the hiring decision?
Answer: $MP_L=6$, $MRP_L=6\times $10=$60$. Because $$60<$70$, the firm should not hire that worker. Changes in productivity, product price, and factor supply will be analyzed next; the central hiring rule remains $MRP_L=MFC$.
Source Materials
- AP Microeconomics Course and Exam Description
- AP Microeconomics Course and Exam Description Clarifications and Corrections
- AP Microeconomics Course Overview
- AP Microeconomics Course at a Glance
- AP Microeconomics Course at a Glance Poster
- AP Microeconomics
- AP Microeconomics
- AP Microeconomics Sample Syllabus 1
- AP Microeconomics-AP Students-College Board
- AP/College Microeconomics-Khan Academy
- AP Microeconomics Exam Questions-AP Central-College Board
- AP Microeconomics Practice FRQ Questions-ReviewEcon