From the free course AP Microeconomics on Lykke
1.3 Production Possibilities Curve** `[MKT]`
Key concepts: Production Possibilities Curve (PPC) · Scarcity · Trade-offs · Resource allocation · Opportunity cost · Efficiency · Underutilized resources · Economic growth and contraction · PPC shape and opportunity costs · Factors of production and productivity
A society cannot produce unlimited amounts of everything because its resources are scarce. The production possibilities curve (PPC) is a model that makes the resulting trade-offs visible: it shows the maximum combinations of two goods or services that can be produced with available resources, technology, and…
1.3 Production Possibilities Curve** [MKT]
A society cannot produce unlimited amounts of everything because its resources are scarce. The production possibilities curve (PPC) is a model that makes the resulting trade-offs visible: it shows the maximum combinations of two goods or services that can be produced with available resources, technology, and productive knowledge.
MKT-1.C.1: The PPC is a model used to show the trade-offs associated with allocating resources.
Reading the PPC
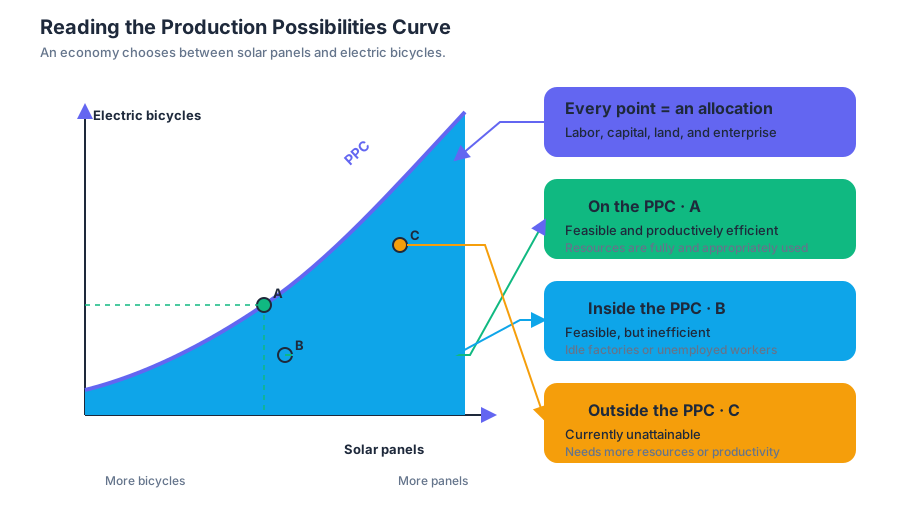
Imagine an economy producing only solar panels and electric bicycles. Every point on the curve represents a possible allocation of labor, capital, land, and entrepreneurship between those two products. Moving along the curve toward more solar panels requires producing fewer electric bicycles.
The three regions of the graph answer two questions: Is the combination feasible? and Is it using resources efficiently?
| Location | Feasible with current resources? | Economic meaning |
|---|---|---|
| On the PPC | Yes | Productively efficient: available resources are fully and appropriately used |
| Inside the PPC | Yes | Inefficient: resources are underutilized or misallocated |
| Outside the PPC | No | Currently unattainable without more resources or better productivity |
A point inside the curve might represent unemployed workers, idle factories, or production organized poorly. It is feasible, but the economy could produce more of at least one good without sacrificing the other. A point outside the curve is desirable perhaps, but unattainable under current conditions.
MKT-1.C.2: The PPC can be used to illustrate scarcity, opportunity cost, efficiency, underutilized resources, and economic growth or contraction.
Trade-offs and opportunity cost
A trade-off is what must be given up to obtain something else. Opportunity cost is the specific next-best alternative forgone. On a PPC, the opportunity cost of producing additional units of one good is measured by the amount of the other good sacrificed.
Suppose the economy can produce the following combinations:
| Combination | Solar panels | Electric bicycles |
|---|---|---|
| A | $0$ | $40$ |
| B | $1$ | $36$ |
| C | $2$ | $30$ |
| D | $3$ | $20$ |
| E | $4$ | $0$ |
Moving from B to C increases solar-panel production by $1$ but reduces electric-bicycle production by $6$. Therefore, the opportunity cost of that additional solar panel is $6$ electric bicycles. Moving from C to D has an opportunity cost of $10$ electric bicycles:
$$ \text{Opportunity cost of one additional solar panel}
\frac{\text{electric bicycles forgone}}{\text{solar panels gained}}
\frac{10}{1}
10\text{ electric bicycles} $$
The economy faces a changing trade-off because resources are not equally productive in both uses. Workers and machines especially suited to bicycle production may be shifted first; producing still more solar panels eventually requires reallocating resources that are better suited to bicycles.
Why the curve has different shapes
The shape of the PPC depends on how opportunity cost changes as production shifts between goods.
- A constant opportunity-cost PPC is a straight line. Resources are equally adaptable between the two goods, so each additional unit costs the same amount of the other good.
- An increasing opportunity-cost PPC is bowed outward, or concave. Resources become progressively less suited to the good whose production is expanding.
- A decreasing opportunity-cost PPC is bowed inward, or convex. Specialization makes additional production increasingly efficient, so each extra unit costs less of the other good.
MKT-1.C.3: The shape of the PPC depends on whether opportunity costs are constant, increasing, or decreasing.
Movement along the curve versus a shift
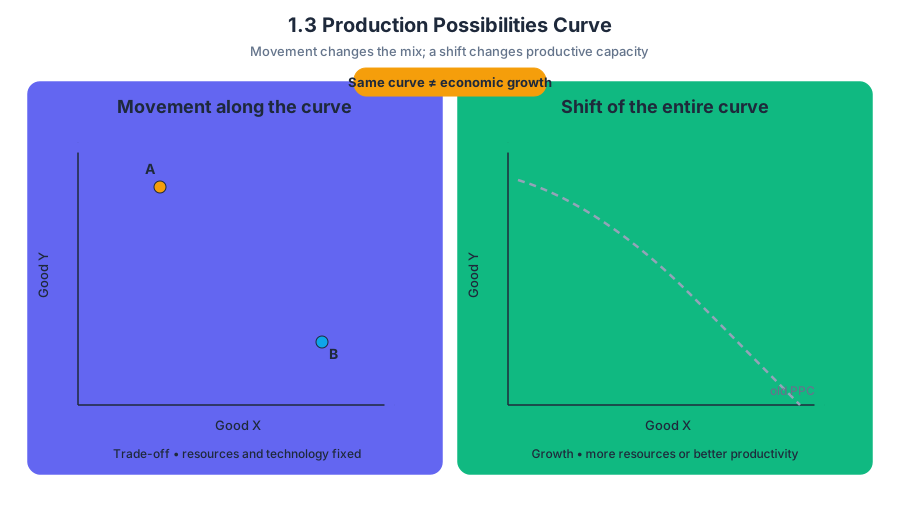
A movement along a PPC changes the economy’s product mix while resources and technology remain fixed. It represents a trade-off, not economic growth: producing more of one good requires producing less of the other.
A shift of the entire PPC changes what the economy can produce. An outward shift represents economic growth; an inward shift represents economic contraction.
The PPC shifts outward when the economy gains productive resources or improves productivity—for example, through a larger labor force, more capital, additional usable land, better worker knowledge, or improved technology. A natural disaster that destroys factories, a loss of workers, or a decline in productivity can shift the PPC inward.
MKT-1.C.4: The PPC can shift due to changes in factors of production as well as changes in productivity/technology.
MKT-1.C.5: Economic growth results in an outward shift of the PPC.
When drawing a shift, use arrows to show the direction clearly. A change affecting both goods generally shifts the whole curve outward or inward. A productivity improvement affecting only solar panels rotates the PPC outward mainly along the solar-panel axis rather than moving every point equally.
Resource allocation and AP reasoning
The PPC connects scarcity to resource allocation: society must decide what goods and services to produce, how to produce them, and for whom they are produced. The chosen point reflects those decisions, while the curve shows the limits imposed by available resources and technology.
This topic uses all four AP skill categories:
- Skill Category 1: Principles and Models — define the PPC, scarcity, efficiency, and opportunity cost.
- Skill Category 2: Interpretation — explain what a point, movement, or shift means in a specific economic situation.
- Skill Category 3: Manipulation — calculate opportunity cost from a table and determine how a resource or productivity change affects feasible output.
- Skill Category 4: Graphing and Visuals — draw and label axes, plot feasible combinations, identify efficiency, and use arrows to show outward or inward shifts.
Misconception check
Misconception: “Every point inside the PPC is impossible.”
Correction: points inside the curve are feasible but inefficient. The impossible points are outside the current PPC. Also, a point on the curve is productively efficient, but that does not automatically mean it is the society’s preferred or socially fairest allocation.
Retrieval check
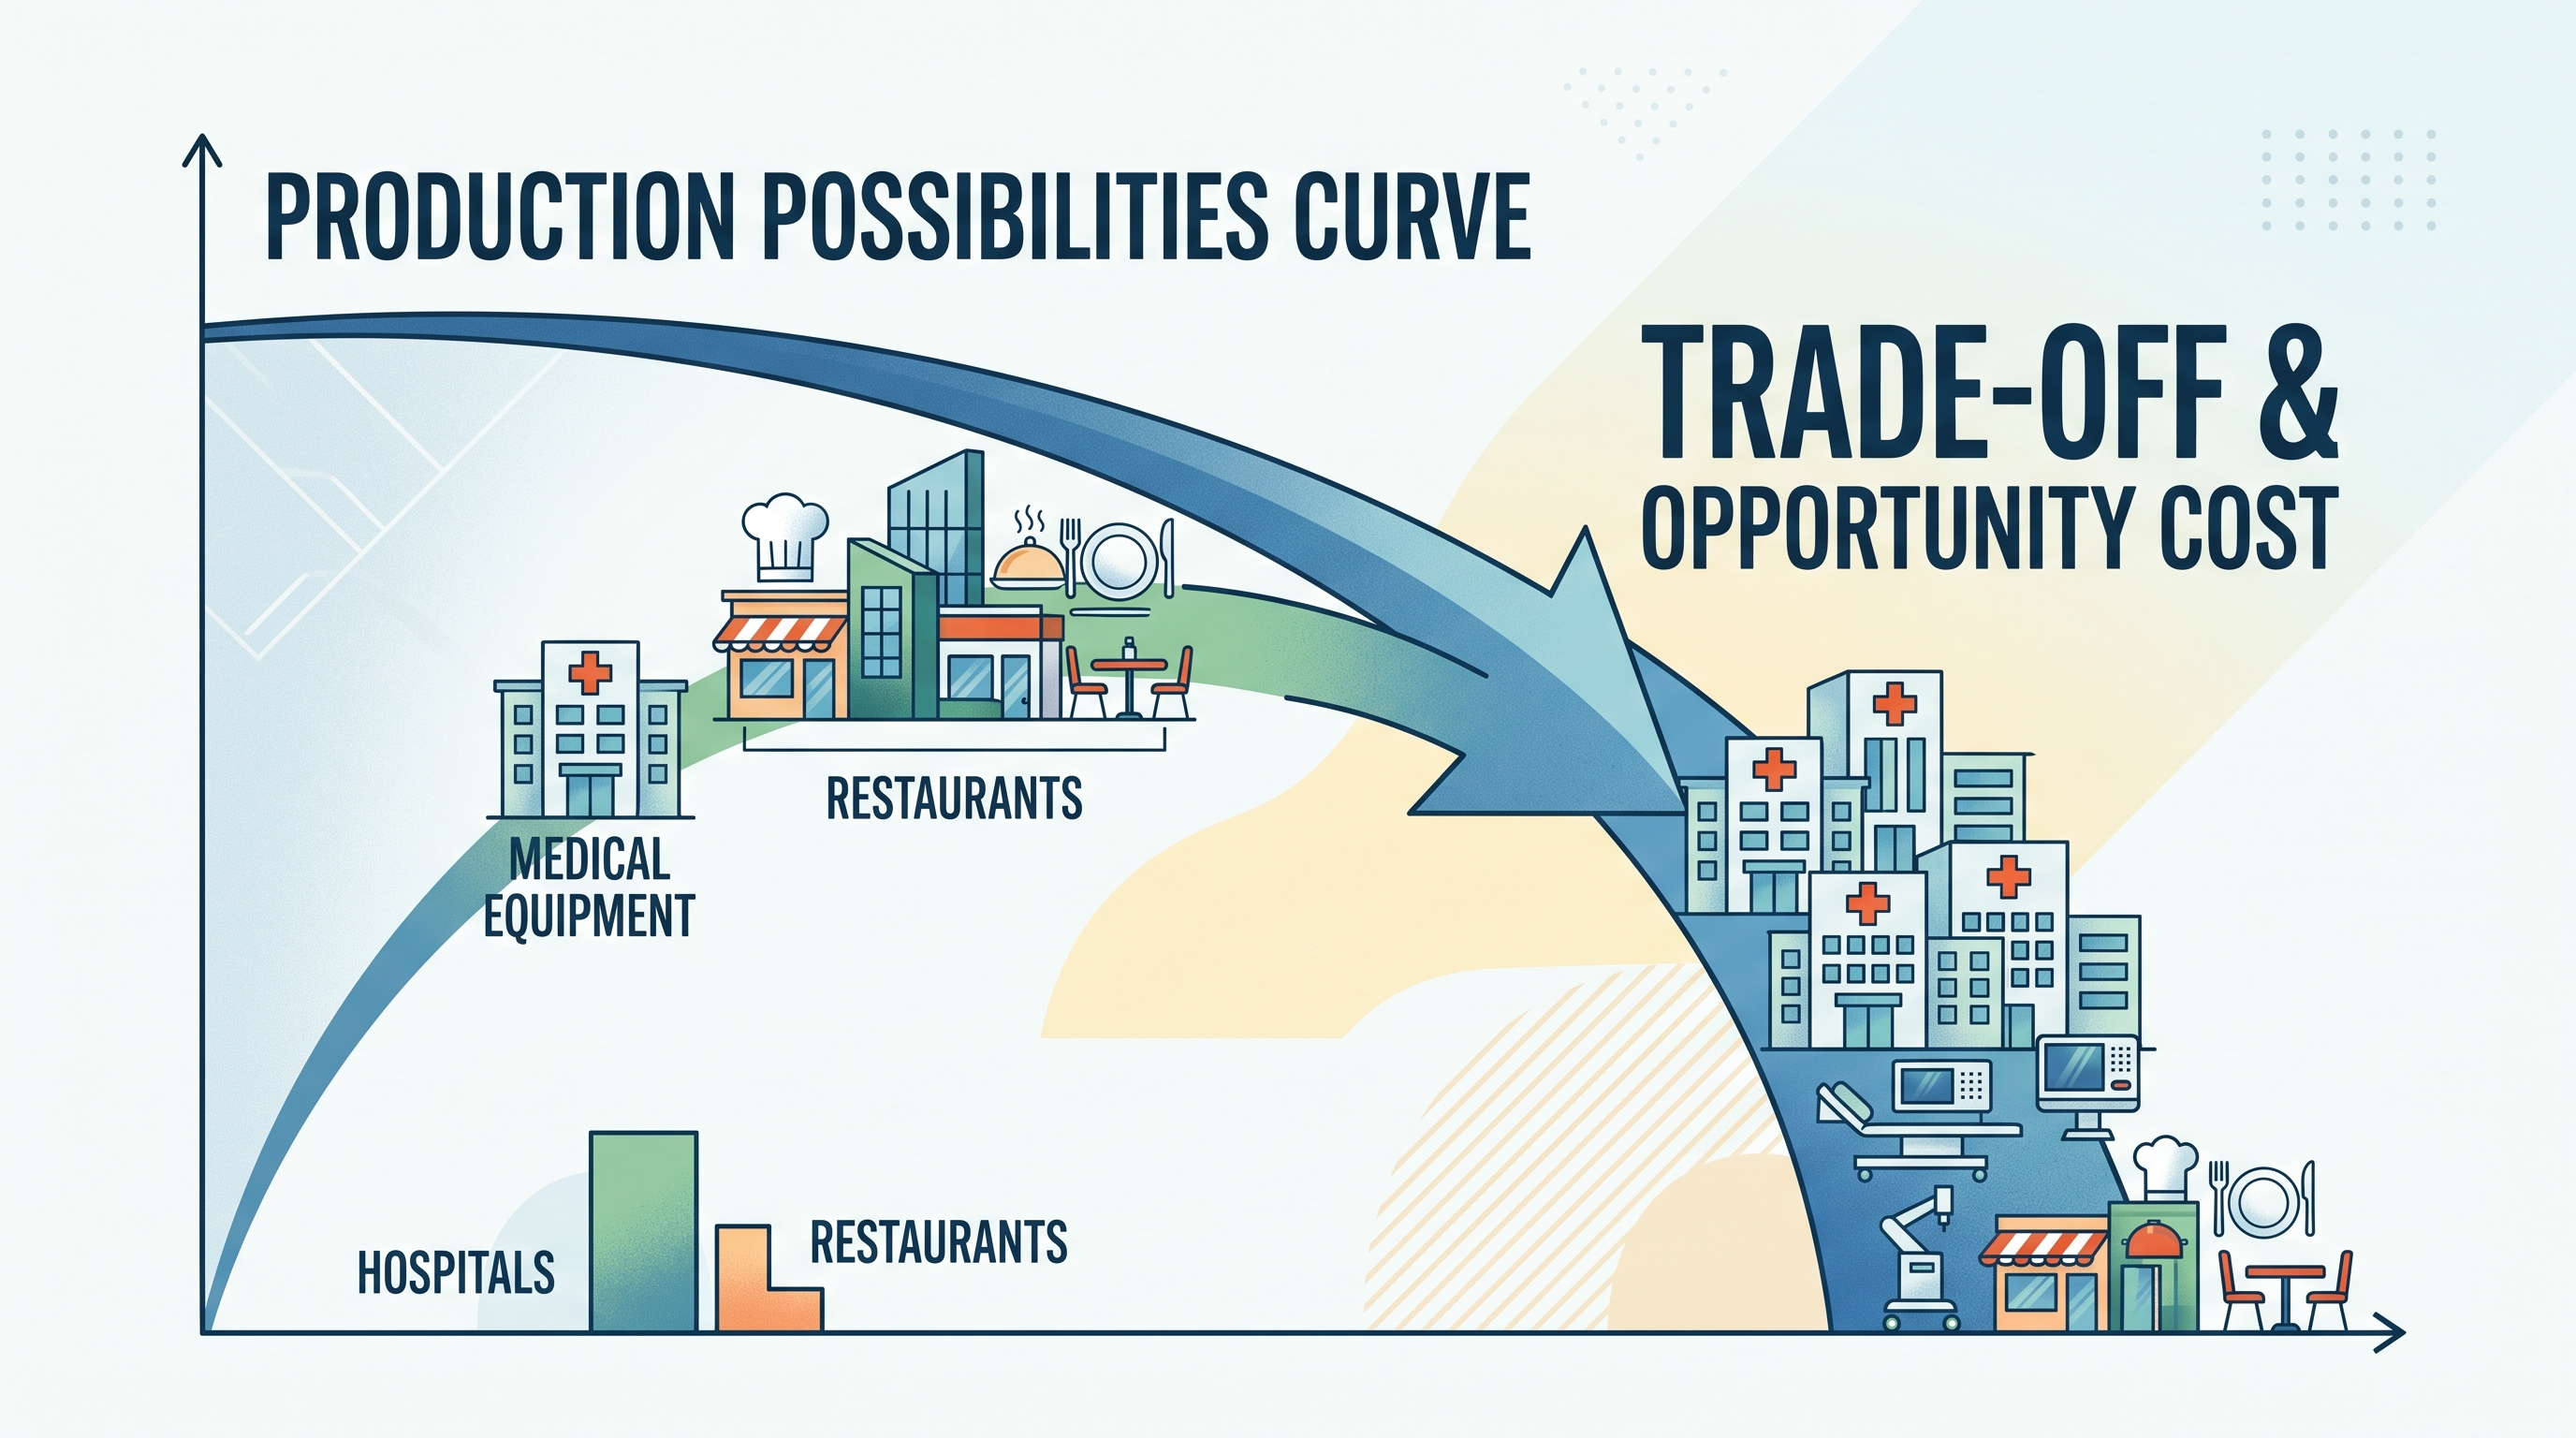
An economy moves from a point on its PPC to another point on the same PPC, producing more medical equipment and fewer restaurants. Is this an economic contraction? No. It is a movement along the curve, showing a trade-off and an opportunity cost. A contraction would shift the entire PPC inward.
Source Materials
- AP Microeconomics Course and Exam Description
- AP Microeconomics Course and Exam Description Clarifications and Corrections
- AP Microeconomics Course Overview
- AP Microeconomics Course at a Glance
- AP Microeconomics Course at a Glance Poster
- AP Microeconomics
- AP Microeconomics
- AP Microeconomics Sample Syllabus 1