From the free course AP Microeconomics on Lykke
AP Practice 4
A market can produce a quantity that buyers and sellers willingly accept while still wasting potential gains from trade. A per-unit tax reveals the difference: the price paid by consumers, the price received by producers, government revenue, and deadweight loss all appear in one supply-and-demand diagram.
Task type: Free-response graphing and visual analysis
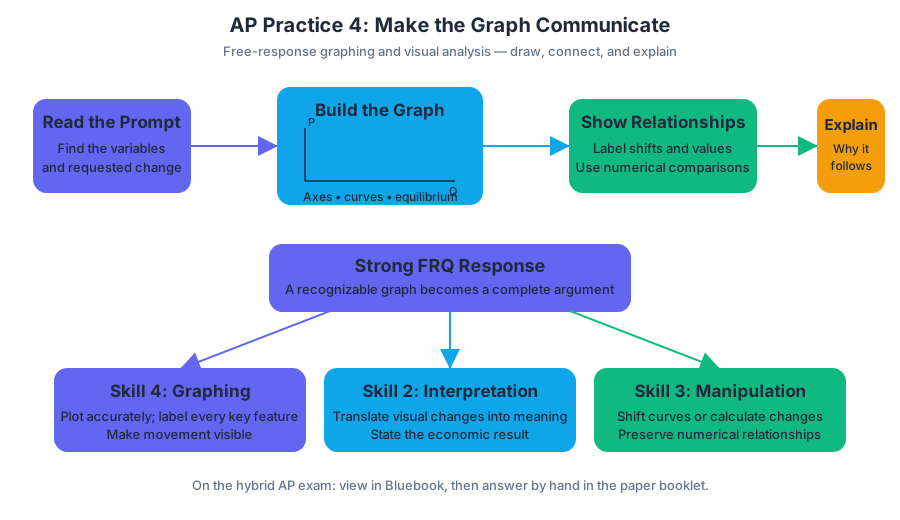
This original, unofficial practice focuses on Skill 4: Graphing and Visuals, while also requiring Skill 2: Interpretation and Skill 3: Manipulation. On the current hybrid AP Microeconomics Exam, free-response questions are displayed in Bluebook and answered by hand in paper booklets. A strong response does more than draw a recognizable graph: it uses labels, numerical relationships, and written economic reasoning to make the graph communicate the entire argument.
Original practice prompt
The market for reusable water bottles is initially competitive. The following linear equations describe the market, where $P$ is the price in dollars per bottle and $Q$ is the quantity of bottles per week:
$$ Q_D = 120 - 4P $$
$$ Q_S = 20 + P $$
The government imposes a tax of $$10$ on each bottle sold.
(a) Calculate the initial equilibrium price and quantity.
(b) Draw a correctly labeled graph of the market before and after the tax. Show the original equilibrium, the tax wedge, the price paid by consumers, the price received by producers, and the quantity sold after the tax.
(c) Calculate the prices paid by consumers and received by producers after the tax.
(d) Calculate the government’s tax revenue.
(e) Explain why the tax creates deadweight loss.
Worked reasoning
(a) Initial equilibrium
At equilibrium, quantity demanded equals quantity supplied:
$$ 120 - 4P = 20 + P $$
$$ 100 = 5P $$
$$ P = 20 $$
Substitute $P = 20$ into either equation:
$$ Q = 20 + 20 = 40 $$
Therefore, the initial equilibrium is:
$$ P_E = $20,\qquad Q_E = 40 $$
(b) Constructing the graph
Draw a downward-sloping demand curve labeled $D$ and an upward-sloping supply curve labeled $S$. Mark the original equilibrium at $(Q=40,\ P=$20)$.
After the tax, the consumer price exceeds the producer price by exactly $$10$:
$$ P_C - P_P = $10 $$
Graphically, the tax creates a vertical wedge between the price paid by consumers and the price received by producers at the new quantity. The new quantity must be lower than $40$, because the tax raises the consumer price and lowers the producer price relative to the original equilibrium.
(c) Prices and quantity after the tax
Let $P_P$ represent the price received by producers. Consumers pay $P_C=P_P+10$. At the post-tax equilibrium:
$$ Q_D = 120 - 4(P_P+10) $$
$$ Q_S = 20 + P_P $$
Set the two quantities equal:
$$ 120 - 4P_P - 40 = 20 + P_P $$
$$ 60 = 5P_P $$
$$ P_P = $12 $$
Consumers pay:
$$ P_C = P_P + $10 = $22 $$
The quantity sold is:
$$ Q = 20 + 12 = 32 $$
Thus:
$$ P_C=$22,\qquad P_P=$12,\qquad Q_T=32 $$
(d) Tax revenue
Government revenue equals the tax per unit multiplied by the number of units sold:
$$ TR = t \times Q_T $$
$$ TR = $10 \times 32 = $320 $$
On the graph, tax revenue is the rectangle with height $$10$ and width $32$ bottles.
(e) Deadweight loss
The tax reduces output from $40$ to $32$. The eight units no longer traded include exchanges for which buyers’ willingness to pay exceeded sellers’ opportunity cost. Those mutually beneficial trades disappear, so total surplus falls.
Deadweight loss is the triangular area between the demand and supply curves over the units not traded:
$$ DWL=\frac{1}{2}\times(\text{tax})\times(Q_E-Q_T) $$
$$ DWL=\frac{1}{2}\times $10\times(40-32)=$40 $$
What earns credit
| Response feature | Examiner-rewarded reasoning |
|---|---|
| Graphing and Visuals — Skill 4 | Demand and supply are correctly drawn and labeled; both equilibria, prices, quantities, and the tax wedge are identifiable. |
| Manipulation — Skill 3 | Equations are rearranged accurately to calculate equilibrium, tax incidence, quantity, revenue, and deadweight loss. |
| Interpretation — Skill 2 | The response connects the reduced quantity to lost mutually beneficial trades and lower total surplus. |
| Explanation | The answer distinguishes the consumer price from the producer price rather than treating the tax as changing only one price. |
Misconception check
Misconception: “The government collects $$10$ from each consumer, so consumers bear the entire tax.” The legal assignment of a tax does not determine its economic incidence. Here, consumers pay $$22$ instead of $$20$, while producers receive $$12$ instead of $$20$; both sides bear part of the burden.
Timing and error review
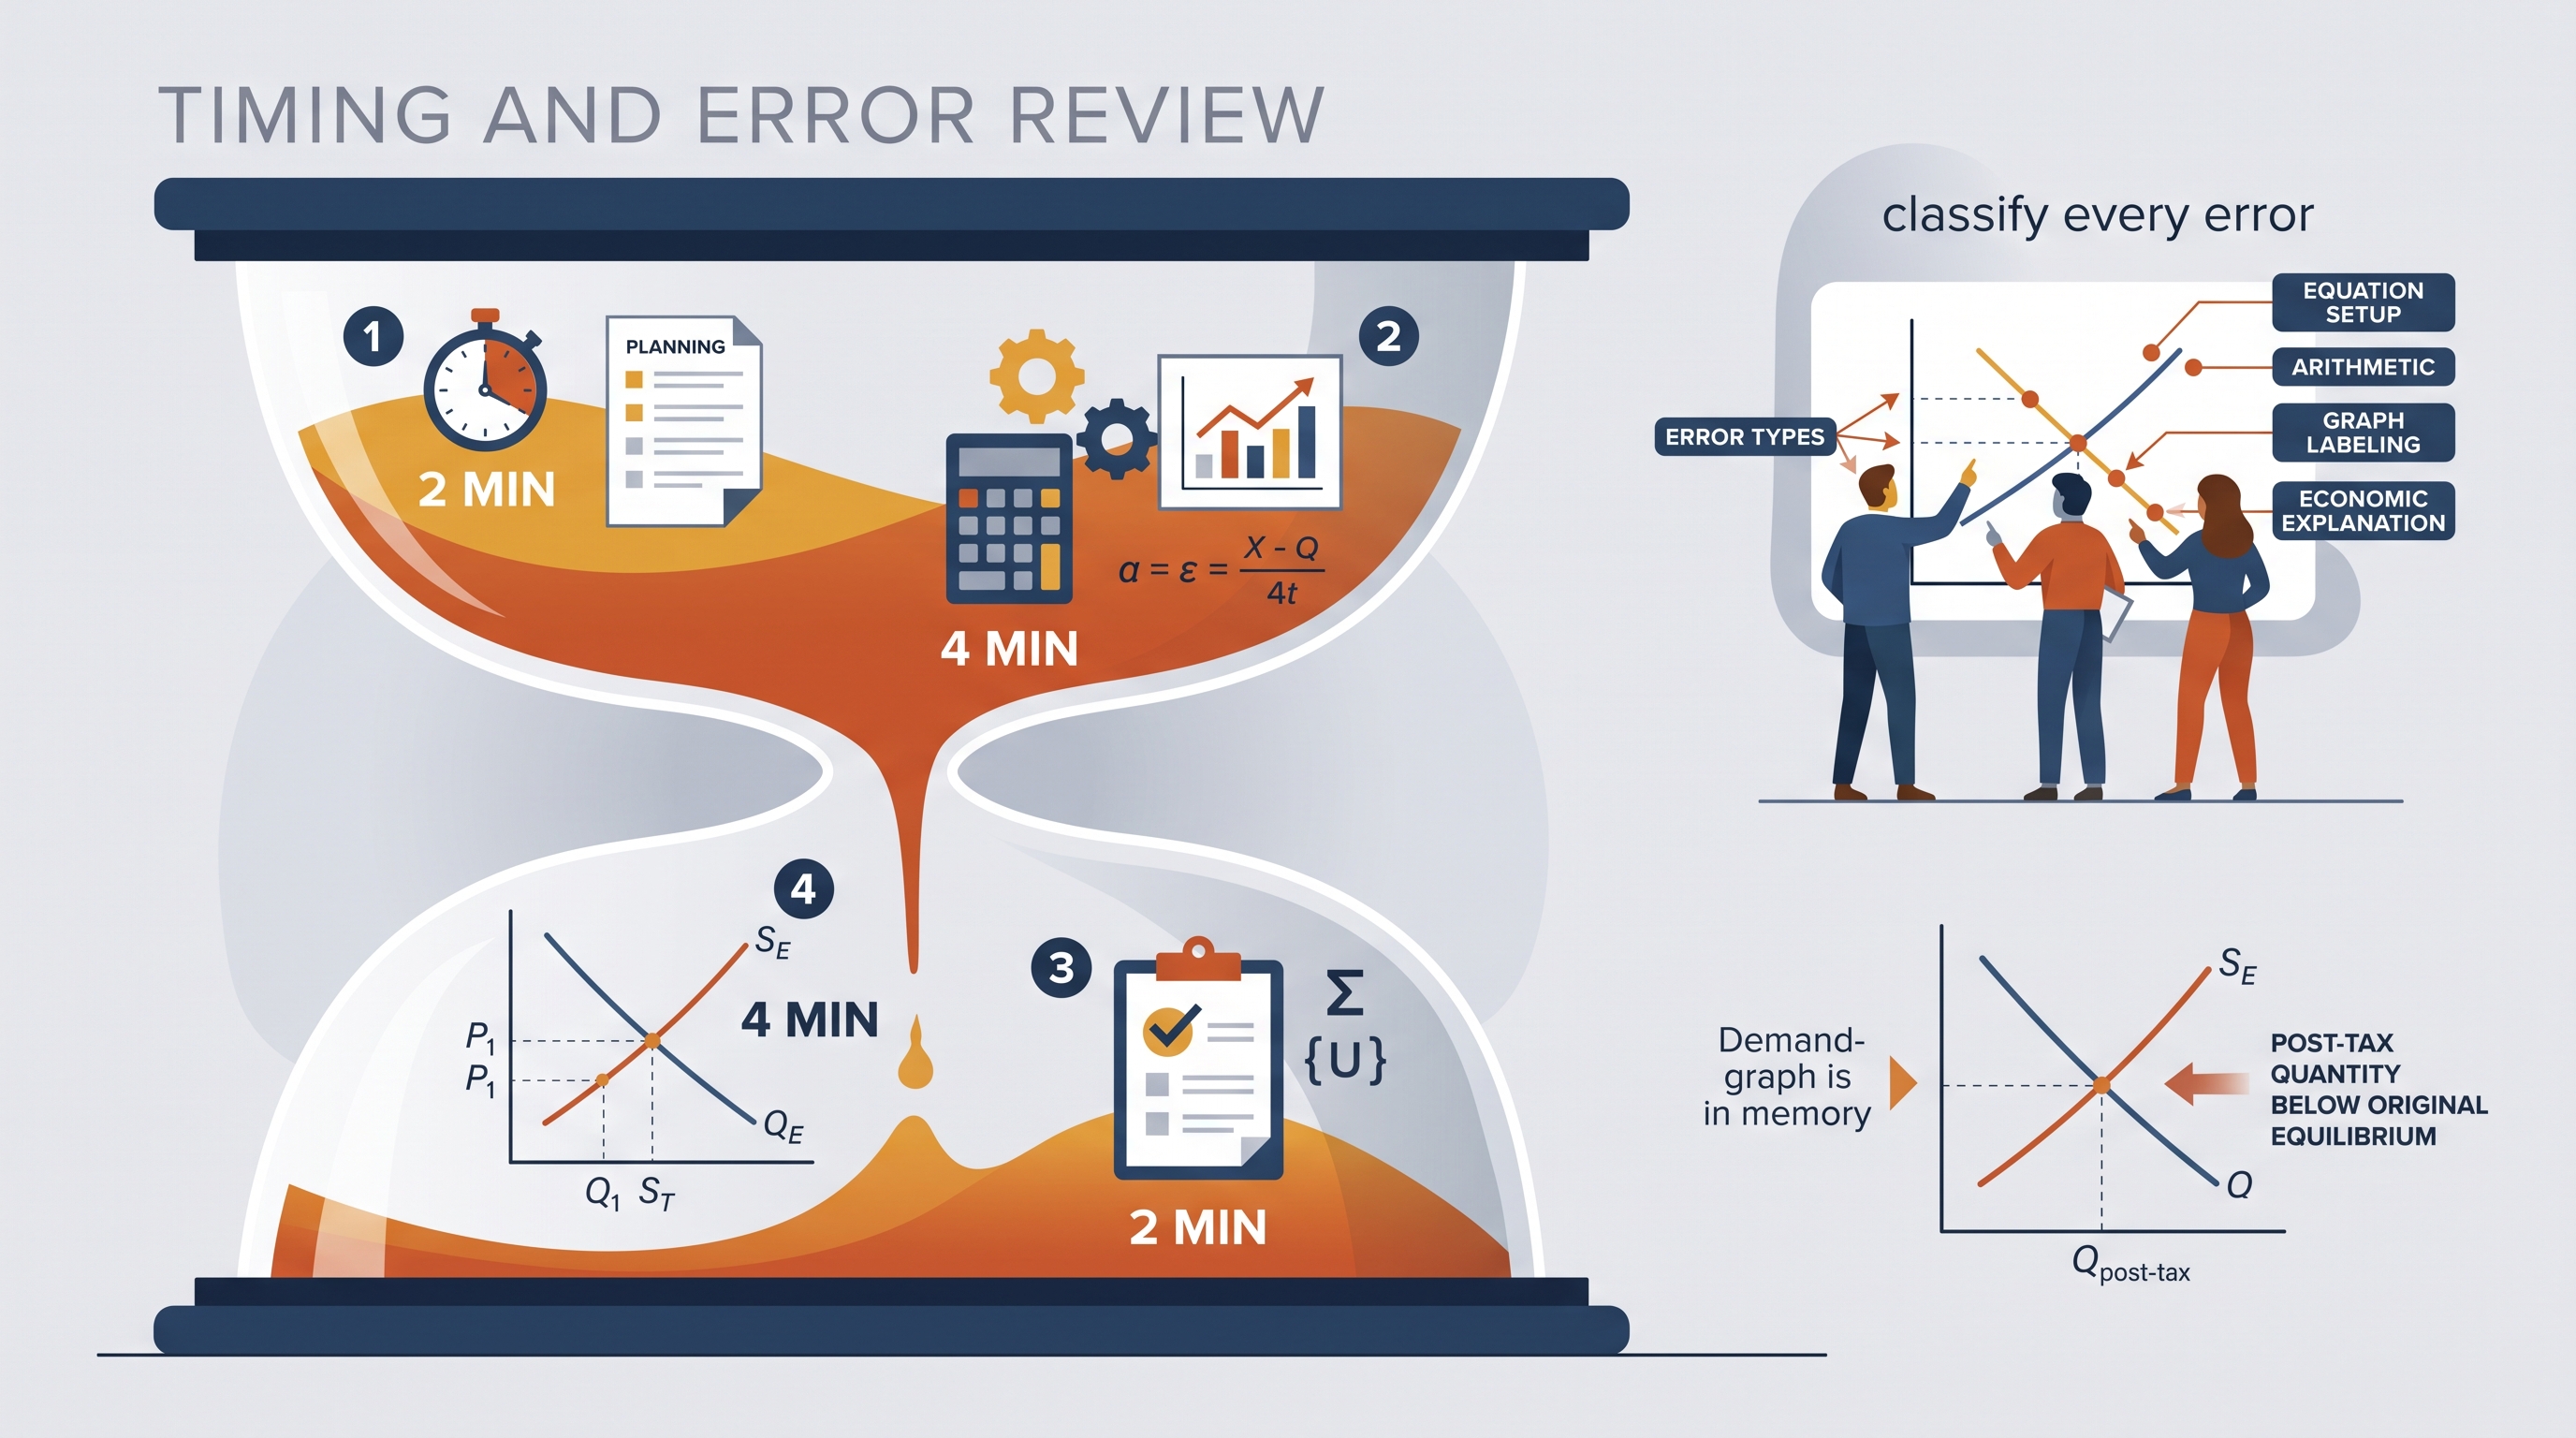
Allow approximately 12 minutes: $2$ minutes to read and plan, $4$ minutes for calculations, $4$ minutes for the graph and explanation, and $2$ minutes to check labels and units. Afterward, classify every error as one of four types: equation setup, arithmetic, graph labeling, or economic explanation. Redraw the graph from memory and explain, in one sentence, why the post-tax quantity must be below the original equilibrium quantity.
Source Materials
- AP Microeconomics Course and Exam Description
- AP Microeconomics Course and Exam Description Clarifications and Corrections
- AP Microeconomics Course Overview
- AP Microeconomics Course at a Glance
- AP Microeconomics Course at a Glance Poster
- AP Microeconomics
- AP Microeconomics
- AP Microeconomics Sample Syllabus 1
- AP Microeconomics-AP Students-College Board
- AP/College Microeconomics-Khan Academy
- AP Microeconomics Exam Questions-AP Central-College Board
- AP Microeconomics Practice FRQ Questions-ReviewEcon