From the free course AP Microeconomics on Lykke
4.4 Monopolistic Competition** `[PRD]`
Key concepts: Monopolistic competition · Demand curve · Average total cost (ATC) curve · Strategic interaction between firms · Advertising decisions · Pricing decisions · Payoff matrix · Company A and Company B · Advertise versus not advertise · Raise price versus keep price the same
Monopolistic competition describes a market with many firms selling products that are similar but not identical. A coffee shop, neighborhood restaurant, athletic-shoe brand, or streaming service has some control over its own price because customers may prefer its particular design, location, flavor, or…
4.4 Monopolistic Competition** [PRD]
Monopolistic competition describes a market with many firms selling products that are similar but not identical. A coffee shop, neighborhood restaurant, athletic-shoe brand, or streaming service has some control over its own price because customers may prefer its particular design, location, flavor, or reputation—but close substitutes limit that control.
Investigative question: How can a market contain many competing firms and still allow each firm to face a downward-sloping demand curve?
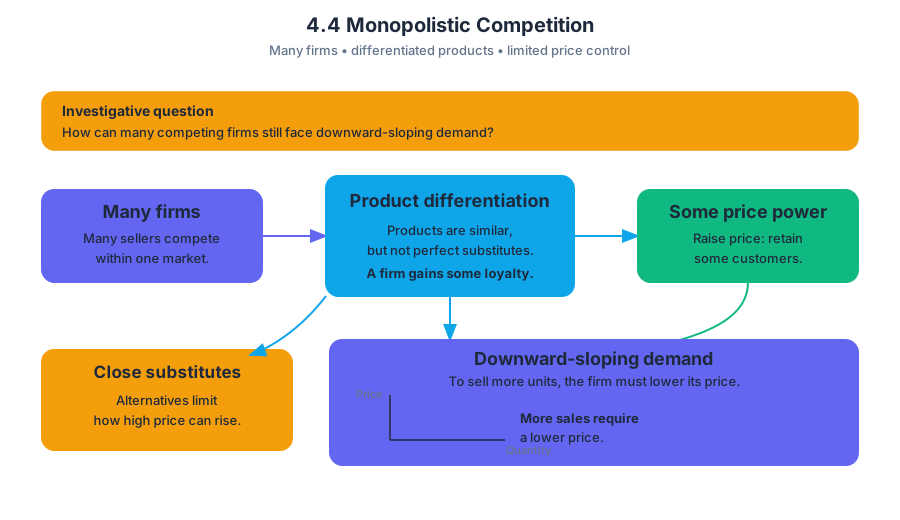
The answer is product differentiation: firms make their products distinct in the minds of consumers. Because the products are not perfect substitutes, a firm can raise its price and retain some customers. However, because alternatives exist, the firm must lower its price to sell more units. This is the key imperfect-competition result represented by a downward-sloping demand curve.
The market structure
| Feature | Monopolistic competition |
|---|---|
| Number of firms | Many |
| Product | Differentiated, but substitutable |
| Firm’s demand curve | Downward sloping |
| Entry and exit | Relatively easy in the long run |
| Strategic dependence | Usually limited compared with oligopoly |
| Long-run economic profit | Driven toward zero by entry |
The firm has market power, meaning the ability to influence its own price. Market power does not mean unlimited pricing power: a café charging far more than nearby cafés will lose customers. In this structure, branding, design, service, location, and advertising can make a firm’s demand less sensitive to price, but they do not eliminate competition.
These characteristics align with PRD-3.B.1, which identifies monopolistic competition as one of the imperfectly competitive output-market structures. They also reflect PRD-3.B.2: in an imperfectly competitive output market, the firm must lower price to sell additional units.
Short-run pricing and the demand–ATC diagram
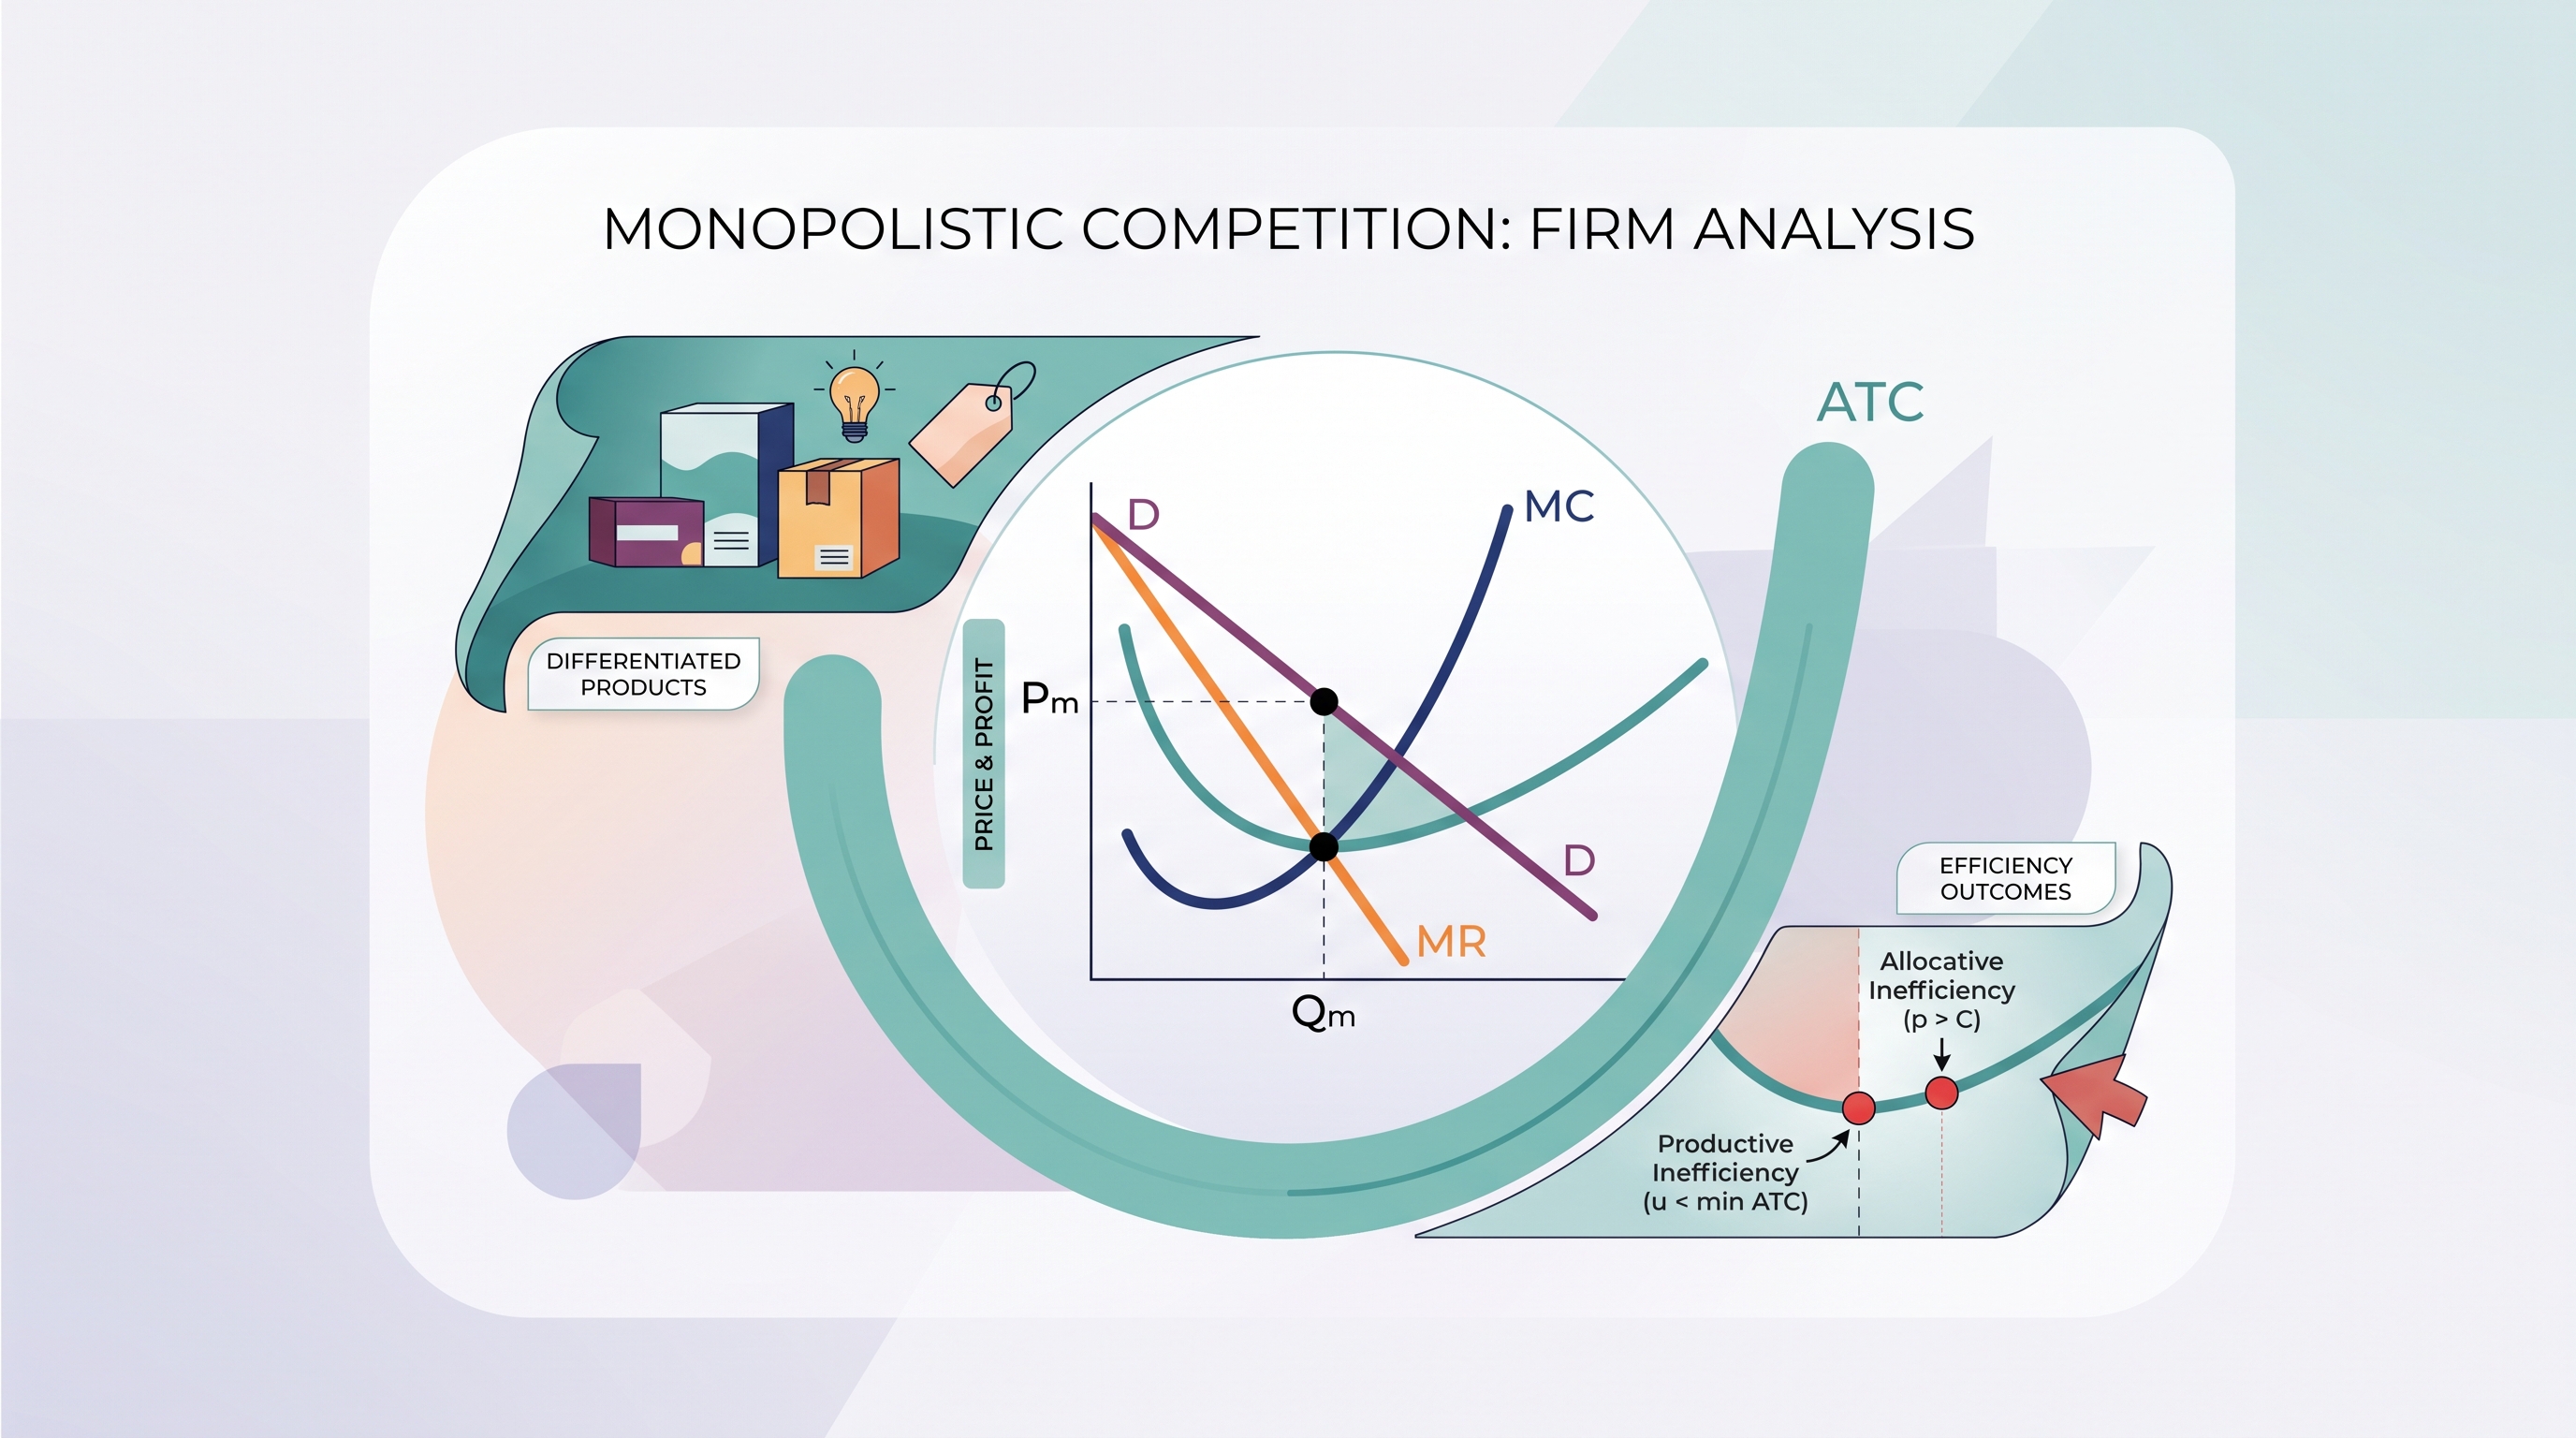
In the short run, the firm chooses its profit-maximizing quantity where marginal revenue equals marginal cost:
$$MR = MC$$
The firm then moves vertically from that quantity to its downward-sloping demand curve to find the price. Average total cost, or ATC, is total cost per unit:
$$ATC = \frac{TC}{Q}$$
Economic profit is shown by the rectangle between price and ATC at the chosen quantity:
$$\text{Economic profit} = (P - ATC)\times Q$$
If $P>ATC$, the firm earns economic profit. If $P<ATC$, it experiences an economic loss. If $P=ATC$, it earns zero economic profit—also called a normal profit, because the firm covers both explicit and implicit costs.
Worked example: A specialty sandwich shop faces a downward-sloping demand curve. Its $MR$ curve intersects $MC$ at $Q=40$ sandwiches. At that quantity, the demand curve shows $P=$12$, while the ATC curve shows $ATC=$9$.
$$\text{Profit}=($12-$9)\times 40=$120$$
The firm does not choose $Q$ by looking for the lowest point on ATC. It first uses $MR=MC$ to choose output, then uses demand to determine price, and finally compares price with ATC.
Long-run adjustment and excess capacity
When firms earn economic profit, entry attracts new competitors. Each incumbent loses some customers, so its demand curve shifts left and typically becomes more elastic. Entry continues until the representative firm’s demand curve is tangent to its ATC curve at the profit-maximizing quantity.
In long-run equilibrium:
$$P=ATC$$
Economic profit is therefore zero, but the firm generally produces less than the output that minimizes ATC. This unused production potential is called excess capacity. The firm has not reached the lowest possible per-unit cost because product variety and differentiation allow it to maintain a small amount of market power.
A common graphing error is to draw the firm’s demand curve tangent to ATC at ATC’s minimum point. That describes productive efficiency, not the usual long-run outcome under monopolistic competition. The important visual relationship is tangency away from the minimum point of ATC.
Advertising and strategic decisions
Advertising can shift a firm’s demand curve to the right by attracting customers, or make demand less elastic by strengthening brand loyalty. But advertising is costly. A firm should advertise when the additional revenue generated by attracting or retaining customers exceeds the additional cost.
Pricing and advertising can also interact. Consider two companies whose decisions affect one another. Each payoff cell lists Company B’s payoff first and Company A’s payoff second.
| Company B’s decision / Company A’s decision | A keeps price the same | A raises price |
|---|---|---|
| B advertises | $($50,-$2)$ | $($175,$0)$ |
| B does not advertise | $($150,$15)$ | $($100,$0)$ |
For Company B, advertising produces $$50$ when A keeps its price unchanged and $$175$ when A raises its price. Not advertising produces $$150$ and $$100$, respectively. Therefore, B’s best response depends on A’s action: B prefers not advertising if A keeps its price the same, but prefers advertising if A raises its price. This is a useful reminder that a payoff matrix should not be read by comparing numbers across the entire table without first holding the other player’s action constant.
The matrix illustrates interdependence between firms’ decisions, while the demand–ATC model explains a single firm’s price, output, and profit. Do not automatically treat every differentiated market as an oligopoly: monopolistic competition has many firms, whereas oligopoly has only a few strategically interdependent firms.
AP graphing skill and misconceptions
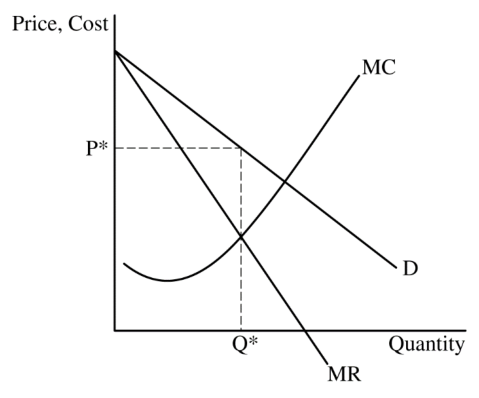
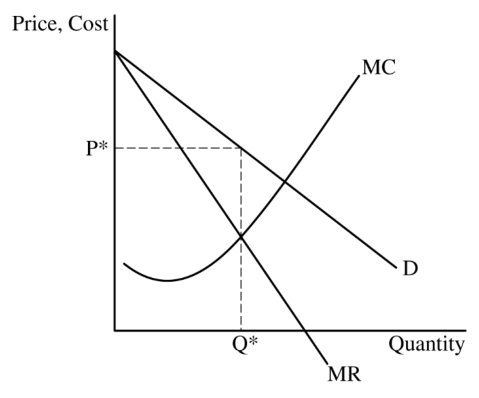
Skill 4.B — “Demonstrate your understanding of a specific economic situation on an accurately labeled graph or visual.” For a monopolistically competitive firm, label the vertical axis as price/cost/revenue and the horizontal axis as quantity; draw downward-sloping $D$ and $MR$, a $U$-shaped $ATC$, and an upward-sloping $MC$. Mark the $MR=MC$ quantity, read price from $D$, and show profit or loss using the vertical gap between $P$ and $ATC$.
Misconception check: “Zero economic profit means the firm earns no money.” False. Zero economic profit means total revenue covers explicit costs and opportunity costs. The owner may still receive accounting profit and compensation for the resources supplied.
Retrieval check: A long-run monopolistically competitive firm faces $P=$18$ and $ATC=$18$ at its profit-maximizing output. Does it earn economic profit? Is the outcome productively efficient? Answer: It earns zero economic profit, but it is generally not productively efficient because output is below the minimum-ATC quantity.
Source Materials
- AP Microeconomics Course and Exam Description
- AP Microeconomics Course and Exam Description Clarifications and Corrections
- AP Microeconomics Course Overview
- AP Microeconomics Course at a Glance
- AP Microeconomics Course at a Glance Poster
- AP Microeconomics
- AP Microeconomics
- AP Microeconomics Sample Syllabus 1
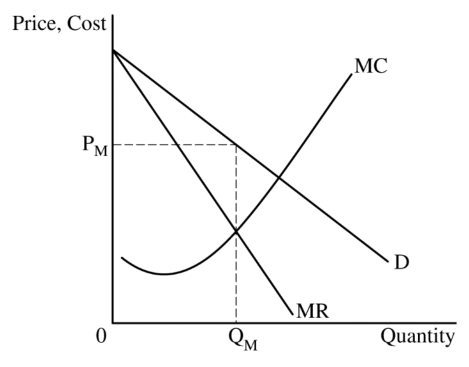
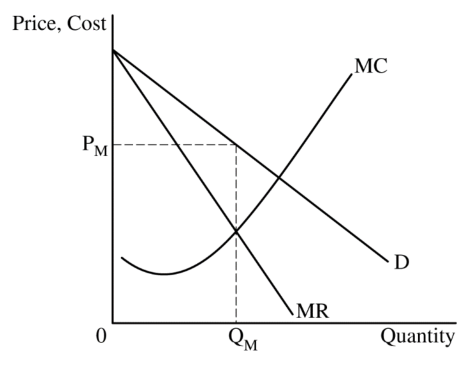
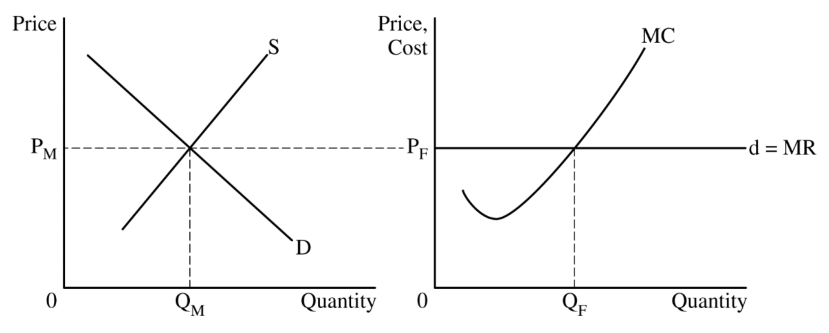
- For the fourth point, the graph must show the average total cost (ATC) curve below PM at QM and the MC curve passing through the minimum point of the ATC curve.
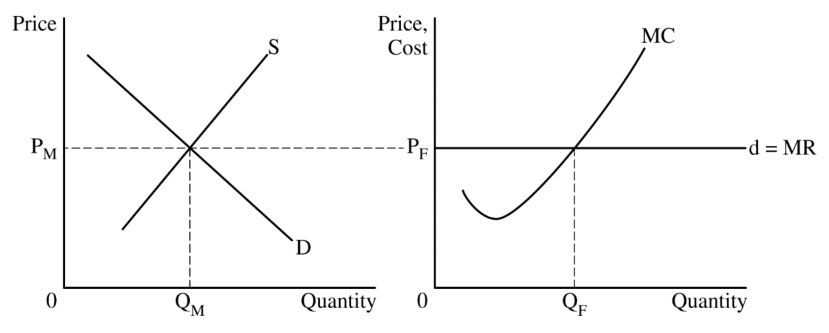
- For the fourth point, the firm’s graph must show the average total cost (ATC) curve below the firm’s demand curve at QF and show the MC curve passing through the minimum point of the ATC curve.