From the free course AP Microeconomics on Lykke
6.2 Externalities** `[POL]`
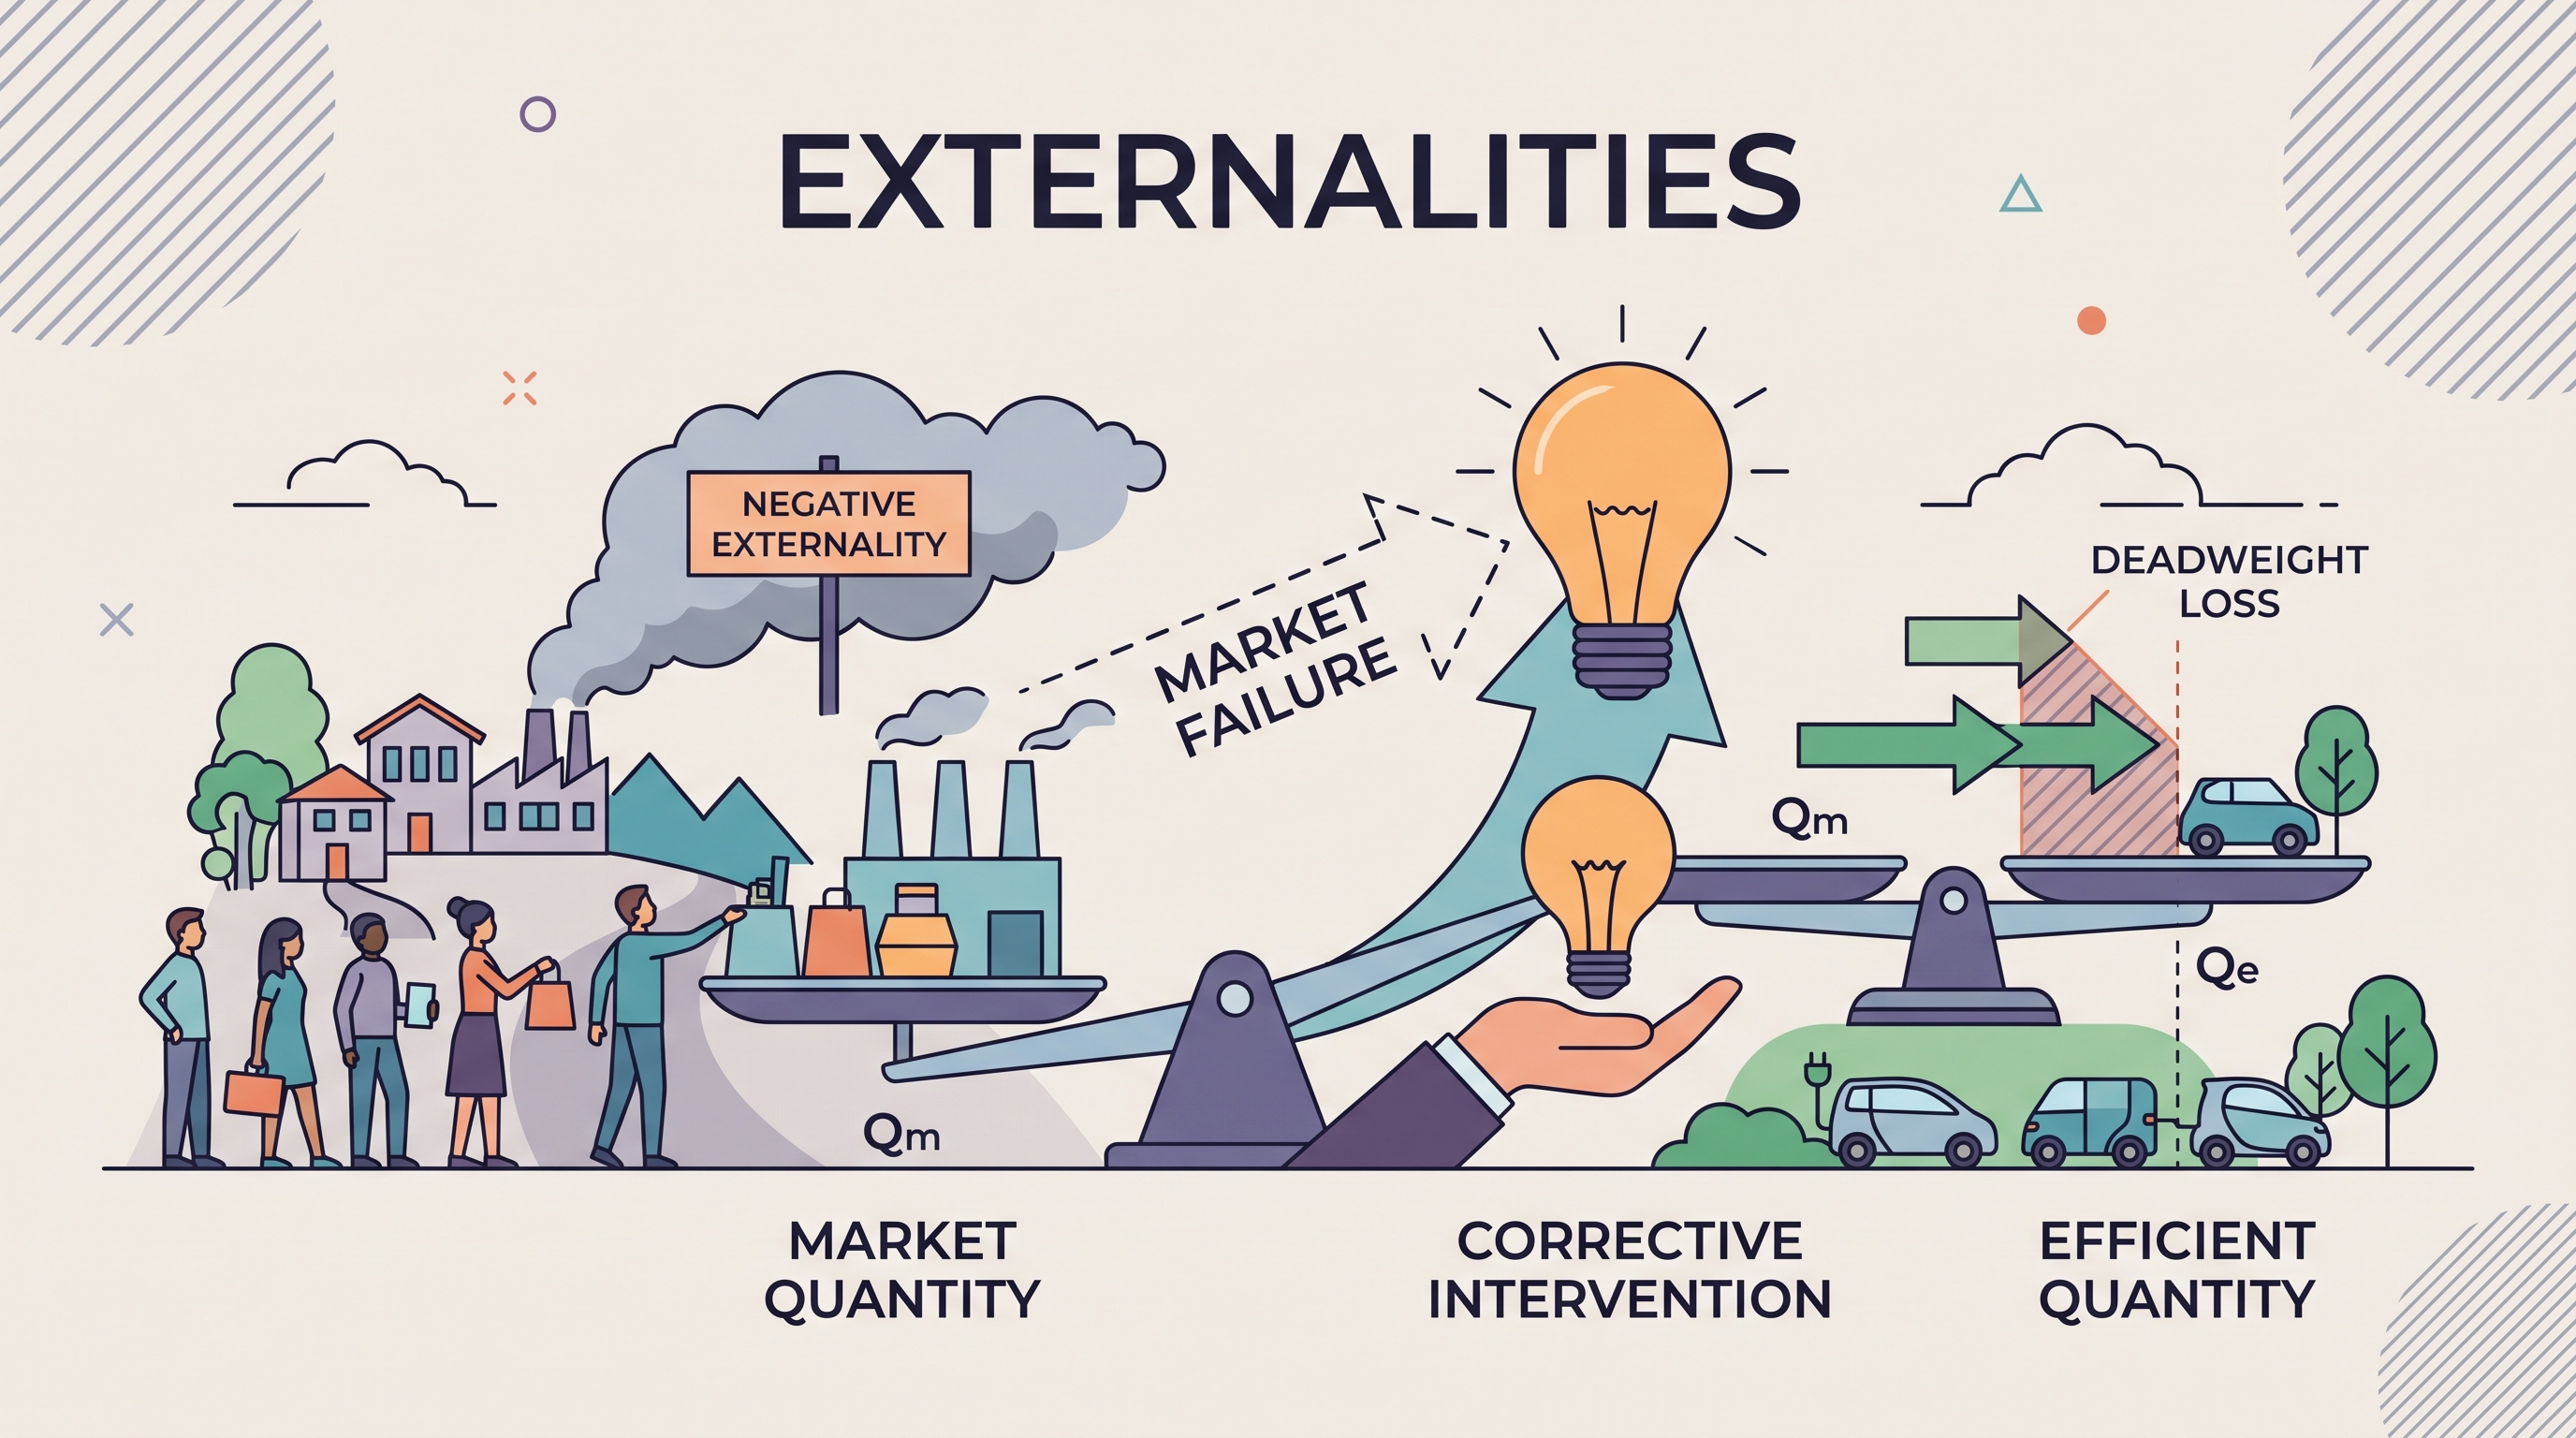
A factory can make every buyer and seller better off while making nearby residents worse off through polluted air. That unintended effect on someone outside the transaction is an externality—a cost or benefit imposed on a third party who is not part of the market exchange.
6.2 Externalities** [POL]
A factory can make every buyer and seller better off while making nearby residents worse off through polluted air. That unintended effect on someone outside the transaction is an externality—a cost or benefit imposed on a third party who is not part of the market exchange.
Externality: A side effect of production or consumption that affects a third party and is not reflected in the market price.
Externalities explain why a market can produce the “wrong” quantity even when buyers and sellers act rationally. The key question is whether the market price captures the full social cost or benefit of the activity.
The four-part externality map
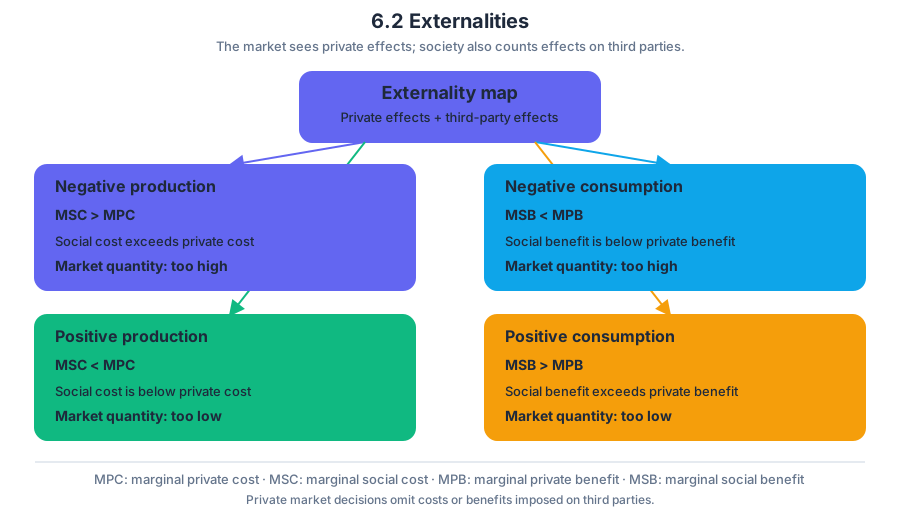
The private market considers only the costs and benefits experienced by the buyer and seller. Society considers those private effects plus the external effect on third parties.
| Situation | Relationship | Typical result |
|---|---|---|
| Negative externality in production | Social cost exceeds private cost: $MSC > MPC$ | Market quantity is too high |
| Negative externality in consumption | Social benefit is below private benefit: $MSB < MPB$ | Market quantity is too high |
| Positive externality in production | Social cost is below private cost: $MSC < MPC$ | Market quantity is too low |
| Positive externality in consumption | Social benefit exceeds private benefit: $MSB > MPB$ | Market quantity is too low |
Here, $MPC$ means marginal private cost, the additional cost paid by the producer; $MSC$ means marginal social cost, the additional cost to everyone; $MPB$ means marginal private benefit, the additional benefit received by the consumer; and $MSB$ means marginal social benefit, the total benefit to society.
Negative externalities: too much activity
Suppose a plant produces electricity while releasing smoke that damages nearby homes. The plant’s supply curve reflects its private production costs, so it represents $MPC$. The pollution creates an additional cost for residents. Adding that external cost shifts the relevant social-cost curve above the private-cost curve:
$$ MSC = MPC + \text{marginal external cost} $$
At the unregulated market equilibrium, buyers compare their private benefit with $MPC$. Because the pollution cost is ignored, the market produces $Q_M$, which exceeds the socially efficient quantity $Q^$. The units between $Q^$ and $Q_M$ create more harm than benefit, producing deadweight loss.
Worked example. A market for industrial cleaning solvent has a private equilibrium of $P_M = $8$ and $Q_M = 1{,}000$ units. Each unit creates $2$ of external damage to local water quality. At every quantity,
$$ MSC = MPC + $2 $$
The social-cost curve lies above the private supply curve. The efficient quantity is therefore lower than $1{,}000$ units, because the market must account for the additional water-quality damage. A corrective policy could make producers pay approximately $2 per unit, causing the private decision to reflect the full social cost.
Positive externalities: too little activity
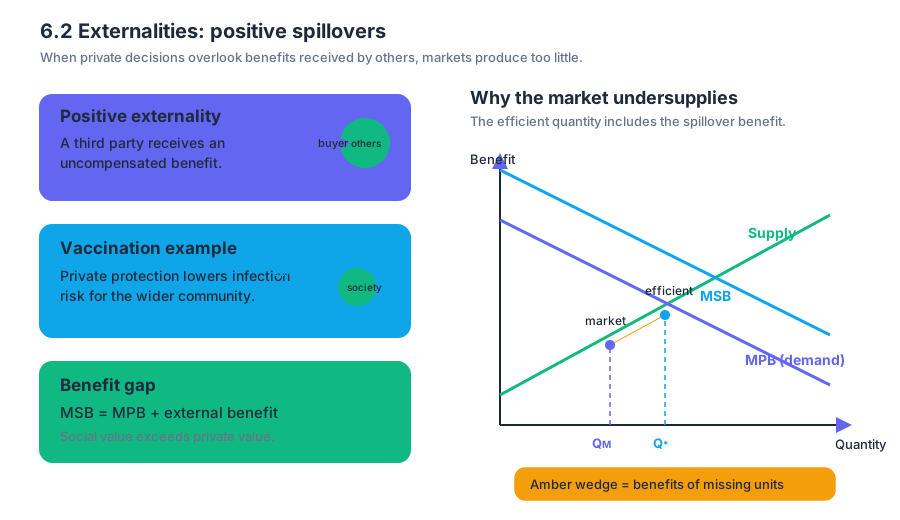
A positive externality occurs when a third party receives an uncompensated benefit. Vaccination is a familiar example: the person vaccinated receives protection, while other people also face a lower risk of infection. The total benefit exceeds the consumer’s private benefit:
$$ MSB = MPB + \text{marginal external benefit} $$
Because consumers consider only $MPB$, the market demand curve lies below $MSB$. The market produces $Q_M$, while the socially efficient quantity $Q^$ is larger. The missing units between $Q_M$ and $Q^$ provide benefits to society that exceed their production cost.
Policies that internalize externalities
Internalizing an externality means changing incentives so that decision-makers take the external cost or benefit into account. A per-unit tax on an activity with a negative externality raises producers’ private cost. A subsidy for an activity with a positive externality raises the private benefit or lowers the private cost.
For a negative production externality, a corrective tax shifts the supply curve upward or leftward by the tax amount. For a positive consumption externality, a subsidy shifts demand upward or rightward. In each case, the policy attempts to move the market quantity toward $Q^*$ rather than simply changing the price for its own sake.
Other possible responses include regulation, legally assigned property rights, or tradable pollution permits. The best policy depends on enforcement costs, measurement accuracy, and whether the external damage varies across producers. A tax equal to marginal external cost is conceptually precise, but governments may not know that cost exactly.
Misconception check
Misconception: “Any pollution means the correct quantity is zero.” Not necessarily. The efficient quantity balances marginal benefit against marginal social cost. Some production may be worthwhile when the benefit of the final unit still exceeds its total social cost; the goal is to eliminate excessive pollution, not automatically all production.
AP skill and retrieval check
This topic is associated with [POL] and Skill 4: Graphing and Visuals. For an externality graph, label both private and social curves, identify the market and efficient quantities, show the direction of the policy shift, and mark the deadweight-loss region when requested. The graph must communicate the causal chain: unpriced external effect $\rightarrow$ market failure $\rightarrow$ corrective intervention.
Quick check: A product creates a $3$ marginal external benefit per unit, but consumers consider only their private benefit. Should the socially efficient quantity be greater than, less than, or equal to the market quantity? Answer: greater, because $MSB = MPB + $3$, so the market understates the total benefit of consumption.
Source Materials
- AP Microeconomics Course and Exam Description
- AP Microeconomics Course and Exam Description Clarifications and Corrections
- AP Microeconomics Course Overview
- AP Microeconomics Course at a Glance
- AP Microeconomics Course at a Glance Poster
- AP Microeconomics
- AP Microeconomics
- AP Microeconomics Sample Syllabus 1