From the free course AP Microeconomics on Lykke
Course Framework, Skills and Reasoning Processes
Key concepts: AP course framework · College-level microeconomics · Individual economic decision-makers · Big ideas and cross-cutting concepts · Conceptual understandings · Course skills and skill categories · Skill transfer and repetition · Unit sequencing and pacing · Instructional scaffolding · Student assessment and actionable feedback
AP Microeconomics studies how individual economic decision-makers—consumers, workers, and firms—make choices when resources are scarce. Its central move is to use economic principles and models to describe a situation, predict an outcome, and explain that outcome with words, graphs, charts, or data.
Course Framework, Skills and Reasoning Processes
AP Microeconomics studies how individual economic decision-makers—consumers, workers, and firms—make choices when resources are scarce. Its central move is to use economic principles and models to describe a situation, predict an outcome, and explain that outcome with words, graphs, charts, or data.
Course framework: The organized statement of the content, conceptual understandings, and skills students are expected to know and use.
The framework is designed for an introductory college-level course. It identifies required knowledge and reasoning without prescribing one fixed curriculum: teachers may sequence the six units differently, but students must encounter the required content and develop the associated skills.
The framework’s three layers
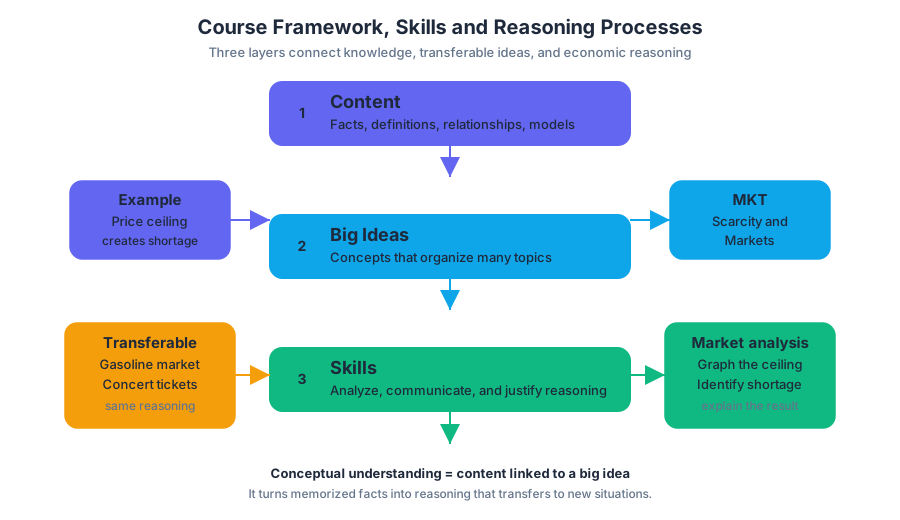
The framework connects three layers of understanding:
| Layer | What it contributes | Microeconomics example |
|---|---|---|
| Content | The facts, definitions, relationships, and models | A binding price ceiling creates a shortage |
| Big ideas | Cross-cutting concepts that organize many topics | MKT: Scarcity and Markets |
| Skills | The actions used to analyze and communicate economic reasoning | Graph the ceiling, identify the shortage, and explain the result |
A conceptual understanding is the durable relationship that links content to a big idea and makes the content usable in a new situation. It is more powerful than memorizing an isolated fact. For example, “a tax creates a wedge between the price buyers pay and the price sellers receive” is content; the conceptual understanding is that government intervention changes incentives and therefore alters market outcomes, surplus, and efficiency. That understanding can transfer from a market for gasoline to a market for concert tickets.
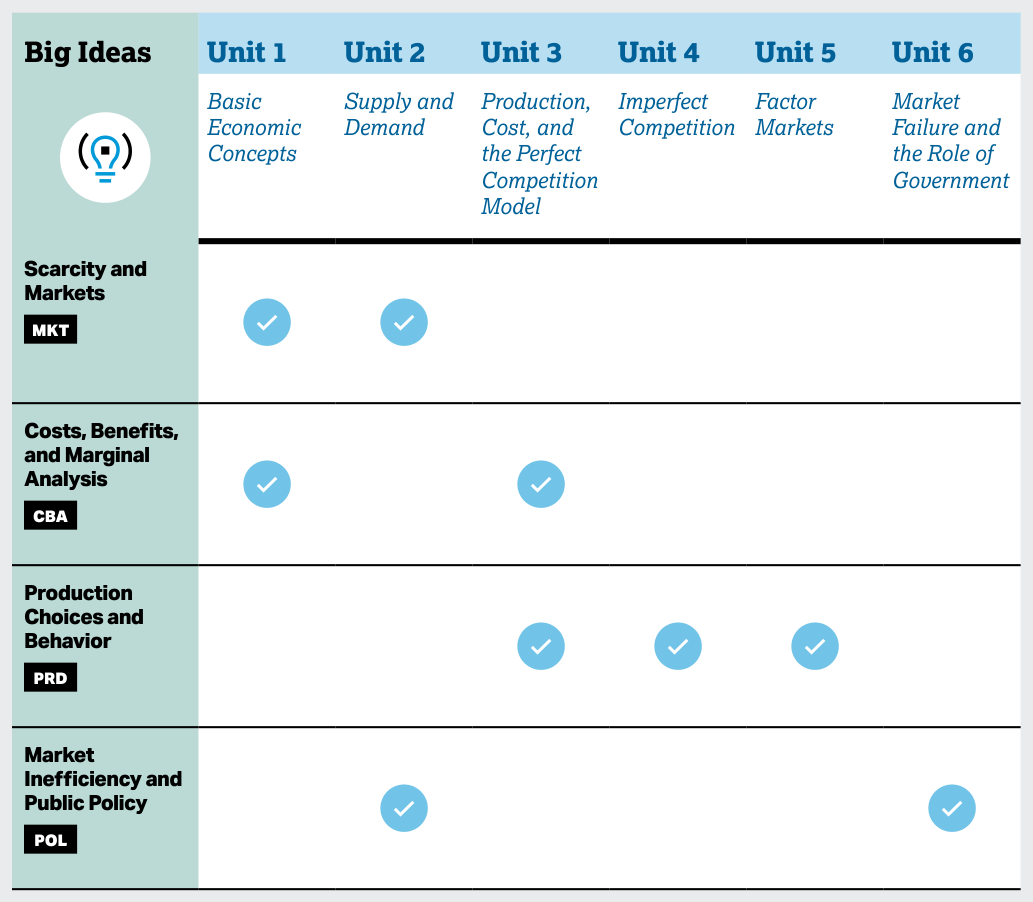
The four course-wide Big Ideas are:
- MKT: Scarcity and Markets — choices arise because resources are limited, and markets coordinate many individual decisions.
- CBA: Costs, Benefits, and Marginal Analysis — rational decision-makers compare additional benefits with additional costs.
- PRD: Production Choices and Behavior — firms choose inputs, output, and market strategies in pursuit of economic goals.
- POL: Market Inefficiency and Public Policy — markets can produce inefficient or inequitable outcomes, creating questions about intervention.
These ideas recur across units rather than belonging to only one topic. For instance, a pollution externality is POL, but analyzing it also uses CBA because the socially efficient quantity balances marginal social benefit and marginal social cost.
The four course skill categories
Skill Category 1: Principles and Models requires students to identify and explain economic concepts, principles, and models. A student might define opportunity cost, state the profit-maximization rule, or explain why a perfectly competitive firm is a price taker.
Skill Category 2: Interpretation requires students to explain an economic outcome in a specific context. The task is not merely to name “shortage,” but to connect a binding price ceiling to excess quantity demanded and explain what that means for buyers and sellers.
Skill Category 3: Manipulation requires students to determine how a change affects an economic situation. Examples include tracing a demand shift, calculating a new equilibrium, determining the effect of a wage change on labor demand, or identifying how a tariff changes domestic market outcomes.
Skill Category 4: Graphing and Visuals requires students to represent and analyze economic relationships with correctly labeled graphs, charts, and other visual tools. A complete graph communicates variables, curves, equilibrium points, shifts, and relevant areas such as consumer or producer surplus.
These skills work together. On a free-response question, a student may identify a negative externality using Principles and Models, explain the inefficient outcome through Interpretation, determine the effect of a corrective policy through Manipulation, and show the result on a graph through Graphing and Visuals. Multiple-choice questions can test any one skill or combine several; free-response questions especially reward visible reasoning, accurate calculations, labeled graphs, and contextual explanations.
Units, pacing, and instructional planning
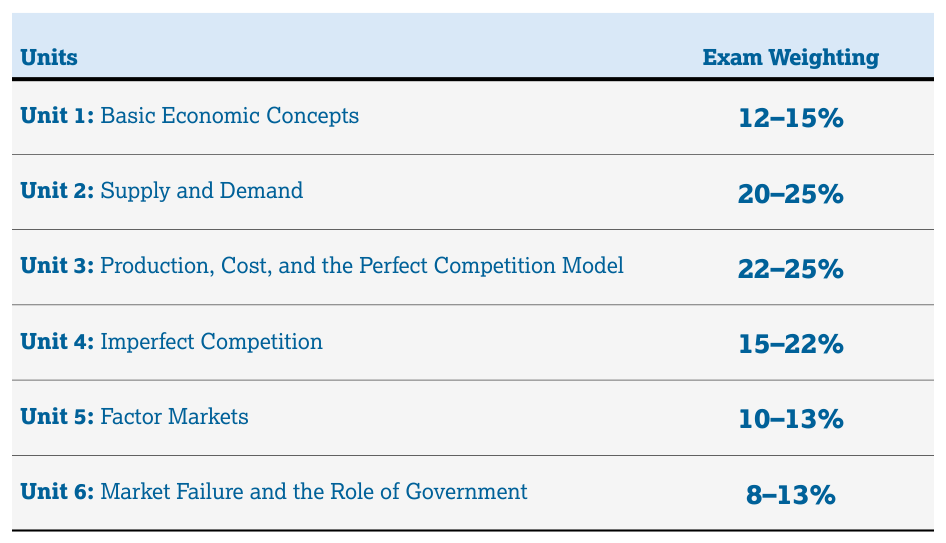
The six-unit sequence moves from individual choice and market foundations toward firms, factor markets, and public policy. The published multiple-choice weighting gives teachers a useful planning signal:
| Unit | Focus | Multiple-choice weighting | Approximate instructional guidance* |
|---|---|---|---|
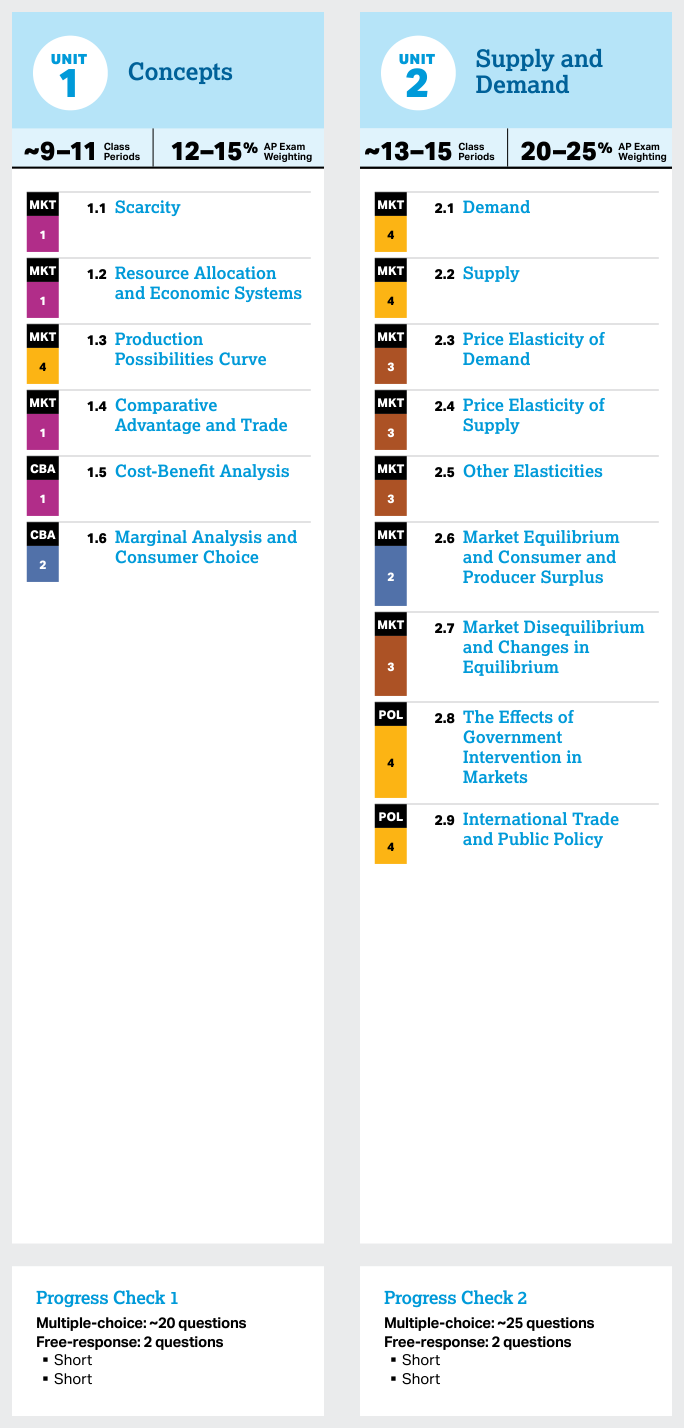
| 1 | Basic Economic Concepts | 12%–15% | 9–11 class periods |
| 2 | Supply and Demand | 20%–25% | 20–22 class periods |
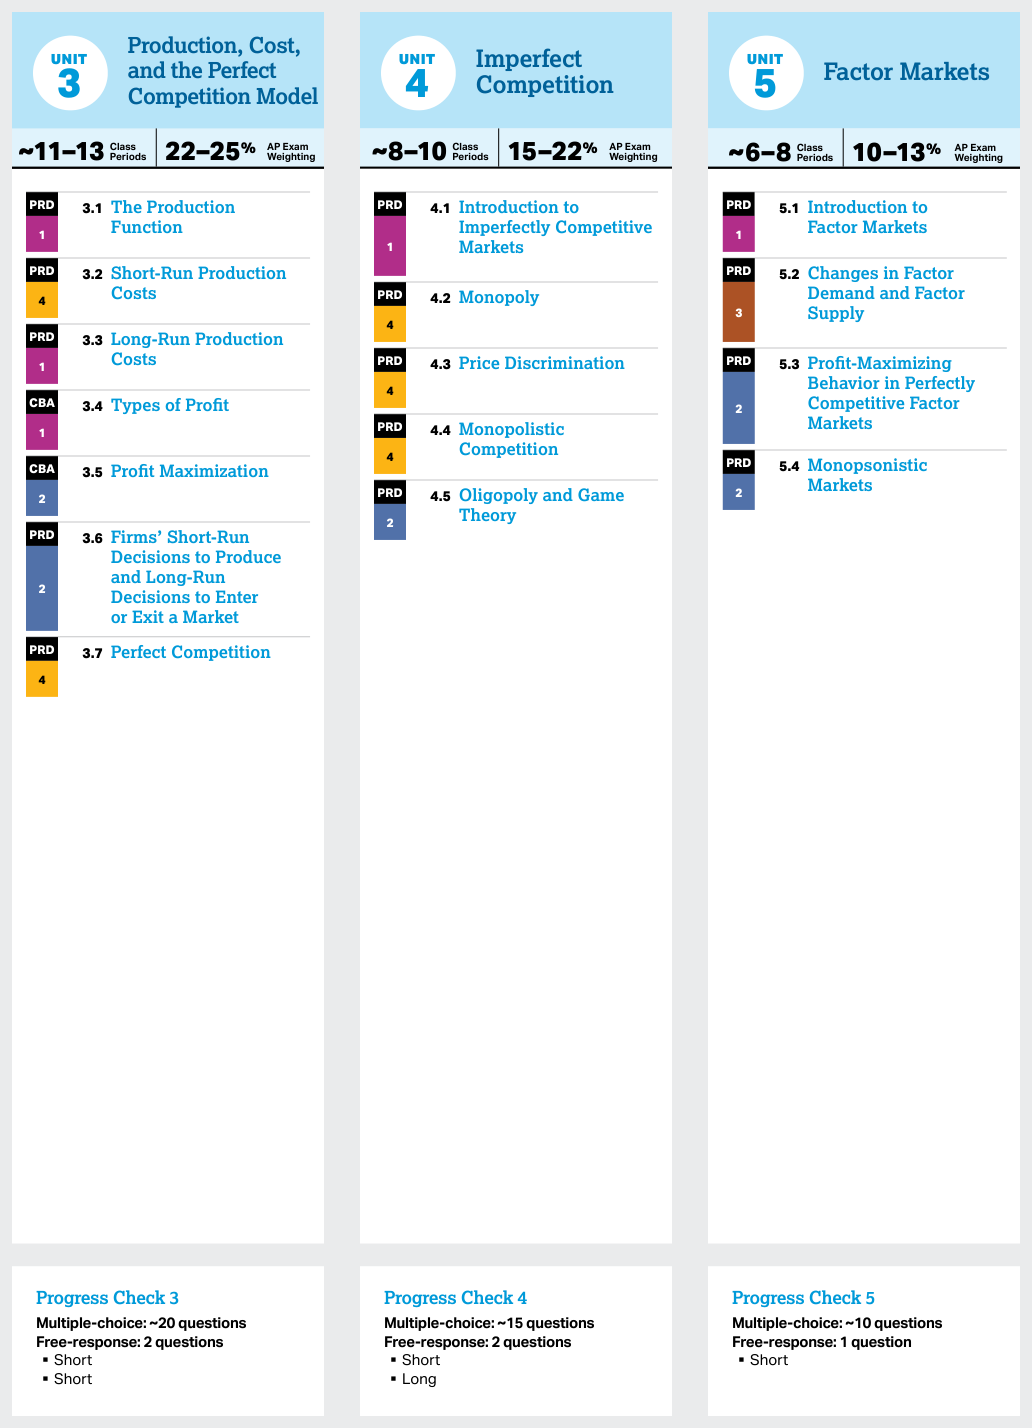
| 3 | Production, Cost, and Perfect Competition | 17%–20% | 18–20 class periods |
| 4 | Imperfect Competition | 15%–18% | 15–17 class periods |
| 5 | Factor Markets | 10%–13% | 10–12 class periods |
| 6 | Market Failure and the Role of Government | 13%–16% | 13–15 class periods |
*These are planning estimates, not required outcomes.
Unit 2 commonly needs extra time because supply, demand, elasticity, equilibrium, intervention, and trade become the graphical and analytical vocabulary used later. Units 3 and 4 also deserve substantial time because students must connect production tables, cost curves, revenue, market structure, and firm behavior. A teacher may shorten a unit when diagnostic evidence shows mastery, or extend it when students need more graphing, calculation, or explanation practice.
A practical pacing cycle is introduce, scaffold, practice, transfer, and assess. Early practice can supply partially labeled graphs or structured calculation steps. Later practice should remove those supports and present unfamiliar contexts so students transfer the same reasoning to a new market. Reserve recurring time for retrieval, cumulative review, and feedback rather than placing all exam preparation at the end.
Planning, teaching, and assessment
The Unit at a Glance table helps teachers locate topics that build toward a common understanding, estimate pacing, and see how Big Ideas and skills spiral across the course. Unit overviews provide essential questions, conceptual understandings, and associated skills; topic pages specify the required content. Teachers should use those relationships to identify where scaffolding is needed—for example, reviewing marginal analysis before asking students to maximize profit.
Assessment should measure both what students know and what they can do with it. AP Classroom Progress Checks, original practice, graph analysis, numerical work, and written explanations can reveal whether an error is conceptual, graphical, computational, or interpretive. Useful feedback names the precise repair: “Your demand shift is correct, but you moved price along the old supply curve incorrectly,” rather than simply marking the response wrong.
The goal is economist-like reasoning: use a model, state the relevant assumption, trace the mechanism, represent the result accurately, and explain its meaning in context. Repeated practice across multiple-choice and free-response formats builds the flexibility needed to apply the same principles to unfamiliar economic situations.



Source Materials
- AP Microeconomics Course and Exam Description
- AP Microeconomics Course and Exam Description Clarifications and Corrections
- AP Microeconomics Course Overview
- AP Microeconomics Course at a Glance
- AP Microeconomics Course at a Glance Poster
- AP Microeconomics
- AP Microeconomics
- AP Microeconomics Sample Syllabus 1
- Figure — AP Microeconomics Course and Exam Description (p. 1)
- Figure — AP Microeconomics Course and Exam Description (p. 17)
- Figure — AP Microeconomics Course and Exam Description (p. 25)
- Figure — AP Microeconomics Course and Exam Description (p. 26)