From the free course AP Microeconomics on Lykke
2.2 Supply** `[MKT]`
A bakery will not automatically produce more bread just because customers want more of it. It produces more when the price it can receive makes the additional production worthwhile.
2.2 Supply** [MKT]
A bakery will not automatically produce more bread just because customers want more of it. It produces more when the price it can receive makes the additional production worthwhile. Supply is the relationship between a good’s price and the quantity producers are willing and able to sell during a given period, holding other relevant factors constant.
Investigative question: Why does a higher selling price usually lead firms to offer more output?
The supply curve: a firm’s selling decision
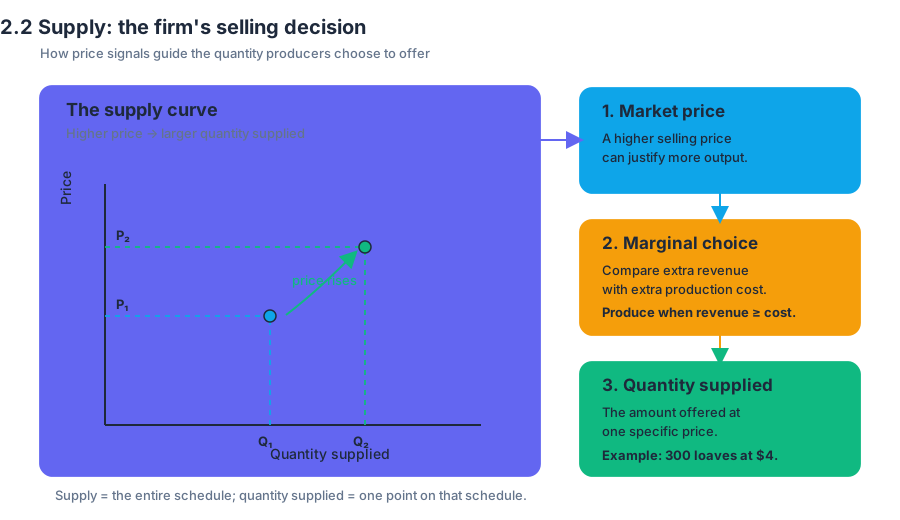
The law of supply states that, all else equal, a higher price causes a larger quantity supplied, while a lower price causes a smaller quantity supplied. Producers compare the additional revenue from selling one more unit with the additional cost of producing it. As output expands, the next units often become more expensive to produce, so a higher market price is needed to justify them.
A quantity supplied is a point-specific amount: for example, a bakery may supply $300$ loaves per day at a price of $$4$ per loaf. Supply is the entire schedule or curve showing quantities supplied at different prices. This distinction is as important as the distinction between one point on a map and the map itself.
Reading a supply schedule
Suppose a food truck has the following daily supply schedule:
| Price per meal | Quantity supplied per day |
|---|---|
| $$5$ | $40$ |
| $$7$ | $60$ |
| $$9$ | $80$ |
| $$11$ | $100$ |
The upward pattern illustrates the law of supply. On a standard graph, price appears on the vertical axis and quantity on the horizontal axis. Moving along the same supply curve from a lower price to a higher price increases quantity supplied; it does not shift the curve.
Worked example: moving along supply
A meal price rises from $$7$ to $$9$. The food truck moves from supplying $60$ meals to supplying $80$ meals per day. The correct explanation is:
$$ \text{higher price} \rightarrow \text{greater quantity supplied} $$
Nothing else in the example changes, so this is a change in quantity supplied, represented by a movement along the supply curve. The change is not called an “increase in supply,” because the entire supply relationship has not changed.
What shifts supply?
A change in supply occurs when a determinant other than the good’s own price changes. The entire supply curve shifts. A rightward shift means producers are willing and able to sell more at every possible price; a leftward shift means they are willing and able to sell less at every possible price.
Important supply shifters include:
- Input prices: Higher prices for flour, fuel, wages, or machinery raise production costs and shift supply left. Lower input prices shift supply right.
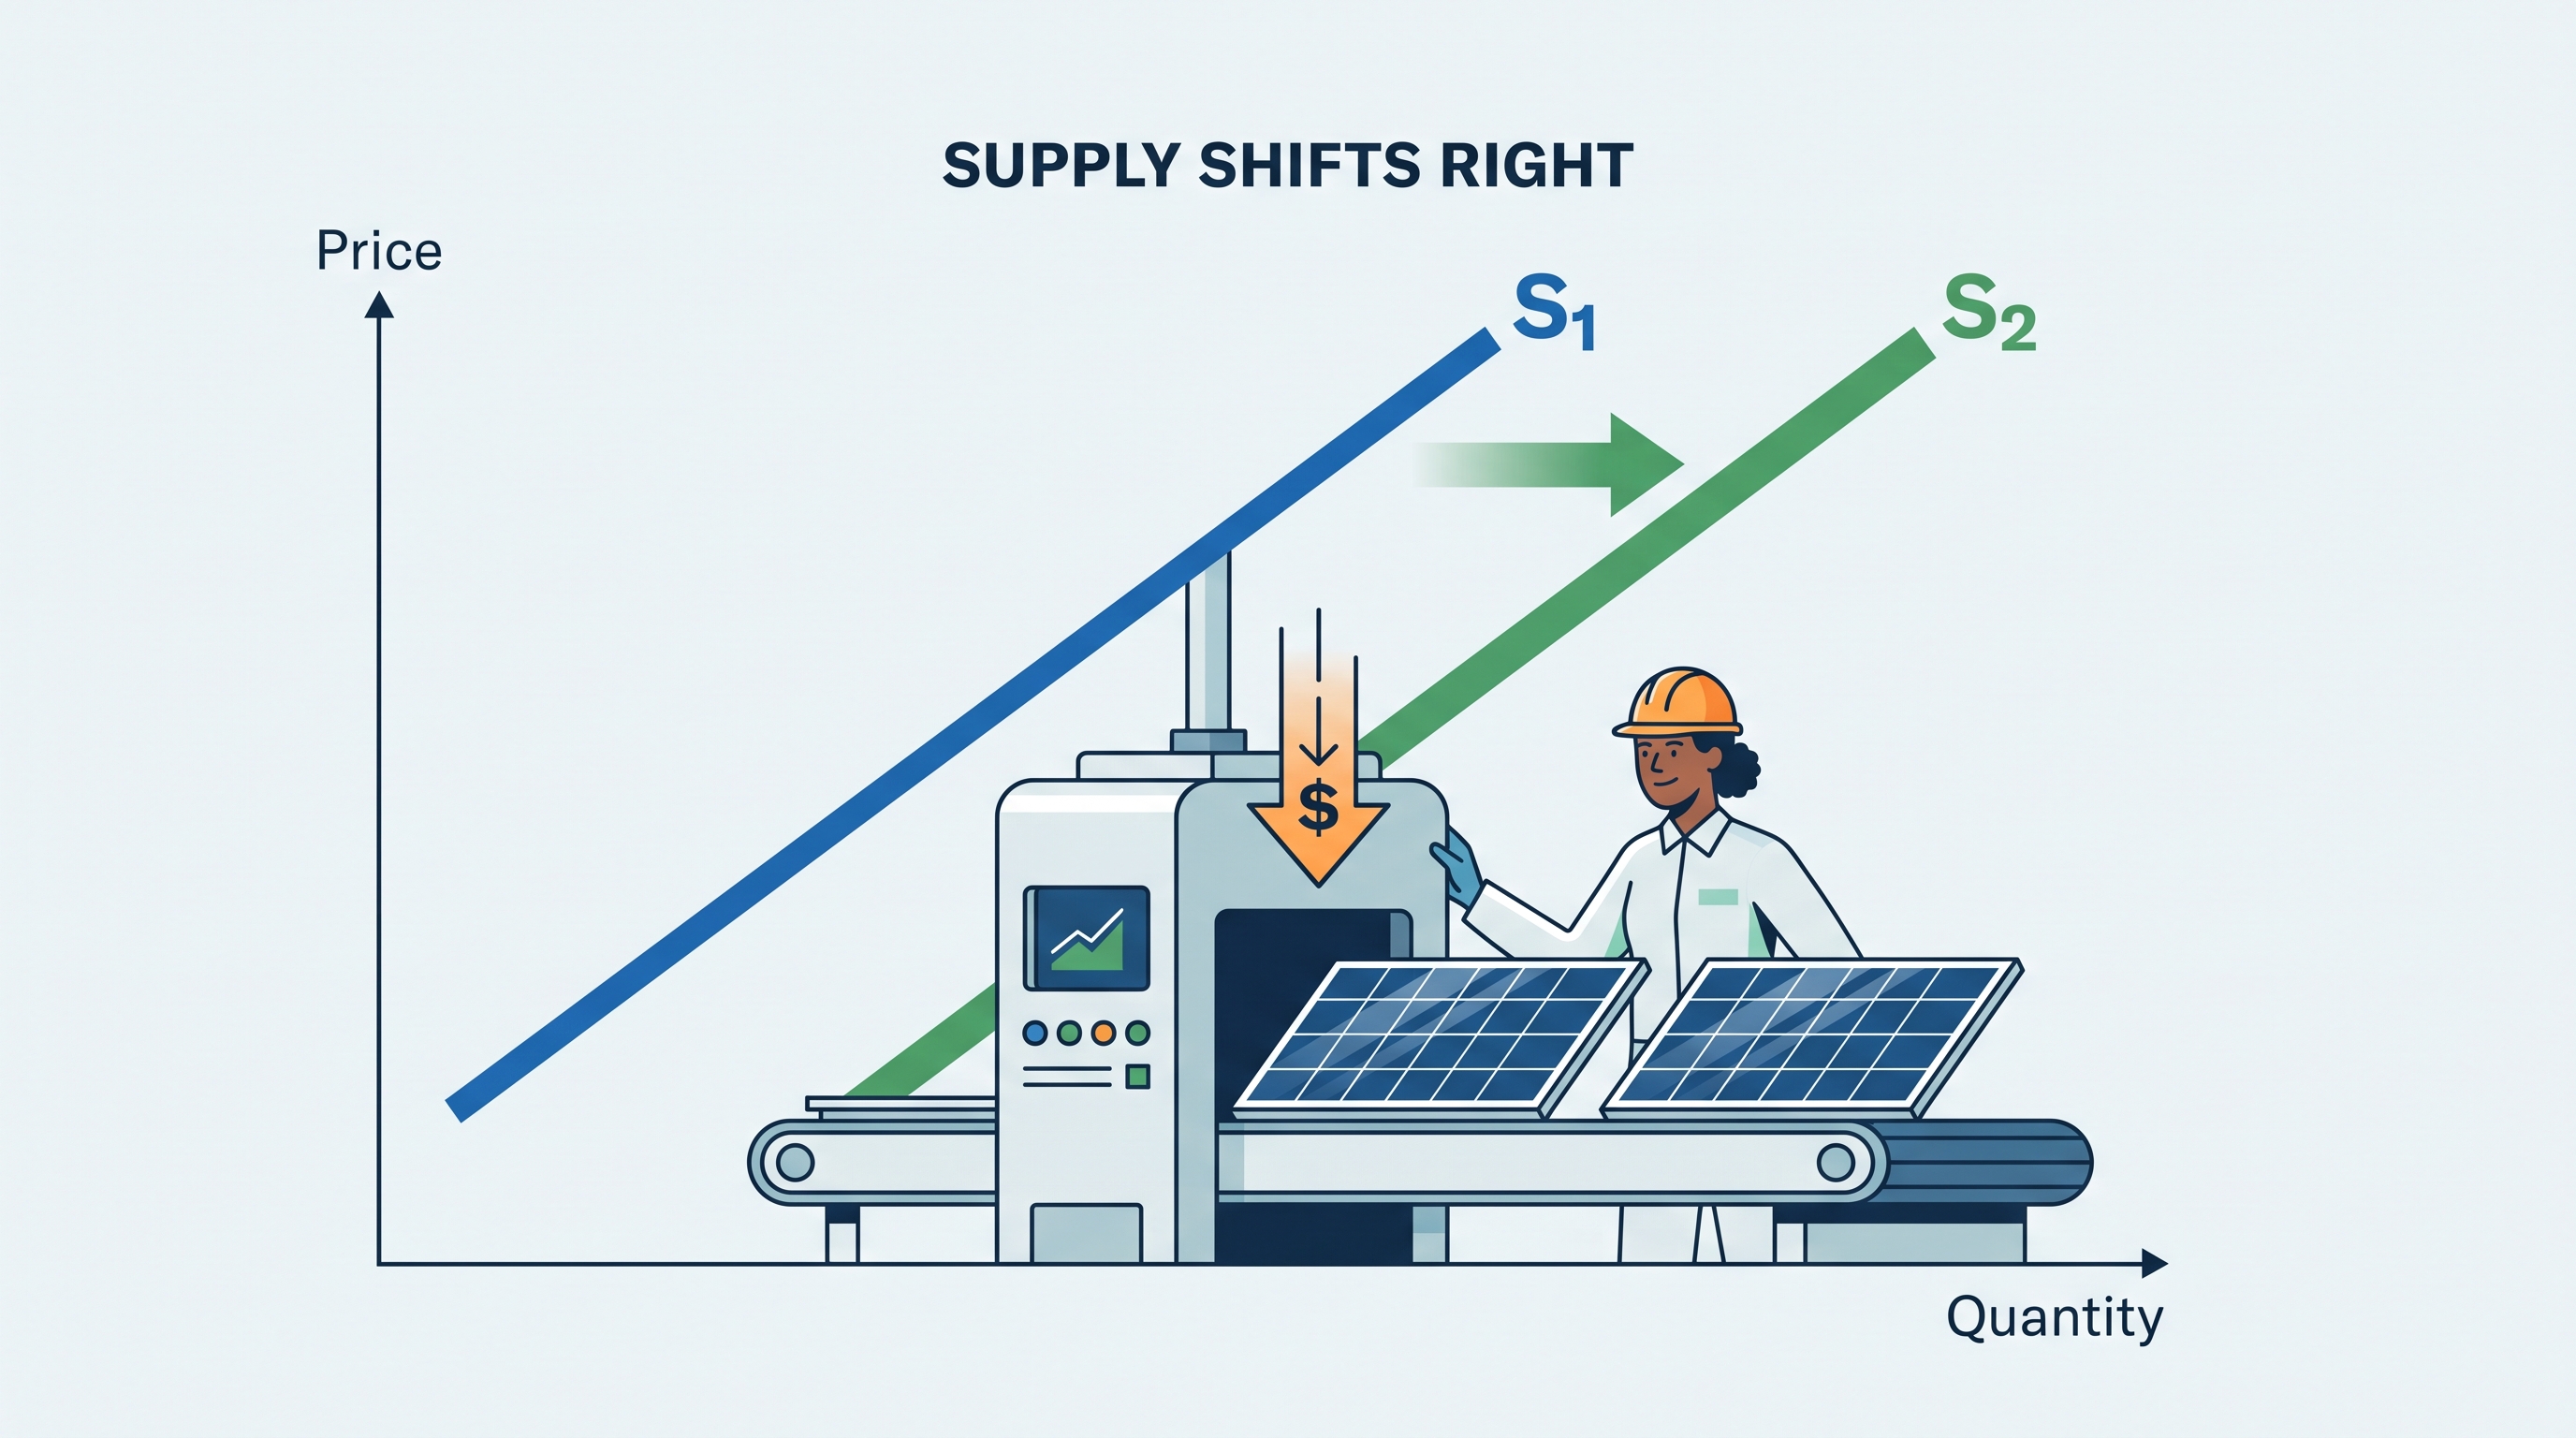
- Technology: Better technology can reduce the resources required per unit, shifting supply right.
- Taxes and subsidies: A per-unit tax raises the cost of selling each unit and shifts supply left. A subsidy lowers effective production cost and shifts supply right.
- Prices of related goods: A producer may switch resources toward a more profitable alternative. If a farm can grow either strawberries or lettuce, a higher strawberry price may reduce the supply of lettuce.
- Expectations: If firms expect a higher future price, they may hold inventory now, reducing current supply.
- Number of sellers: More firms in the market increase market supply; fewer firms decrease it.
- Natural conditions: Weather, disease, and other conditions can change production costs, especially in agriculture.
Worked example: a supply shift
A sudden increase in the price of cooking oil raises the cost of producing fried meals. At every meal price, food trucks now earn less profit from supplying the same quantity. Market supply shifts left.
$$ \text{higher input price} \rightarrow \text{higher production cost} \rightarrow \text{decrease in supply} $$
Notice the careful wording: the higher oil price does not directly cause a movement along the supply curve for meals. Oil is an input, so it changes supply itself.
AP skill connection: [MKT] and Skill 4 — Graphing and Visuals
Topic 2.2 Supply [MKT] is assessed especially through Skill 4: Graphing and Visuals. You must be able to draw, label, interpret, and manipulate a supply curve or supply-and-demand diagram. A strong graph identifies the axes, labels the original curve as $S_1$, labels the new curve as $S_2$, and shows whether the curve shifts left or right.
The key visual test is:
- Own price changes $\rightarrow$ movement along supply.
- Any other supply determinant changes $\rightarrow$ shift of supply.
For traceability, the topic belongs to Topic 2.2 Supply [MKT], with the topic-level content identifier MKT-2.B. The reasoning process is not merely naming a curve: it is connecting a real-world change to production cost, then representing the result accurately on a graph.
Misconception check: “Higher price always increases supply”
This statement confuses supply with quantity supplied. A higher price increases quantity supplied along a given supply curve. Supply increases only when a nonprice determinant makes producers willing and able to sell more at every price.
Retrieval check
A new machine lowers the cost of producing solar panels. Does the market experience a movement along the supply curve or a shift? Which direction? Explain the causal chain in one sentence.
Answer: Supply shifts right: lower production costs make firms willing and able to sell a greater quantity at every possible price.
Source Materials
- AP Microeconomics Course and Exam Description
- AP Microeconomics Course and Exam Description Clarifications and Corrections
- AP Microeconomics Course Overview
- AP Microeconomics Course at a Glance
- AP Microeconomics Course at a Glance Poster
- AP Microeconomics
- AP Microeconomics
- AP Microeconomics Sample Syllabus 1