From the free course College Algebra on Lykke
6.2 Graphs of Exponential Functions
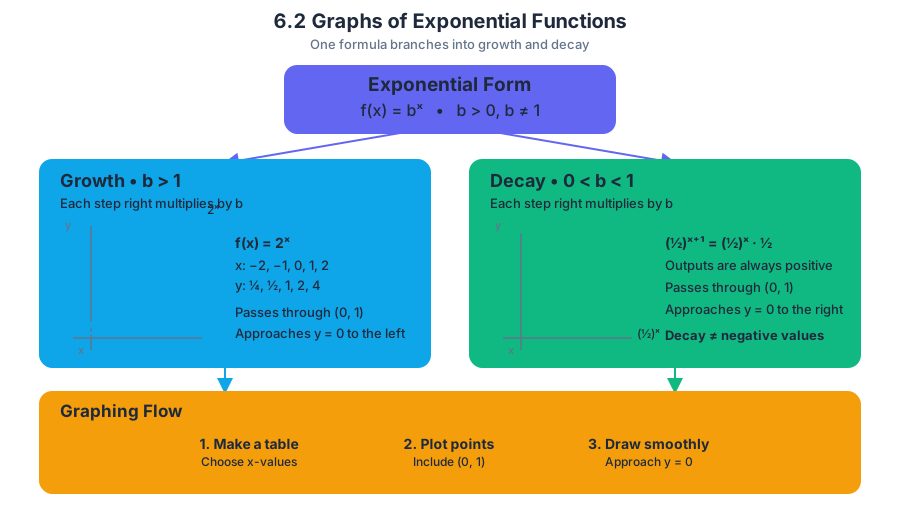
An exponential graph changes by the same multiplicative factor whenever its input increases by $1$. That single feature makes its curve bend differently from a line: instead of adding the same amount repeatedly, the output is repeatedly multiplied.
6.2 Graphs of Exponential Functions
An exponential graph changes by the same multiplicative factor whenever its input increases by $1$. That single feature makes its curve bend differently from a line: instead of adding the same amount repeatedly, the output is repeatedly multiplied. For example, the values of $2^x$ are
$$ \begin{aligned} 2^{-2}&=\frac{1}{4},\ 2^{-1}&=\frac{1}{2},\ 2^0&=1,\ 2^1&=2,\ 2^2&=4. \end{aligned} $$
The outputs double as $x$ increases by $1$, so the graph rises increasingly rapidly to the right and approaches the horizontal axis on the left.
The basic exponential graph
The basic exponential function has the form
$$ f(x)=b^x, $$
where $b>0$ and $b\neq 1$. The base $b$ controls the direction and steepness of the graph.
If $b>1$, then $f(x)=b^x$ is an exponential growth function.
If $0<b<1$, then $f(x)=b^x$ is an exponential decay function.
Every basic exponential function $f(x)=b^x$ has four essential graph features:
- Its domain is all real numbers: $(-\infty,\infty)$.
- Its range is $(0,\infty)$.
- Its $y$-intercept is $(0,1)$.
- Its horizontal asymptote is $y=0$.
A horizontal asymptote is a horizontal line that the graph approaches but does not reach as the input moves far to the left or right. For $f(x)=b^x$, the graph approaches $y=0$ but never equals $0$, because a positive base raised to any real power is positive.
The graph also passes through $(1,b)$, because
$$ f(1)=b^1=b. $$
Thus, the points $(0,1)$ and $(1,b)$ provide a quick way to recognize the base from a graph.
Growth and decay
When $b>1$, increasing $x$ by $1$ multiplies the output by a number greater than $1$:
$$ b^{x+1}=b^x\cdot b. $$
Therefore, the graph increases from left to right. As $x\to\infty$, $b^x\to\infty$, while as $x\to-\infty$, $b^x\to 0$.
When $0<b<1$, increasing $x$ by $1$ multiplies the output by a number between $0$ and $1$. The graph decreases from left to right. For example, with $b=\frac12$,
$$ \left(\frac12\right)^{x+1}
\left(\frac12\right)^x\left(\frac12\right). $$
Each output is half the previous output. As $x\to\infty$, the function approaches $0$, while as $x\to-\infty$, the function increases without bound.
A common misconception is that an exponential decay graph must have negative outputs. It does not. The word decay describes decreasing positive values, not values below the $x$-axis. The function $\left(\frac12\right)^x$ remains positive for every real $x$.
To graph $f(x)=2^x$, construct a small table:
$$ \begin{array}{c|ccccc} x&-2&-1&0&1&2\ \hline f(x)=2^x&\frac14&\frac12&1&2&4 \end{array} $$
Plot the points
$$ \left(-2,\frac14\right),\quad \left(-1,\frac12\right),\quad (0,1),\quad (1,2),\quad (2,4). $$
Then draw a smooth increasing curve through them. The curve approaches $y=0$ from above on the left and rises rapidly on the right.
For $g(x)=\left(\frac12\right)^x$, the corresponding table is
$$ \begin{array}{c|ccccc} x&-2&-1&0&1&2\ \hline g(x)&4&2&1&\frac12&\frac14 \end{array} $$
The graph contains the same characteristic point $(0,1)$ and the same horizontal asymptote $y=0$, but it decreases from left to right.
Transformations of exponential graphs
The graph of a general exponential function can be written as
$$ f(x)=ab^x, $$
where $a\neq 0$, $b>0$, and $b\neq 1$. The coefficient $a$ changes the vertical behavior of the basic graph.
To find the $y$-intercept, substitute $x=0$:
$$ \begin{aligned} f(0)&=ab^0\ &=a(1)\ &=a. \end{aligned} $$
Therefore, the $y$-intercept is $(0,a)$.
If $a>0$, then the graph lies above the horizontal asymptote $y=0$. If $a<0$, every output is negative, so the graph is reflected across the $x$-axis and lies below $y=0$. The range is
$$ (0,\infty)\quad\text{if }a>0 $$
and
$$ (-\infty,0)\quad\text{if }a<0. $$
The coefficient $a$ also vertically stretches or compresses the graph:
- If $|a|>1$, the graph is vertically stretched.
- If $0<|a|<1$, the graph is vertically compressed.
- If $a<0$, the graph is reflected across the $x$-axis as well.
Worked example: Graphing $f(x)=3\left(\frac12\right)^x$
First identify the parameters:
$$ a=3,\qquad b=\frac12. $$
Because $0<b<1$, the graph is decreasing. Because $a>0$, the graph remains above its horizontal asymptote $y=0$.
Now calculate several points:
$$ \begin{aligned} f(-2)&=3\left(\frac12\right)^{-2} =3(4) =12,\ f(-1)&=3\left(\frac12\right)^{-1} =3(2) =6,\ f(0)&=3\left(\frac12\right)^0 =3(1) =3,\ f(1)&=3\left(\frac12\right)^1 =3\left(\frac12\right) =\frac32,\ f(2)&=3\left(\frac12\right)^2 =3\left(\frac14\right) =\frac34. \end{aligned} $$
The graph passes through $(0,3)$, decreases from left to right, approaches $y=0$ from above, and has range $(0,\infty)$. The factor $3$ changes the $y$-intercept from $1$ to $3$, but it does not change the horizontal asymptote.
Horizontal and vertical translations
A more general transformed exponential function is
$$ f(x)=ab^{x-h}+k. $$
The constants $h$ and $k$ shift the graph:
- $h$ shifts the graph horizontally: right when $h>0$, left when $h<0$.
- $k$ shifts the graph vertically: up when $k>0$, down when $k<0$.
- The horizontal asymptote becomes $y=k$.
- The domain remains $(-\infty,\infty)$.
- If $a>0$, the range is $(k,\infty)$.
- If $a<0$, the range is $(-\infty,k)$.
The expression $x-h$ can feel counterintuitive. The sign inside the exponent works opposite to the visible movement: $b^{x-4}$ shifts the graph right by $4$, while $b^{x+4}=b^{x-(-4)}$ shifts it left by $4$.
Worked example: Graphing a translated exponential function
Graph
$$ f(x)=2^{x-3}+1. $$
Start with the basic graph $y=2^x$. The expression $x-3$ shifts it right by $3$, and the $+1$ shifts it up by $1$. Therefore, the horizontal asymptote changes from $y=0$ to
$$ y=1. $$
To generate points, choose values of $x$ that make $x-3$ simple:
$$ \begin{aligned} f(1)&=2^{1-3}+1\ &=2^{-2}+1\ &=\frac14+1\ &=\frac54, \end{aligned} $$
$$ \begin{aligned} f(2)&=2^{2-3}+1\ &=2^{-1}+1\ &=\frac12+1\ &=\frac32, \end{aligned} $$
$$ \begin{aligned} f(3)&=2^{3-3}+1\ &=2^0+1\ &=1+1\ &=2, \end{aligned} $$
$$ \begin{aligned} f(4)&=2^{4-3}+1\ &=2^1+1\ &=2+1\ &=3, \end{aligned} $$
and
$$ \begin{aligned} f(5)&=2^{5-3}+1\ &=2^2+1\ &=4+1\ &=5. \end{aligned} $$
The graph passes through
$$ \left(1,\frac54\right),\quad \left(2,\frac32\right),\quad (3,2),\quad (4,3),\quad (5,5). $$
It increases from left to right and approaches $y=1$ from above. Its domain is $(-\infty,\infty)$, and its range is $(1,\infty)$.
A reliable graphing procedure
For a function of the form
$$ f(x)=ab^{x-h}+k, $$
use this sequence:
- Identify $a$, $b$, $h$, and $k$.
- Determine growth or decay from the base $b$.
- Draw the horizontal asymptote $y=k$.
- Find the key point obtained from the basic point $(0,1)$:
$$ (h,a+k). $$
- Plot additional points if needed.
- State the domain, range, intercepts, and end behavior.
The key point in step $4$ follows directly from substitution:
$$ \begin{aligned} f(h)&=ab^{h-h}+k\ &=ab^0+k\ &=a+k. \end{aligned} $$
This point is the translated and vertically scaled version of $(0,1)$.
Practice problems
1. For
$$ f(x)=\left(\frac13\right)^x, $$
state whether the function represents growth or decay, identify its horizontal asymptote, and give its domain and range.
Answer:
$$ 0<\frac13<1, $$
so the function represents decay. Its horizontal asymptote is $y=0$, its domain is $(-\infty,\infty)$, and its range is $(0,\infty)$.
2. For
$$ g(x)=-2(3)^x+4, $$
identify the horizontal asymptote, determine whether the graph increases or decreases, and state the range.
Answer: The horizontal asymptote is
$$ y=4. $$
Since $3>1$, $3^x$ increases, but multiplication by $-2$ reflects the graph across the horizontal asymptote, so $g(x)$ decreases. Because $a=-2<0$, the range is
$$ (-\infty,4). $$
3. Graph
$$ h(x)=2^{x+1}-3 $$
by identifying its transformations, asymptote, and key point.
Answer: The graph of $y=2^x$ shifts left by $1$ and down by $3$. Its horizontal asymptote is
$$ y=-3. $$
The key point is
$$ (h,a+k)=(-1,1-3)=(-1,-2). $$
Because $2>1$, the graph increases. Its domain is $(-\infty,\infty)$, and its range is $(-3,\infty)$.
Content adapted from OpenStax College Algebra 2e by Jay Abramson et al., licensed CC BY 4.0.
Source Materials
Study College Algebra on Lykke
This course page is free to open: signed out, you can read its first two sections, and signing in, on any plan, opens the rest. The free Lykke Chrome extension syncs your own Canvas courses, so ChatGPT, Claude and Muse can answer from your classes and deadlines. It only reads Canvas.
Add the free extensionSign in to open every section