From the free course AP Statistics on Lykke
Unit 4: Inference for Quantitative Data: Means
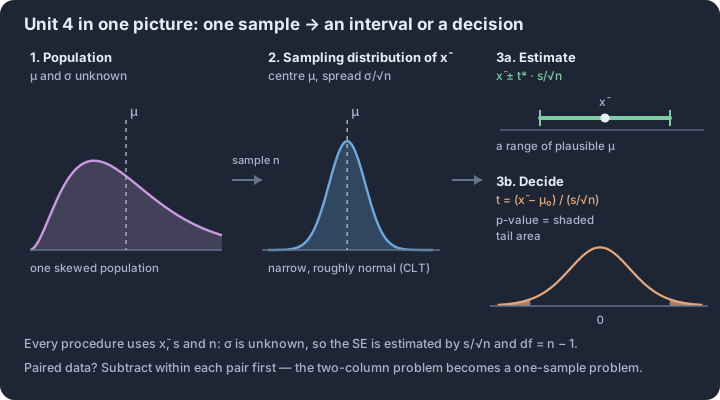
Key concepts: Sampling distribution of x̄ — centre μ, spread σ/√n · Central Limit Theorem — x̄ becomes approximately normal for large n · t-procedures — needed because σ is unknown, df from sample size · Confidence interval for a mean: x̄ ± t* · s/√n · Paired data — one column of differences, one-sample inference · Two independent samples — inference about the difference μ₁ − μ₂
Integrate the official Unit 4 topics through the AP statistical practices and apply them to contextual problems. Follow the unit roadmap to connect every topic, practice statistical reasoning in context, and prepare for cumulative AP-style questions.
Unit 4: Inference for Quantitative Data: Means is organized around one recurring question: what evidence would justify the conclusion we want to make? This overview connects the unit's topics before you work through them one at a time.
What you will learn
Integrate the official Unit 4 topics through the AP statistical practices and apply them to contextual problems.
Topic sequence
- 4.1 Sampling Distributions for Sample Means — Calculate, verify conditions for, and interpret sampling distributions of sample means.
- 4.2 Constructing a Confidence Interval for a Population Mean or Population Mean Difference — Select, justify, and construct a confidence interval for a population mean or paired mean difference.
- 4.3 Justifying a Claim Based on a Confidence Interval for a Population Mean or Population Mean Difference — Interpret a mean confidence interval and use it to justify a contextual claim.
- 4.4 Setting Up a Test for a Population Mean or Population Mean Difference — Select and set up a valid test for a population mean or paired mean difference.
- 4.5 Carrying Out a Test for a Population Mean or Population Mean Difference — Calculate and interpret a one-sample or paired-mean test and justify its conclusion.
- 4.6 Sampling Distributions for the Difference Between Two Sample Means — Calculate, verify conditions for, and interpret sampling distributions of differences in sample means.
- 4.7 Constructing a Confidence Interval for the Difference Between Two Population Means — Select, justify, and construct a confidence interval for a difference in population means.
- 4.8 Justifying a Claim Based on a Confidence Interval for the Difference Between Two Population Means — Interpret a two-mean confidence interval and justify a contextual claim.
- 4.9 Setting Up a Test for the Difference Between Two Population Means — Select and set up a valid test for a difference in population means.
- 4.10 Carrying Out a Test for the Difference Between Two Population Means — Calculate and interpret a two-sample mean test and justify its conclusion.
The reasoning routine
- Start by naming the statistical question and the population or process in context.
- Choose a representation or procedure because its conditions match the situation.
- Show the numerical or graphical evidence clearly.
- Interpret the result using the variables, groups, and units from the original context.
Before you move on
Use the roadmap above to select the first topic. Keep a running error log with four labels—concept, procedure, calculation, and context—so the practice unit can point you back to the exact kind of repair you need.
Source Materials
- Ap Statistics Course And Exam Description
- AP Statistics Course Overview
- AP Statistics Course at a Glance
- AP Statistics Course at a Glance Poster
- Adopt AP Statistics
- AP Statistics
- AP Statistics
- AP Statistics Past Exam Questions — AP Central
- Khan Academy — AP Statistics
- Guide to the AP Statistics Exam — Princeton Review
- AP Statistics Units — Save My Exams
- AP Statistics Study Guide — EBSCO