From the free course AP Statistics on Lykke
3.11 Justifying a Claim Based on a Confidence Interval for the Difference Between Two Population Proportions
Key concepts: Interpretation — C% confident the interval captures the true p₁ − p₂ · Confidence level describes the method across repeated sampling, not one interval · Zero rule — an interval containing 0 shows no convincing difference · Entirely positive interval — evidence that p₁ exceeds p₂ · Entirely negative interval — evidence that p₂ exceeds p₁ · Claims name both populations and the response variable in context
A confidence interval for the difference between two population proportions ($p_1 - p_2$) transforms raw sample data into a range of plausible values for the true, unknown gap between two groups.
A confidence interval for the difference between two population proportions ($p_1 - p_2$) transforms raw sample data into a range of plausible values for the true, unknown gap between two groups. While a point estimate provides a single "best guess," the interval accounts for sampling variability, allowing statisticians to determine if a perceived difference is likely a real population characteristic or merely a result of the "luck of the draw" during sampling.
The Logic of the "Zero-Capture"
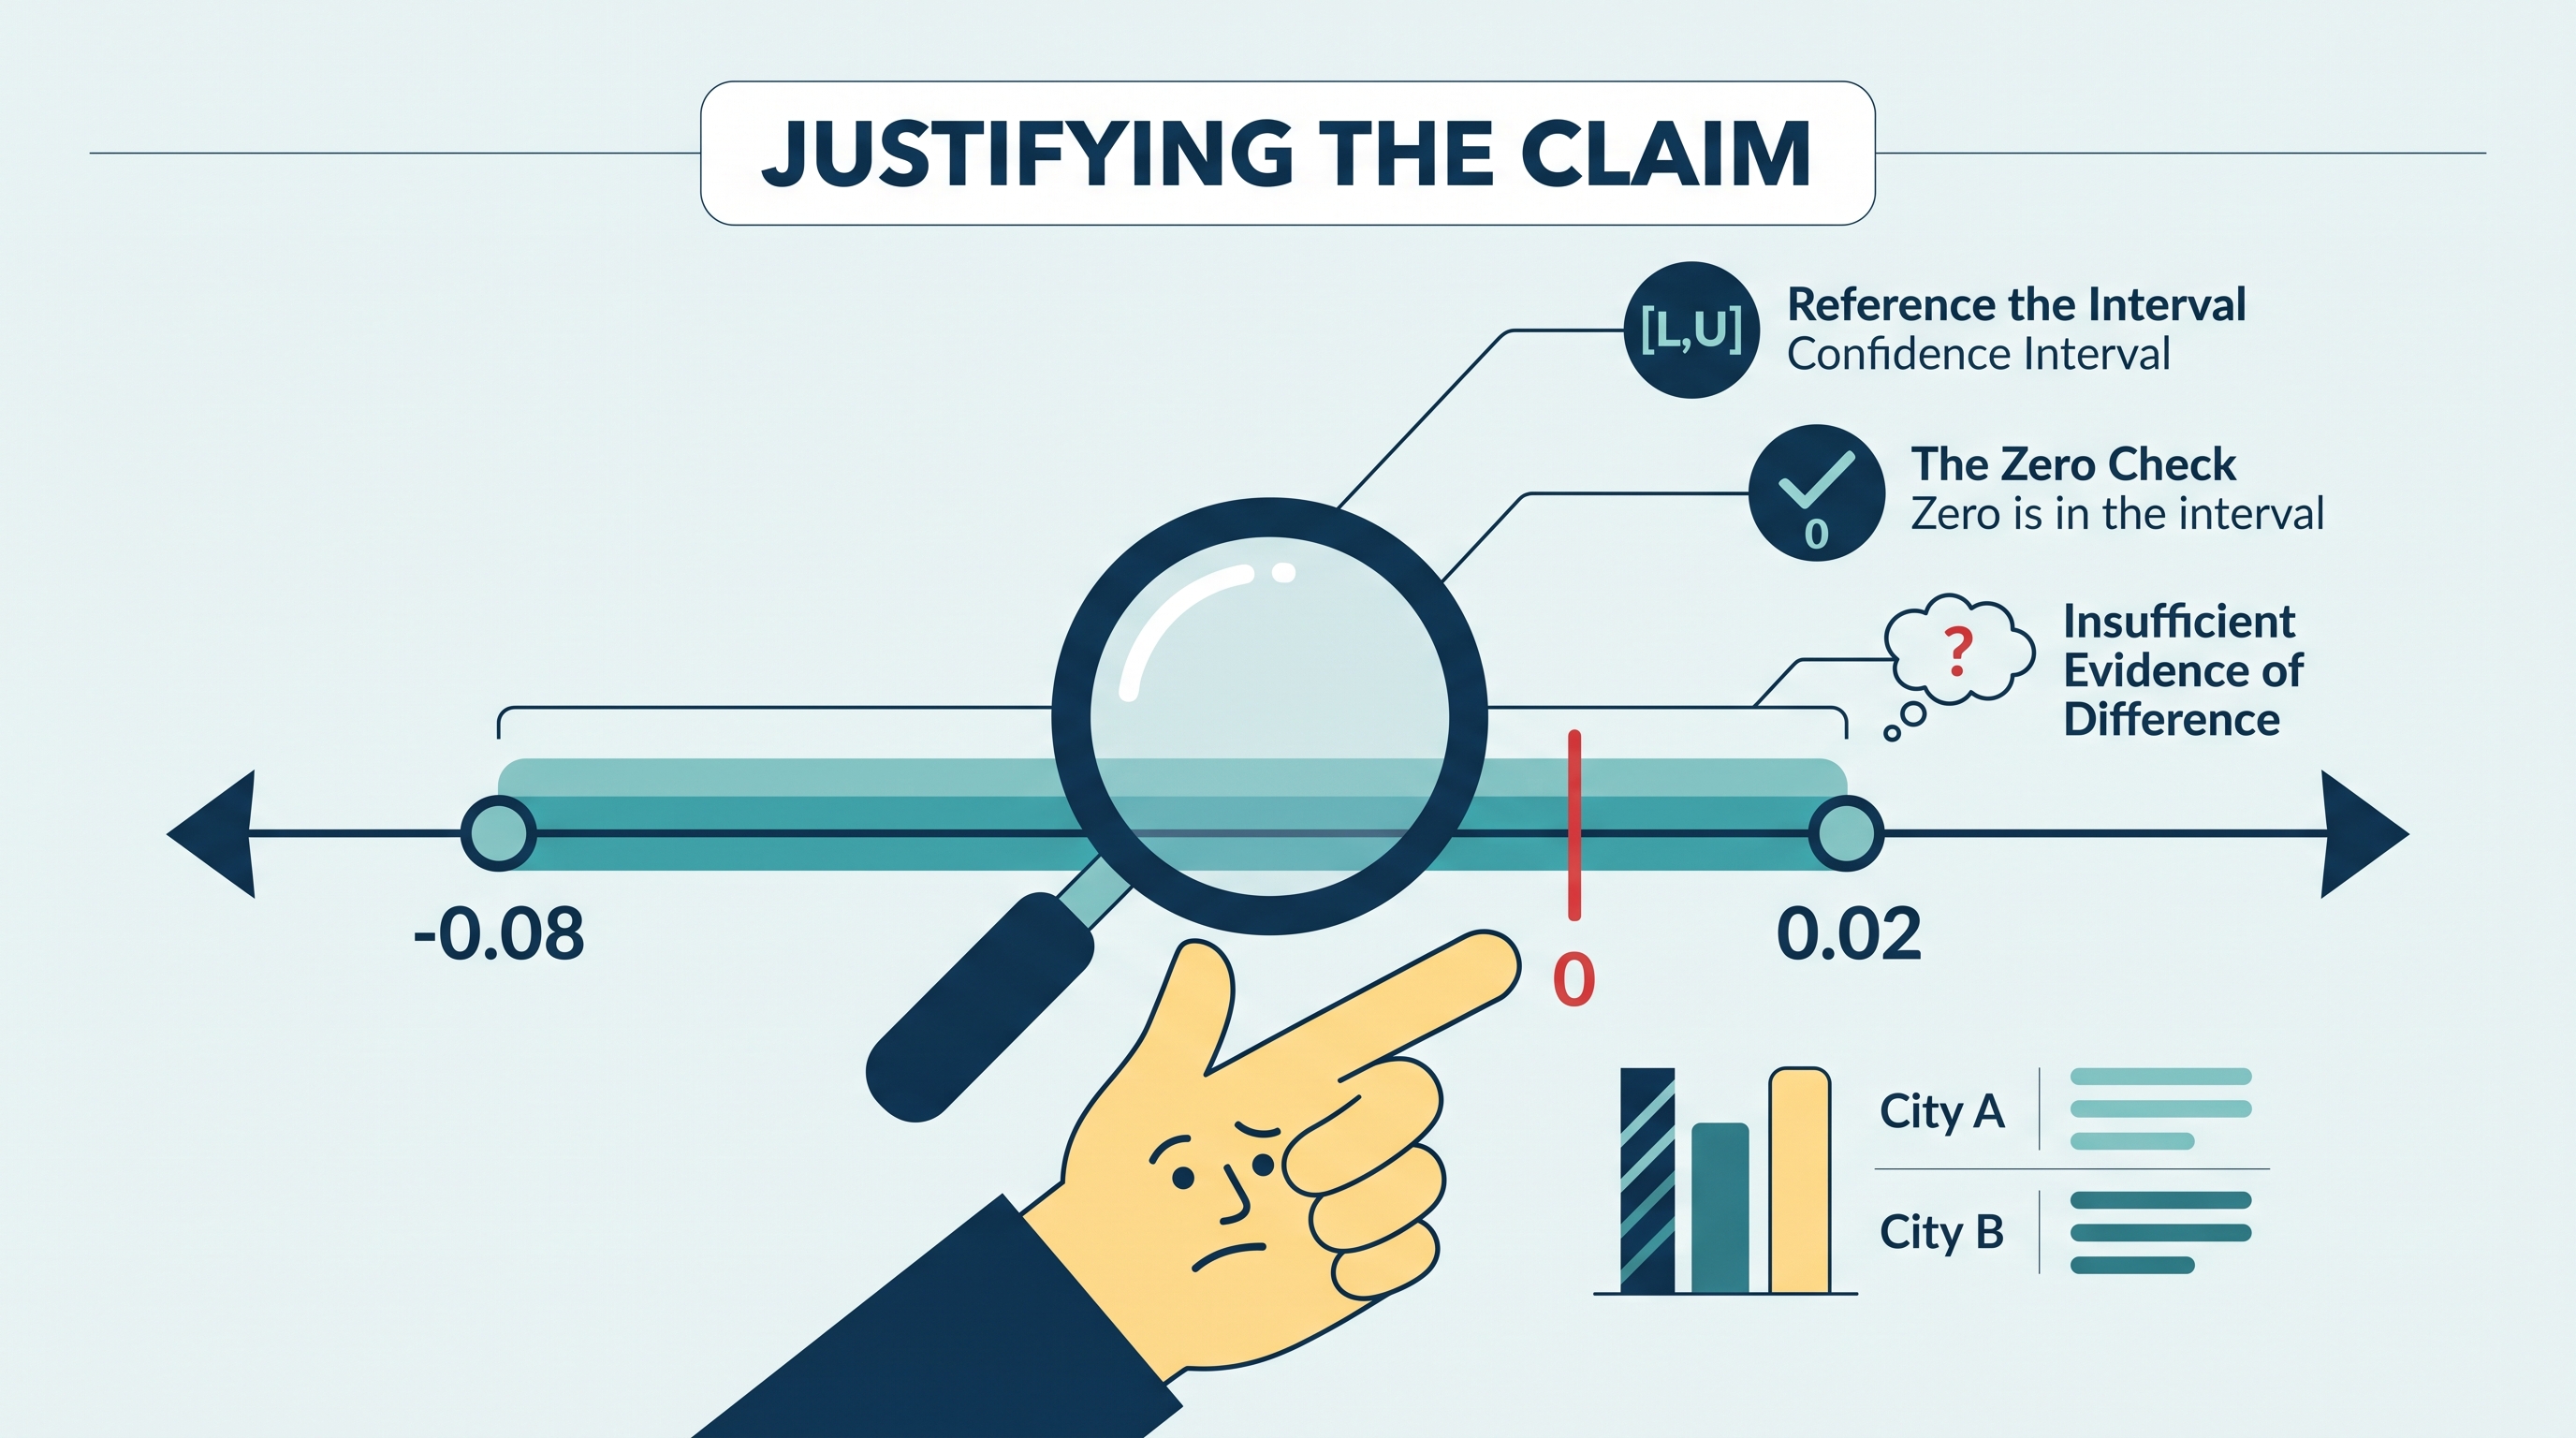
The most critical value in any confidence interval for a difference is zero. Because the interval represents plausible values for $p_1 - p_2$, the inclusion or exclusion of zero dictates the strength of evidence for a claim about group differences.
- If the interval contains 0: The data do not provide convincing evidence of a difference between the two population proportions. Zero is a plausible value for the difference ($p_1 - p_2 = 0$), meaning it is possible the proportions are identical.
- If the interval does not contain 0: The data provide convincing evidence of a difference. If the entire interval is positive, we have evidence that $p_1 > p_2$. If the entire interval is negative, we have evidence that $p_1 < p_2$.
Interpreting the Confidence Interval (Skill 4.F)
Interpreting the result requires a precise statement that links the calculated bounds to the population parameters in context. A standard interpretation follows this template: "We are $C%$ confident that the interval from $L$ to $U$ captures the true difference in the proportion of [Population 1] who [Response] and the proportion of [Population 2] who [Response]."
Contextual Example: App Interface Testing A developer wants to know if a "Dark Mode" interface leads to higher user retention than a "Light Mode" interface. A 95% confidence interval for the difference in retention proportions ($p_{Dark} - p_{Light}$) is calculated as $(0.03, 0.11)$.
Interpretation: We are 95% confident that the interval from 0.03 to 0.11 captures the true difference in the proportion of all users who stay active using Dark Mode versus Light Mode. Because the entire interval is positive (above zero), this provides convincing evidence that the retention proportion is higher for Dark Mode.
Interpreting the Confidence Level
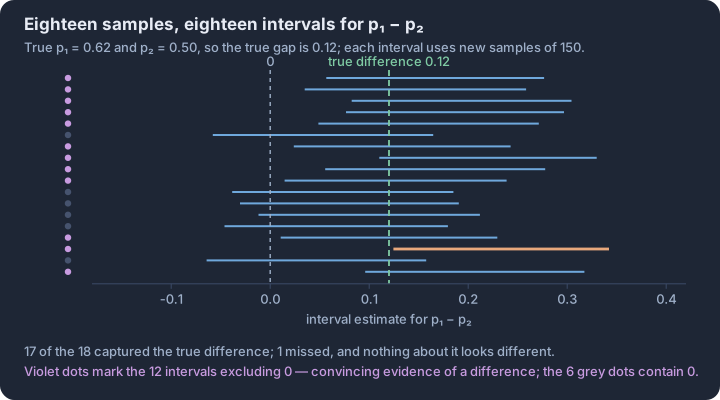
It is a common error to confuse the interval with the level. The confidence level ($C%$) describes the reliability of the statistical method itself, not the specific numbers in one calculated interval. The computed interval may or may not contain the true value for the difference between the two population proportions.
The interpretation of the confidence level is: In repeated random sampling using the same sample sizes from the same populations, approximately $C%$ of the confidence intervals created will successfully capture the true difference between the two population proportions.
Misconception Check: Probability vs. Confidence
One of the most frequent errors in statistical writing is claiming there is a "$95%$ probability" that the true difference is between two specific numbers.
| Incorrect Reasoning | Correct Reasoning |
|---|---|
| "There is a 95% chance the true difference is between 0.03 and 0.11." | "We are 95% confident the true difference is between 0.03 and 0.11." |
| Why it fails: Once the interval is calculated, the true difference is either in it (100% probability) or it isn't (0% probability). The probability refers to the process before the data are collected. | Why it works: "Confidence" describes our trust in the procedure that produced the interval, acknowledging that 5% of such intervals will fail to capture the truth. |
Justifying Claims (Skill 4.G)
When asked to justify a claim, you must explicitly mention whether the value of interest (usually zero) is contained within the interval. Your justification should follow a clear "Evidence $\rightarrow$ Conclusion" path.
- State the interval.
- Note the position of zero relative to that interval.
- Conclude in context regarding the claim.
If a researcher claims that a new fertilizer ($p_1$) is more effective than the standard ($p_2$), but the 90% confidence interval for $p_1 - p_2$ is $(-0.02, 0.15)$, the researcher cannot justify the claim. Because zero is included in the interval, it is plausible that there is no difference in effectiveness, or even that the standard fertilizer is slightly better.
Retrieval Check A school district calculates a 99% confidence interval for the difference in the proportion of students who pass a math exam using a new curriculum ($p_{new}$) versus the old curriculum ($p_{old}$). The resulting interval is $(-0.08, -0.01)$.
- Does this interval provide convincing evidence of a difference in passing proportions?
- Which curriculum appears to have a higher passing proportion?
Check your reasoning:
- Yes. Because the interval does not contain 0, there is convincing evidence of a difference.
- The old curriculum ($p_{old}$). Since the entire interval for $p_{new} - p_{old}$ is negative, the data suggest that $p_{old}$ is greater than $p_{new}$ by between 1 and 8 percentage points.