From the free course AP Statistics on Lykke
3.12 Setting Up a Test for the Difference Between Two Population Proportions
Key concepts: Two-sample z-test for p₁ − p₂ — testing whether two rates differ · Null hypothesis H₀: p₁ = p₂, a difference of exactly zero · Alternative — p₁ > p₂, p₁ < p₂, or p₁ ≠ p₂ · Pooled proportion p̂c — combined successes over combined sample sizes · Pooled standard error — used only because H₀ assumes one common rate · Conditions — randomisation, 10% rule, and four pooled counts ≥ 10
When we observe a difference between two sample proportions—such as a 5% higher recovery rate in a treatment group compared to a control group—we face a fundamental inferential dilemma: is this gap a reflection of a true difference between the populations, or is it merely the result of…
When we observe a difference between two sample proportions—such as a 5% higher recovery rate in a treatment group compared to a control group—we face a fundamental inferential dilemma: is this gap a reflection of a true difference between the populations, or is it merely the result of "the luck of the draw" in random sampling? Setting up a formal significance test allows us to quantify the probability of seeing such a difference by chance alone. This process transforms a vague observation into a rigorous statistical claim by defining the parameters, stating the hypotheses, and verifying that the mathematical model for the sampling distribution is valid.
Defining the Parameters and Hypotheses
The first step in any inference procedure is to clearly define the population parameters of interest. In a two-proportion test, we define $p_1$ as the true proportion of successes in Population 1 and $p_2$ as the true proportion of successes in Population 2. It is essential to use the parameter $p$ (the population value) in the hypotheses, rather than the statistic $\hat{p}$ (the sample value), because we already know the sample values; the test is designed to probe the unknown truth of the populations.
The null hypothesis ($H_0$) typically assumes a "boring" world where there is no difference between the groups. We represent this as $H_0: p_1 - p_2 = 0$ (or $H_0: p_1 = p_2$). The alternative hypothesis ($H_a$) reflects the researcher's suspicion or the investigative question. Depending on the direction of the inquiry, the alternative can take three forms:
- Two-sided: $H_a: p_1 - p_2 \neq 0$ (There is some difference).
- One-sided (Greater than): $H_a: p_1 - p_2 > 0$ (Population 1 has a higher proportion).
- One-sided (Less than): $H_a: p_1 - p_2 < 0$ (Population 1 has a lower proportion).
The Logic of Pooling
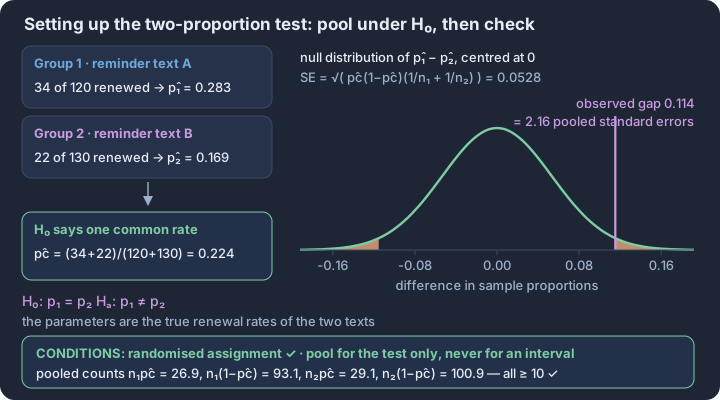
A unique feature of setting up a test for $p_1 - p_2$ is the use of the combined (pooled) sample proportion, denoted as $\hat{p}_c$. Because the null hypothesis assumes $p_1 = p_2$, we act as if both samples came from a single population with a common proportion. To get the best estimate of this common proportion, we "pool" the data from both samples: $$\hat{p}_c = \frac{\text{Successes}_1 + \text{Successes}_2}{n_1 + n_2}$$ This pooled proportion is used specifically for the Large Counts condition and for calculating the standard error during the test phase. This differs from confidence intervals, where we do not assume the proportions are equal and therefore do not pool.
Verifying Necessary Conditions (Skill 4.E)
Before proceeding to calculations, we must justify the use of the Normal approximation for the sampling distribution of $\hat{p}_1 - \hat{p}_2$. If these conditions are not met, the resulting $p$-value may be misleading.
- Random: The data must come from two independent random samples or from a randomized experiment with two treatment groups. This ensures the results can be generalized or that a cause-and-effect relationship can be investigated (Skill 2.C).
- 10% Condition: If sampling without replacement, the sample sizes $n_1$ and $n_2$ must be less than 10% of their respective population sizes ($N_1$ and $N_2$). This allows us to treat the observations as independent. (Note: This condition is generally not required for randomized experiments).
- Large Counts: We must expect at least 10 successes and 10 failures in each group. However, because we assume $H_0$ is true, we use the pooled proportion $\hat{p}_c$ to check this:
- $n_1\hat{p}_c \ge 10$ and $n_1(1-\hat{p}_c) \ge 10$
- $n_2\hat{p}_c \ge 10$ and $n_2(1-\hat{p}_c) \ge 10$
Contextual Example: Digital Literacy Initiatives
Suppose a non-profit wants to know if a new workshop increases the proportion of seniors who feel "confident" using online banking. They randomly assign 100 seniors to the workshop (Group 1) and 100 to a control group (Group 2). After the program, 62 in the workshop group and 48 in the control group report feeling confident.
- Parameters: $p_1 =$ true proportion of all seniors who would feel confident after the workshop; $p_2 =$ true proportion of all seniors who would feel confident without the workshop.
- Hypotheses: $H_0: p_1 - p_2 = 0$ vs. $H_a: p_1 - p_2 > 0$.
- Pooling: $\hat{p}_c = (62 + 48) / (100 + 100) = 110 / 200 = 0.55$.
- Large Counts Check: $100(0.55) = 55$ and $100(0.45) = 45$. Both are $\ge 10$ for both groups. Conditions are met for a two-sample $z$-test for $p_1 - p_2$.
Misconception Check: A common error is writing hypotheses using sample statistics, such as $H_0: \hat{p}_1 = \hat{p}_2$. Remember: we use the test to make an inference about the unknown population parameters ($p$), not the observed sample statistics ($\hat{p}$). We already know $\hat{p}_1$ and $\hat{p}_2$ are different! The question is whether that difference is statistically significant.
Interpretation Check
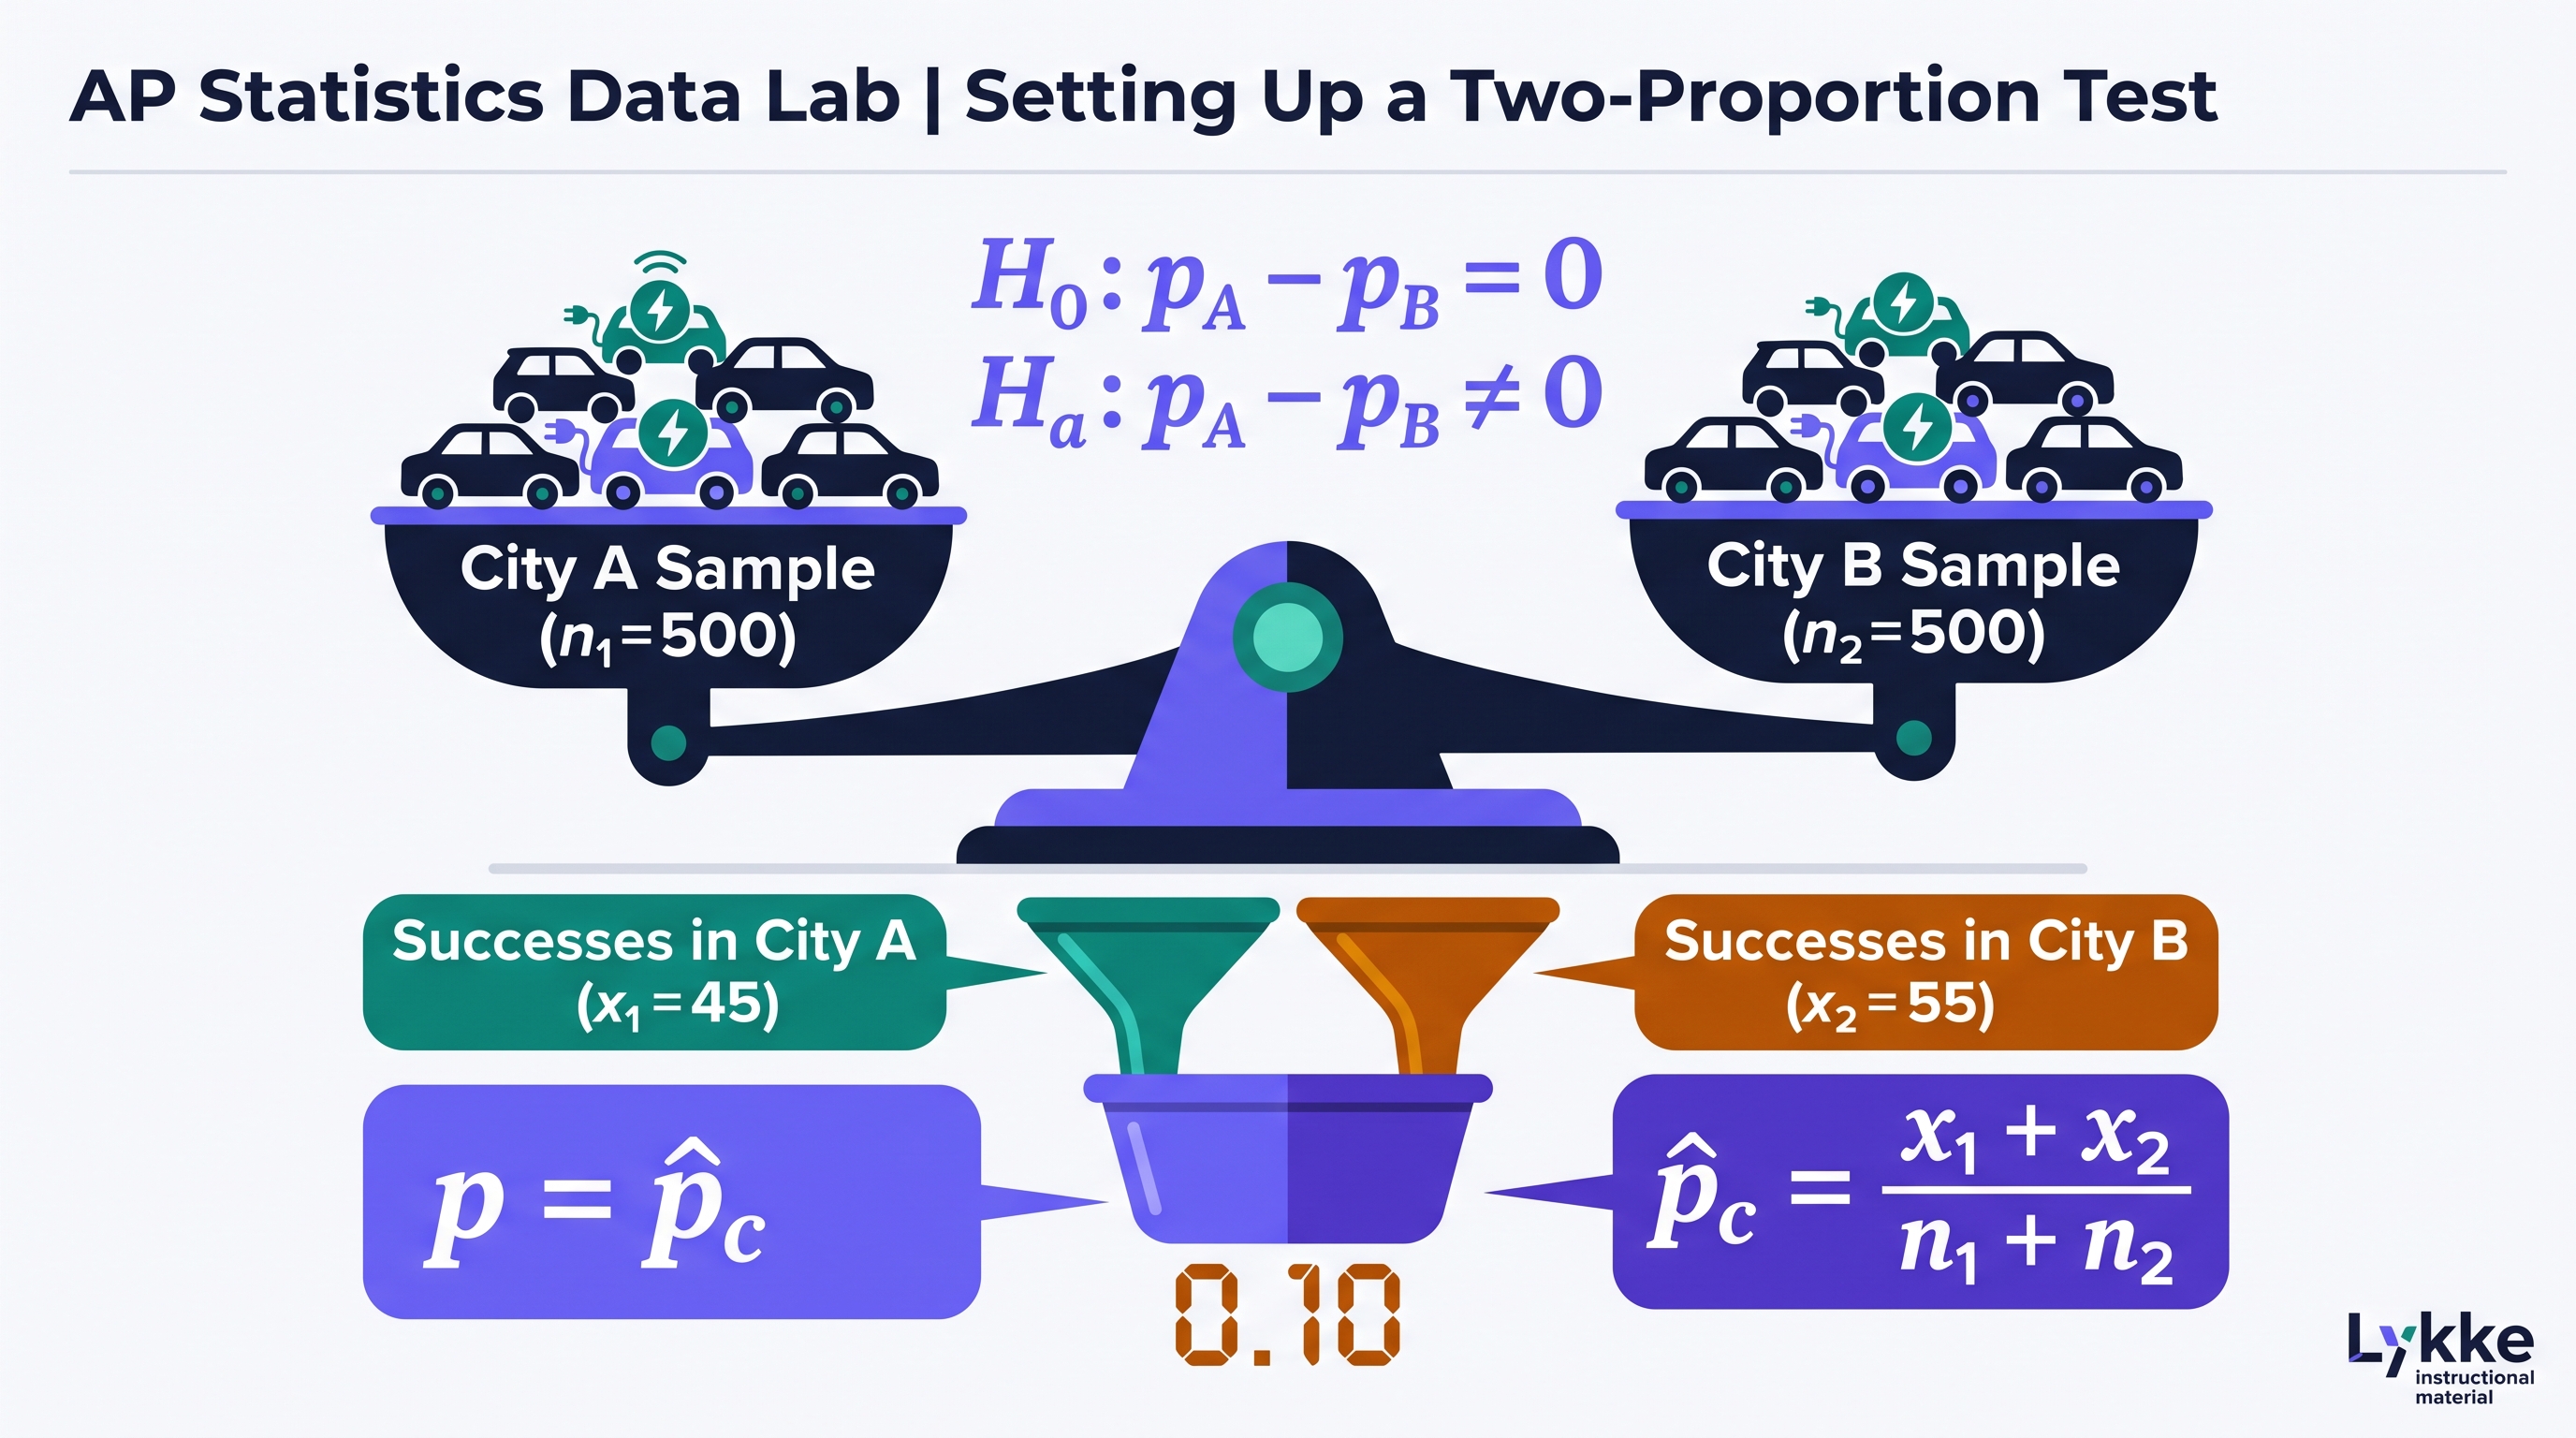
A researcher is studying whether the proportion of electric vehicles (EVs) is different in City A compared to City B. They take independent random samples of 500 cars in each city. In City A, 45 cars are EVs; in City B, 55 cars are EVs.
- State the null and alternative hypotheses in symbols.
- Calculate the pooled proportion $\hat{p}_c$ that would be used to check the Large Counts condition.
(Think through your answer before reading on: $H_0: p_A - p_B = 0$ and $H_a: p_A - p_B \neq 0$. The pooled proportion is $\hat{p}_c = (45+55)/(500+500) = 100/1000 = 0.10$.)