Advanced Principles of Biological Systems and Inquiry
Institution: MIT
28 study materials · 8 sections
This course explores the fundamental principles of biology through inquiry-based investigations and rigorous scientific reasoning. Students delve into eight core units ranging from molecular chemistry to ecosystem interactions, guided by four 'Big Ideas': Evolution, Energetics, Information Storage, and Systems Interactions. The curriculum emphasizes hands-on laboratory work and the application of mathematical models to biological data to prepare students for college-level scientific study.
Course Sections
Course Framework and Big Ideas
Key concepts: Evolution · Energetics · Information Storage and Transmission · Systems Interactions · Course Framework
An introduction to the foundational pillars of AP Biology, including the four Big Ideas and the eight instructional units.
Course Framework and Big Ideas
The AP Biology curriculum is not merely a collection of biological facts; it is a structured conceptual framework designed to mirror the rigor of an introductory college-level biology course. This framework shifts the pedagogical focus from rote memorization to the mastery of Enduring Understandings—long-lasting concepts that students retain long after the course concludes. By organizing the vast complexity of life into four Big Ideas and eight instructional units, the framework allows for a deep-dive into the mechanics of life, from the sub-atomic interactions of water molecules to the global dynamics of ecosystems.
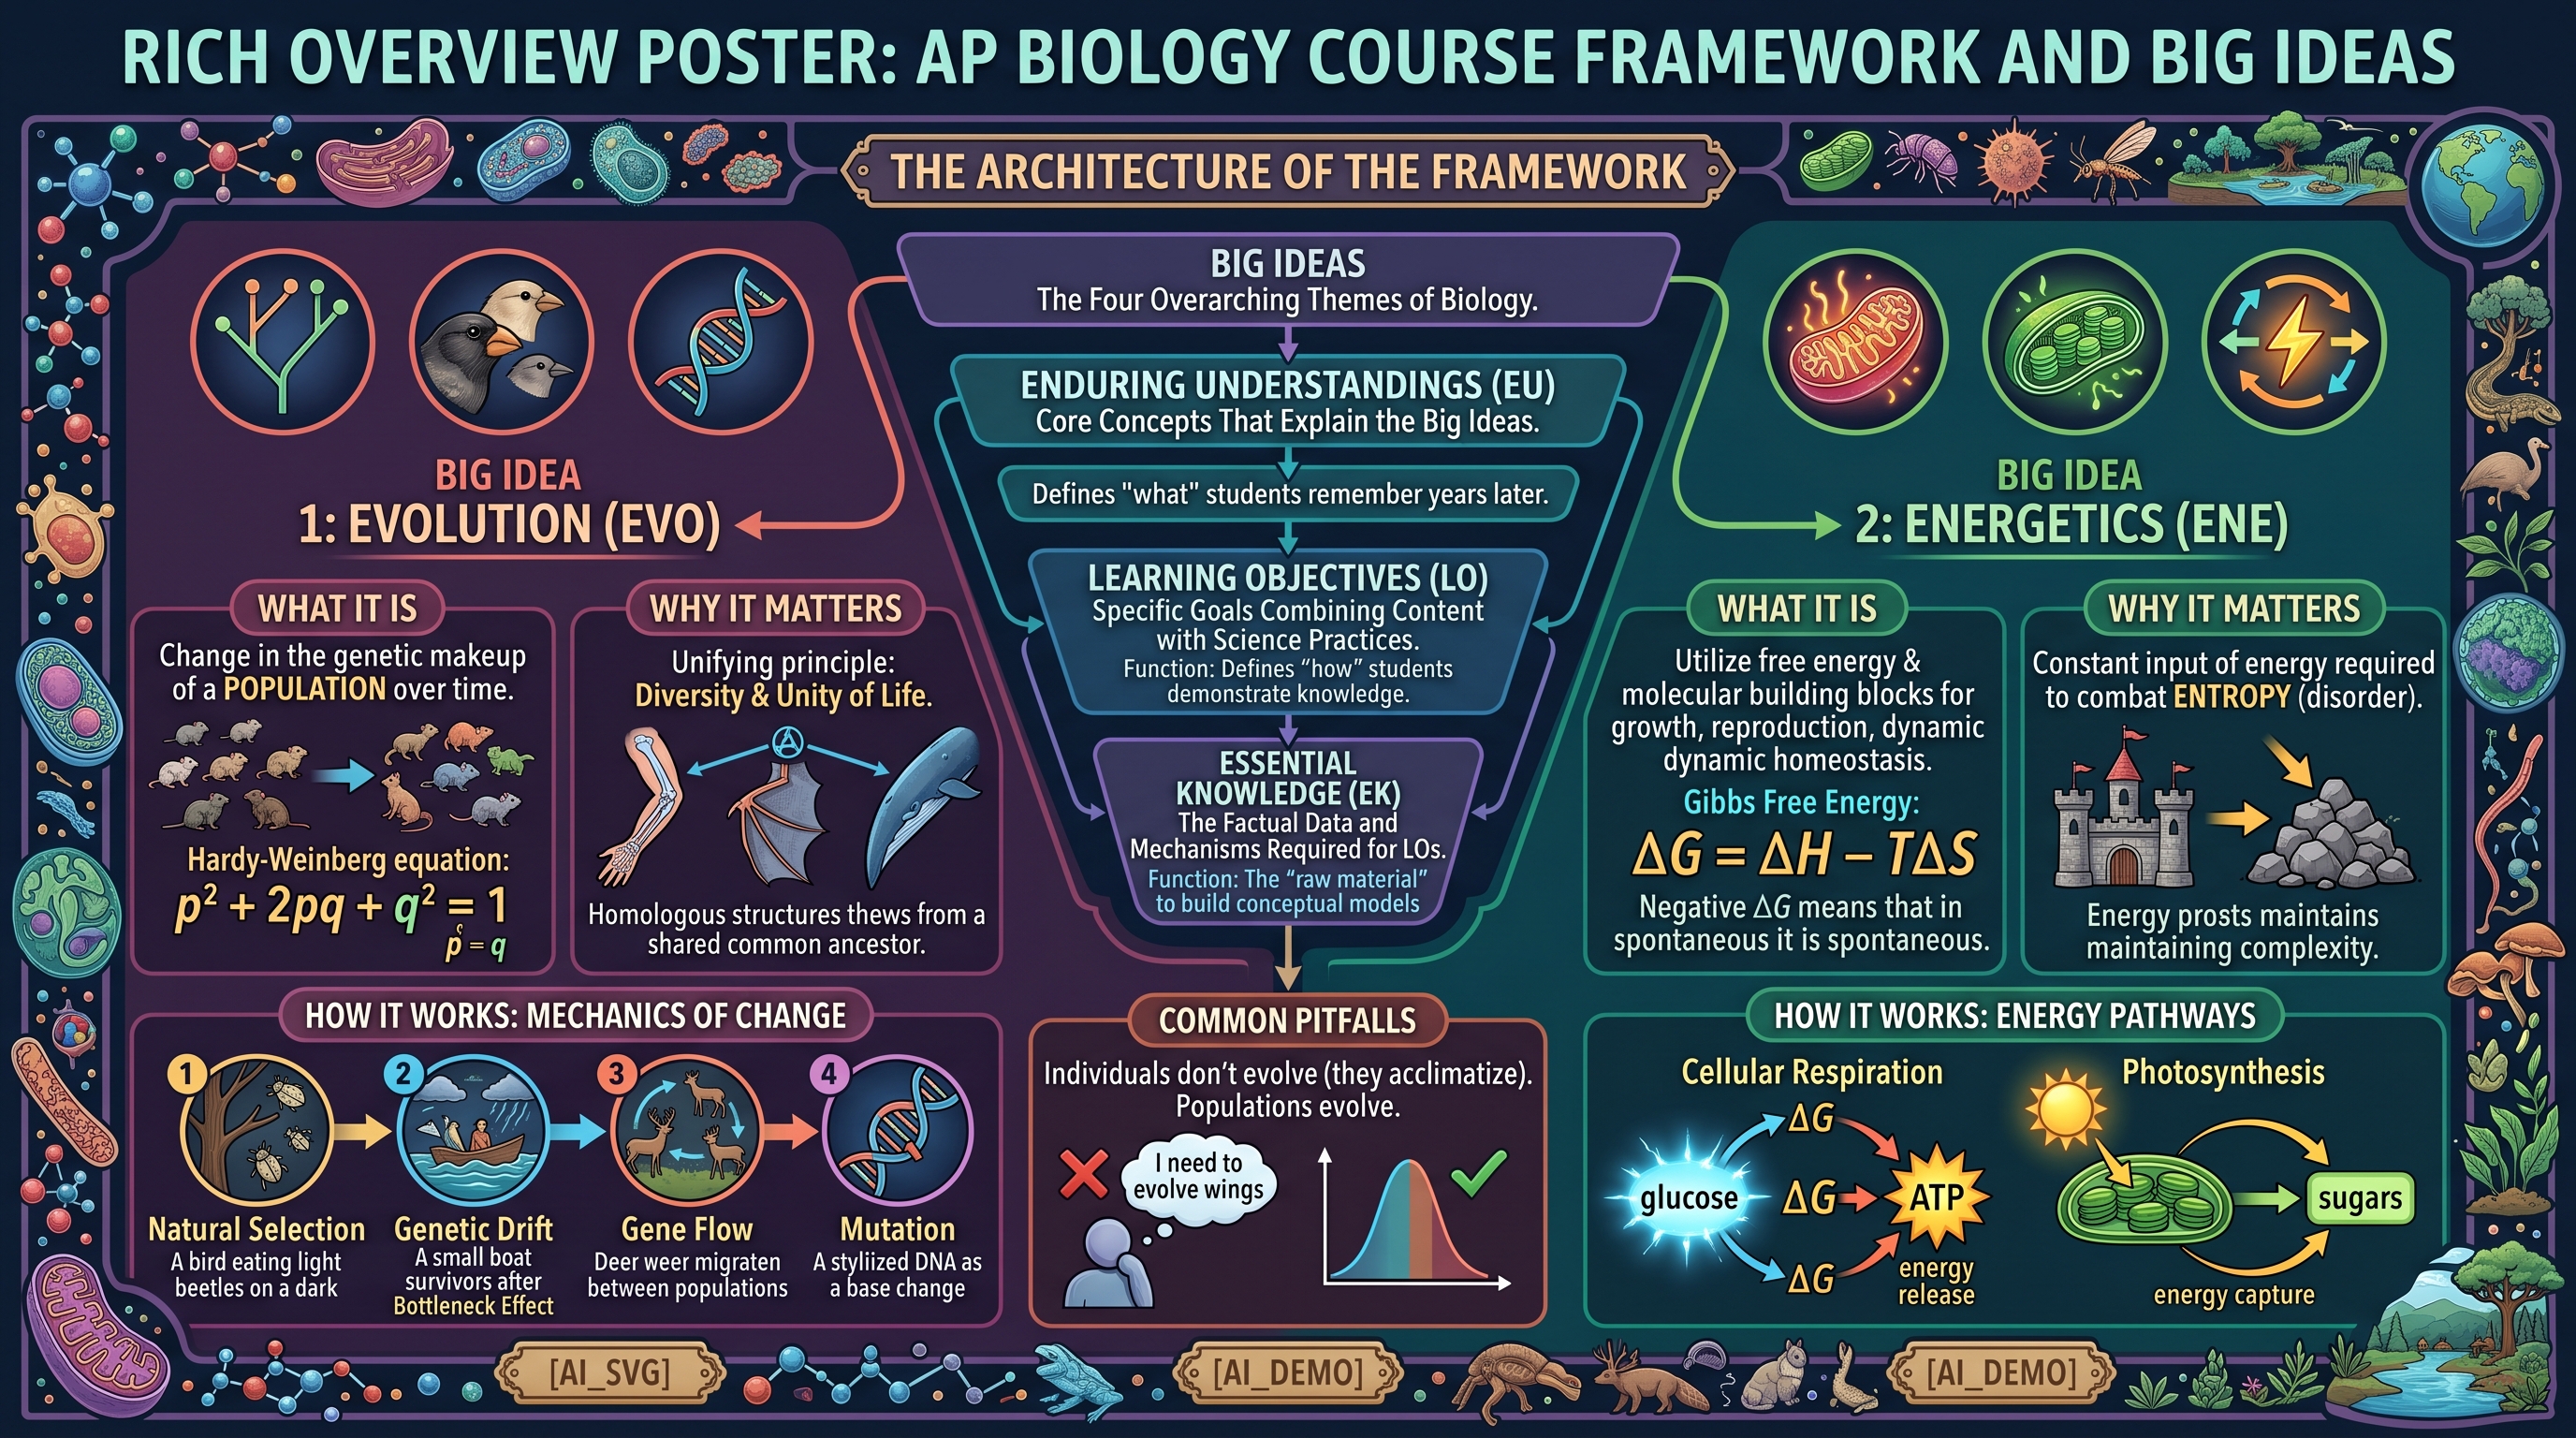
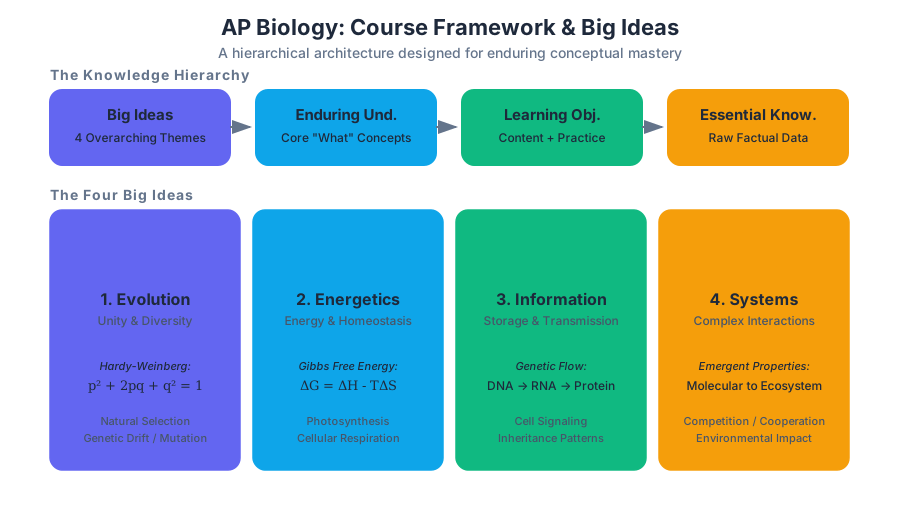
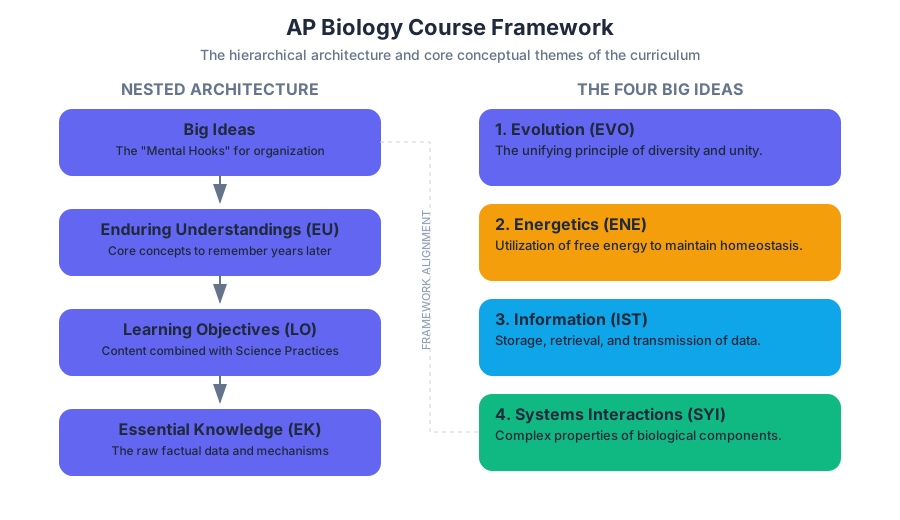
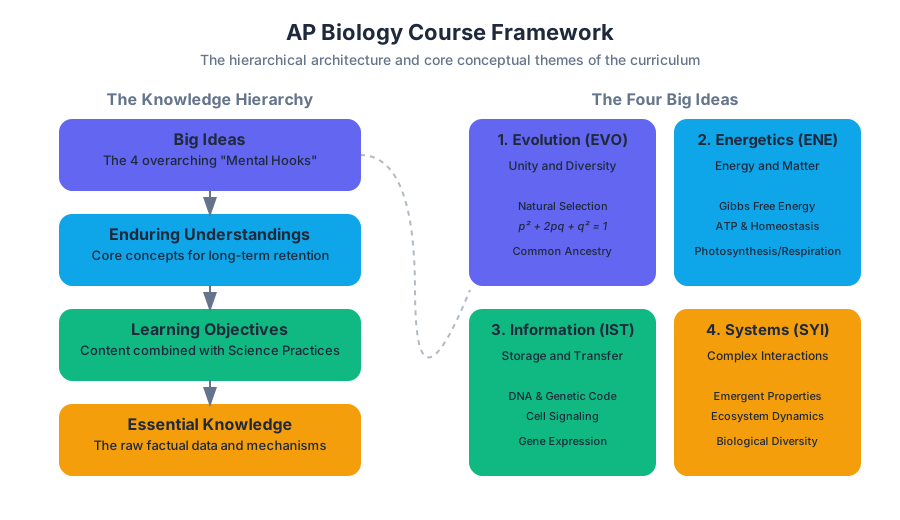
The Architecture of the Framework
The framework is built upon a hierarchy of knowledge: Big Ideas serve as the foundation, which are then subdivided into Enduring Understandings (EU), Learning Objectives (LO), and Essential Knowledge (EK). This "nested" architecture ensures that every laboratory investigation and classroom lecture aligns with a core principle of biological science.
| Component | Definition | Function in Learning |
|---|---|---|
| Big Ideas | The four overarching themes of biology. | Provides the "mental hooks" for organizing new information. |
| Enduring Understandings | Core concepts that explain the Big Ideas. | Defines the "what" that students should remember years later. |
| Learning Objectives | Specific goals that combine content with science practices. | Defines the "how" students will demonstrate their knowledge. |
| Essential Knowledge | The factual data and mechanisms required for the LOs. | The "raw material" used to build conceptual models. |
Big Idea 1: Evolution (EVO)
Evolution is the unifying principle of biology. It explains both the diversity of life (the millions of species currently inhabiting Earth) and the unity of life (the shared characteristics among all living organisms, such as the genetic code).
What it is
Evolution is defined as a change in the genetic makeup of a population over time. While individuals are the targets of selection, only populations evolve. Mathematically, this is expressed through the Hardy-Weinberg Equilibrium equation:
$$p^2 + 2pq + q^2 = 1$$
Where p and q represent the frequencies of the dominant and recessive alleles, respectively.
Why it matters
Without evolution, biology is a collection of disconnected anecdotes. Evolution provides the "Why" behind biological structures. For example, the similarity in the bone structure of a human arm and a bat's wing (homologous structures) is only explained by a shared common ancestor.
How it works: The Mechanics of Change
Evolutionary change is driven by several distinct forces, with Natural Selection being the primary mechanism for adaptation.
| Mechanism | Description | Effect on Variation |
|---|---|---|
| Natural Selection | Differential survival and reproduction based on phenotype. | Increases adaptation to the environment. |
| Genetic Drift | Random fluctuations in allele frequencies (e.g., Bottleneck Effect). | Reduces genetic variation, especially in small populations. |
| Gene Flow | Movement of alleles between populations (migration). | Increases variation within a population; decreases variation between populations. |
| Mutation | Random changes in DNA sequences. | The ultimate source of all new genetic variation. |
Common Pitfalls
- Teleology: The mistaken belief that evolution has a "goal" or that organisms "try" to evolve. Evolution is a reactive process, not a proactive one.
- Individual Evolution: The misconception that an individual can evolve during its lifetime. Individuals acclimatize; populations evolve.
Big Idea 2: Energetics (ENE)
Energetics describes how biological systems utilize free energy and molecular building blocks to grow, reproduce, and maintain dynamic homeostasis.
What it is
At its core, biological energetics is governed by the laws of thermodynamics. Living systems require a constant input of energy to combat entropy (disorder). This is quantified by Gibbs Free Energy ($\Delta G$):
$$\Delta G = \Delta H - T\Delta S$$
Key Insight: For a process to be spontaneous (exergonic), $\Delta G$ must be negative. Life maintains its complexity by "coupling" exergonic reactions (like ATP hydrolysis) to endergonic reactions (like protein synthesis).
Why it matters
Energy is the currency of life. If the input of energy ceases, or if the organism cannot efficiently convert energy from one form to another (e.g., solar to chemical in photosynthesis), the system reverts to equilibrium with its environment—which, for a biological system, is death.
How it works: Energy Pathways
The course focuses on two primary pathways: Photosynthesis (energy capture) and Cellular Respiration (energy release).
- Capture: Autotrophs capture light energy and store it in the chemical bonds of sugars.
- Conversion: All organisms (including plants) break down those sugars to produce ATP (Adenosine Triphosphate), the universal energy carrier.
- Utilization: ATP powers cellular work, including active transport, muscle contraction, and chemical synthesis.
| Process | Location | Key Inputs | Key Outputs |
|---|---|---|---|
| Light Reactions | Thylakoid Membrane | Light, $H_2O$, $NADP^+$, $ADP$ | $O_2$, $ATP$, $NADPH$ |
| Calvin Cycle | Stroma | $CO_2$, $ATP$, $NADPH$ | $G3P$ (Sugar precursors) |
| Glycolysis | Cytosol | Glucose, $NAD^+$, $ADP$ | Pyruvate, $NADH$, $ATP$ |
| Krebs Cycle | Mitochondrial Matrix | Acetyl-CoA, $NAD^+$, $FAD$ | $CO_2$, $NADH$, $FADH_2$, $ATP$ |
Concrete Example: Water Potential
Energetics also governs the movement of matter. Water Potential ($\Psi$) determines the direction of water flow in plants:
$$\Psi = \Psi_p + \Psi_s$$
Water moves from areas of high water potential to low water potential. This allows giant sequoias to transport water hundreds of feet into the air without a mechanical pump, relying instead on the free energy gradients created by transpiration.
Big Idea 3: Information Storage and Transmission (IST)
This Big Idea explores how living systems store, retrieve, transmit, and respond to information essential to life processes. This spans from the molecular level (DNA) to the organismal level (cell signaling).
What it is
Information in biology is primarily encoded in the sequence of nucleotides in DNA and RNA. The Central Dogma of molecular biology describes the flow of this information:
$$DNA \xrightarrow{\text{Transcription}} RNA \xrightarrow{\text{Translation}} Protein$$
Why it matters
Information allows for continuity of life. Genetic information is passed from one generation to the next with high fidelity, yet enough variation (mutations) is introduced to allow for evolution. Furthermore, cells must process environmental information (signals) to coordinate their behavior.
How it works: The Regulation of Information
Information is not just "present"; it is highly regulated. Not every gene is expressed in every cell at all times.
- Prokaryotic Regulation: Uses Operons (e.g., the lac operon) to turn genes on or off based on environmental triggers.
- Eukaryotic Regulation: Involves complex layers including chromatin remodeling, transcription factors, and RNA interference (RNAi).
- Cell Signaling: Cells communicate via chemical ligands that bind to receptors, triggering a Signal Transduction Pathway.
| Stage of Signaling | Mechanism | Key Components |
|---|---|---|
| Reception | Ligand binds to a specific receptor. | G-Protein Coupled Receptors (GPCRs), Ion Channels. |
| Transduction | Signal is converted and amplified. | Second messengers (cAMP, $Ca^{2+}$), Protein Kinases. |
| Response | The cell changes its behavior. | Gene expression, enzyme activation, apoptosis. |
Common Pitfalls
- DNA as a Blueprint: While often called a "blueprint," DNA is more like a "recipe." It doesn't contain a picture of the finished product; it contains instructions for building components that interact to form the product.
- Dominance vs. Prevalence: Many students assume "dominant" traits are more common in a population. Dominance only refers to the relationship between alleles in a heterozygote, not their frequency.
Big Idea 4: Systems Interactions (SYI)
Biological systems are not just a list of parts; they are complex networks of interactions. These interactions result in emergent properties—characteristics that appear at higher levels of organization that were not present at lower levels.
What it is
Systems interactions occur at every scale:
- Molecular: Enzymes interacting with substrates.
- Cellular: Organelles working together to export a protein.
- Organismal: The nervous and endocrine systems coordinating a "fight or flight" response.
- Ecological: Predators and prey regulating each other's population sizes.
Why it matters
Understanding systems allows us to predict how a change in one component will affect the whole. For example, removing a keystone species from an ecosystem can cause the entire system to collapse, a phenomenon known as a trophic cascade.
How it works: Feedback Loops
Systems maintain stability (homeostasis) or trigger rapid change through feedback mechanisms.
- Negative Feedback: The system responds in the opposite direction of the stimulus to return to a "set point" (e.g., insulin regulating blood glucose).
- Positive Feedback: The system amplifies the stimulus, moving further away from the set point (e.g., oxytocin during childbirth or ethylene gas in fruit ripening).
Concrete Example: Population Growth Models
The interaction between a population and its environment is modeled mathematically.
- Exponential Growth: $dN/dt = r_{max}N$ (Ideal conditions, unlimited resources).
- Logistic Growth: $dN/dt = r_{max}N \left( \frac{K-N}{K} \right)$ (Includes Carrying Capacity $K$).
The Eight Instructional Units
The AP Biology framework organizes these Big Ideas into a logical sequence of eight units. This sequence moves from the "micro" to the "macro," building a foundation of chemistry and cell biology before tackling genetics, evolution, and ecology.
| Unit | Title | Weighting | Key Concepts |
|---|---|---|---|
| 1 | Chemistry of Life | 8–11% | Water polarity, macromolecules (lipids, proteins, carbs, nucleic acids). |
| 2 | Cell Structure & Function | 10–13% | Organelles, cell size (SA:V ratio), membrane transport. |
| 3 | Cellular Energetics | 12–16% | Enzyme kinetics, photosynthesis, cellular respiration. |
| 4 | Cell Comm. & Cell Cycle | 10–15% | Signal transduction, mitosis, feedback loops. |
| 5 | Heredity | 8–11% | Meiosis, Mendelian genetics, non-Mendelian inheritance. |
| 6 | Gene Expression | 12–16% | DNA replication, transcription, translation, biotechnology. |
| 7 | Natural Selection | 13–20% | Phylogeny, speciation, population genetics. |
| 8 | Ecology | 10–15% | Energy flow, population dynamics, biodiversity. |
Science Practices and Laboratory Inquiry
A critical component of the framework is the integration of Science Practices. Students are not just expected to know biology; they must be able to do biology.
The Six Science Practices:
- Concept Explanation: Explain biological concepts and processes.
- Visual Representations: Create and analyze diagrams and models.
- Questions and Methods: Identify/pose testable questions and design experiments.
- Representing and Describing Data: Construct graphs and tables.
- Statistical Tests and Data Analysis: Perform mathematical calculations (Chi-square, standard error).
- Argumentation: Develop and justify scientific claims using evidence.
Laboratory Inquiry
The course requires that 25% of instructional time be dedicated to hands-on laboratory investigations. These are not "cookbook" labs where students follow a recipe; they are inquiry-based. Students must often design their own variables to test, such as determining which factors affect the rate of transpiration or how different environmental conditions influence the behavior of fruit flies.
Mathematical Foundation
The AP Biology exam frequently requires the application of mathematical tools. Students must be comfortable with:
- Chi-Square ($\chi^2$): Determining if observed data fits an expected distribution.
- Standard Deviation/Error: Assessing the precision of data and the significance of differences between groups.
- Probability Laws: Calculating the likelihood of specific genetic crosses (Product Rule and Sum Rule).
Assessment Structure
The AP Biology Exam is the final measure of a student's mastery of the framework. It is divided into two equally weighted sections.
Section I: Multiple-Choice Questions (MCQ)
- Quantity: 60 questions.
- Time: 90 minutes.
- Focus: Includes individual questions and sets based on data or scenarios. It tests both content knowledge and the ability to interpret data.
Section II: Free-Response Questions (FRQ)
- Quantity: 6 questions (2 long-form, 4 short-form).
- Time: 90 minutes.
- Focus:
- Q1: Interpreting and evaluating experimental results.
- Q2: Interpreting and evaluating experimental results with graphing.
- Q3: Scientific Investigation.
- Q4: Conceptual Analysis.
- Q5: Analyzing a Model or Visual Representation.
- Q6: Analyzing Data.
Science Practices and Quantitative Tools
Key concepts: Concept Explanation · Visual Representations · Questions and Methods · Representing and Describing Data · Statistical Tests · Argumentation
Exploration of the six essential science practices and the mathematical formulas required for biological analysis.
Science Practices and Quantitative Tools
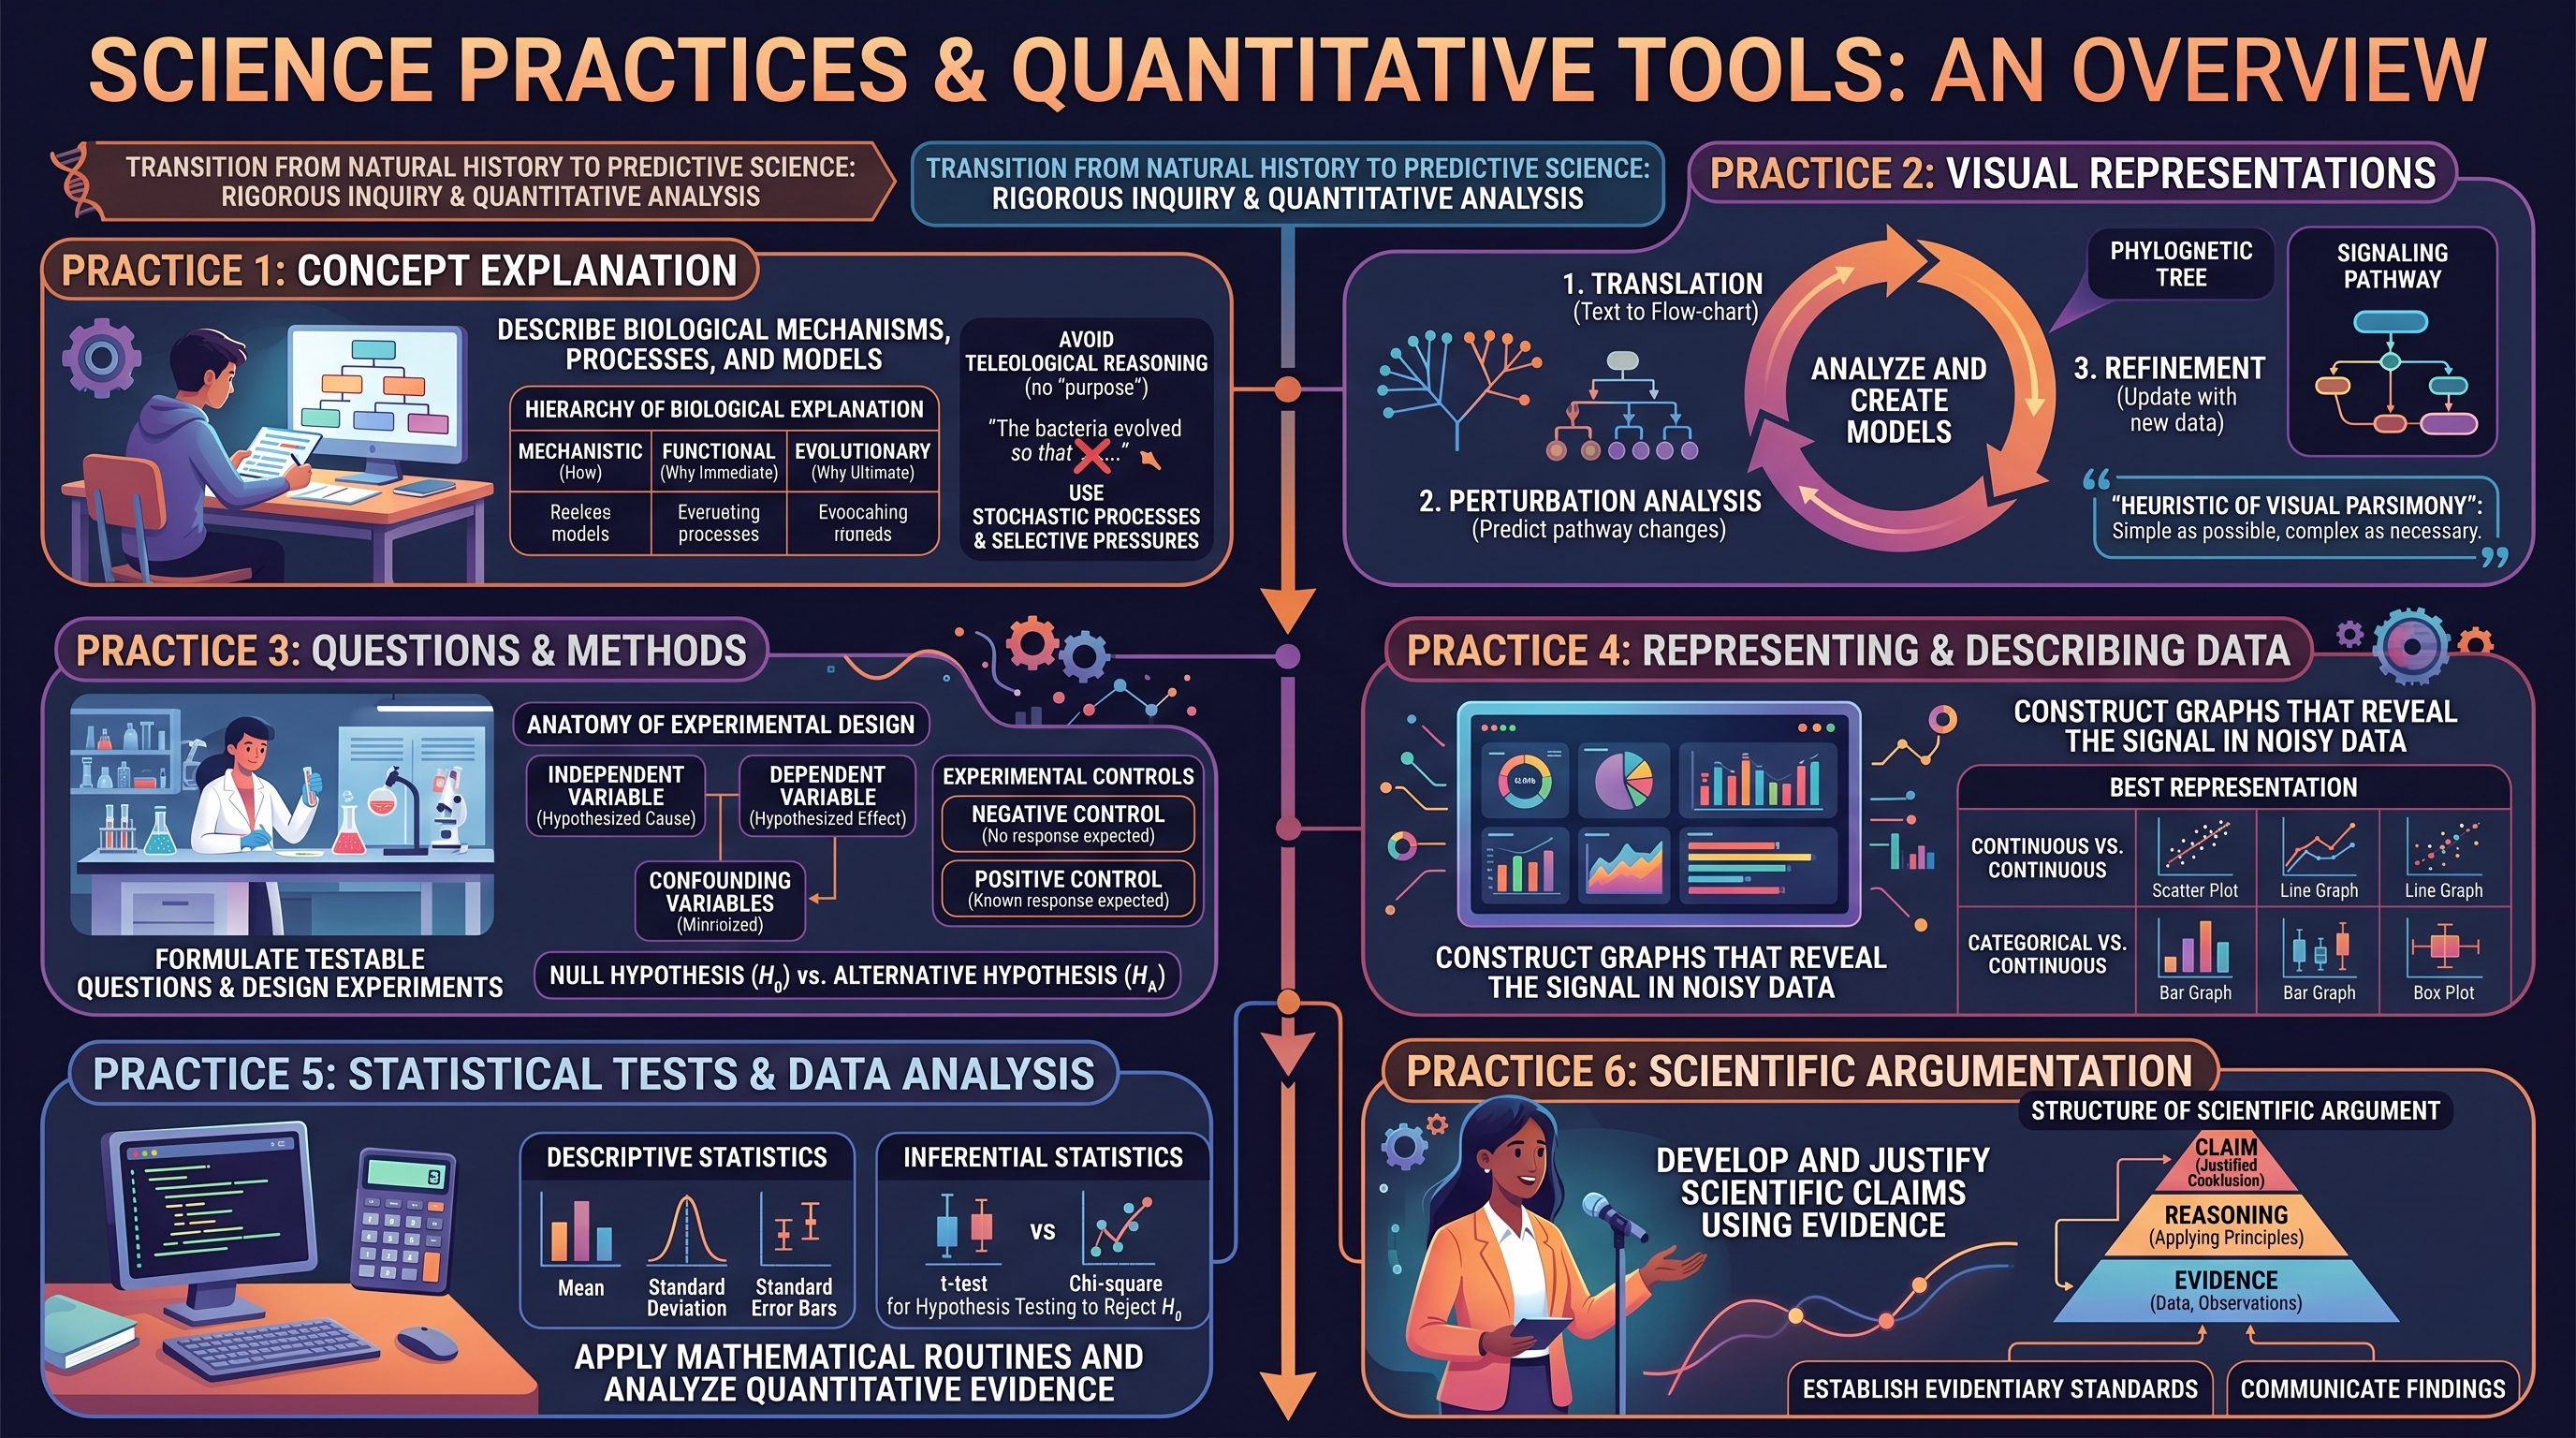
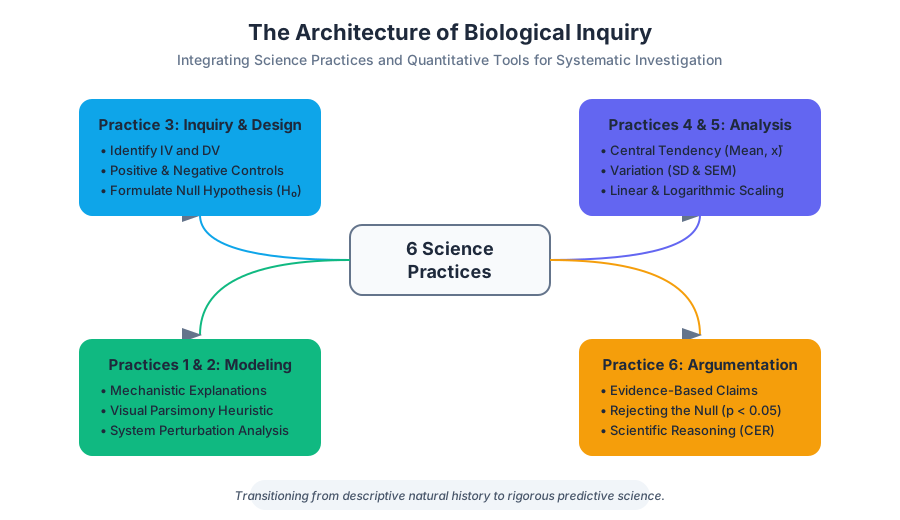
In the modern biological sciences, the transition from descriptive natural history to a rigorous, predictive discipline has been driven by the integration of quantitative analysis and systematic inquiry. The AP Biology framework codifies this evolution through six essential Science Practices. These practices are not merely "lab skills" but represent the cognitive architecture required to navigate complex biological systems. This article provides a deep-dive into these practices, the mathematical tools that support them, and the evidentiary standards required for scientific argumentation.
Practice 1: Concept Explanation
Concept Explanation is the ability to describe biological concepts, processes, and models in written format. At the expert level, this moves beyond simple definition-matching to explaining the mechanisms of action and the consequences of system perturbations.
The Hierarchy of Biological Explanation
To explain a concept effectively, one must connect different levels of biological organization. For instance, explaining "energetics" requires linking the sub-cellular movement of protons across a membrane (molecular level) to the fitness of an organism in a nutrient-scarce environment (organismal level).
| Level of Explanation | Focus | Example |
|---|---|---|
| Mechanistic | The "How" | How ATP synthase uses a proton gradient to phosphorylate ADP. |
| Functional | The "Why" (Immediate) | Why a cell requires a constant supply of $NAD^+$ for glycolysis. |
| Evolutionary | The "Why" (Ultimate) | Why the metabolic pathway of glycolysis is conserved across all domains of life. |
Common Pitfalls in Explanation
A frequent error is teleological reasoning—attributing "purpose" or "will" to biological processes (e.g., "The bacteria evolved resistance so that they could survive"). Expert explanation maintains strict adherence to stochastic processes and selective pressures: "Random mutations provided a selective advantage in the presence of antibiotics, leading to differential reproductive success."
Practice 2: Visual Representations
Biology is a visual science. From the double helix of DNA to the sprawling branches of a phylogenetic tree, visual models are used to condense high-dimensional data into interpretable formats.
Analyzing and Creating Models
Practice 2 requires students to not only "read" a diagram but to use it to predict how a system will behave. This involves:
- Translation: Converting a written description into a visual flow-chart.
- Perturbation Analysis: Predicting what happens to a signaling pathway if a specific protein is inhibited.
- Refinement: Modifying an existing model to account for new data.
The Heuristic of Visual Parsimony: A good biological model should be as simple as possible but as complex as necessary to illustrate the interaction of variables.
Practice 3: Questions and Methods
Scientific inquiry begins with a testable question. Practice 3 focuses on the methodology of investigation—the bridge between a curiosity and a data set.
The Anatomy of Experimental Design
A robust experiment must isolate the effect of the Independent Variable (IV) on the Dependent Variable (DV) while minimizing the influence of Confounding Variables.
| Component | Definition | Role in Inquiry |
|---|---|---|
| Independent Variable | The factor manipulated by the researcher. | The hypothesized "cause." |
| Dependent Variable | The factor measured or observed. | The hypothesized "effect." |
| Negative Control | A group where no response is expected. | Ensures the experiment can identify a "null" result. |
| Positive Control | A group where a known response is expected. | Ensures the experimental setup is capable of detecting a change. |
Formulating the Null Hypothesis ($H_0$)
In quantitative biology, we rarely "prove" a hypothesis. Instead, we attempt to reject the Null Hypothesis ($H_0$), which states that there is no significant difference between groups, and any observed difference is due to chance.
- Alternative Hypothesis ($H_A$): There is a significant difference between groups caused by the IV.
Practice 4: Representing and Describing Data
Data in its raw form is often "noisy." Practice 4 involves the construction of graphs and charts that reveal the underlying signal.
Selection of Graphical Formats
Choosing the wrong graph can obscure biological truths. The selection should be based on the nature of the data:
| Data Type | Best Representation | Purpose |
|---|---|---|
| Continuous vs. Continuous | Scatter Plot / Line Graph | Showing trends over time or concentration. |
| Categorical vs. Continuous | Bar Graph / Box Plot | Comparing means across different groups. |
| Part-to-Whole | Pie Chart (Rarely used) | Showing proportions (Stacked bars are often preferred). |
| Distribution | Histogram | Showing the frequency of values in a population. |
Scaling and Labeling
Expert-level data representation requires precise scaling. Axes must be labeled with units (e.g., Concentration (mmol/L)), and the scale must be linear unless a logarithmic scale is justified (e.g., for bacterial growth or pH).
Practice 5: Statistical Tests and Data Analysis
This practice is the quantitative core of the curriculum. It involves using the AP Biology Equations and Formulas Sheet to determine if data is mathematically significant.
Central Tendency and Variation
The Mean ($\bar{x}$) provides the average, but the Standard Deviation ($s$) tells us about the spread of the data. $$\bar{x} = \frac{1}{n} \sum_{i=1}^{n} x_i$$ $$s = \sqrt{\frac{\sum(x_i - \bar{x})^2}{n - 1}}$$
Standard Error of the Mean (SEM) and Confidence Intervals
The Standard Error ($SE_{\bar{x}}$) estimates how much the sample mean deviates from the true population mean. $$SE_{\bar{x}} = \frac{s}{\sqrt{n}}$$ In AP Biology, we typically plot Error Bars representing $\pm 2 SEM$. If the error bars of two means do not overlap, we can often conclude that the difference between them is statistically significant (usually at the $p < 0.05$ level).
The Chi-Square ($\chi^2$) Goodness of Fit Test
The Chi-Square test is used to determine if observed data fits an expected distribution (e.g., Mendelian ratios). $$\chi^2 = \sum \frac{(O - E)^2}{E}$$ Where $O$ is Observed and $E$ is Expected.
Worked Example: Mendelian Genetics Suppose you cross two heterozygous tall plants ($Tt \times Tt$). You expect a 3:1 ratio of Tall to Short. Out of 100 offspring, you observe 70 Tall and 30 Short.
- Expected: 75 Tall, 25 Short.
- Calculation:
- $\text{Tall}: \frac{(70-75)^2}{75} = \frac{25}{75} = 0.33$
- $\text{Short}: \frac{(30-25)^2}{25} = \frac{25}{25} = 1.0$
- $\chi^2 = 0.33 + 1.0 = 1.33$
- Degrees of Freedom ($df$): $n - 1 = 2 - 1 = 1$.
- Critical Value: At $p=0.05$ and $df=1$, the critical value is $3.84$.
- Conclusion: Since $1.33 < 3.84$, we fail to reject the null hypothesis. The deviation is due to chance.
Practice 6: Argumentation
Argumentation is the process of reaching a conclusion based on evidence and reasoning. In biology, this follows the Claim-Evidence-Reasoning (CER) framework.
The CER Framework
- Claim: A statement that answers the scientific question.
- Evidence: Scientific data (quantitative or qualitative) that supports the claim.
- Reasoning: A justification that connects the evidence to the claim, using biological principles.
The Principle of Falsifiability: For an argument to be scientific, there must be a theoretical observation that could prove it wrong. Arguments based on untestable premises are outside the scope of science.
Advanced Quantitative Tools: The Formula Sheet Deep Dive
Beyond basic statistics, AP Biology requires proficiency in specific mathematical models governing thermodynamics, genetics, and ecology.
1. Water Potential ($\Psi$)
Water potential predicts the direction of water movement. Water always moves from areas of high water potential (more "free" water) to low water potential. $$\Psi = \Psi_p + \Psi_s$$
- Pressure Potential ($\Psi_p$): Can be positive (turgor pressure) or negative (tension).
- Solute Potential ($\Psi_s$): Calculated as $\Psi_s = -iCRT$.
- $i$: Ionization constant (1.0 for sucrose, 2.0 for $NaCl$).
- $C$: Molar concentration.
- $R$: Pressure constant ($0.0831 \frac{L \cdot bar}{mol \cdot K}$).
- $T$: Temperature in Kelvin ($273 + ^\circ C$).
2. Hardy-Weinberg Equilibrium
This model describes a non-evolving population where allele frequencies remain constant. $$p^2 + 2pq + q^2 = 1$$ $$p + q = 1$$
- $p$: Frequency of the dominant allele ($A$).
- $q$: Frequency of the recessive allele ($a$).
- $p^2$: Frequency of the homozygous dominant genotype ($AA$).
- $2pq$: Frequency of the heterozygous genotype ($Aa$).
- $q^2$: Frequency of the homozygous recessive genotype ($aa$).
Pitfall Alert: When solving Hardy-Weinberg problems, always find $q$ (the frequency of the recessive allele) first by taking the square root of the frequency of the recessive phenotype ($q^2$).
3. Surface Area-to-Volume Ratio ($SA/V$)
This ratio explains why cells are microscopic. As a cell increases in size, its volume ($r^3$) grows much faster than its surface area ($r^2$).
- High $SA/V$: Efficient exchange of materials (nutrients in, waste out).
- Low $SA/V$: Inefficient exchange; the center of the cell "starves" or "suffocates."
| Shape | Surface Area | Volume | $SA/V$ Ratio |
|---|---|---|---|
| Sphere | $4\pi r^2$ | $\frac{4}{3}\pi r^3$ | $3/r$ |
| Cube | $6s^2$ | $s^3$ | $6/s$ |
Summary of Science Practice Integration
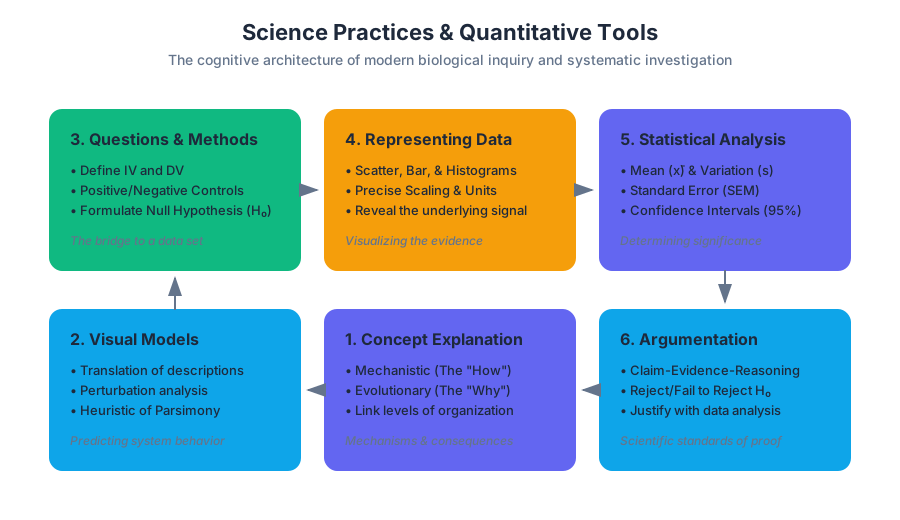
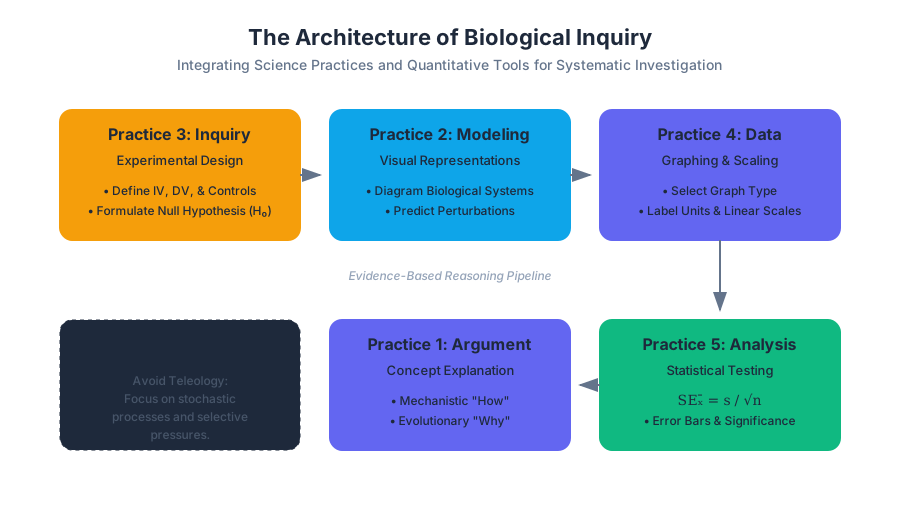
The six practices are not isolated; they function as a pipeline. An investigation begins with a Question (P3), moves to Visualizing the mechanism (P2), involves Data Collection and Representation (P4), requires Statistical Analysis (P5), and culminates in a written Argument (P6) that Explains the Concept (P1).
Laboratory Documentation and Inquiry
The AP Biology curriculum emphasizes Inquiry-Based Investigations. Unlike "cookbook" labs where students follow a recipe to a known result, inquiry labs require students to design their own procedures.
The Lab Notebook
A professional lab notebook is a legal and scientific record. It should include:
- Title and Date: For traceability.
- Hypothesis: Clear $H_0$ and $H_A$.
- Materials and Methods: Detailed enough for another scientist to replicate the study.
- Raw Data: Unprocessed measurements.
- Data Analysis: Calculations, graphs, and statistical tests.
- Conclusion: Reflection on whether the data supported the hypothesis and identification of sources of error.
Maintaining a rigorous lab notebook is often a prerequisite for receiving college credit, as it serves as evidence of the "laboratory component" of the course.
Conclusion
Mastery of Science Practices and Quantitative Tools transforms a student from a passive consumer of biological facts into an active participant in scientific discovery. By utilizing the statistical rigor of Chi-square tests, the predictive power of Hardy-Weinberg, and the logical structure of CER, one gains the tools necessary to decode the complexities of the living world. This quantitative foundation is the hallmark of college-level biological inquiry and the standard for professional scientific practice.
Molecular and Cellular Biology
Key concepts: Chemistry of Life · Properties of Water · Macromolecules · Cell Structure · Organelles · Membrane Permeability
Covers the chemical foundations of life and the structural components of the cell (Units 1 and 2).
Molecular and Cellular Biology
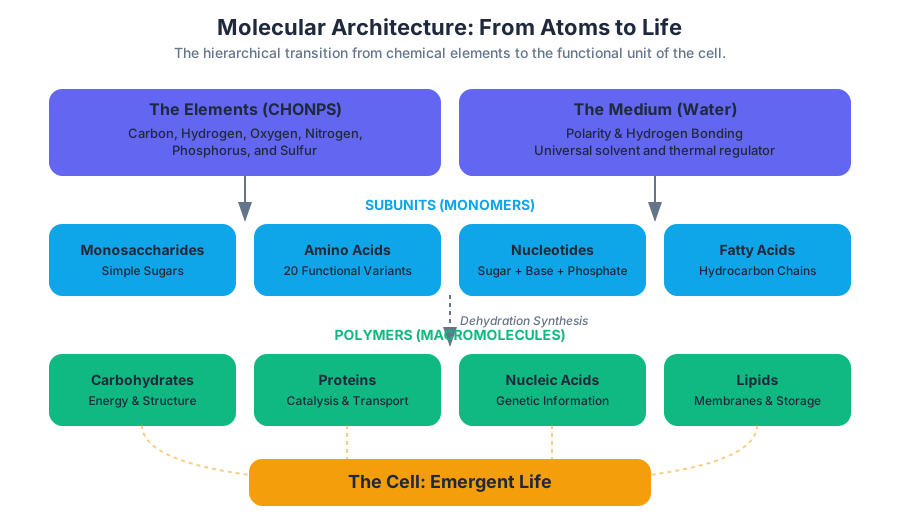
Molecular and cellular biology serves as the "low-level architecture" of biological systems. To understand how complex organisms function, one must first deconstruct the system into its fundamental chemical components and the specialized compartments that house them. This section explores the transition from inorganic chemistry to organic macromolecules, and finally to the emergence of the cell—the smallest unit of life capable of independent existence.
The Chemistry of Life: Water and the Elements of Biological Systems
What it is
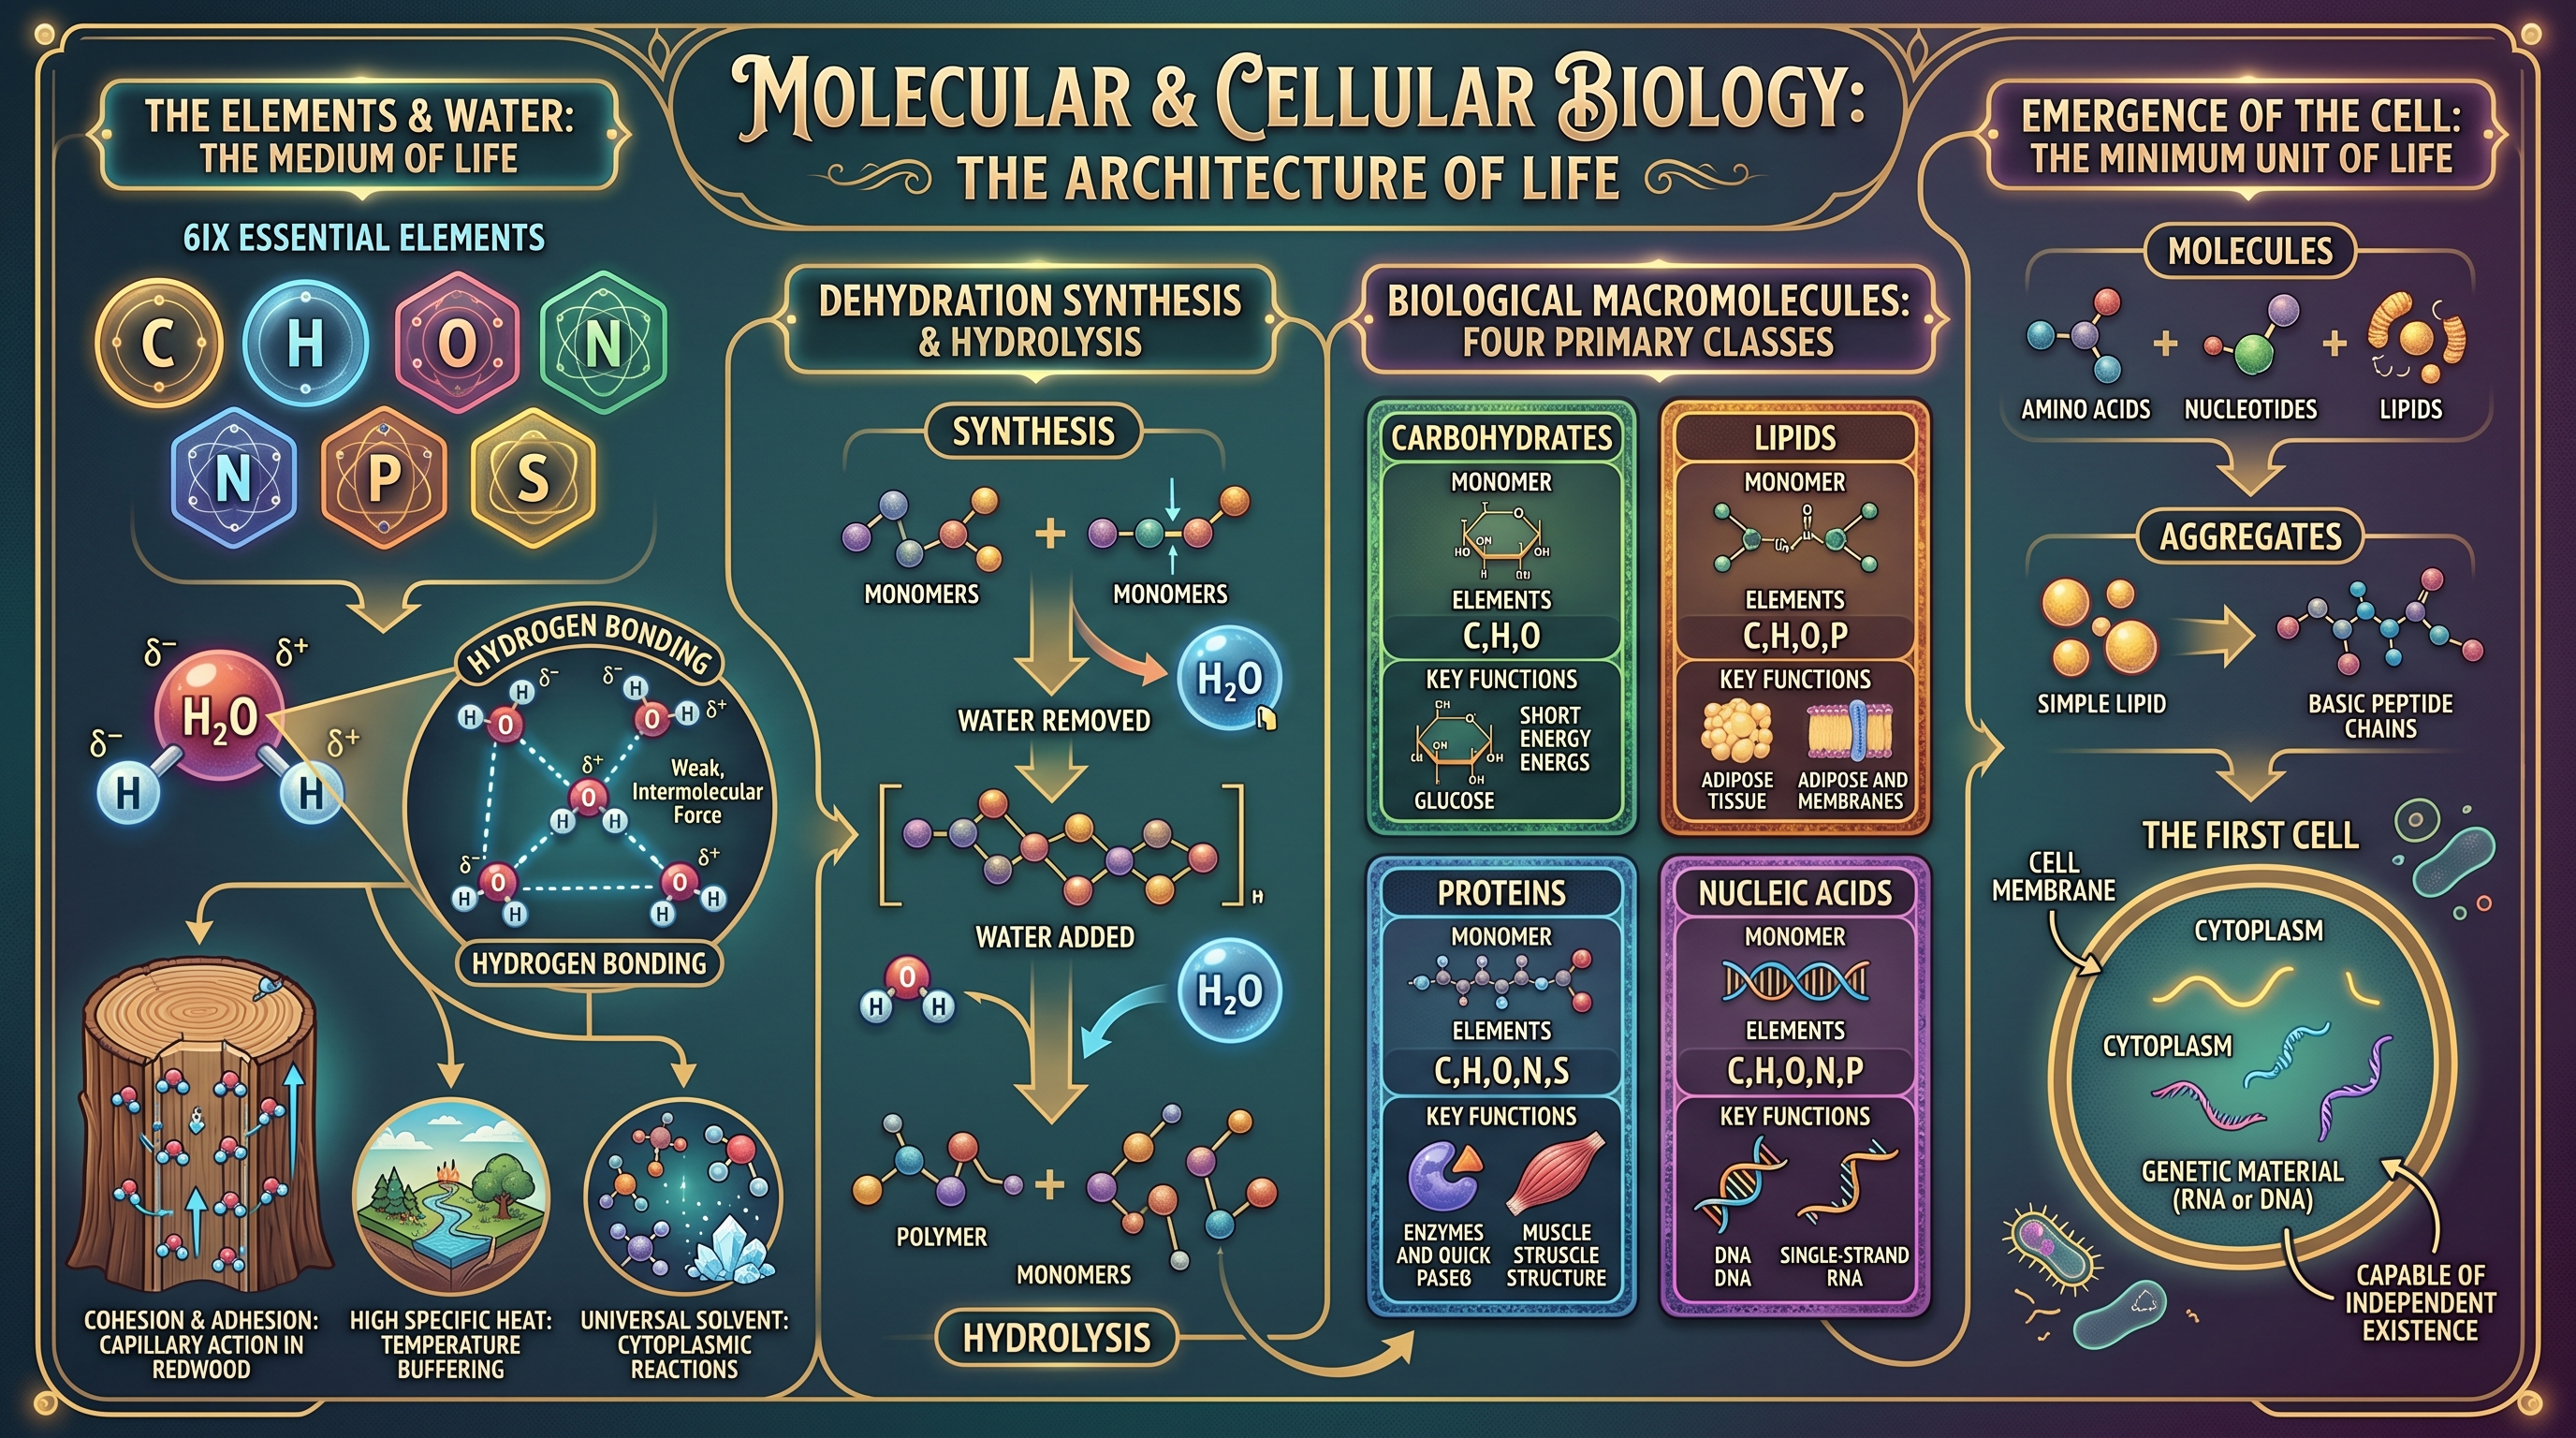
The chemistry of life is governed by the interaction of specific elements—primarily carbon (C), hydrogen (H), oxygen (O), nitrogen (N), phosphorus (P), and sulfur (S). These elements form the basis of all biological molecules. However, the medium in which these interactions occur is water ($H_2O$), a polar molecule characterized by its ability to form hydrogen bonds.
Why it matters
Life as we know it is impossible without water. Its unique physical properties allow for temperature regulation, nutrient transport, and the maintenance of cellular structure. From an engineering perspective, water is the universal solvent and the primary thermal regulator for the "biological engine."
How it works: The Physics of Water
Water is a polar molecule because oxygen is more electronegative than hydrogen. This creates a partial negative charge ($\delta^-$) near the oxygen atom and a partial positive charge ($\delta^+$) near the hydrogen atoms. This dipole moment allows water molecules to attract one another through hydrogen bonding.
| Property | Description | Biological Significance |
|---|---|---|
| Cohesion | Water molecules stick to each other via H-bonds. | Creates surface tension and allows for the transport of water in plants. |
| Adhesion | Water molecules stick to other polar surfaces. | Facilitates capillary action in xylem vessels. |
| High Specific Heat | Water resists changes in temperature. | Buffers organisms and ecosystems against rapid temperature fluctuations. |
| Evaporative Cooling | High heat of vaporization. | Allows organisms to dissipate excess body heat (e.g., sweating). |
| Density Anomaly | Ice is less dense than liquid water. | Prevents lakes from freezing solid, preserving aquatic life in winter. |
| Universal Solvent | Dissolves polar and ionic substances. | Facilitates chemical reactions and nutrient transport within the cytoplasm. |
Concrete Example: Capillary Action
In a 100-meter tall redwood tree, water must move from the roots to the leaves against gravity. This is achieved through a combination of cohesion (water molecules pulling each other up) and adhesion (water molecules clinging to the cellulose walls of the xylem). This "transpiration pull" is a passive process driven entirely by the chemical properties of water.
Common Pitfalls
- Confusing Hydrogen Bonds with Covalent Bonds: Hydrogen bonds are intermolecular forces (between molecules), whereas covalent bonds are intramolecular (within a single molecule). H-bonds are much weaker but collectively powerful.
- Hydrophobic vs. Hydrophilic: Nonpolar molecules (like oils) cannot form H-bonds and are "pushed" away by water. This is the hydrophobic effect, which is the primary driver behind cell membrane formation and protein folding.
Biological Macromolecules: The Polymers of Life
What it is
Biological macromolecules are large, complex molecules built from smaller subunits called monomers. There are four primary classes: Carbohydrates, Lipids, Proteins, and Nucleic Acids.
How it works: Synthesis and Breakdown
All macromolecules (except lipids) are formed through dehydration synthesis and broken down through hydrolysis.
- Dehydration Synthesis: A hydrogen atom (H) is removed from one monomer and a hydroxyl group (OH) is removed from another, forming a covalent bond and releasing a water molecule.
- Hydrolysis: A water molecule is added to break a covalent bond, effectively reversing the synthesis process.
The Four Classes of Macromolecules
| Macromolecule | Monomer | Elements | Key Functions |
|---|---|---|---|
| Carbohydrates | Monosaccharides | C, H, O | Short-term energy (glucose), structural support (cellulose, chitin). |
| Lipids | N/A (Glycerol/Fatty Acids) | C, H, O (P in phospholipids) | Long-term energy storage, membrane structure, signaling (hormones). |
| Proteins | Amino Acids | C, H, O, N, S | Catalysis (enzymes), transport, structure, immune defense. |
| Nucleic Acids | Nucleotides | C, H, O, N, P | Information storage (DNA) and transmission (RNA). |
Variations: Protein Folding
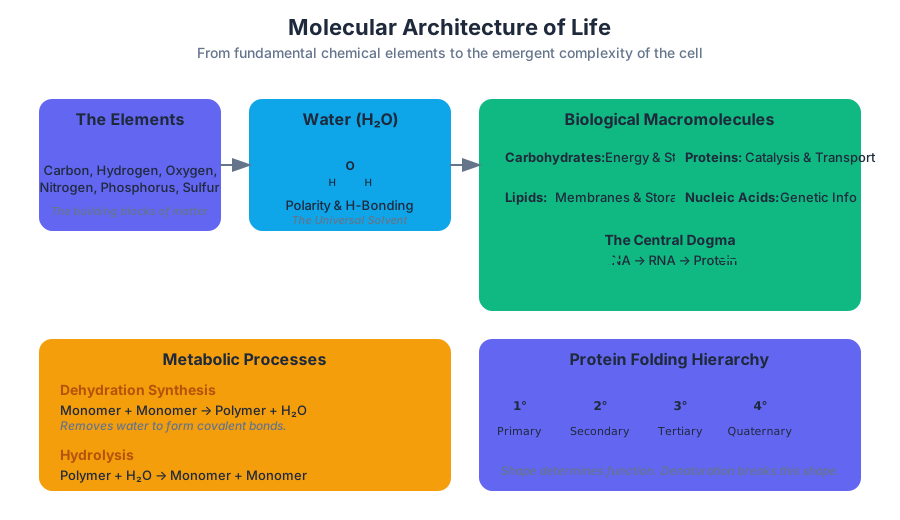
Proteins are the most functionally diverse macromolecules. Their function is strictly determined by their 3D shape, which occurs in four stages:
- Primary ($1^\circ$): The linear sequence of amino acids held by peptide bonds.
- Secondary ($2^\circ$): Local folding into $\alpha$-helices or $\beta$-pleated sheets via H-bonding in the backbone.
- Tertiary ($3^\circ$): The overall 3D shape determined by R-group interactions (hydrophobic interactions, disulfide bridges, ionic bonds).
- Quaternary ($4^\circ$): The interaction between multiple polypeptide chains (e.g., Hemoglobin).
The Central Dogma of Molecular Biology: Information flows from DNA (storage) $\rightarrow$ RNA (messenger) $\rightarrow$ Protein (functional product).
Common Pitfalls
- Lipids as Polymers: Strictly speaking, lipids are not polymers because they are not made of repeating monomeric units in the same way proteins or nucleic acids are.
- Denaturation: When a protein loses its shape due to pH or temperature changes, it loses its function. This is usually irreversible for complex proteins.
Cell Structure and Subcellular Organelles
What it is
The cell is the fundamental unit of life. It can be categorized into two main types: Prokaryotic (lacking a nucleus and membrane-bound organelles) and Eukaryotic (containing a nucleus and specialized compartments).
Why it matters
Compartmentalization is the key to eukaryotic efficiency. By isolating specific chemical reactions within organelles, the cell can maintain different pH levels or concentrations of enzymes, preventing interference between metabolic pathways.
How it works: The Organelle Network
The eukaryotic cell functions like a highly automated factory.
| Organelle | Structure | Function (The "Factory" Analogy) |
|---|---|---|
| Nucleus | Double membrane with pores. | Administrative Office: Stores genetic blueprints (DNA). |
| Ribosomes | rRNA and protein complexes. | Assembly Line: Synthesizes proteins. |
| Rough ER | Network of tubules with ribosomes. | Manufacturing Plant: Modifies and packages proteins. |
| Smooth ER | Tubule network (no ribosomes). | Chemical Lab: Lipid synthesis and detoxification. |
| Golgi Apparatus | Flattened membrane sacs (cisternae). | Shipping/Receiving: Sorts and tags proteins for export. |
| Mitochondria | Double membrane; inner folds (cristae). | Power Plant: Produces ATP via cellular respiration. |
| Chloroplasts | Thylakoid stacks (grana) in stroma. | Solar Panels: Converts light to chemical energy (sugar). |
| Lysosomes | Sacs of hydrolytic enzymes. | Waste Management: Digests old organelles and debris. |
| Vacuoles | Large membrane-bound sacs. | Warehouse: Stores water, nutrients, or waste. |
Concrete Example: The Endomembrane System
Consider the production of insulin (a protein).
- The instructions are transcribed in the nucleus.
- The protein is synthesized by a ribosome on the Rough ER.
- It is transported via a vesicle to the Golgi Apparatus.
- The Golgi "tags" the insulin for secretion.
- A secretory vesicle fuses with the plasma membrane, releasing insulin into the bloodstream.
Variations: Endosymbiosis Theory
The Endosymbiosis Theory posits that mitochondria and chloroplasts were once free-living prokaryotes that were engulfed by a larger host cell.
- Evidence: Both have their own circular DNA, their own ribosomes (similar to prokaryotic ribosomes), and double membranes. They also reproduce independently via binary fission.
Cell Size and the Surface Area-to-Volume Ratio
What it is
The physical size of a cell is limited by the laws of diffusion. As a cell grows, its volume increases much faster than its surface area.
Why it matters
Cells rely on their surface area (the plasma membrane) to exchange nutrients and waste with the environment. If a cell becomes too large, its surface area cannot support the metabolic demands of its internal volume.
How it works: The Math of Efficiency
For a cuboidal cell with side length $s$:
- Surface Area ($SA$) = $6s^2$
- Volume ($V$) = $s^3$
- Ratio = $6/s$
As $s$ increases, the ratio $6/s$ decreases. A higher $SA:V$ ratio is more efficient.
| Side Length ($s$) | Surface Area ($6s^2$) | Volume ($s^3$) | $SA:V$ Ratio |
|---|---|---|---|
| 1 $\mu m$ | 6 | 1 | 6:1 |
| 2 $\mu m$ | 24 | 8 | 3:1 |
| 10 $\mu m$ | 600 | 1000 | 0.6:1 |
Variations: Specialized Structures
To overcome size limitations, cells evolve specialized shapes:
- Root hairs in plants increase surface area for water absorption.
- Microvilli in the human small intestine increase surface area for nutrient absorption.
- Flattened shapes (like red blood cells) minimize the distance oxygen must travel to reach the center.
Membrane Permeability and Transport
What it is
The Plasma Membrane is a selectively permeable barrier described by the Fluid Mosaic Model. It consists of a phospholipid bilayer with embedded proteins, cholesterol, and carbohydrates.
How it works: The Phospholipid Bilayer
Phospholipids are amphipathic, meaning they have a hydrophilic (polar) phosphate head and two hydrophobic (nonpolar) fatty acid tails. In water, they spontaneously form a bilayer where the tails face inward, away from the water.
Membrane Permeability Rules
- Small, nonpolar molecules ($N_2$, $O_2$, $CO_2$) pass freely through the bilayer.
- Small, uncharged polar molecules ($H_2O$) pass in small amounts.
- Large polar molecules (glucose) and Ions ($Na^+$, $K^+$, $Cl^-$) cannot pass through the lipid core and require transport proteins.
Mechanisms of Transport
| Type | Energy Required? | Direction | Mechanism |
|---|---|---|---|
| Simple Diffusion | No (Passive) | High $\rightarrow$ Low | Molecules move directly through the bilayer. |
| Facilitated Diffusion | No (Passive) | High $\rightarrow$ Low | Uses channel proteins (e.g., aquaporins) or carrier proteins. |
| Osmosis | No (Passive) | High $\Psi$ $\rightarrow$ Low $\Psi$ | Diffusion of water across a membrane. |
| Active Transport | Yes (ATP) | Low $\rightarrow$ High | Uses pumps (e.g., $Na^+/K^+$ ATPase) to create gradients. |
| Endocytosis | Yes (ATP) | Into Cell | Membrane folds inward to bring in large particles. |
| Exocytosis | Yes (ATP) | Out of Cell | Vesicles fuse with the membrane to release contents. |
Water Potential ($\Psi$)
Water moves from areas of high water potential to low water potential. $$\Psi = \Psi_s + \Psi_p$$ Where:
- $\Psi_s$ = Solute Potential (Always $\le 0$). Adding solute lowers water potential.
- $\Psi_p$ = Pressure Potential (Can be positive or negative). In plant cells, this is turgor pressure.
Solute Potential Formula: $$\Psi_s = -iCRT$$
- $i$ = Ionization constant (e.g., 1 for sucrose, 2 for $NaCl$)
- $C$ = Molar concentration
- $R$ = Pressure constant ($0.0831 \frac{L \cdot bars}{mol \cdot K}$)
- $T$ = Temperature in Kelvin ($273 + ^\circ C$)
Common Pitfalls
-
Active vs. Passive: Students often think "facilitated diffusion" is active because it uses a protein. It is passive because it follows the concentration gradient.
-
Hypotonic vs. Hypertonic:
- Hypotonic: Lower solute concentration outside. Water enters the cell (cell may burst/lyse).
- Hypertonic: Higher solute concentration outside. Water leaves the cell (cell shrivels/plasmolyzes).
- Isotonic: Equal concentration. No net movement.
-
Amphipathic: A molecule possessing both hydrophilic and hydrophobic regions (e.g., phospholipids).
-
Aquaporin: A specialized channel protein that facilitates the rapid transport of water across the membrane.
-
Chemiosmosis: The movement of ions across a semipermeable membrane, down their electrochemical gradient (essential for ATP production).
-
Denaturation: The process where a protein loses its native shape due to external stress, rendering it non-functional.
-
Endosymbiosis: A symbiotic relationship where one organism lives inside another; the origin of mitochondria and chloroplasts.
-
Turgor Pressure: The pressure exerted by water inside the central vacuole against the plant cell wall, providing structural support.
-
Water Potential: A measure of the free energy of water, determining the direction of osmosis.
- Question: Why is the surface area-to-volume ratio a limiting factor for cell size?
- Answer: As volume increases, metabolic demand grows cubically, while the surface area available for nutrient/waste exchange only grows quadratically. Eventually, the membrane cannot support the internal volume.
- Question: A plant cell is placed in a solution with a lower water potential than the cell's interior. What happens?
- Answer: Water will move out of the cell (from high $\Psi$ to low $\Psi$), causing the plasma membrane to pull away from the cell wall, a process known as plasmolysis.
- Question: How does the structure of a phospholipid contribute to the "fluidity" of the membrane?
- Answer: The hydrophobic tails are composed of fatty acids. If these tails are unsaturated (containing double bonds), they create "kinks" that prevent tight packing, increasing fluidity.
- Question: Which organelle would be most abundant in a cell specialized for secreting digestive enzymes?
- Answer: The Rough Endoplasmic Reticulum and Golgi Apparatus, as they are responsible for protein synthesis and packaging for secretion.
- Question: Calculate the solute potential ($\Psi_s$) of a 0.5M sucrose solution at $20^\circ C$ in an open beaker.
- Answer: $\Psi_s = -(1)(0.5)(0.0831)(293) \approx -12.17$ bars.
Unit 1: Chemistry of Life
- Master the properties of water (H-bonding is the root cause of all).
- Be able to identify the four macromolecules by their chemical structure (look for N in proteins, P in nucleic acids).
- Understand directionality: Nucleic acids are $5' \rightarrow 3'$; Proteins are $N \rightarrow C$.
Unit 2: Cell Structure and Function
- Focus on the relationship between structure and function. If an organelle has folds (cristae, thylakoids), it's to increase surface area for reactions.
- Know the endomembrane system pathway perfectly.
- Practice $SA:V$ math. If given a choice between several cell shapes, choose the one with the highest ratio for efficiency.
- Membrane transport: Always ask "Does it need energy?" and "Is it going with or against the gradient?"
- Water Potential: Remember that water always moves toward the more negative $\Psi$ value.
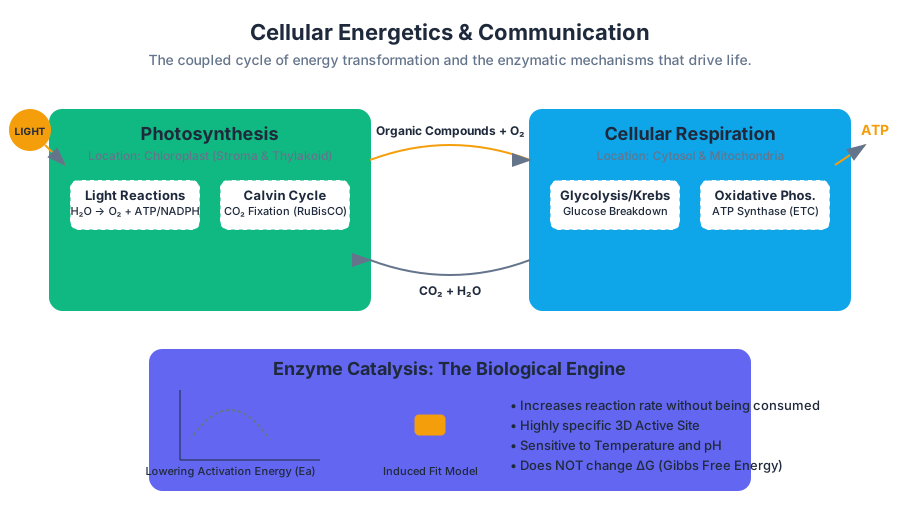
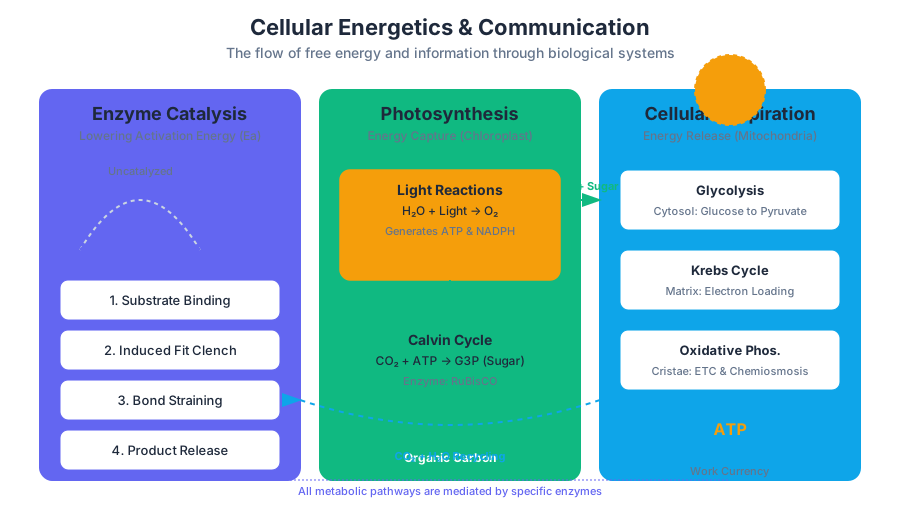
Cellular Energetics and Communication
Key concepts: Enzyme Catalysis · Photosynthesis · Cellular Respiration · Signal Transduction · Cell Cycle · Mitosis
Focuses on how cells capture energy and communicate with one another (Units 3 and 4).
Cellular Energetics and Communication
Life is an emergent property of complex molecular interactions governed by the laws of thermodynamics and the necessity of information flow. At the cellular level, this manifests as two primary pillars: Energetics—the capture, storage, and utilization of free energy—and Communication—the sensing and processing of internal and external stimuli to coordinate biological activity.
In this deep dive, we explore the mechanisms that allow biological systems to resist entropy through enzyme-mediated catalysis, the bioenergetic pathways of photosynthesis and respiration, and the sophisticated signaling networks that regulate the cell cycle and mitosis.
Enzyme Catalysis
What it is
Enzymes are biological catalysts, typically proteins (though some are RNA-based ribozymes), that increase the rate of chemical reactions without being consumed in the process. They function by lowering the Activation Energy ($E_a$), the initial investment of energy required to reach the transition state of a reaction.
Why it matters
Most biological reactions are thermodynamically favorable ($\Delta G < 0$) but kinetically "locked" because the ambient thermal energy is insufficient to break existing chemical bonds. Without enzymes, the metabolic processes required for life would occur at rates too slow to sustain even the simplest organism.
How it works: The Mechanism of Action
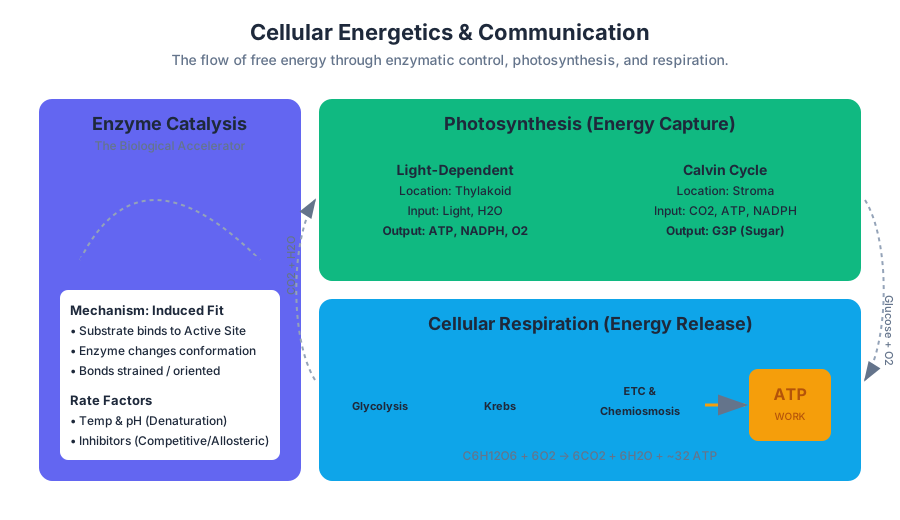
Enzymes operate via the Induced Fit Model. The enzyme possesses an Active Site, a specific 3D cleft formed by the folding of the polypeptide chain.
- Substrate Binding: The substrate binds to the active site via weak interactions (hydrogen bonds, ionic bonds).
- Induced Fit: The enzyme undergoes a conformational change to "clench" the substrate, orienting it optimally for the reaction.
- Catalysis: The enzyme lowers $E_a$ through several strategies:
- Orienting substrates correctly.
- Straining substrate bonds.
- Providing a favorable microenvironment (e.g., acidic or basic residues).
- Covalent participation (briefly forming a bond with the substrate).
- Product Release: The products have a lower affinity for the active site and are released, returning the enzyme to its original state.
Factors Influencing Catalytic Rate
The efficiency of an enzyme is highly sensitive to its environment.
| Parameter | Impact on Rate | Mechanism |
|---|---|---|
| Temperature | Increases to a point, then crashes | Increased kinetic energy boosts collisions; excessive heat causes denaturation (unfolding). |
| pH | Bell-shaped curve | H+ or OH- ions disrupt ionic bonds and H-bonds, altering the enzyme's 3D shape. |
| Substrate Conc. | Hyperbolic increase | Rate increases until saturation (all active sites are occupied). |
| Inhibitors | Decrease rate | Competitive inhibitors block the active site; non-competitive inhibitors bind elsewhere (allosteric site). |
Common Pitfalls
Crucial Insight: A common misconception is that enzymes change the $\Delta G$ (Gibbs Free Energy) of a reaction. They do not. An enzyme cannot make an endergonic reaction ($\Delta G > 0$) occur spontaneously; it only accelerates reactions that are already thermodynamically possible.
Photosynthesis
What it is
Photosynthesis is the process by which autotrophic organisms convert light energy into chemical energy stored in the bonds of sugars. It is the primary entry point of energy into the biosphere.
Why it matters
Photosynthesis provides the molecular building blocks (carbon skeletons) and the energy source for nearly all life on Earth. Furthermore, the byproduct—molecular oxygen ($O_2$)—is essential for aerobic respiration.
How it works: The Two-Stage Process
Photosynthesis occurs in the chloroplast and is divided into the Light-Dependent Reactions and the Light-Independent Reactions (Calvin Cycle).
The Net Equation:
6CO_2 + 6H_2O + \text{light energy} \rightarrow C_6H_{12}O_6 + 6O_2
1. Light-Dependent Reactions (Thylakoid Membrane)
Light energy is captured by Photosystems (PS II and PS I).
- Photolysis: Water is split ($H_2O \rightarrow 2H^+ + 2e^- + \frac{1}{2}O_2$), providing electrons to replace those lost by PS II.
- Electron Transport Chain (ETC): Electrons move through a series of proteins, pumping $H^+$ into the thylakoid lumen, creating a Proton Motive Force.
- Chemiosmosis: $H^+$ flows back through ATP Synthase, generating ATP.
- Reduction: Electrons are finally transferred to $NADP^+$ to form $NADPH$.
2. The Calvin Cycle (Stroma)
The Calvin Cycle uses the ATP and NADPH from the light reactions to fix carbon.
- Carbon Fixation: $CO_2$ is attached to RuBP by the enzyme RuBisCO.
- Reduction: ATP and NADPH are used to convert the fixed carbon into G3P (Glyceraldehyde-3-phosphate).
- Regeneration: Some G3P is used to rebuild RuBP, while the rest exits to form glucose.
| Feature | Light-Dependent Reactions | Calvin Cycle |
|---|---|---|
| Location | Thylakoid Membrane | Stroma |
| Input | Light, $H_2O$, $ADP$, $NADP^+$ | $CO_2$, $ATP$, $NADPH$ |
| Output | $O_2$, $ATP$, $NADPH$ | $G3P$ (Sugar), $ADP$, $NADP^+$ |
| Primary Enzyme | ATP Synthase | RuBisCO |
Cellular Respiration
What it is
Cellular Respiration is the catabolic pathway of aerobic and anaerobic systems that breaks down organic molecules (primarily glucose) to produce Adenosine Triphosphate (ATP), the universal energy currency of the cell.
Why it matters
ATP is required for mechanical work (muscle contraction), transport work (pumping ions), and chemical work (synthesizing polymers). Respiration is the mechanism by which cells extract the energy stored in the "high-energy" C-H bonds of glucose.
How it works: The Metabolic Pipeline
Aerobic respiration occurs in four distinct stages:
- Glycolysis (Cytosol):
- Glucose (6C) is broken into two Pyruvate (3C) molecules.
- Net yield: $2 ATP$ (via substrate-level phosphorylation) and $2 NADH$.
- Pyruvate Oxidation (Mitochondrial Matrix):
- Pyruvate is converted to Acetyl-CoA.
- Releases $CO_2$ and generates $NADH$.
- Krebs Cycle / Citric Acid Cycle (Matrix):
- Acetyl-CoA is fully oxidized to $CO_2$.
- Yields $2 ATP$, $6 NADH$, and $2 FADH_2$ per glucose.
- Oxidative Phosphorylation (Inner Membrane):
- ETC: $NADH$ and $FADH_2$ donate electrons to the chain. As electrons drop in energy, $H^+$ ions are pumped into the intermembrane space.
- Chemiosmosis: The $H^+$ gradient drives ATP Synthase.
- Final Electron Acceptor: Oxygen ($O_2$) accepts electrons and $H^+$ to form $H_2O$.
Worked Example: The ATP Accounting
Calculating the theoretical maximum yield of ATP from one molecule of glucose:
- Glycolysis: 2 ATP
- Krebs Cycle: 2 ATP
- Oxidative Phosphorylation:
- 10 NADH $\times$ ~2.5 ATP/NADH = 25 ATP
- 2 FADH2 $\times$ ~1.5 ATP/FADH2 = 3 ATP
- Total: ~30–32 ATP
Note: The actual yield is often lower due to the cost of transporting pyruvate into the mitochondria and the use of the proton gradient for other purposes.
Variations: Anaerobic Respiration and Fermentation
In the absence of oxygen, the ETC stalls. To keep glycolysis running, cells must regenerate $NAD^+$.
- Lactic Acid Fermentation: Pyruvate is reduced to Lactate (occurs in muscle cells).
- Alcohol Fermentation: Pyruvate is converted to Ethanol and $CO_2$ (occurs in yeast).
Cell Communication and Signal Transduction
What it is
Signal Transduction is the process by which a chemical or physical signal is transmitted through a cell as a series of molecular events, most commonly protein phosphorylation, which ultimately results in a cellular response.
Why it matters
Multicellularity requires coordination. Cells must "know" when to grow, when to die (apoptosis), and how to respond to environmental changes (e.g., glucose levels in the blood).
How it works: The Three Stages
- Reception: A signaling molecule (Ligand) binds to a specific Receptor (e.g., G-Protein Coupled Receptors or Receptor Tyrosine Kinases). The ligand does not usually enter the cell.
- Transduction: The signal is converted into a form that can bring about a response. This often involves:
- Phosphorylation Cascades: Enzymes called Kinases add phosphate groups to proteins to activate them.
- Second Messengers: Small, non-protein molecules like cAMP or $Ca^{2+}$ that spread rapidly through the cytosol.
- Response: The final activity, such as turning on a gene (transcription), opening an ion channel, or activating an enzyme.
Signal Amplification
One of the most critical aspects of transduction is amplification. A single ligand binding to a receptor can trigger the activation of dozens of G-proteins, which each activate an adenylyl cyclase, which each produce hundreds of cAMP molecules, leading to the activation of thousands of target proteins.
| Component | Role | Example |
|---|---|---|
| Ligand | Primary Messenger | Epinephrine, Insulin |
| Receptor | Signal Detector | GPCR, Ion Channel |
| Kinase | Signal Propagator | Protein Kinase A (PKA) |
| Phosphatase | Signal Terminator | Protein Phosphatase 1 |
| Second Messenger | Intracellular Relay | cAMP, $IP_3$, $Ca^{2+}$ |
Common Pitfalls
- Receptor Specificity: Students often assume any ligand can bind to any receptor. In reality, binding is highly specific based on the molecular geometry and charge of the active site.
- Signal Termination: Forgetting that signals must be turned off. Without phosphatases or the hydrolysis of GTP, the cell would remain in a permanent state of "on," which is a hallmark of many cancers.
The Cell Cycle and Mitosis
What it is
The Cell Cycle is an ordered series of events involving cell growth and nuclear division that produces two identical daughter cells. Mitosis is the specific phase of nuclear division.
Why it matters
The cell cycle is fundamental for growth, tissue repair, and asexual reproduction. Precise regulation is mandatory; failure to control the cycle leads to uncontrolled cell proliferation—Cancer.
How it works: Phases of the Cycle
- Interphase (90% of the cycle):
- $G_1$ (Gap 1): Cell growth and metabolic activity.
- $S$ (Synthesis): DNA replication occurs. The chromosome number stays the same, but each chromosome now consists of two sister chromatids.
- $G_2$ (Gap 2): Final preparations for division; organelle duplication.
- M Phase (Mitotic Phase):
- Mitosis: Division of the nucleus.
- Cytokinesis: Division of the cytoplasm.
The Mechanics of Mitosis
Mitosis is a continuous process divided into five sub-phases:
| Phase | Key Events |
|---|---|
| Prophase | Chromatin condenses into visible chromosomes; spindle fibers emerge from centrosomes. |
| Prometaphase | Nuclear envelope breaks down; microtubules attach to kinetochores. |
| Metaphase | Chromosomes align at the metaphase plate (equator). |
| Anaphase | Sister chromatids are pulled apart toward opposite poles. |
| Telophase | Nuclear envelopes reform; chromosomes de-condense. |
Regulation: Checkpoints and Cyclins
The cell cycle is governed by an internal control system.
- Checkpoints: Critical points ($G_1, G_2, M$) where "stop" and "go-ahead" signals regulate the cycle. The $G_1$ checkpoint (the "Restriction Point") is the most important; if a cell passes $G_1$, it usually completes the entire cycle.
- Cyclins and CDKs: Cyclins are proteins whose concentration fluctuates. They bind to Cyclin-Dependent Kinases (CDKs). The resulting complex (e.g., MPF - Maturation Promoting Factor) triggers the transition into the next phase.
Common Pitfalls
- Chromosome vs. Chromatid: A chromosome is a single DNA molecule. After the S phase, it consists of two sister chromatids, but it is still considered one chromosome until the chromatids separate during anaphase.
- Centromere vs. Centrosome: The centromere is the region of the chromosome where sister chromatids join; the centrosome is the microtubule-organizing center at the poles of the cell.
Genetics and Information Transmission
Key concepts: Meiosis · Mendelian Genetics · Non-Mendelian Inheritance · DNA Replication · Transcription · Translation · Biotechnology
Explores the mechanisms of inheritance and the molecular basis of gene expression (Units 5 and 6).
Genetics and Information Transmission
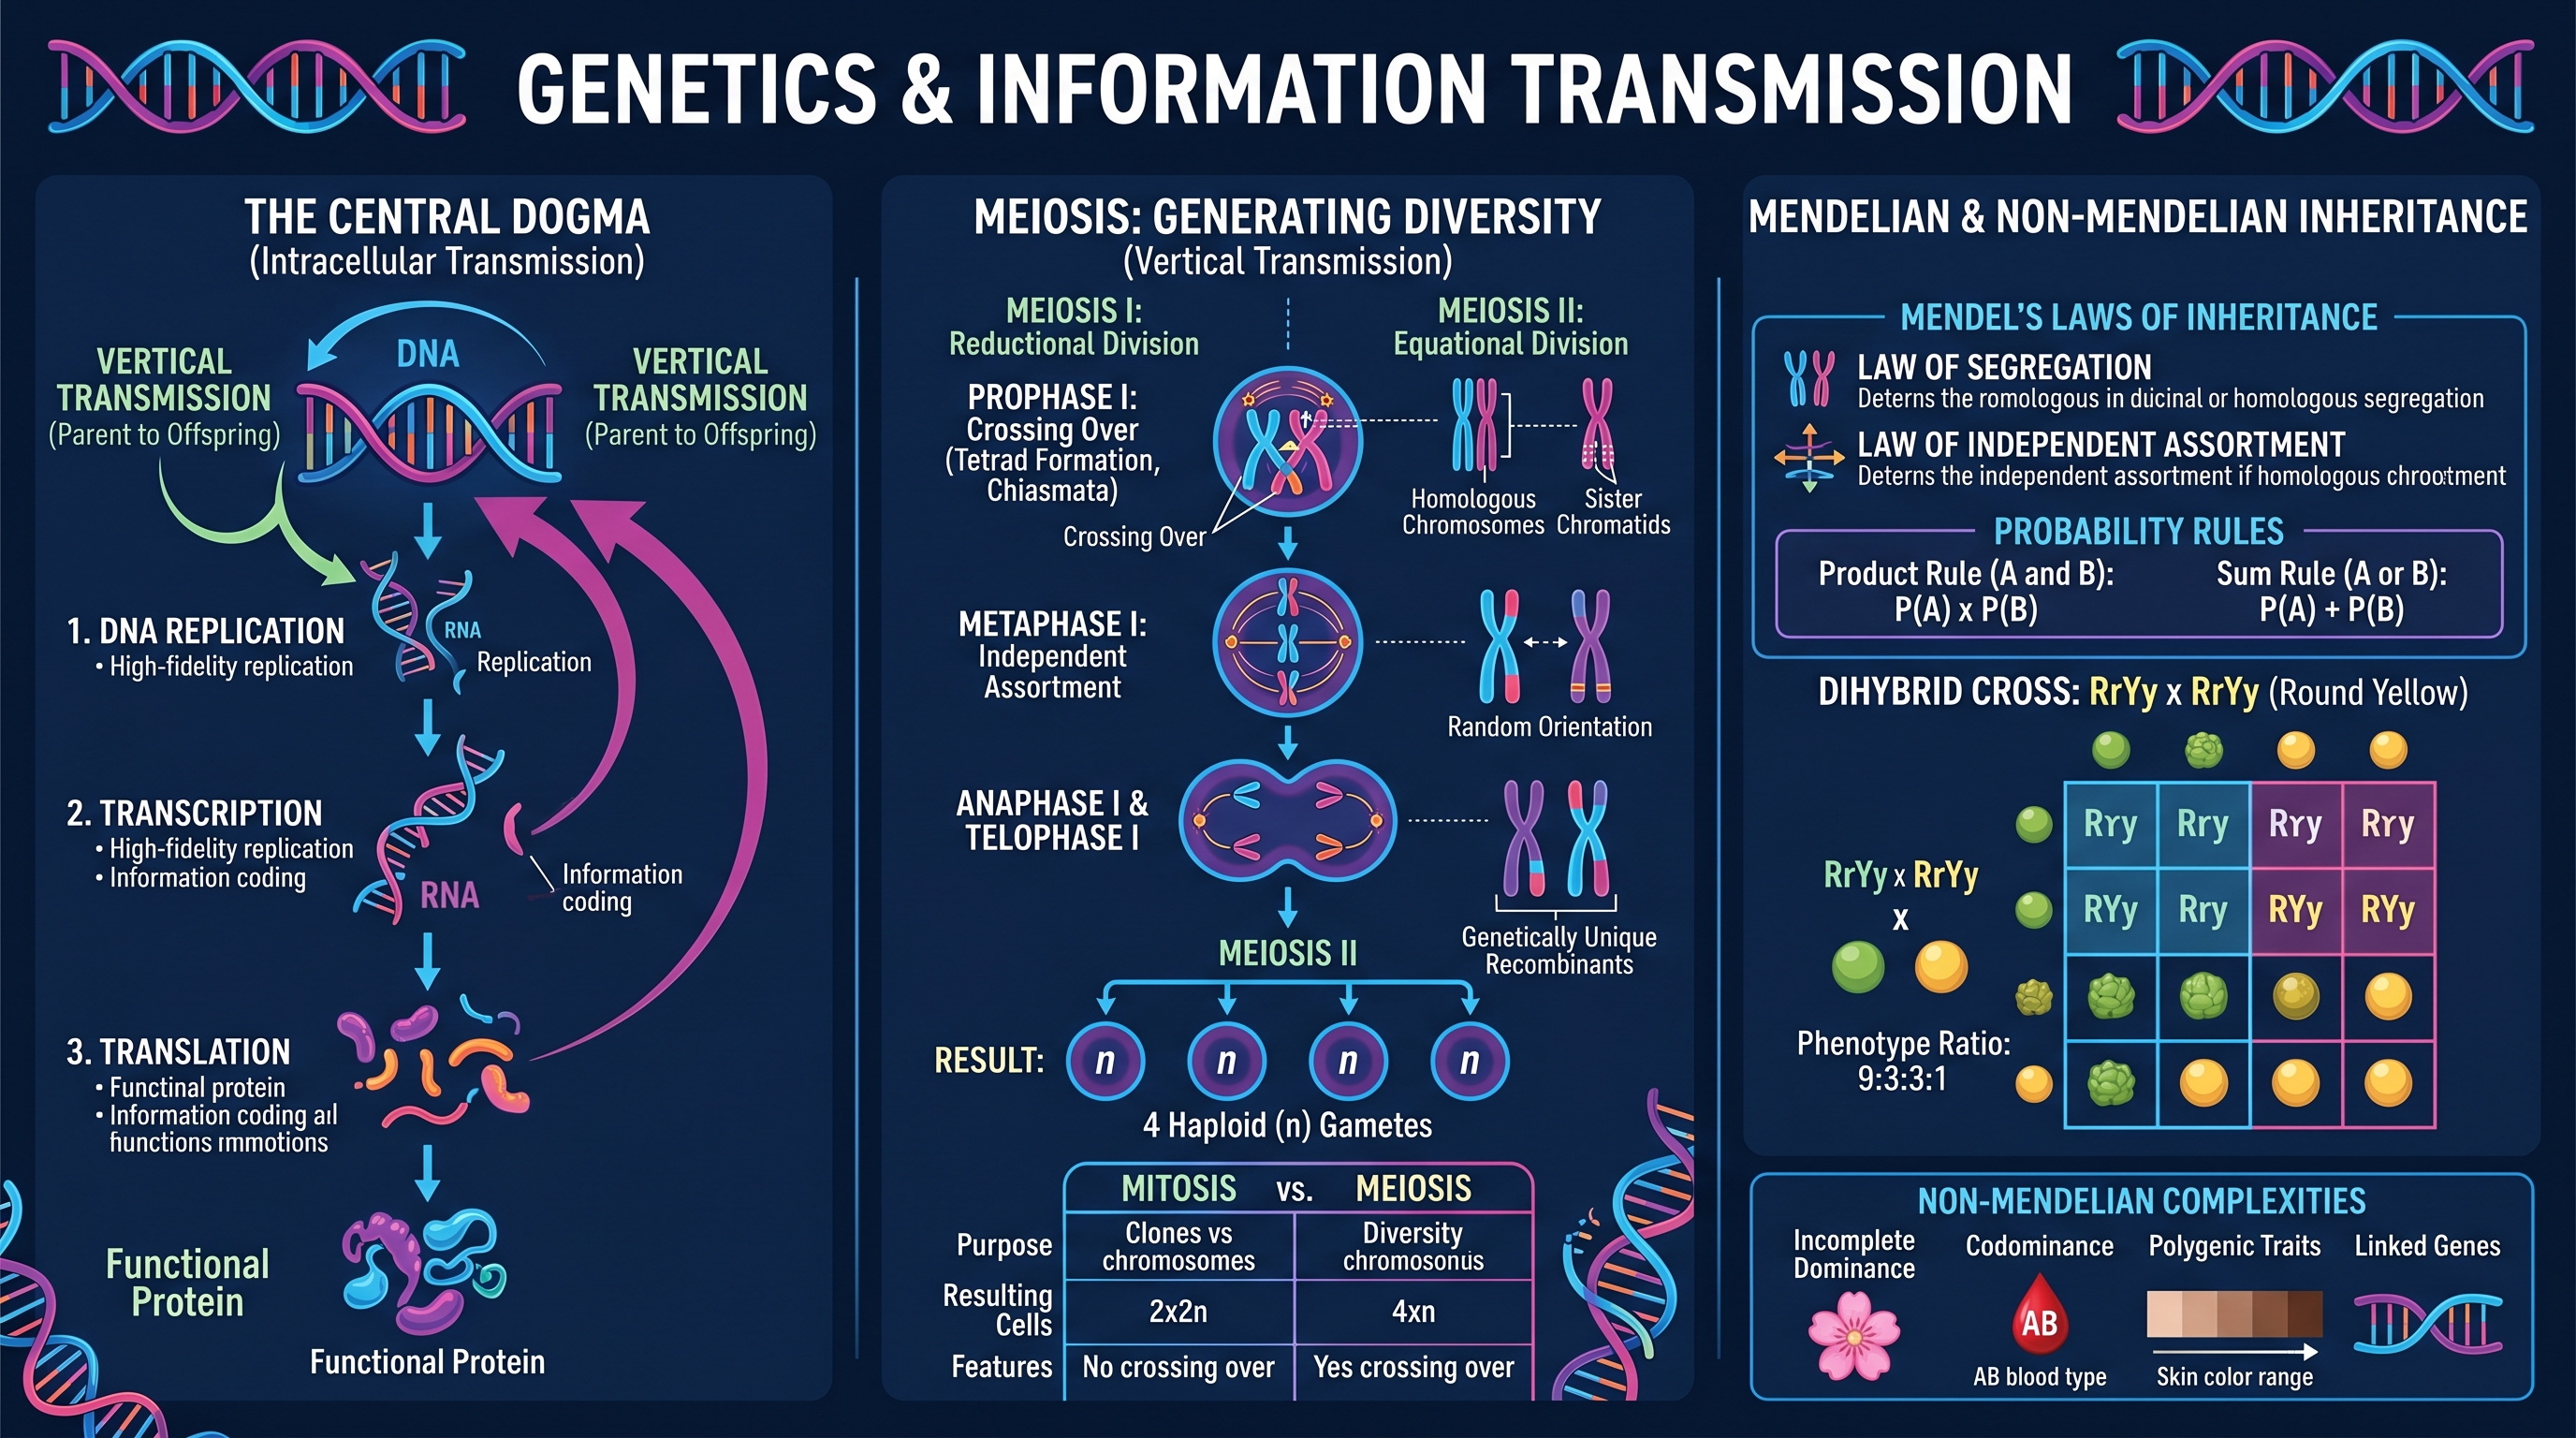
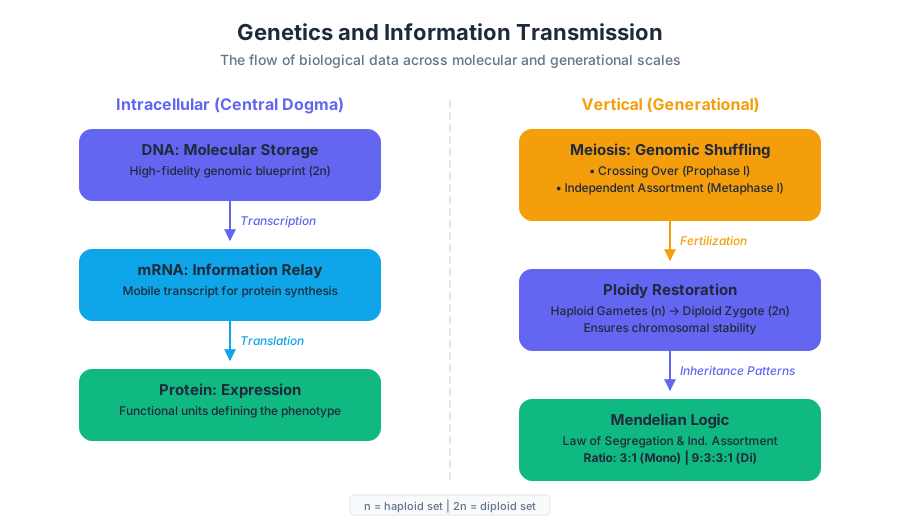
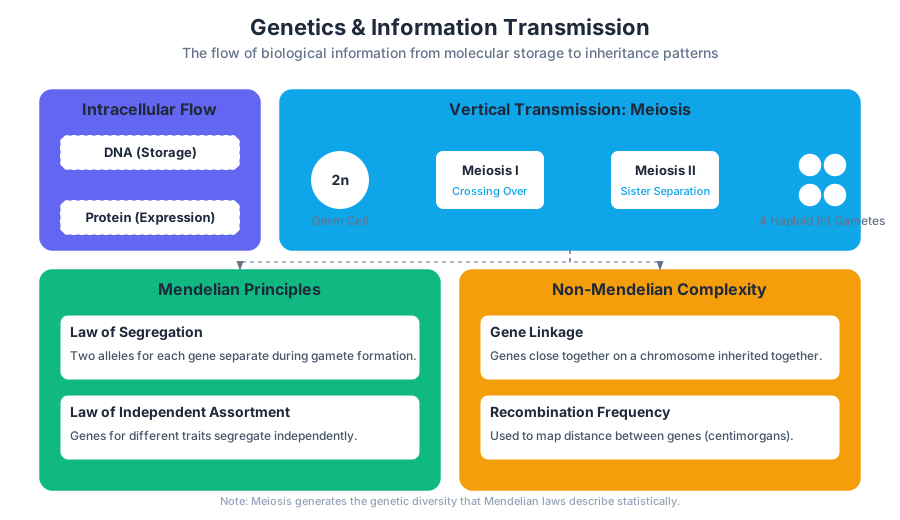
Biological systems are defined by their ability to store, retrieve, transmit, and respond to information. At the core of this capability lies the genetic code—a high-fidelity, molecular storage system that governs the development, functioning, and reproduction of all known life. Information transmission occurs across two distinct scales: vertical transmission (from parent to offspring via meiosis and fertilization) and intracellular transmission (from DNA to protein via the Central Dogma).
Meiosis: The Engine of Genetic Diversity
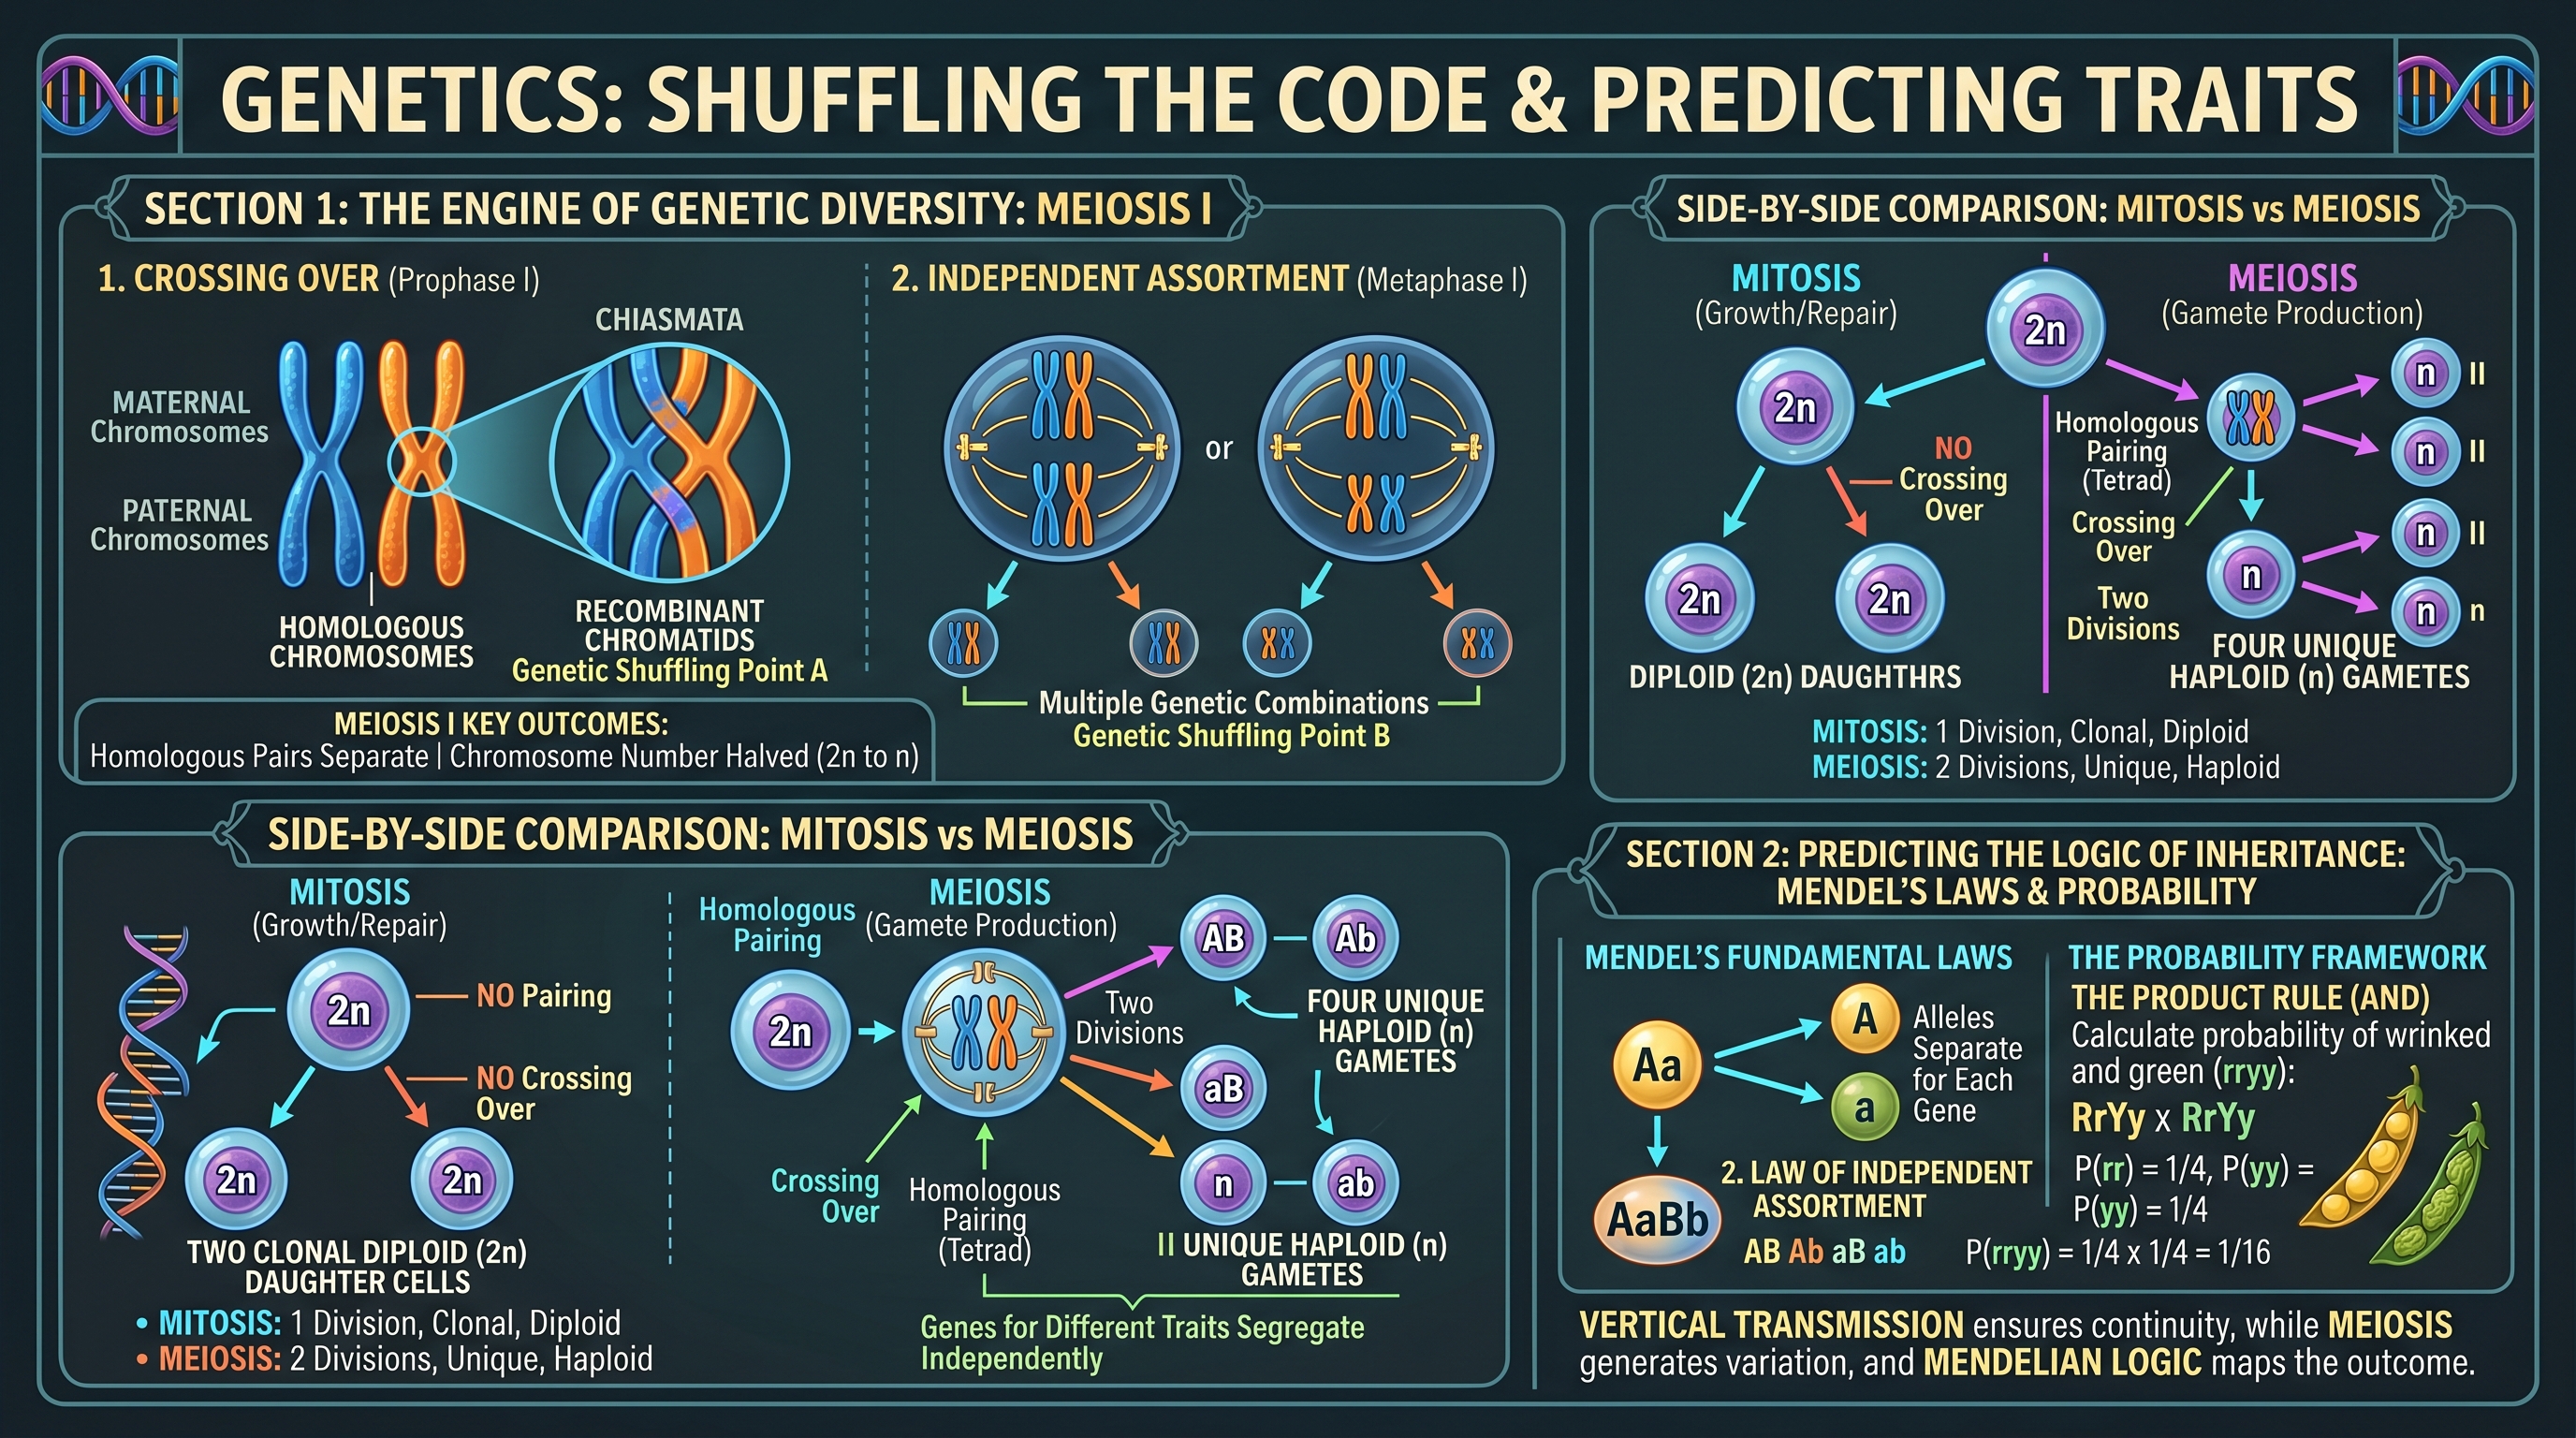
Meiosis is a specialized form of cell division that reduces the chromosome number by half, resulting in the production of four haploid (n) gametes from a single diploid (2n) germ cell. Unlike mitosis, which aims for clonal identity, meiosis is architected to maximize genomic shuffling.
Why it matters
Without meiosis, sexual reproduction would lead to a catastrophic doubling of the genome every generation. Beyond maintaining ploidy stability, meiosis provides the raw material for evolution by generating novel combinations of alleles. This "shuffling" ensures that offspring are genetically distinct from their parents and siblings, increasing the adaptability of a population to changing environments.
How it works: The Two-Stage Reduction
Meiosis is divided into two rounds of division: Meiosis I (the reductional division) and Meiosis II (the equational division).
- Meiosis I: Homologous chromosomes (one from each parent) pair up and then separate.
- Prophase I: The most critical phase. Homologous chromosomes undergo synapsis to form tetrads. Here, crossing over occurs at the chiasmata, where non-sister chromatids exchange DNA segments.
- Metaphase I: Homologous pairs align at the metaphase plate. The orientation is random (Independent Assortment).
- Anaphase I: Homologous chromosomes move to opposite poles, but sister chromatids remain attached.
- Meiosis II: Similar to mitosis, sister chromatids are finally separated into individual gametes.
| Feature | Mitosis | Meiosis |
|---|---|---|
| Purpose | Growth, tissue repair, asexual reproduction | Production of gametes for sexual reproduction |
| Resulting Cells | Two diploid (2n) somatic cells | Four haploid (n) gametes |
| Genetic Composition | Genetically identical to parent | Genetically unique; recombinant |
| Homologous Pairing | No | Yes (Prophase I) |
| Crossing Over | No | Yes |
| Divisions | One | Two |
Common Pitfalls
- Nondisjunction: A failure of chromosomes to separate properly during Anaphase I or II. This leads to aneuploidy (e.g., Trisomy 21).
- Chromatid vs. Chromosome: Students often confuse sister chromatids (identical copies) with homologous chromosomes (similar but non-identical copies from different parents).
Mendelian Genetics: The Logic of Inheritance
Mendelian genetics describes the statistical patterns by which traits are passed from parents to offspring. Gregor Mendel’s work shifted biology from a "blending inheritance" model to a "particulate inheritance" model, where discrete units (genes) retain their identity across generations.
The Fundamental Laws
The Law of Segregation: During gamete formation, the two alleles for each gene separate so that each gamete receives only one allele.
The Law of Independent Assortment: Genes for different traits can segregate independently during the formation of gametes, provided they are on different chromosomes.
Mathematical Framework
Mendelian inheritance is governed by the laws of probability.
- The Product Rule: The probability of two independent events occurring together (A and B) is the product of their individual probabilities: $P(A \cap B) = P(A) \times P(B)$.
- The Sum Rule: The probability of any one of several mutually exclusive events occurring (A or B) is the sum of their individual probabilities: $P(A \cup B) = P(A) + P(B)$.
Concrete Example: The Dihybrid Cross
In a cross between two heterozygous pea plants (RrYy x RrYy), where R is round, r is wrinkled, Y is yellow, and y is green:
- The probability of an offspring being
rris $1/4$. - The probability of an offspring being
yyis $1/4$. - The probability of an offspring being wrinkled and green (
rryy) is $1/4 \times 1/4 = 1/16$.
| Genotype Ratio (Monohybrid) | Phenotype Ratio (Monohybrid) | Dihybrid Phenotype Ratio (Independent) |
|---|---|---|
| 1:2:1 (AA:Aa:aa) | 3:1 (Dominant:Recessive) | 9:3:3:1 |
Non-Mendelian Inheritance: Complexity and Linkage
While Mendel’s laws provide a foundation, many traits do not follow simple dominant/recessive patterns. These complexities arise from gene interactions, chromosomal location, and non-nuclear DNA.
Variations in Dominance and Gene Interaction
- Incomplete Dominance: Neither allele is fully dominant; the heterozygote shows a "blended" phenotype (e.g., Red x White = Pink flowers).
- Codominance: Both alleles are expressed equally in the phenotype (e.g., AB blood type).
- Polygenic Inheritance: Traits controlled by multiple genes, resulting in a continuous phenotypic spectrum (e.g., human skin color or height).
- Epistasis: One gene masks or interferes with the expression of another (e.g., coat color in Labradors).
Gene Linkage and Mapping
Genes located close together on the same chromosome tend to be inherited together, violating the Law of Independent Assortment. The "distance" between linked genes can be calculated using the Recombination Frequency:
$$\text{Recombination Frequency} = \frac{\text{Number of Recombinant Offspring}}{\text{Total Number of Offspring}} \times 100$$
Key Insight: A recombination frequency of 1% is defined as 1 centimorgan (cM) or map unit. If the frequency is 50%, the genes are effectively unlinked (either on different chromosomes or very far apart on the same one).
Sex-Linked and Mitochondrial Inheritance
- Sex-Linked Traits: Genes located on the X or Y chromosomes. X-linked recessive traits (like color blindness) appear more frequently in males because they only possess one X chromosome (hemizygous).
- Non-Nuclear Inheritance: Mitochondria and chloroplasts contain their own DNA. In most animals, mitochondria are inherited exclusively from the mother (maternal inheritance).
DNA Replication: High-Fidelity Information Copying
Before a cell can divide, it must replicate its entire genome. This process is semi-conservative, meaning each new DNA molecule consists of one original strand and one newly synthesized strand.
The Enzymatic Machinery
DNA replication is an asymmetrical process due to the antiparallel nature of DNA (5' to 3' vs. 3' to 5') and the fact that DNA polymerase can only add nucleotides to the 3' end.
| Enzyme | Function |
|---|---|
| Helicase | Unwinds the DNA double helix by breaking hydrogen bonds. |
| Topoisomerase | Relieves torsional strain (supercoiling) ahead of the replication fork. |
| Primase | Synthesizes short RNA primers required to start DNA synthesis. |
| DNA Polymerase III | Main enzyme that adds DNA nucleotides in the 5' $\rightarrow$ 3' direction. |
| DNA Polymerase I | Removes RNA primers and replaces them with DNA. |
| DNA Ligase | Joins Okazaki fragments on the lagging strand. |
Mechanics: Leading vs. Lagging Strands
- Leading Strand: Synthesized continuously toward the replication fork.
- Lagging Strand: Synthesized discontinuously away from the fork in short segments called Okazaki fragments.
Common Pitfall: Directionality
A common error is assuming DNA can be synthesized in the 3' $\rightarrow$ 5' direction. It cannot. The 3' hydroxyl (-OH) group is chemically necessary for the dehydration synthesis reaction that attaches the next nucleotide.
Transcription: Synthesizing the Messenger
Transcription is the process of "reading" a DNA template to produce a complementary RNA strand. This is the first step of gene expression.
The Process
- Initiation: RNA Polymerase binds to a promoter region (e.g., the TATA box in eukaryotes).
- Elongation: RNA Polymerase moves along the template strand (3' $\rightarrow$ 5'), synthesizing mRNA in the 5' $\rightarrow$ 3' direction.
- Termination: The polymerase reaches a terminator sequence and releases the RNA transcript.
Eukaryotic RNA Processing
Unlike prokaryotes, eukaryotic pre-mRNA must be modified before it can leave the nucleus:
- 5' Cap: A modified guanine nucleotide is added to protect the mRNA from degradation and help ribosome attachment.
- Poly-A Tail: A string of adenine nucleotides is added to the 3' end for stability and nuclear export.
- RNA Splicing: Introns (non-coding regions) are removed by spliceosomes, and exons (coding regions) are joined together.
Alternative Splicing: A single gene can code for multiple proteins depending on which exons are included in the final mRNA. This significantly increases the proteomic complexity of eukaryotes.
Translation: The Molecular Assembly Line
Translation is the process where the "digital" information in mRNA is converted into a "physical" chain of amino acids (a polypeptide).
The Genetic Code
The code is read in three-letter "words" called codons.
- Redundant: Multiple codons can code for the same amino acid (e.g., GAA and GAG both code for Glutamate).
- Unambiguous: No codon codes for more than one amino acid.
- Universal: Almost all organisms use the same code, which is strong evidence for common ancestry.
The Mechanism: Ribosomes and tRNA
The ribosome acts as the catalytic site, while tRNA (transfer RNA) molecules act as adapters. Each tRNA has an anticodon that base-pairs with the mRNA codon and carries a specific amino acid.
| Ribosome Site | Function |
|---|---|
| A Site (Aminoacyl) | Holds the tRNA carrying the next amino acid to be added. |
| P Site (Peptidyl) | Holds the tRNA carrying the growing polypeptide chain. |
| E Site (Exit) | Where discharged tRNAs leave the ribosome. |
Steps of Translation
- Initiation: The small ribosomal subunit binds to the mRNA; the initiator tRNA (carrying Methionine) binds to the Start Codon (AUG).
- Elongation: tRNAs enter the A site, a peptide bond forms between amino acids, and the ribosome translocates forward.
- Termination: A Stop Codon (UAA, UAG, or UGA) enters the A site. A release factor breaks the bond, and the polypeptide is freed.
Summary of Information Flow
The "Central Dogma" describes the unidirectional flow of information: DNA $\rightarrow$ RNA $\rightarrow$ Protein
However, exceptions exist, such as Reverse Transcription in retroviruses (RNA $\rightarrow$ DNA), which uses the enzyme reverse transcriptase to integrate viral logic into a host genome.
Statistical Analysis in Genetics: Chi-Square ($\chi^2$)
To determine if observed inheritance patterns deviate significantly from Mendelian expectations, biologists use the Chi-Square test:
$$\chi^2 = \sum \frac{(o - e)^2}{e}$$
Where:
- $o$ = observed frequency
- $e$ = expected frequency (based on Mendelian ratios)
If the calculated $\chi^2$ value is greater than the critical value (based on degrees of freedom, $df = n - 1$), we reject the null hypothesis that the data follows Mendelian inheritance, suggesting linkage or other factors are at play.
Evolution and Systems Interactions
Key concepts: Natural Selection · Hardy-Weinberg Equilibrium · Phylogeny · Speciation · Population Ecology · Community Ecology · Biodiversity
Covers the mechanisms of natural selection and the interactions within ecosystems (Units 7 and 8).
Evolution and Systems Interactions
Evolution is the unifying principle of biology, providing the framework through which we understand the diversity of life and the intricate connections between organisms and their environments. At its core, evolution describes the change in the genetic makeup of a population over time. However, these changes do not occur in a vacuum. They are driven by, and in turn drive, complex systems interactions—from the molecular level of allele frequencies to the macroscopic scale of ecosystem dynamics.
This article explores the mechanisms of evolutionary change, the mathematical models used to quantify them, and the ecological systems that emerge from these processes.
Natural Selection: The Engine of Adaptation
What it is
Natural Selection is the process by which individuals with certain heritable traits tend to survive and reproduce at higher rates than other individuals because of those traits. It is the only mechanism of evolution that consistently leads to adaptive evolution, where a population becomes better suited to its environment over generations.
Why it matters
Before Darwin and Wallace, the prevailing view was that species were static. Natural selection provided a mechanistic, observable explanation for how life changes. It solves the problem of "design" in nature without requiring a designer, showing how environmental pressures filter genetic variation.
How it works
The process relies on four fundamental observations:
- Variation: Individuals in a population vary in their traits.
- Inheritance: Some of these variations are heritable (passed from parents to offspring).
- Overproduction: Populations produce more offspring than the environment can support.
- Differential Survival and Reproduction: Individuals with traits better suited to the environment are more likely to survive and leave more offspring.
The cumulative effect is a shift in the population's phenotypic distribution. This can be categorized into three primary modes:
| Mode of Selection | Description | Effect on Variance | Example |
|---|---|---|---|
| Directional | Favors one extreme phenotype. | Shifts the mean toward the extreme. | Antibiotic resistance in bacteria. |
| Stabilizing | Favors intermediate phenotypes; acts against extremes. | Reduces variance; maintains the status quo. | Human birth weight. |
| Disruptive | Favors both extremes over the intermediate. | Increases variance; can lead to speciation. | Beak sizes in finches (small for seeds, large for nuts). |
Concrete Example: Biston betularia
The peppered moth (Biston betularia) in 19th-century England is a classic case of directional selection. Before the Industrial Revolution, light-colored moths were camouflaged against lichen-covered trees. As soot killed the lichens and blackened the trees, dark-colored (melanic) moths had a survival advantage. Within decades, the frequency of the melanic allele skyrocketed. When air quality improved in the 20th century, the selection pressure reversed.
Common Pitfalls
- "Survival of the Fittest" Misconception: Fitness in biology is not about physical strength; it is strictly about reproductive success (the contribution an individual makes to the gene pool of the next generation).
- Intentionality: Evolution does not have a "goal." It is a reactive process. Populations do not "evolve to survive"; they survive because they evolved.
Hardy-Weinberg Equilibrium: The Null Model of Evolution
What it is
The Hardy-Weinberg Equilibrium (HWE) is a mathematical principle stating that allele and genotype frequencies in a population will remain constant from generation to generation in the absence of other evolutionary influences. It serves as a null hypothesis for evolution.
Why it matters
By defining what a non-evolving population looks like, HWE allows biologists to detect when evolution is occurring. If the observed genotype frequencies deviate from the HWE predictions, we know that at least one evolutionary force (selection, mutation, drift, etc.) is at work.
How it works: The Derivation
Consider a gene with two alleles: A (dominant) and a (recessive).
- Let
p= the frequency of theAallele. - Let
q= the frequency of theaallele.
Since there are only two alleles, $p + q = 1$.
In a random mating population, the probability of producing specific genotypes is the product of the allele frequencies:
- Probability of
AA($p \times p$) = $p^2$ - Probability of
aa($q \times q$) = $q^2$ - Probability of
Aa($p \times q + q \times p$) = $2pq$
The sum of these frequencies must equal 1:
The Hardy-Weinberg Equation: $p^2 + 2pq + q^2 = 1$
For a population to be in HWE, five conditions must be met:
- Extremely large population size (No genetic drift).
- No gene flow (No migration in or out).
- No mutations (No new alleles).
- Random mating (No sexual selection).
- No natural selection (Equal survival/reproduction for all genotypes).
Concrete Example: Worked Calculation
Suppose a population of 1,000 individuals has 90 individuals with a recessive genetic disorder ($aa$).
- Find $q^2$: $90 / 1000 = 0.09$.
- Find $q$: $\sqrt{0.09} = 0.3$.
- Find $p$: $1 - 0.3 = 0.7$.
- Calculate carrier frequency ($2pq$): $2 \times 0.7 \times 0.3 = 0.42$.
- Result: 42% of the population are carriers.
Phylogeny and the Tree of Life
What it is
Phylogeny is the evolutionary history of a species or group of related species. It is represented visually through Phylogenetic Trees or Cladograms, which are hypotheses about the relationships among organisms.
Why it matters
Phylogeny moves biology beyond simple classification (Taxonomy) into a system based on common ancestry. It allows us to trace the evolution of specific traits and understand the timing of major evolutionary transitions.
How it works: Cladistics
Modern phylogenetics relies on Cladistics, which groups organisms by common descent. A Clade (monophyletic group) consists of an ancestral species and all its descendants.
| Term | Definition | Visual Indicator |
|---|---|---|
| Monophyletic | Ancestor + all descendants. | A single "cut" removes the whole branch. |
| Paraphyletic | Ancestor + some (but not all) descendants. | Often excludes a group that looks different (e.g., Reptiles excluding Birds). |
| Polyphyletic | Distantly related species without their most recent common ancestor. | Grouping based on convergent evolution (e.g., "flying animals"). |
Trees are constructed using Shared Derived Characters (synapomorphies)—traits that arose in the most recent common ancestor of a particular lineage and was passed to its descendants.
Variations: Molecular Clocks
While morphological traits were the original basis for trees, modern phylogeny uses DNA and protein sequences. Molecular Clocks use the constant rate of mutation in certain genes to estimate the absolute time of evolutionary divergence.
Common Pitfalls
- Reading the Tips: A common mistake is thinking that organisms at the tips of a tree evolved from one another (e.g., "Humans evolved from Chimpanzees"). In reality, they share a Common Ancestor.
- Complexity vs. Evolution: Being "more evolved" is a fallacy. All extant (living) species have been evolving for the same amount of time since their common origin.
Speciation: The Origin of Diversity
What it is
Speciation is the process by which one species splits into two or more species. It is the bridge between Microevolution (changes in allele frequencies) and Macroevolution (large-scale evolutionary patterns).
Why it matters
Speciation explains how we went from a single primordial cell to the millions of species alive today. It defines the boundaries of the biological world.
How it works: Reproductive Isolation
According to the Biological Species Concept, a species is a group of populations whose members have the potential to interbreed in nature and produce viable, fertile offspring. Speciation requires the development of Reproductive Isolation.
| Type of Barrier | Mechanism | Description |
|---|---|---|
| Pre-zygotic | Habitat Isolation | Species live in different areas or niches. |
| Pre-zygotic | Temporal Isolation | Species breed at different times/seasons. |
| Pre-zygotic | Behavioral Isolation | Unique rituals or signals are not recognized. |
| Pre-zygotic | Mechanical Isolation | Morphological differences prevent mating. |
| Post-zygotic | Hybrid Inviability | Hybrid embryos fail to develop or are frail. |
| Post-zygotic | Hybrid Sterility | Hybrids are healthy but cannot reproduce (e.g., Mules). |
Allopatric vs. Sympatric Speciation
- Allopatric Speciation: Gene flow is interrupted by a physical geographic barrier (e.g., a mountain range or canyon). The separated populations evolve independently.
- Sympatric Speciation: Speciation occurs in populations that live in the same geographic area. This is often driven by polyploidy (extra sets of chromosomes, common in plants), habitat differentiation, or sexual selection.
Theorem of Punctuated Equilibrium: Proposed by Eldredge and Gould, this suggests that species undergo long periods of stasis (no change) interrupted by brief periods of rapid evolutionary change during speciation, rather than constant, slow gradualism.
Population Ecology: Dynamics of Growth
What it is
Population Ecology is the study of how biotic and abiotic factors influence the density, distribution, size, and age structure of populations.
Why it matters
Understanding population growth is critical for conservation biology, managing natural resources, and predicting the impact of invasive species or human population growth.
How it works: Mathematical Models
Population growth is defined by the change in number ($N$) over time ($t$).
1. Exponential Growth Model Occurs under ideal conditions with unlimited resources. $$\frac{dN}{dt} = r_{max}N$$ Where $r_{max}$ is the intrinsic rate of increase. This results in a J-shaped curve.
2. Logistic Growth Model Incorporates the concept of Carrying Capacity ($K$), the maximum population size the environment can support. $$\frac{dN}{dt} = r_{max}N \left( \frac{K - N}{K} \right)$$ As $N$ approaches $K$, the term $(K-N)/K$ approaches zero, slowing the growth rate. This results in an S-shaped (sigmoidal) curve.
Concrete Example: The 1911 Reindeer of St. Paul Island
When 25 reindeer were introduced to an island with no predators, they experienced exponential growth, reaching 2,000 individuals by 1938. However, they overgrazed the lichen (their food source), causing $K$ to crash. The population plummeted to only 8 individuals by 1950. This illustrates how exceeding carrying capacity can lead to system collapse.
Variations: Density-Dependent vs. Independent Factors
- Density-Dependent: Factors that increase in intensity as population density rises (e.g., competition for food, disease, waste accumulation).
- Density-Independent: Factors that affect population size regardless of density (e.g., natural disasters, temperature changes).
Community Ecology and Systems Interactions
What it is
A Community is an assemblage of populations of different species living close enough together for potential interaction. Community Ecology examines how these interactions (predation, competition, symbiosis) affect community structure and organization.
Why it matters
No species exists in isolation. The health of an ecosystem depends on the complex web of interactions that regulate population sizes and facilitate the flow of energy.
How it works: Interspecific Interactions
Interactions are classified by their effect on the fitness of the participants:
| Interaction | Effect | Description |
|---|---|---|
| Competition | (-/-) | Species compete for the same limiting resource. |
| Predation | (+/-) | One species kills and eats the other. |
| Parasitism | (+/-) | One organism derives nourishment from a host. |
| Mutualism | (+/+) | Both species benefit (e.g., pollinators and flowers). |
| Commensalism | (+/0) | One benefits, the other is unaffected. |
Trophic Structures and Energy Flow
Energy enters most ecosystems as sunlight and is converted to chemical energy by Primary Producers (autotrophs). It then moves through Trophic Levels:
- Primary Producers (Plants/Algae)
- Primary Consumers (Herbivores)
- Secondary Consumers (Carnivores)
- Tertiary Consumers (Top Predators)
The 10% Rule: On average, only about 10% of the energy stored in the organic matter of each trophic level is converted to organic matter at the next trophic level. The rest is lost as heat or used for metabolic processes.
Keystone Species
A Keystone Species is one that has a disproportionately large effect on its environment relative to its abundance. If a keystone species is removed, the entire ecosystem structure can collapse (a "trophic cascade").
- Example: Sea otters in kelp forests. Otters eat sea urchins. Without otters, urchins overpopulate and destroy the kelp, which serves as a nursery for countless other species.
Biodiversity and Resilience
Biodiversity is measured by Species Richness (number of species) and Relative Abundance (evenness). High biodiversity generally increases a system's Resilience—its ability to recover from disturbances.
Common Pitfalls in Systems Thinking
- Linear vs. Circular Logic: Many students view food chains as linear. In reality, they are Food Webs with complex feedback loops.
- Equilibrium Fallacy: Ecosystems are rarely in a "perfect balance." They are dynamic systems constantly shifting due to Disturbances (fires, storms, human activity). The "Non-equilibrium Model" is the modern standard, emphasizing that change is constant.
- Ignoring the Abiotic: Evolution and ecology are often taught as "animal/plant" subjects, but the Biogeochemical Cycles (Carbon, Nitrogen, Phosphorus) are the literal building blocks that constrain what biological systems can achieve.
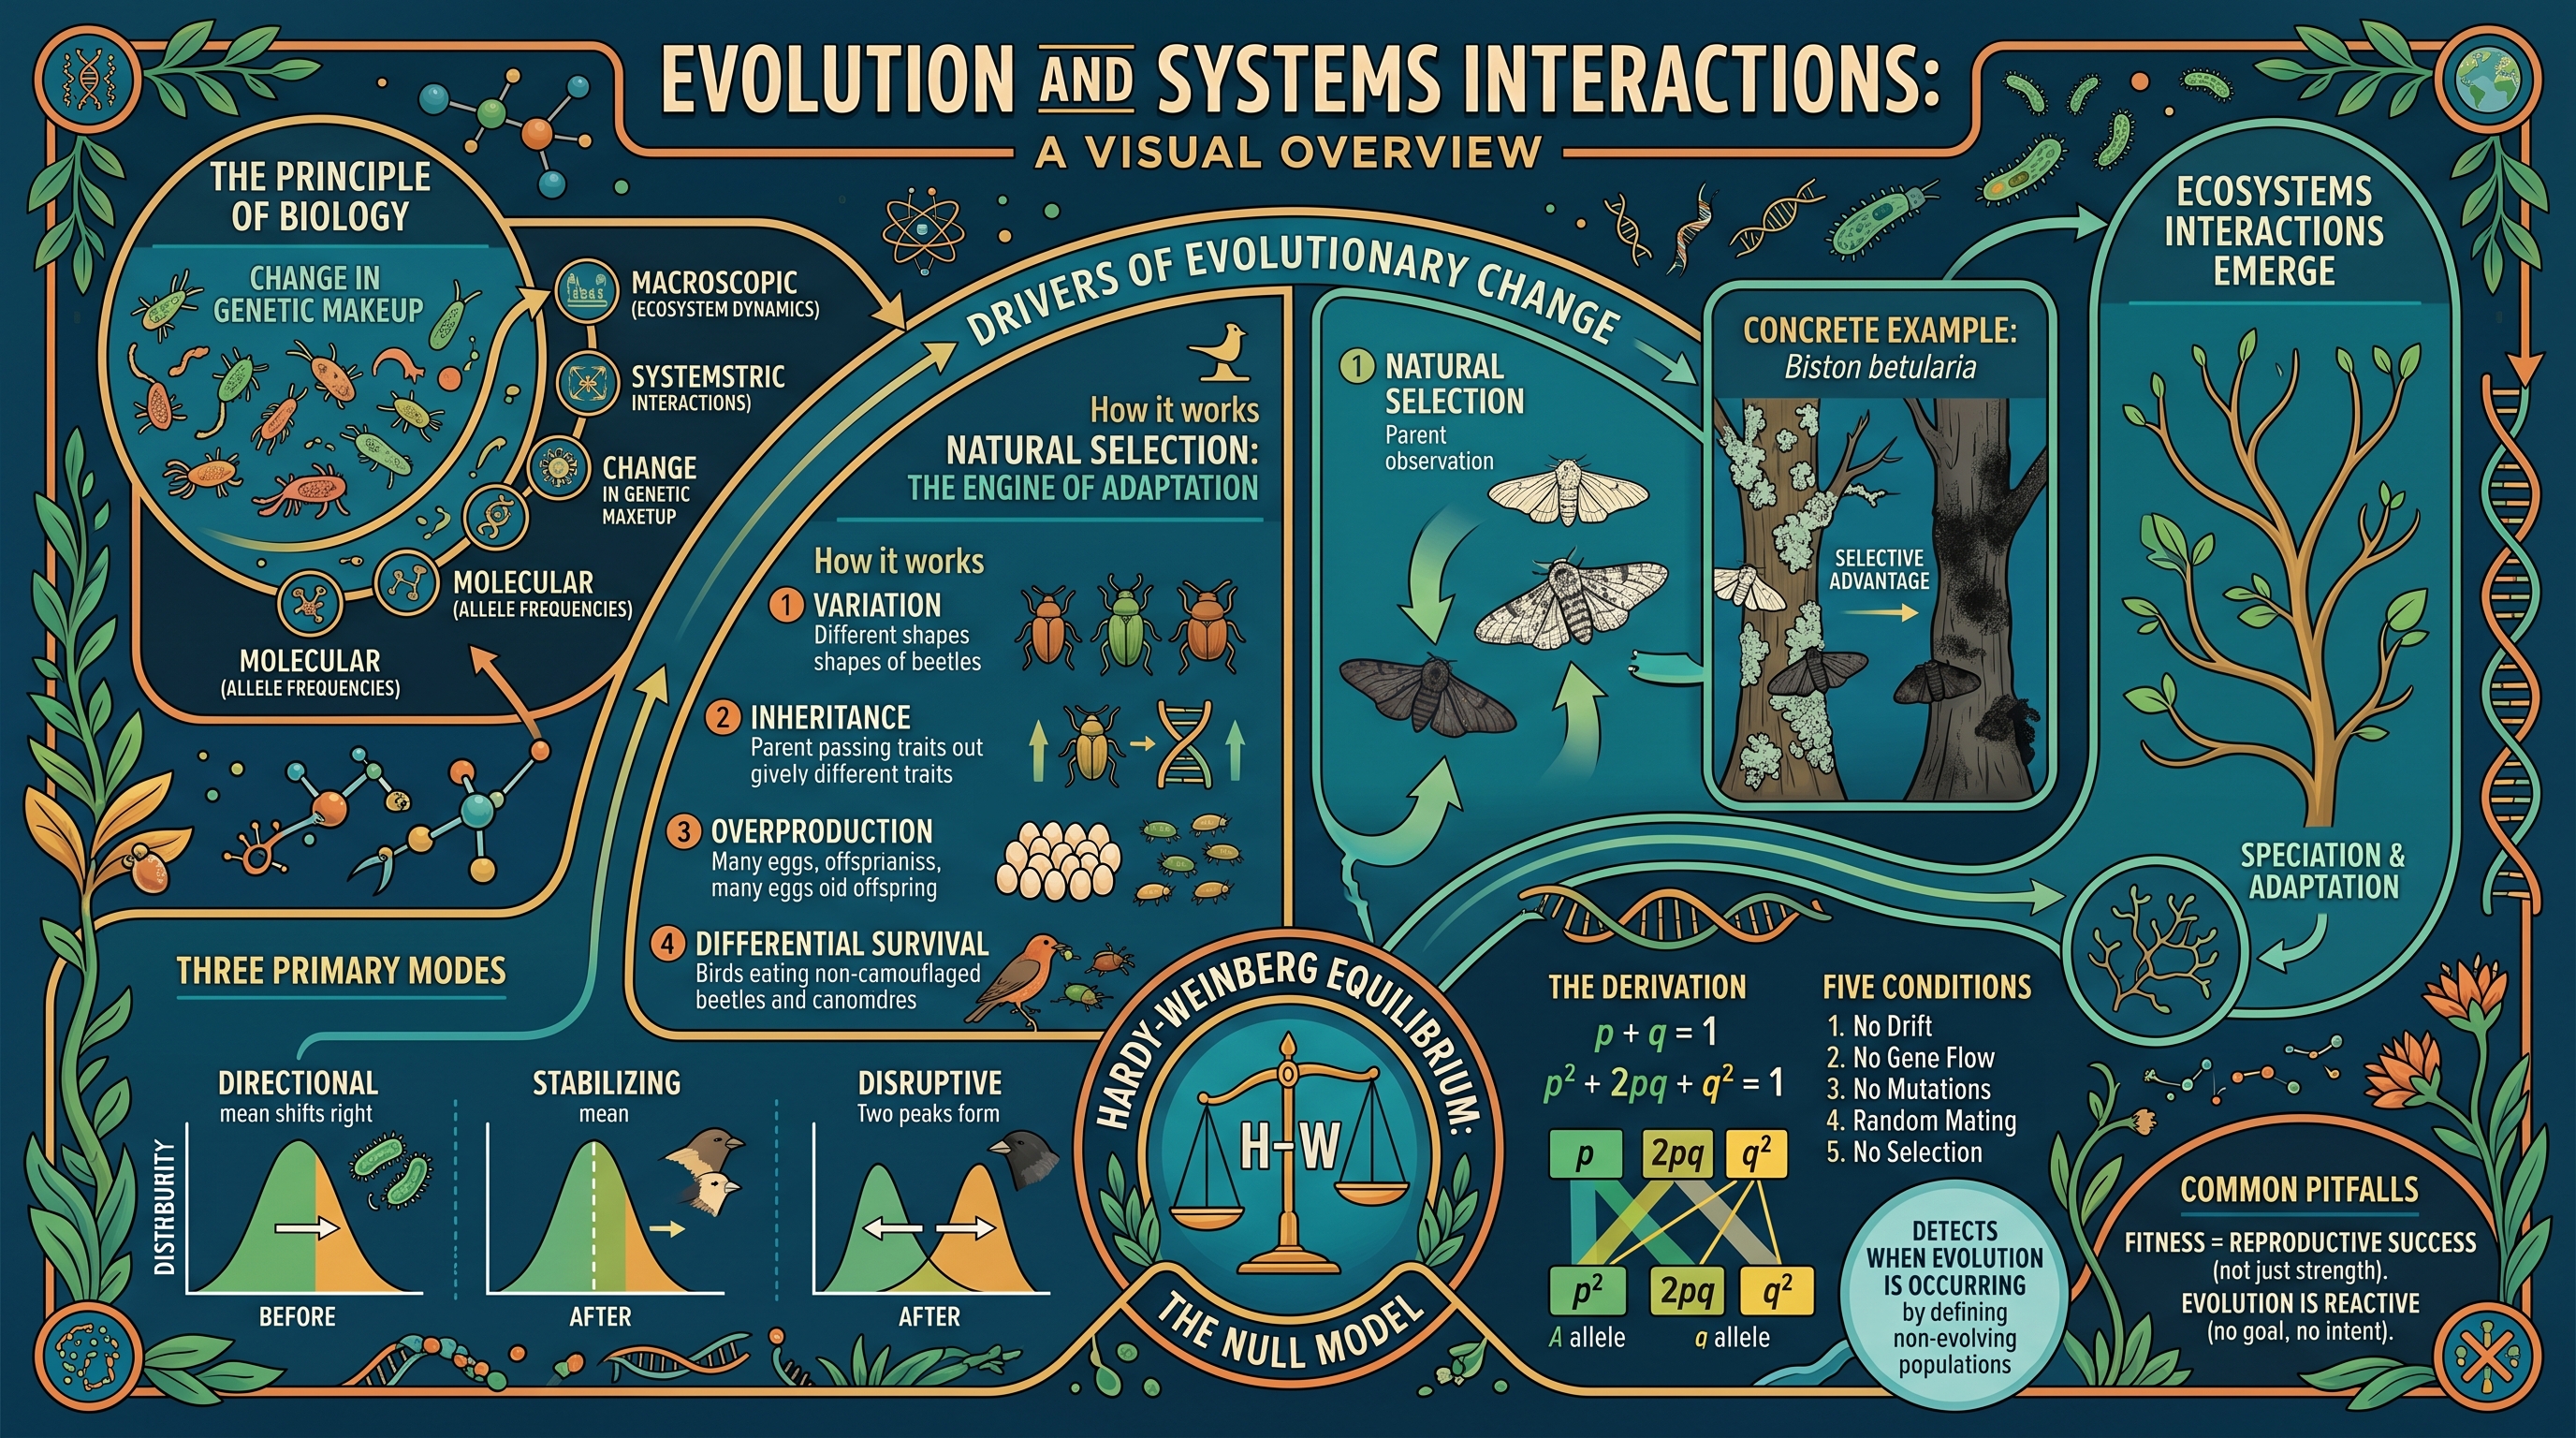
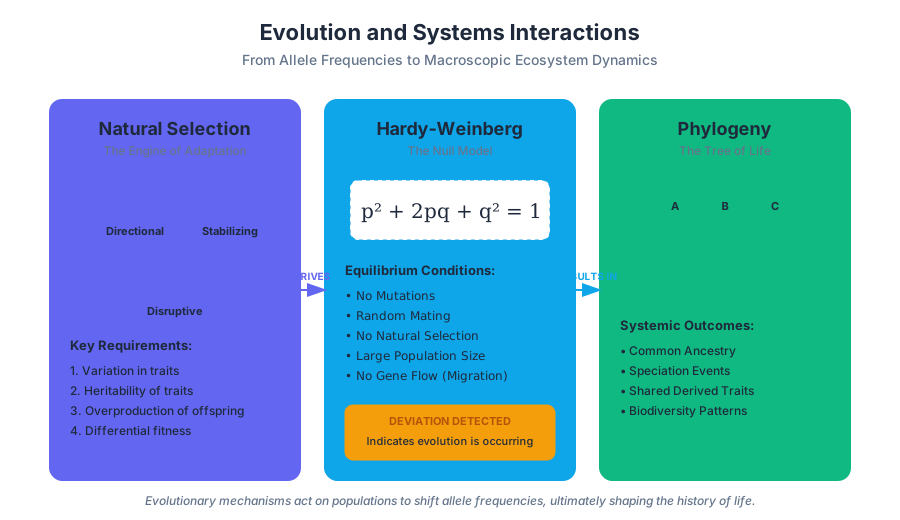
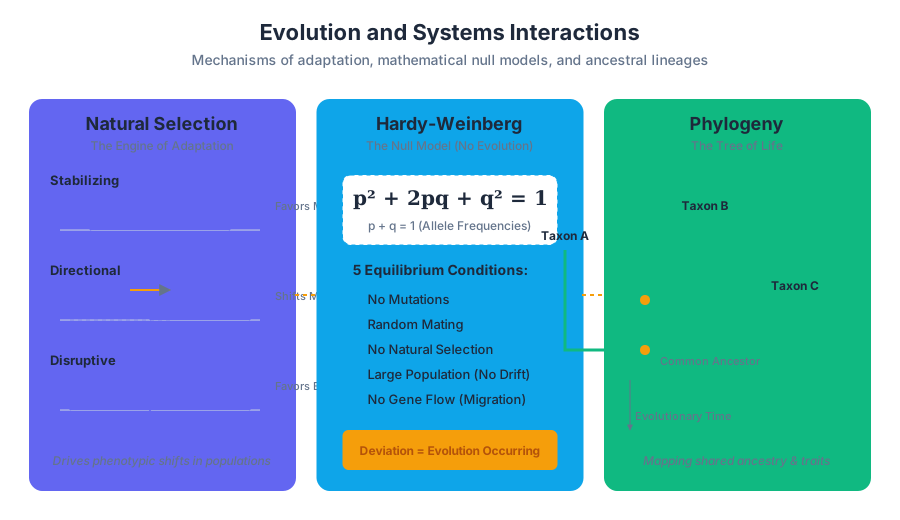
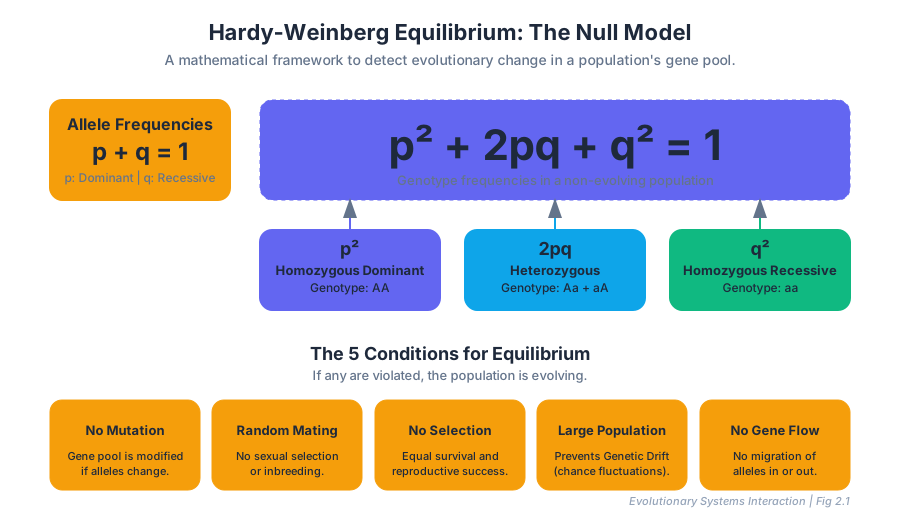
Investigative Laboratory Procedures
Key concepts: Inquiry-Based Investigation · Experimental Design · Data Analysis · Lab Notebook · Variable Control
Guidelines for the 13 inquiry-based labs and the importance of the lab notebook.
Investigative Laboratory Procedures
In the modern biological sciences, the laboratory is no longer a place for the rote repetition of "cookbook" recipes. Instead, it serves as an investigative crucible where theoretical frameworks—ranging from the Chemistry of Life to Ecology—are tested against empirical reality. Investigative laboratory procedures in AP Biology represent a shift from verification-based learning to Inquiry-Based Investigation. This methodology mirrors the professional scientific community, requiring students to act as principal investigators who design, execute, and defend their own experimental protocols.
The rigor of these procedures is defined by the integration of six core Science Practices: describing models, asking questions, identifying experimental methods, performing data analysis, using mathematical routines, and developing scientific arguments. This article provides a deep dive into the architecture of these procedures, the statistical mechanics of data analysis, and the formal documentation required to transform raw observations into valid scientific evidence.
The Framework of Inquiry-Based Investigation
Inquiry-based learning is a pedagogical spectrum rather than a single method. It moves away from the "demonstration" model where the outcome is known in advance, toward "open inquiry" where the question, procedure, and results are all discovered by the researcher.
The Four Levels of Inquiry
The complexity of a laboratory procedure is categorized by the amount of information provided to the investigator.
| Level of Inquiry | Question Provided? | Procedure Provided? | Solution Provided? | Investigator Autonomy |
|---|---|---|---|---|
| Confirmation | Yes | Yes | Yes | Low: Validates known principles. |
| Structured | Yes | Yes | No | Medium: Follows a path to find an unknown. |
| Guided | Yes | No | No | High: Designs the path to find an unknown. |
| Open | No | No | No | Maximum: Defines the problem and the path. |
The Inquiry Theorem: The validity of a scientific conclusion is directly proportional to the rigor of the investigative process and inversely proportional to the influence of preconceived bias.
Experimental Design: The Architecture of Rigor
A robust Experimental Design is the blueprint of any investigation. It must be constructed to isolate the effect of a single variable, ensuring that any observed change in the system can be confidently attributed to the treatment rather than stochastic noise or confounding factors.
1. The Hypothesis Framework
A scientific investigation begins with two competing claims:
- Null Hypothesis ($H_0$): States that there is no significant difference between the experimental groups, and any observed difference is due to chance.
- Alternative Hypothesis ($H_A$): States that the independent variable does have a significant effect on the dependent variable.
2. Variable Taxonomy
Precision in identifying variables is the difference between a "project" and an "experiment."
| Variable Type | Definition | Role in Investigation |
|---|---|---|
| Independent Variable (IV) | The factor manipulated by the researcher. | The "Cause" or the treatment. |
| Dependent Variable (DV) | The factor measured or observed. | The "Effect" or the response. |
| Controlled Variables | Factors kept constant across all groups. | Minimizes noise and prevents confounding. |
| Negative Control | A group not exposed to the treatment. | Establishes a baseline; ensures no response occurs. |
| Positive Control | A group exposed to a known treatment. | Validates the experimental setup; ensures a response can occur. |
3. Variable Control and Confounding Factors
A common pitfall in laboratory procedures is the failure to distinguish between Controlled Variables (the constants) and the Control Group (the baseline). If a researcher is testing the effect of light intensity on photosynthesis, the temperature, $CO_2$ concentration, and plant species are controlled variables. The group of plants kept in the dark is the negative control group.
Data Analysis: The Mathematics of Biology
In biological systems, "perfection" does not exist. Biological data is inherently noisy due to genetic variation, environmental fluctuations, and measurement limitations. Therefore, we use Statistical Analysis to determine if our results are meaningful.
Descriptive Statistics: Central Tendency and Variance
To summarize data, we calculate the Mean ($\bar{x}$) and the Standard Deviation ($s$).
$$\bar{x} = \frac{1}{n} \sum_{i=1}^{n} x_i$$
$$s = \sqrt{\frac{\sum (x_i - \bar{x})^2}{n-1}}$$
While the mean provides the "center" of the data, the standard deviation describes the "spread." A high $s$ relative to the mean suggests high variability, which may obscure the effects of the independent variable.
Inferential Statistics: Standard Error and Confidence Intervals
The Standard Error of the Mean ($SE_{\bar{x}}$) estimates how well the sample mean represents the true population mean.
$$SE_{\bar{x}} = \frac{s}{\sqrt{n}}$$
In AP Biology, we typically use 95% Confidence Intervals, represented as $\bar{x} \pm 2 SE_{\bar{x}}$. On a graph, if the error bars of two different treatments overlap, we generally conclude that there is no statistically significant difference between them.
| Error Bar Relationship | Statistical Interpretation | Action |
|---|---|---|
| No Overlap | Significant difference likely ($p < 0.05$). | Reject the Null Hypothesis ($H_0$). |
| Significant Overlap | No significant difference ($p > 0.05$). | Fail to Reject the Null Hypothesis ($H_0$). |
| Mean of A inside B's bars | High probability that the difference is due to chance. | Support the Null Hypothesis ($H_0$). |
The Chi-Square ($\chi^2$) Goodness-of-Fit Test
The Chi-Square test is used to determine if observed data fits an expected ratio (e.g., Mendelian genetics or animal behavior preferences).
$$\chi^2 = \sum \frac{(o-e)^2}{e}$$
Where:
- $o$ = observed frequency
- $e$ = expected frequency
The Decision Rule: If the calculated $\chi^2$ value is greater than the Critical Value (found in a distribution table at $p = 0.05$ and the appropriate degrees of freedom), we reject the null hypothesis.
The Lab Notebook: The Scientist’s Legal Record
The Lab Notebook is not a diary; it is a formal document that provides a transparent, reproducible account of the investigation. In professional and academic settings, it serves as the primary evidence for patent claims and peer-reviewed publications.
Components of a Professional Entry
- Title and Date: Specific and descriptive (e.g., "The Effect of pH on Catalase Activity in Solanum tuberosum").
- Purpose/Question: A clear statement of what the investigation seeks to discover.
- Hypothesis: Formulated as an "If... then..." statement, including the $H_0$.
- Materials and Methods: A detailed protocol that allows another researcher to replicate the experiment exactly.
- Raw Data: Tables containing all measurements, including units and uncertainties.
- Data Visualization: Graphs (Scatter plots for continuous data, Bar graphs for categorical data) with labeled axes and error bars.
- Conclusion and Discussion: An evidence-based argument that accepts or rejects the hypothesis and identifies potential sources of error.
The Reproducibility Standard: A lab notebook is successful if a complete stranger can read it and perform the exact same experiment to achieve the same results.
Worked Example: Enzyme Kinetics Investigation
Problem: A student wants to investigate how temperature affects the rate of oxygen production by the enzyme catalase when it breaks down hydrogen peroxide ($2H_2O_2 \rightarrow 2H_2O + O_2$).
Step 1: Design
- IV: Temperature ($0^\circ C, 22^\circ C, 37^\circ C, 55^\circ C$).
- DV: Volume of $O_2$ produced per minute ($mL/min$).
- Control Group: Catalase solution at room temperature ($22^\circ C$).
- Constants: Concentration of $H_2O_2$, volume of enzyme, pH of buffer.
Step 2: Data Collection
The student performs three trials for each temperature.
| Temp ($^\circ C$) | Trial 1 ($mL/min$) | Trial 2 ($mL/min$) | Trial 3 ($mL/min$) | Mean ($\bar{x}$) | $SE_{\bar{x}}$ |
|---|---|---|---|---|---|
| 0 | 1.2 | 1.1 | 1.3 | 1.2 | 0.06 |
| 22 | 4.5 | 4.7 | 4.3 | 4.5 | 0.12 |
| 37 | 8.2 | 8.5 | 8.1 | 8.27 | 0.12 |
| 55 | 0.2 | 0.1 | 0.2 | 0.17 | 0.03 |
Step 3: Analysis
The student calculates the 95% Confidence Interval for the $37^\circ C$ group: $8.27 \pm 2(0.12) = [8.03, 8.51]$.
Since the error bars for $37^\circ C$ (the body temperature of many mammals) do not overlap with the $22^\circ C$ group, the student concludes that the increase in temperature significantly increases enzyme activity, up to the point of denaturation at $55^\circ C$.
Common Pitfalls in Investigative Procedures
Even experienced researchers encounter "experimental artifacts"—results that appear significant but are caused by flaws in the procedure.
1. The "Human Error" Fallacy
In a lab report, "human error" is an unacceptable explanation for poor data. One must be specific: Was the pipette miscalibrated? Was there cross-contamination? Was the timing inconsistent? If an error is known, the data should be discarded and the trial repeated.
2. Confounding Variables
A confounding variable is an uncontrolled factor that fluctuates along with the independent variable. For example, if you test plant growth under different light colors but use different types of soil for each color, you cannot know if the growth difference is due to the light or the soil.
3. Misinterpreting the Null Hypothesis
Failing to reject the $H_0$ is not a "failure" of the experiment. It is a valid scientific finding. It simply means that, under the conditions tested, the independent variable did not have a measurable effect.
4. Scaling Issues
In biology, surface area-to-volume ratios ($SA:V$) often dictate the results of a lab. A common mistake is failing to account for the size of the biological sample (e.g., agar cubes or potato cores), which affects the rate of diffusion or heat loss independently of the treatment.
| Pitfall | Consequence | Mitigation Strategy |
|---|---|---|
| Selection Bias | Non-representative samples. | Randomization of sample assignment. |
| Sample Size ($n$) too small | Low statistical power; $SE$ is too high. | Increase replicates (minimum $n=3$, preferably $n>10$). |
| Lack of Blinding | Researcher bias in measurement. | Double-blind setups where possible. |
| P-Hacking | Misusing stats to find a pattern. | Define the hypothesis before data collection. |
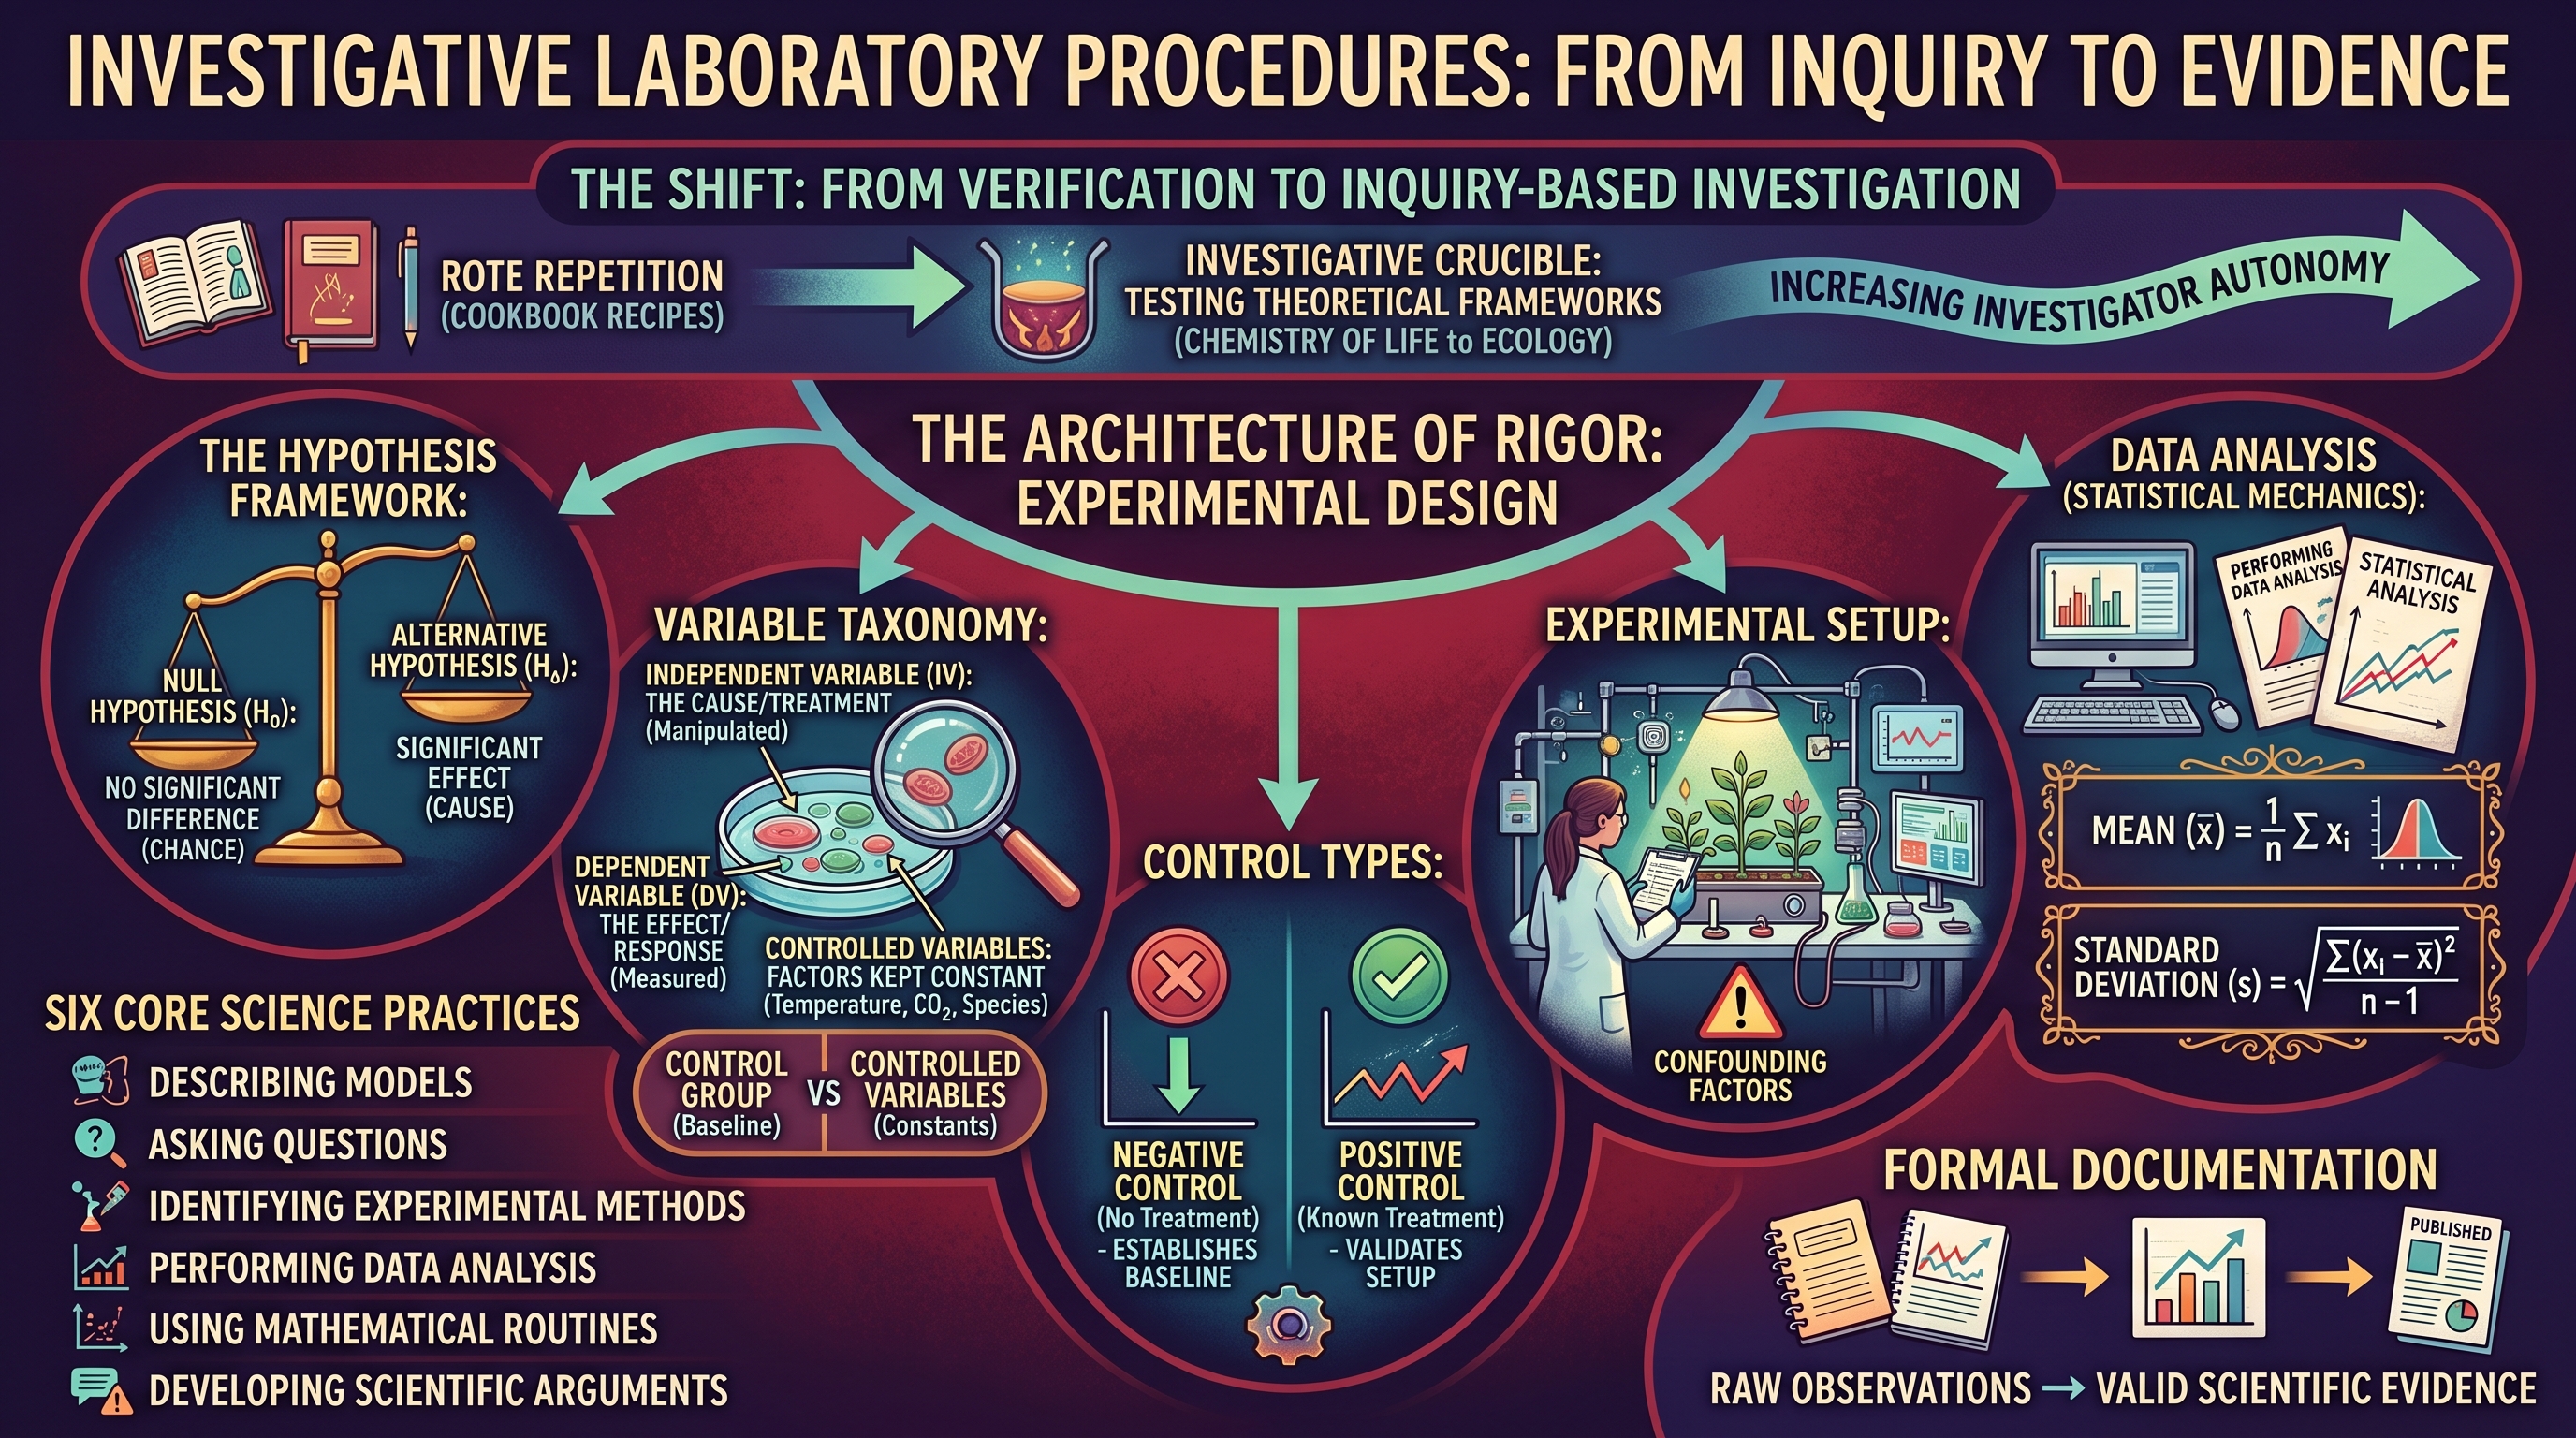
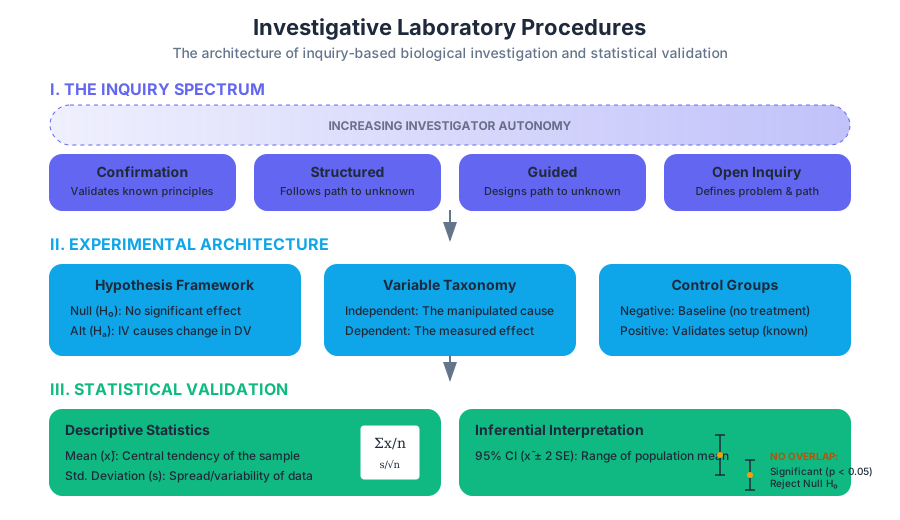
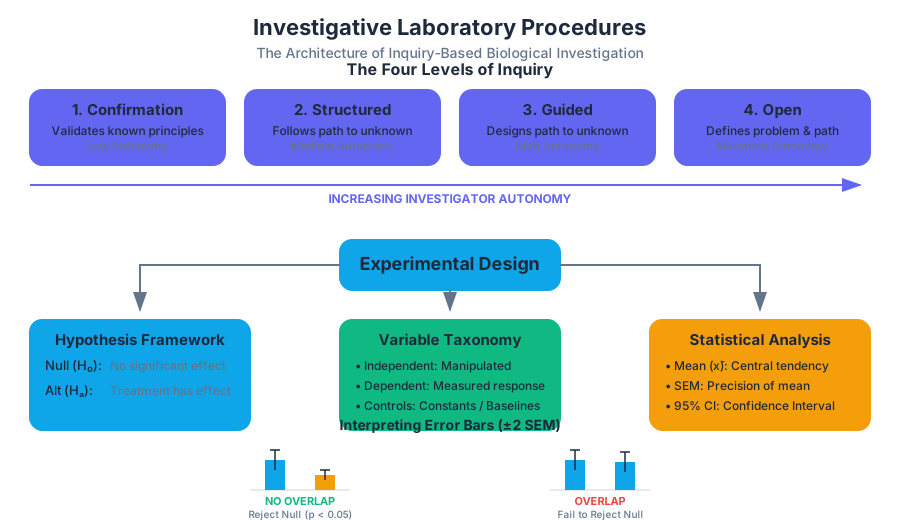
AP Biology Exam Format and Scoring
Key concepts: Multiple-Choice Questions (MCQ) · Free-Response Questions (FRQ) · Digital Assessment · Scoring Weighting
A breakdown of the AP Exam sections, timing, and question types.
AP Biology Exam Format and Scoring
The AP Biology Exam is the capstone assessment of a college-level introductory biology course, designed to evaluate not only a student's retention of biological facts but their ability to apply the Scientific Method, analyze complex data, and synthesize multi-disciplinary concepts. As of the 2025-2026 academic year, the exam has transitioned into a Digital Assessment format, utilizing the Bluebook™ application to modernize the testing experience while maintaining the rigorous standards of the American Council on Education (ACE).
The exam is a three-hour marathon divided into two equally weighted sections. It serves as a high-stakes bridge between secondary education and collegiate research, focusing heavily on the Eight Units of the AP Biology framework and the Six Science Practices.
The Exam Architecture: A Structural Breakdown
The AP Biology Exam is meticulously balanced to ensure that neither breadth of knowledge nor depth of analysis is sacrificed. The two-section format ensures that students who excel at rapid-fire conceptual recognition (Section I) and those who excel at long-form argumentative synthesis (Section II) are both fairly evaluated.
Table 1: High-Level Exam Specifications
| Feature | Section I: Multiple-Choice (MCQ) | Section II: Free-Response (FRQ) |
|---|---|---|
| Duration | 90 Minutes | 90 Minutes |
| Number of Questions | 60 Questions | 6 Questions |
| Weighting | 50% of Total Score | 50% of Total Score |
| Format | Individual & Set-based questions | 2 Long-form; 4 Short-form |
| Primary Focus | Concept recognition & Data analysis | Experimental design & Argumentation |
| Tools Allowed | Four-function/Scientific/Graphing Calculator | Four-function/Scientific/Graphing Calculator |
Section I: Multiple-Choice Questions (MCQ)
Section I consists of 60 questions that must be completed in 90 minutes, averaging 1.5 minutes per question. This section tests the "breadth" of the curriculum. However, modern AP Biology MCQs have moved away from simple "definition recall" toward Scenario-Based Inquiry.
Types of MCQ Items
- Discrete Questions: Stand-alone items that target a specific concept or science practice.
- Question Sets: A series of 3 to 6 questions centered around a common stimulus, such as a description of a laboratory experiment, a data table, a cladogram, or a complex biological diagram.
The Science Practices in MCQ
The College Board assesses six specific practices within the MCQ section. It is no longer enough to know what a ribosome does; a student must be able to predict what happens to a cell if a specific toxin inhibits ribosomal function, often backed by a provided graph of protein synthesis rates.
Table 2: Curricular Weighting by Unit
| Unit | Topic | Exam Weighting (Approx.) |
|---|---|---|
| Unit 1 | Chemistry of Life | 8–11% |
| Unit 2 | Cell Structure and Function | 10–13% |
| Unit 3 | Cellular Energetics | 12–16% |
| Unit 4 | Cell Communication and Cell Cycle | 10–15% |
| Unit 5 | Heredity | 8–11% |
| Unit 6 | Gene Expression and Regulation | 12–16% |
| Unit 7 | Natural Selection | 13–20% |
| Unit 8 | Ecology | 10–15% |
Key Insight: Units 7 (Natural Selection) and 6 (Gene Expression) typically carry the highest weight. A student mastering these two units is essentially mastering the "software" and the "evolutionary history" of life, which are the most frequent targets for complex question sets.
Section II: Free-Response Questions (FRQ)
Section II is the "depth" portion of the exam. It requires students to generate their own text, diagrams, and mathematical calculations. The FRQ section is divided into two "Long" questions and four "Short" questions.
The Anatomy of the FRQs
- Question 1: Interpreting and Evaluating Experimental Results (8–10 pts): This is the "Lab Question." Students are presented with a real-world experimental scenario. They must describe the biological concepts, identify variables (independent/dependent), perform mathematical calculations (like standard error or chi-square), and predict the effects of changing experimental conditions.
- Question 2: Interpreting and Evaluating Experimental Results with Graphing (8–10 pts): Similar to Q1, but specifically requires the student to construct a graph (bar, line, or scatter) based on a data table and then use that graph to support a biological claim.
- Question 3: Scientific Investigation (4 pts): Focuses on the "how" of biology. Students might be asked to identify a control group or justify why a specific laboratory technique was used.
- Question 4: Conceptual Analysis (4 pts): Requires students to explain a biological process in a specific context, often involving a mutation or an environmental disruption.
- Question 5: Analyze Model or Visual Representation (4 pts): Students are given a diagram (e.g., a signal transduction pathway or a food web) and must predict how a change in one part of the model affects the rest of the system.
- Question 6: Data Analysis (4 pts): A focused look at a specific data set, often requiring the student to explain how the data supports or refutes a given hypothesis.
Table 3: The "Task Verb" Hierarchy
Success in Section II depends on understanding exactly what the prompt is asking for.
| Task Verb | Requirement | Complexity |
|---|---|---|
| Calculate | Perform mathematical steps to arrive at a final answer (include units!). | Moderate |
| Describe | Provide the relevant characteristics of a specified topic. | Low |
| Explain | Provide information about how or why a relationship, process, or pattern occurs. | High |
| Identify | Provide a specific answer without needing an explanation. | Low |
| Justify | Provide evidence to support, qualify, or defend a claim. | High |
| Predict | State what will happen in the future based on the provided information. | Moderate |
Mathematical Requirements and the Formula Sheet
AP Biology is increasingly quantitative. Students are provided with a multi-page Equations and Formulas Sheet during the exam. This sheet is not a "cheat sheet" but a toolkit for high-level analysis.
Key Mathematical Concepts Tested:
- Statistical Analysis: Calculating the
Mean,Standard Deviation, andStandard Error of the Mean (SEM). Students must understand that if error bars (±2 SEM) overlap, the difference between two groups is likely not statistically significant. - Chi-Square Analysis ($\chi^2$): Used to determine if observed data (e.g., offspring counts in a genetic cross) fits an expected distribution (e.g., 3:1 Mendelian ratio).
- Hardy-Weinberg Equilibrium: Using $p^2 + 2pq + q^2 = 1$ to calculate allele frequencies in a non-evolving population.
- Water Potential ($\Psi$): Calculating $\Psi = \Psi_s + \Psi_p$ to predict the direction of water movement in plant cells.
- Gibbs Free Energy ($\Delta G$): Determining if a reaction is exergonic (spontaneous) or endergonic.
Worked Example: Chi-Square Analysis
Scenario: A student crosses two pea plants heterozygous for flower color ($Pp \times Pp$). The expected ratio is 3 purple to 1 white. Out of 100 offspring, 70 are purple and 30 are white.
- Expected ($e$): 75 purple, 25 white.
- Observed ($o$): 70 purple, 30 white.
- Formula: $\chi^2 = \sum \frac{(o-e)^2}{e}$
- Calculation:
- Purple: $(70-75)^2 / 75 = 25 / 75 = 0.33$
- White: $(30-25)^2 / 25 = 25 / 25 = 1.00$
- $\chi^2 = 1.33$
- Interpretation: With $df = 1$ (degrees of freedom), the critical value at $p=0.05$ is 3.84. Since $1.33 < 3.84$, we fail to reject the null hypothesis. The deviation is due to chance.
The Digital Assessment Transition
Starting in 2025, the AP Biology Exam is administered via the Bluebook™ app. This shift introduces several functional changes:
- Annotation Tools: Students can highlight text and cross out answer choices digitally.
- Reference Access: The Formula Sheet and Periodic Table are accessible via a built-in toggle, eliminating the need to flip through paper booklets.
- FRQ Typing: Students type their responses for Section II. This generally benefits students by allowing for faster editing and reorganization of thoughts, though it requires familiarity with typing scientific notation.
- Graphing Tool: For Question 2 of the FRQ, students use a digital graphing interface to plot points and draw lines of best fit.
Scoring Mechanics: From Raw to Composite
The final AP score (1–5) is not a simple percentage. It is a Composite Score derived from the raw points earned in both sections.
- Raw MCQ Score: Number of correct answers (no penalty for guessing). Max = 60.
- Raw FRQ Score: Total points earned across all 6 questions. Max is usually around 32–36 points depending on the year's specific rubric.
- Weighting: Both raw scores are scaled so that they each contribute exactly 50% to the final composite.
- The Cut Score: The Chief Reader (a college professor) and a committee of experts set "cut scores" for the 1–5 scale. These cuts change slightly every year to account for variations in exam difficulty, ensuring that a "3" in 2024 represents the same level of mastery as a "3" in 2026.
Table 4: Typical Score Interpretations
| AP Score | Qualification | College Credit Equivalent |
|---|---|---|
| 5 | Extremely well qualified | A / A+ |
| 4 | Well qualified | A- / B+ |
| 3 | Qualified | B- / C |
| 2 | Possibly qualified | D |
| 1 | No recommendation | F |
Common Pitfalls and Success Strategies
1. Misinterpreting "The Null Hypothesis"
Many students struggle with the statistical requirement of the FRQ. A Null Hypothesis ($H_0$) always states that there is no significant difference between groups or no effect of a treatment. When data shows a massive difference, the student must "reject the null hypothesis," not simply say "the experiment worked."
2. The "Identify" vs. "Explain" Trap
In Section II, if a question asks you to "Identify" a hormone and you write a three-paragraph "Explanation" of how that hormone works, you have wasted precious time. Conversely, if it asks you to "Explain" and you only "Identify," you will receive zero points for that task.
3. Scaling the Graph
In FRQ Question 2, the most common point loss occurs in the setup:
- Axes: Must be labeled with units (e.g., "Time (min)").
- Scaling: Intervals must be uniform (e.g., 0, 5, 10, 15... not 0, 5, 7, 20).
- Data Points: Must be plotted accurately and, if requested, connected or fitted with a line.
4. Evolution as the "Core Theme"
When in doubt on a conceptual question, relate the answer back to Evolution or Homeostasis. These are the "Big Ideas" that underpin the entire course. If a protein changes shape, it affects function (Homeostasis); if a trait increases survival, it becomes more common in the population (Evolution).
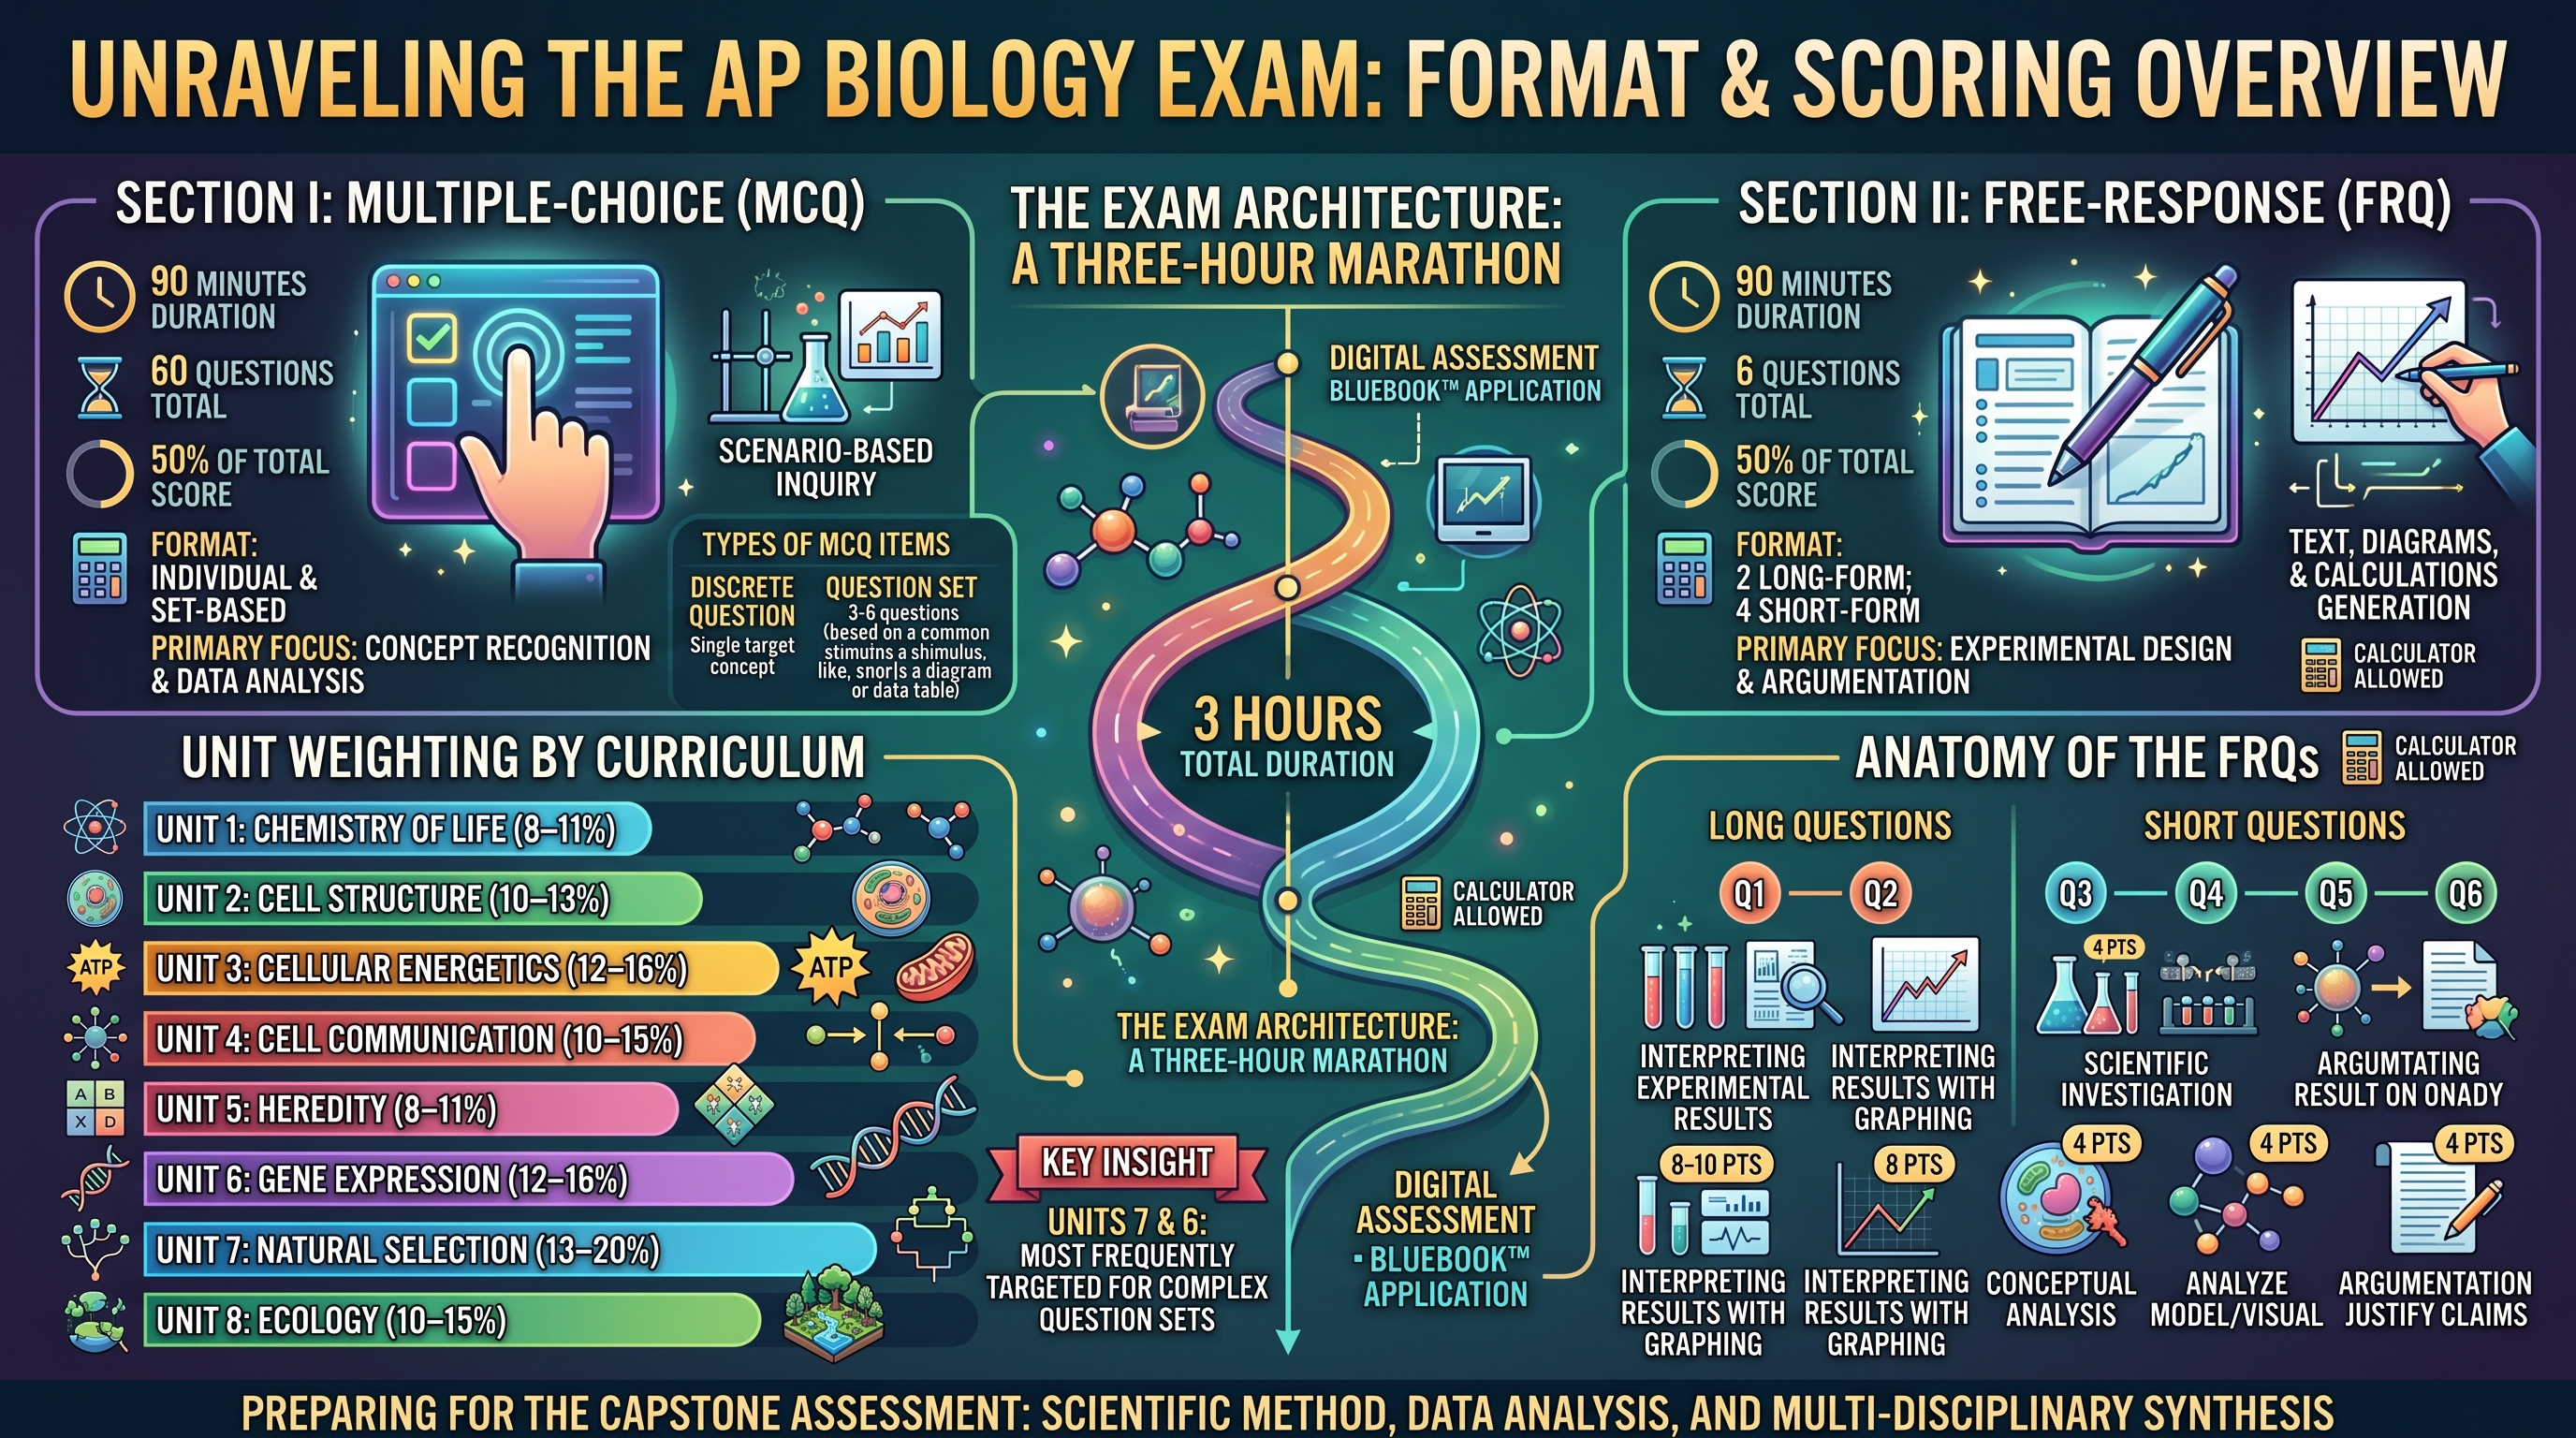
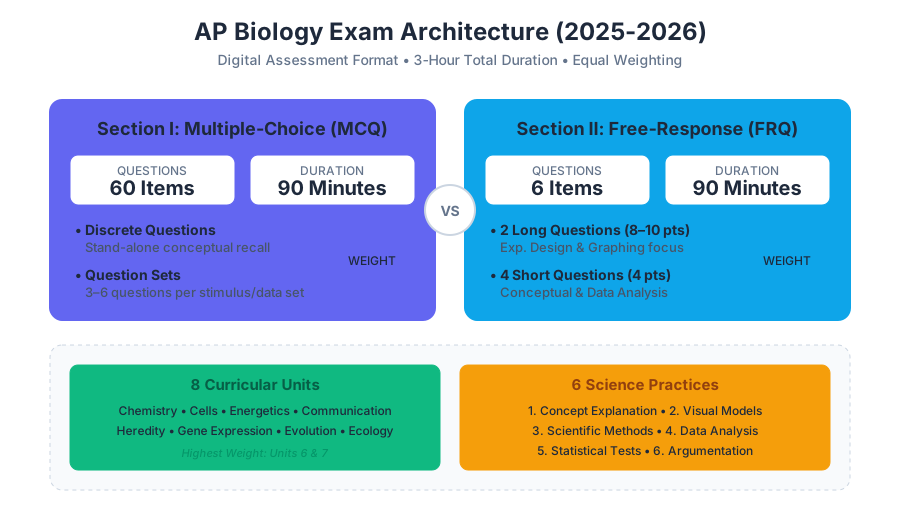
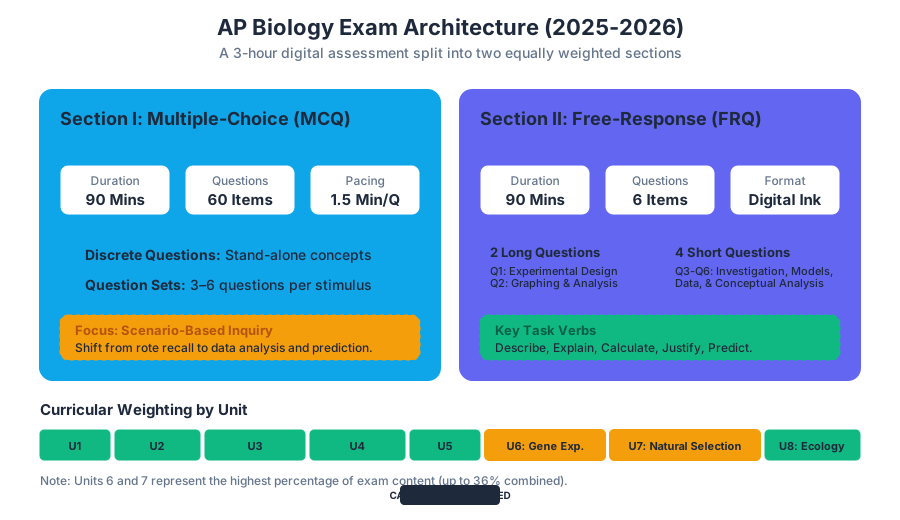
Source Materials
- Ap Biology Course Overview.Pdf
- Ap Biology Course And Exam Description.Pdf
- Ap Biology Course At A Glance.Pdf
- AP Biology Course and Exam Description
- How to Sign Up for an AP Course
- Ap Biology Equations And Formulas Sheet.Pdf
- Get the Most Out of AP
- Choosing Your AP Courses
- AP Biology
- AP Biology
- AP Biology Lab Manual
- Map Out Your Journey with AP
Study Advanced Principles of Biological Systems and Inquiry with AI — Free on Lykke
Sign up for free to generate personalized flashcards, quizzes, and study guides from this course. Chat with an AI tutor that knows the material.
Get Started FreeView this course wiki on Lykke · Browse all public course wikis