From the free course Advanced Principles of Biological Systems and Inquiry on Lykke
AP Biology Exam Format and Scoring
Key concepts: Multiple-Choice Questions (MCQ) · Free-Response Questions (FRQ) · Digital Assessment · Scoring Weighting
A breakdown of the AP Exam sections, timing, and question types.
AP Biology Exam Format and Scoring
The AP Biology Exam is the capstone assessment of a college-level introductory biology course, designed to evaluate not only a student's retention of biological facts but their ability to apply the Scientific Method, analyze complex data, and synthesize multi-disciplinary concepts. As of the 2025-2026 academic year, the exam has transitioned into a Digital Assessment format, utilizing the Bluebook™ application to modernize the testing experience while maintaining the rigorous standards of the American Council on Education (ACE).
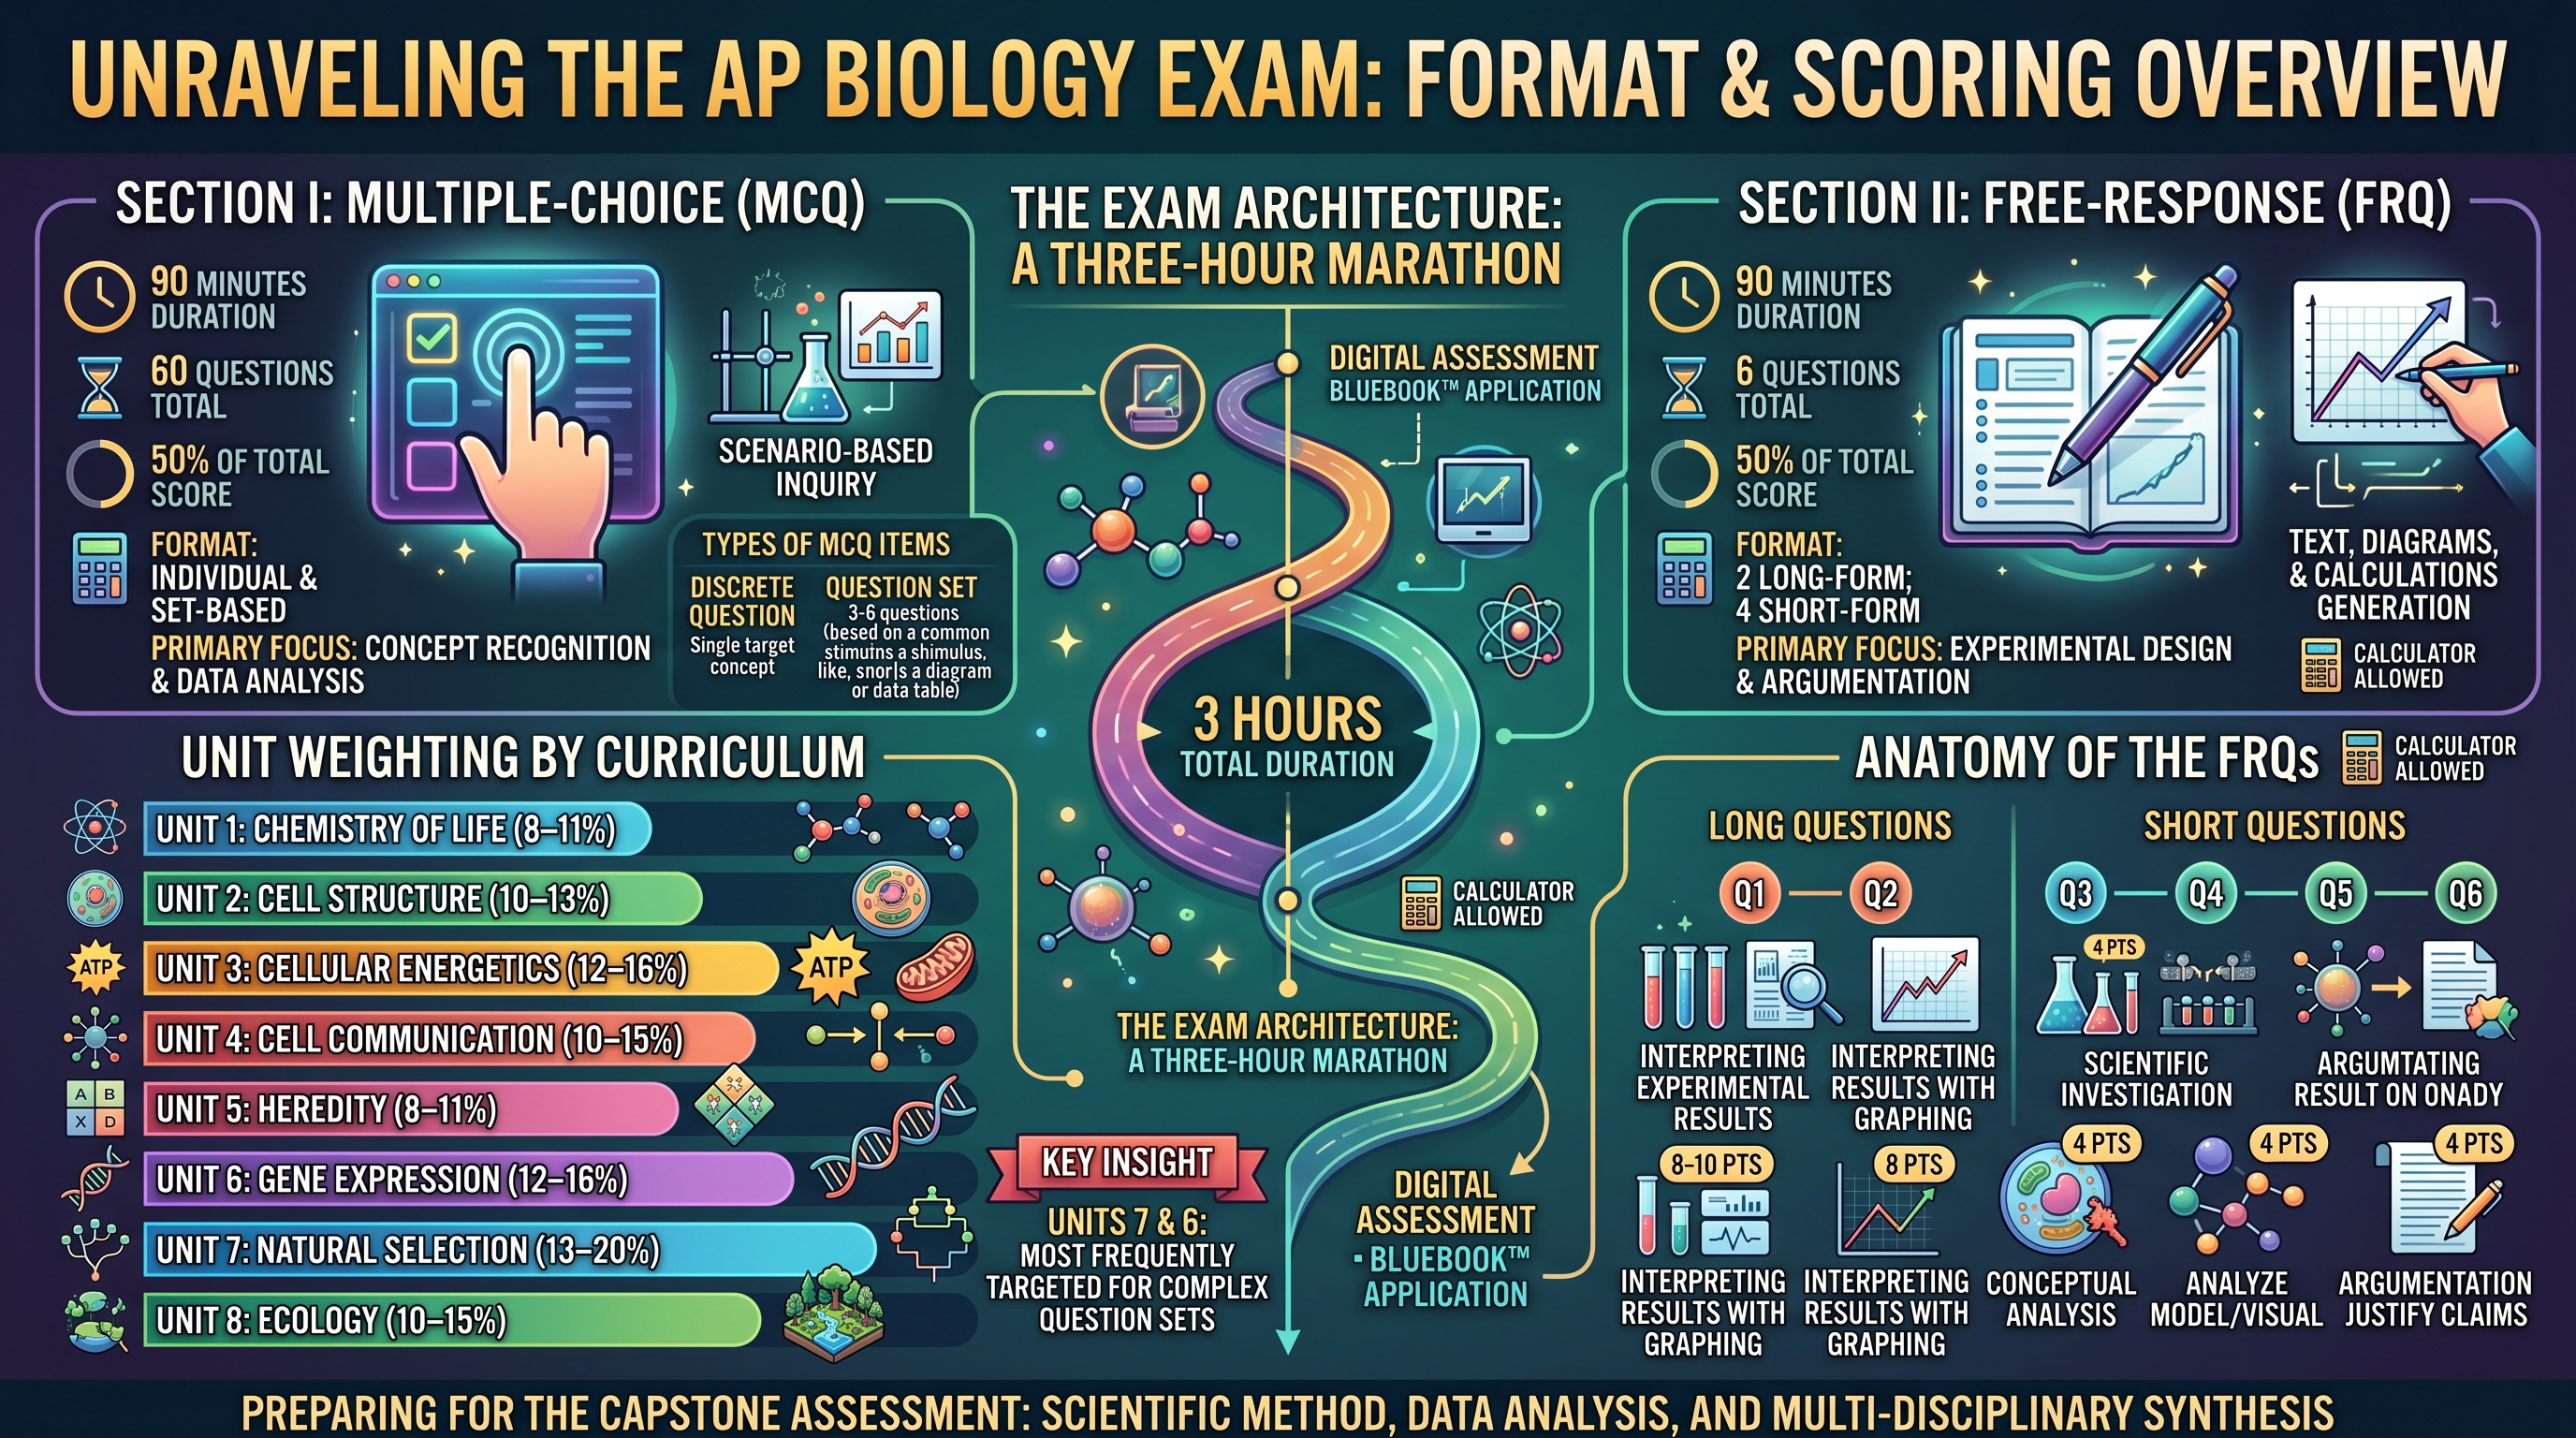
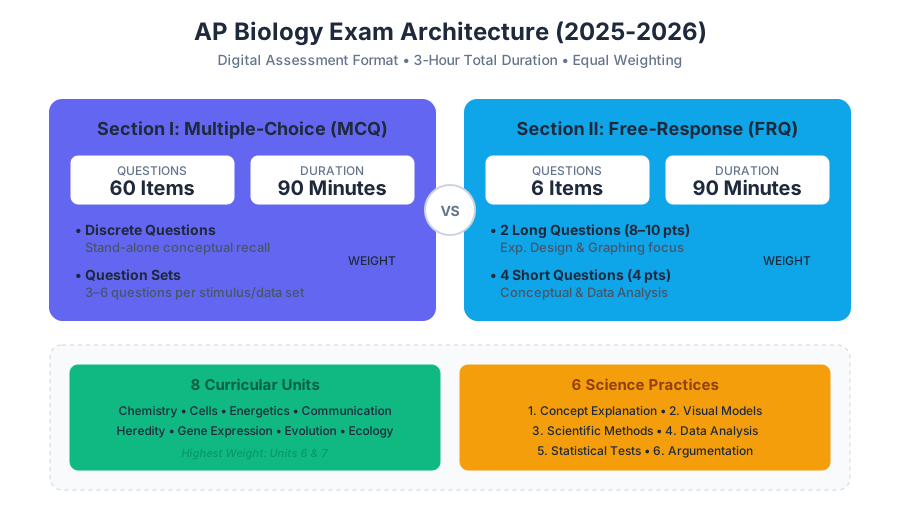
The exam is a three-hour marathon divided into two equally weighted sections. It serves as a high-stakes bridge between secondary education and collegiate research, focusing heavily on the Eight Units of the AP Biology framework and the Six Science Practices.
The Exam Architecture: A Structural Breakdown
The AP Biology Exam is meticulously balanced to ensure that neither breadth of knowledge nor depth of analysis is sacrificed. The two-section format ensures that students who excel at rapid-fire conceptual recognition (Section I) and those who excel at long-form argumentative synthesis (Section II) are both fairly evaluated.
Table 1: High-Level Exam Specifications
| Feature | Section I: Multiple-Choice (MCQ) | Section II: Free-Response (FRQ) |
|---|---|---|
| Duration | 90 Minutes | 90 Minutes |
| Number of Questions | 60 Questions | 6 Questions |
| Weighting | 50% of Total Score | 50% of Total Score |
| Format | Individual & Set-based questions | 2 Long-form; 4 Short-form |
| Primary Focus | Concept recognition & Data analysis | Experimental design & Argumentation |
| Tools Allowed | Four-function/Scientific/Graphing Calculator | Four-function/Scientific/Graphing Calculator |
Section I: Multiple-Choice Questions (MCQ)
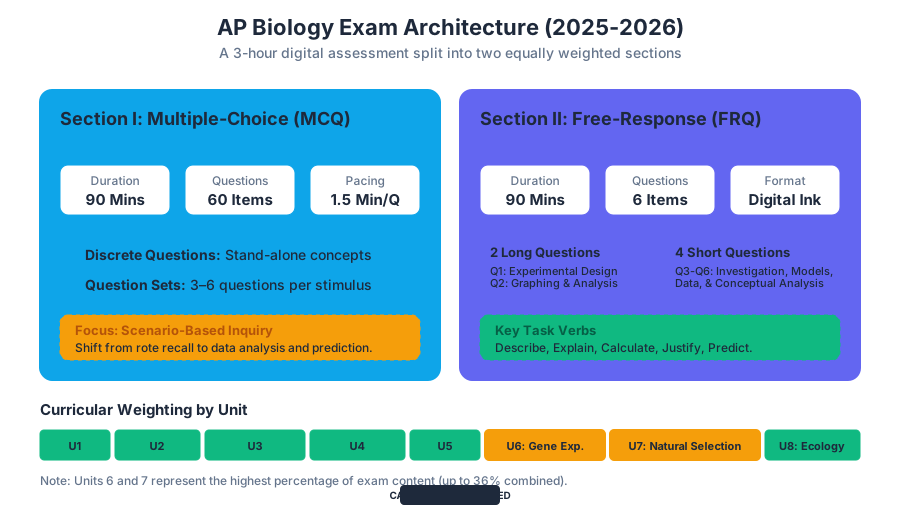
Section I consists of 60 questions that must be completed in 90 minutes, averaging 1.5 minutes per question. This section tests the "breadth" of the curriculum. However, modern AP Biology MCQs have moved away from simple "definition recall" toward Scenario-Based Inquiry.
Types of MCQ Items
- Discrete Questions: Stand-alone items that target a specific concept or science practice.
- Question Sets: A series of 3 to 6 questions centered around a common stimulus, such as a description of a laboratory experiment, a data table, a cladogram, or a complex biological diagram.
The Science Practices in MCQ
The College Board assesses six specific practices within the MCQ section. It is no longer enough to know what a ribosome does; a student must be able to predict what happens to a cell if a specific toxin inhibits ribosomal function, often backed by a provided graph of protein synthesis rates.
Table 2: Curricular Weighting by Unit
| Unit | Topic | Exam Weighting (Approx.) |
|---|---|---|
| Unit 1 | Chemistry of Life | 8–11% |
| Unit 2 | Cell Structure and Function | 10–13% |
| Unit 3 | Cellular Energetics | 12–16% |
| Unit 4 | Cell Communication and Cell Cycle | 10–15% |
| Unit 5 | Heredity | 8–11% |
| Unit 6 | Gene Expression and Regulation | 12–16% |
| Unit 7 | Natural Selection | 13–20% |
| Unit 8 | Ecology | 10–15% |
Key Insight: Units 7 (Natural Selection) and 6 (Gene Expression) typically carry the highest weight. A student mastering these two units is essentially mastering the "software" and the "evolutionary history" of life, which are the most frequent targets for complex question sets.
Section II: Free-Response Questions (FRQ)
Section II is the "depth" portion of the exam. It requires students to generate their own text, diagrams, and mathematical calculations. The FRQ section is divided into two "Long" questions and four "Short" questions.
The Anatomy of the FRQs
- Question 1: Interpreting and Evaluating Experimental Results (8–10 pts): This is the "Lab Question." Students are presented with a real-world experimental scenario. They must describe the biological concepts, identify variables (independent/dependent), perform mathematical calculations (like standard error or chi-square), and predict the effects of changing experimental conditions.
- Question 2: Interpreting and Evaluating Experimental Results with Graphing (8–10 pts): Similar to Q1, but specifically requires the student to construct a graph (bar, line, or scatter) based on a data table and then use that graph to support a biological claim.
- Question 3: Scientific Investigation (4 pts): Focuses on the "how" of biology. Students might be asked to identify a control group or justify why a specific laboratory technique was used.
- Question 4: Conceptual Analysis (4 pts): Requires students to explain a biological process in a specific context, often involving a mutation or an environmental disruption.
- Question 5: Analyze Model or Visual Representation (4 pts): Students are given a diagram (e.g., a signal transduction pathway or a food web) and must predict how a change in one part of the model affects the rest of the system.
- Question 6: Data Analysis (4 pts): A focused look at a specific data set, often requiring the student to explain how the data supports or refutes a given hypothesis.
Table 3: The "Task Verb" Hierarchy
Success in Section II depends on understanding exactly what the prompt is asking for.
| Task Verb | Requirement | Complexity |
|---|---|---|
| Calculate | Perform mathematical steps to arrive at a final answer (include units!). | Moderate |
| Describe | Provide the relevant characteristics of a specified topic. | Low |
| Explain | Provide information about how or why a relationship, process, or pattern occurs. | High |
| Identify | Provide a specific answer without needing an explanation. | Low |
| Justify | Provide evidence to support, qualify, or defend a claim. | High |
| Predict | State what will happen in the future based on the provided information. | Moderate |
Mathematical Requirements and the Formula Sheet
AP Biology is increasingly quantitative. Students are provided with a multi-page Equations and Formulas Sheet during the exam. This sheet is not a "cheat sheet" but a toolkit for high-level analysis.
Key Mathematical Concepts Tested:
- Statistical Analysis: Calculating the
Mean,Standard Deviation, andStandard Error of the Mean (SEM). Students must understand that if error bars (±2 SEM) overlap, the difference between two groups is likely not statistically significant. - Chi-Square Analysis ($\chi^2$): Used to determine if observed data (e.g., offspring counts in a genetic cross) fits an expected distribution (e.g., 3:1 Mendelian ratio).
- Hardy-Weinberg Equilibrium: Using $p^2 + 2pq + q^2 = 1$ to calculate allele frequencies in a non-evolving population.
- Water Potential ($\Psi$): Calculating $\Psi = \Psi_s + \Psi_p$ to predict the direction of water movement in plant cells.
- Gibbs Free Energy ($\Delta G$): Determining if a reaction is exergonic (spontaneous) or endergonic.
Worked Example: Chi-Square Analysis
Scenario: A student crosses two pea plants heterozygous for flower color ($Pp \times Pp$). The expected ratio is 3 purple to 1 white. Out of 100 offspring, 70 are purple and 30 are white.
- Expected ($e$): 75 purple, 25 white.
- Observed ($o$): 70 purple, 30 white.
- Formula: $\chi^2 = \sum \frac{(o-e)^2}{e}$
- Calculation:
- Purple: $(70-75)^2 / 75 = 25 / 75 = 0.33$
- White: $(30-25)^2 / 25 = 25 / 25 = 1.00$
- $\chi^2 = 1.33$
- Interpretation: With $df = 1$ (degrees of freedom), the critical value at $p=0.05$ is 3.84. Since $1.33 < 3.84$, we fail to reject the null hypothesis. The deviation is due to chance.
The Digital Assessment Transition
Starting in 2025, the AP Biology Exam is administered via the Bluebook™ app. This shift introduces several functional changes:
- Annotation Tools: Students can highlight text and cross out answer choices digitally.
- Reference Access: The Formula Sheet and Periodic Table are accessible via a built-in toggle, eliminating the need to flip through paper booklets.
- FRQ Typing: Students type their responses for Section II. This generally benefits students by allowing for faster editing and reorganization of thoughts, though it requires familiarity with typing scientific notation.
- Graphing Tool: For Question 2 of the FRQ, students use a digital graphing interface to plot points and draw lines of best fit.
Scoring Mechanics: From Raw to Composite
The final AP score (1–5) is not a simple percentage. It is a Composite Score derived from the raw points earned in both sections.
- Raw MCQ Score: Number of correct answers (no penalty for guessing). Max = 60.
- Raw FRQ Score: Total points earned across all 6 questions. Max is usually around 32–36 points depending on the year's specific rubric.
- Weighting: Both raw scores are scaled so that they each contribute exactly 50% to the final composite.
- The Cut Score: The Chief Reader (a college professor) and a committee of experts set "cut scores" for the 1–5 scale. These cuts change slightly every year to account for variations in exam difficulty, ensuring that a "3" in 2024 represents the same level of mastery as a "3" in 2026.
Table 4: Typical Score Interpretations
| AP Score | Qualification | College Credit Equivalent |
|---|---|---|
| 5 | Extremely well qualified | A / A+ |
| 4 | Well qualified | A- / B+ |
| 3 | Qualified | B- / C |
| 2 | Possibly qualified | D |
| 1 | No recommendation | F |
Common Pitfalls and Success Strategies
1. Misinterpreting "The Null Hypothesis"
Many students struggle with the statistical requirement of the FRQ. A Null Hypothesis ($H_0$) always states that there is no significant difference between groups or no effect of a treatment. When data shows a massive difference, the student must "reject the null hypothesis," not simply say "the experiment worked."
2. The "Identify" vs. "Explain" Trap
In Section II, if a question asks you to "Identify" a hormone and you write a three-paragraph "Explanation" of how that hormone works, you have wasted precious time. Conversely, if it asks you to "Explain" and you only "Identify," you will receive zero points for that task.
3. Scaling the Graph
In FRQ Question 2, the most common point loss occurs in the setup:
- Axes: Must be labeled with units (e.g., "Time (min)").
- Scaling: Intervals must be uniform (e.g., 0, 5, 10, 15... not 0, 5, 7, 20).
- Data Points: Must be plotted accurately and, if requested, connected or fitted with a line.
4. Evolution as the "Core Theme"
When in doubt on a conceptual question, relate the answer back to Evolution or Homeostasis. These are the "Big Ideas" that underpin the entire course. If a protein changes shape, it affects function (Homeostasis); if a trait increases survival, it becomes more common in the population (Evolution).
Source Materials
Study Advanced Principles of Biological Systems and Inquiry on Lykke
This course page is free to open: signed out, you can read its first two sections, and signing in, on any plan, opens the rest. The free Lykke Chrome extension syncs your own Canvas courses, so ChatGPT, Claude and Muse can answer from your classes and deadlines. It only reads Canvas.
Add the free extensionSign in to open every sectionAll sections of Advanced Principles of Biological Systems and Inquiry · Browse more course pages