From the free course Interdisciplinary Foundations of Academic and Professional Literacy on Lykke
Professional Development and College Success
Key concepts: Time Management · Crisis Communication Plan (CCP) · Data Visualization · Learning Styles
Strategies for academic success and professional career building, including crisis communication and data presentation.
Professional Development and College Success
Professional development and academic success are often mischaracterized as a collection of "soft skills." In reality, they constitute the operational framework through which technical expertise is applied. Whether navigating a rigorous collegiate environment or managing high-stakes corporate projects, the ability to optimize temporal resources, decode complex information, and communicate during systemic failures is what separates high-performers from the median.
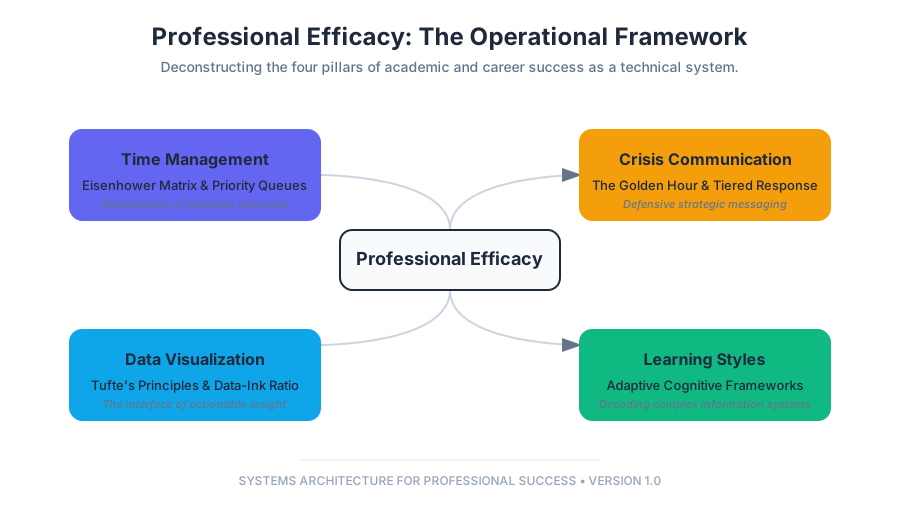
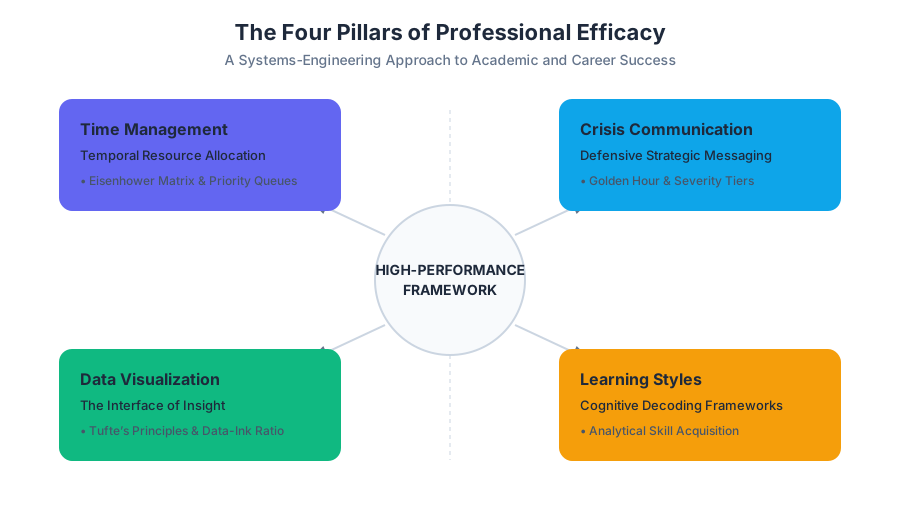
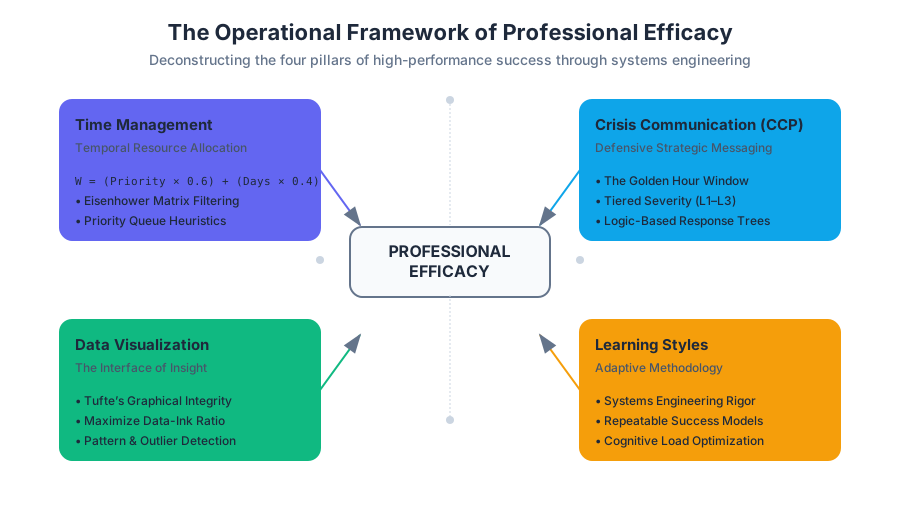
This article deconstructs the four pillars of professional efficacy: Time Management, Crisis Communication Planning (CCP), Data Visualization, and Learning Styles. By treating these concepts with the same analytical rigor as a systems engineer treats a network architecture, we can derive a repeatable methodology for success.
Time Management: The Optimization of Temporal Resources
At its core, Time Management is the process of planning and exercising conscious control over the amount of time spent on specific activities—especially to increase effectiveness, efficiency, and productivity. In a professional or academic context, it is a resource allocation problem where the "cost" is a non-renewable asset.
The Mechanics of Prioritization
The primary challenge of time management is not the lack of time, but the abundance of "noise." We utilize the Eisenhower Matrix to categorize tasks based on two vectors: Urgency and Importance.
The Eisenhower Principle: "What is important is seldom urgent and what is urgent is seldom important."
Variations in Frameworks
Different environments require different temporal strategies. A student might favor the Pomodoro Technique for deep focus, while a manager might favor Getting Things Done (GTD) for high-volume task triage.
| Framework | Core Philosophy | Best For |
|---|---|---|
| Eisenhower Matrix | Quadrant-based filtering | Strategic planning and delegation |
| Pomodoro | Time-boxing (25m work/5m break) | Combating procrastination/Deep work |
| GTD (Allen) | Externalizing all tasks to a system | High-complexity, multi-project roles |
| Pareto (80/20) | Focus on the 20% of tasks yielding 80% results | Efficiency optimization |
Crisis Communication Plan (CCP): Defensive Strategic Messaging
A Crisis Communication Plan (CCP) is a set of guidelines used to prepare a business or individual for an emergency or unexpected event that could cause damage to its reputation. In the professional world, a crisis is not a matter of "if," but "when."
The Anatomy of a Crisis Response
The efficacy of a CCP is measured by the Golden Hour—the window of time immediately following a crisis where the organization has the most power to shape the narrative.
- Identification: Recognizing the trigger event (e.g., data breach, financial scandal).
- Activation: Mobilizing the Crisis Management Team (CMT).
- Messaging: Deploying pre-approved templates tailored to the specific incident.
- Monitoring: Real-time analysis of public and stakeholder sentiment.
Crisis Severity Levels
Effective CCPs utilize a tiered response system to ensure resources are not over-allocated to minor incidents.
| Level | Description | Response Protocol |
|---|---|---|
| Level 1 | Minor incident; localized impact. | Internal memo; standard social monitoring. |
| Level 2 | Moderate issue; potential for media pickup. | Department head involvement; prepared statement. |
| Level 3 | Critical failure; threat to organizational viability. | CEO-led press conference; 24/7 war room. |
Data Visualization: The Interface of Insight
Data Visualization is the graphical representation of information and data. By using visual elements like charts, graphs, and maps, data visualization tools provide an accessible way to see and understand trends, outliers, and patterns in data.
Tufte’s Principles of Graphical Integrity
Professor Edward Tufte, a pioneer in the field, argues that excellence in statistical graphics consists of complex ideas communicated with clarity, precision, and efficiency.
- Data-Ink Ratio: Maximize the "ink" used to represent actual data; minimize "chartjunk" (gridlines, shadows, 3D effects).
- Lie Factor: The size of the effect shown in the graphic divided by the size of the effect in the data. It should be as close to 1 as possible.
Mathematical Derivation of the Lie Factor
The Lie Factor ($LF$) is calculated as: $$LF = \frac{\text{Size of effect shown in graphic}}{\text{Size of effect in data}}$$ If $LF > 1.05$ or $LF < 0.95$, the graphic is considered distorted.
Technical Visualization with D3.js
For professional-grade visualizations, static charts are often insufficient. Interactive layers allow stakeholders to explore data dimensions.
Choosing the Right Visualization
The choice of chart depends entirely on the relationship between variables.
| Relationship | Recommended Chart | Avoid |
|---|---|---|
| Comparison | Bar Chart, Bullet Graph | Pie Charts (too many slices) |
| Distribution | Histogram, Box Plot | Line Charts (implies continuity) |
| Correlation | Scatter Plot, Heatmap | Dual-axis charts (can be misleading) |
| Temporal (Time) | Line Chart, Area Chart | Bar Charts (if intervals are dense) |
Learning Styles and Cognitive Strategies
Success in both college and professional life requires Metacognition—the ability to think about how one thinks. While the popular VARK model (Visual, Auditory, Read/Write, Kinesthetic) is a useful starting point, modern educational psychology emphasizes Multimodal Learning and Active Recall.
The Forgetting Curve and Spaced Repetition
The Ebbinghaus Forgetting Curve posits that humans lose 50% of new information within 24 hours unless it is consciously reviewed. The solution is Spaced Repetition, an evidence-based learning technique that increases the interval between reviews of previously learned material.
The Spaced Repetition Algorithm
The most famous implementation of this is the SuperMemo-2 (SM-2) algorithm, which calculates the next interval ($I$) based on a quality score ($q$).
ALGORITHM SpacedRepetition(card, quality_score):
    IF quality_score >= 3:
        IF card.repetitions == 0:
            card.interval = 1
        ELSE IF card.repetitions == 1:
            card.interval = 6
        ELSE:
            card.interval = round(card.previous_interval * card.easiness_factor)

        card.repetitions += 1
        card.easiness_factor = card.easiness_factor + (0.1 - (5 - q) * (0.08 + (5 - q) * 0.02))
    ELSE:
        card.repetitions = 0
        card.interval = 1

    RETURN card.next_review_date = current_date + card.interval
Strategic Study Techniques
Beyond "styles," certain techniques have higher empirical efficacy than others.
| Technique | Description | Efficacy |
|---|---|---|
| Active Recall | Testing yourself rather than re-reading. | High |
| Interleaving | Mixing different topics or subjects in one session. | High |
| Elaborative Interrogation | Asking "Why?" and "How?" for every concept. | Moderate-High |
| Summarization | Writing a summary of the material. | Low-Moderate |
Information Literacy: The Foundation of Professional Research
In an era of information ubiquity, the ability to find, evaluate, and use information ethically is a critical professional competency. This is known as Information Literacy.
The CRAAP Test
A standard heuristic for evaluating sources (especially in academic and financial research) is the CRAAP Test:
- Currency: The timeliness of the information.
- Relevance: The importance of the information for your needs.
- Authority: The source of the information (credentials of the author).
- Accuracy: The reliability, truthfulness, and correctness of the content.
- Purpose: The reason the information exists (bias, propaganda, or fact).
Professional Research Pipeline
A senior analyst or researcher follows a structured pipeline to move from a raw query to a defensible conclusion:
- Query Formulation: Using Boolean operators (
AND,OR,NOT) to narrow the search space. - Source Triage: Applying the CRAAP test to filter out low-signal data.
- Synthesis: Integrating disparate data points into a cohesive narrative.
- Citation: Using frameworks like MLA or APA to provide a recursive path for others to verify the data.
Conclusion: Synthesis of Skills
Professional development is not a static destination but a dynamic optimization process. By treating Time Management as an algorithmic priority problem, Crisis Communication as a strategic state machine, Data Visualization as a mathematical mapping of truth, and Learning Styles as a cognitive feedback loop, individuals can achieve a level of "College Success" that translates directly into long-term career mastery.
The modern professional must be a "T-shaped" individual: possessing deep technical expertise in one area (like Finance or Computer Science) while maintaining a broad horizontal bar of professional competencies that allow that expertise to be effectively deployed in the real world.
Source Materials
Study Interdisciplinary Foundations of Academic and Professional Literacy on Lykke
This course page is free to open: signed out, you can read its first two sections, and signing in, on any plan, opens the rest. The free Lykke Chrome extension syncs your own Canvas courses, so ChatGPT, Claude and Muse can answer from your classes and deadlines. It only reads Canvas.
Add the free extensionSign in to open every sectionAll sections of Interdisciplinary Foundations of Academic and Professional Literacy · Browse more course pages