From the free course High School Biology on Lykke
Complex Inheritance and Pedigree Analysis
Key concepts: Incomplete dominance · Codominance · Sex-linked traits · Pedigrees · Polygenic traits
Exploring genetic patterns that go beyond simple dominance and recessiveness.
Complex Inheritance and Pedigree Analysis
While Gregor Mendel’s work with Pisum sativum established the fundamental laws of segregation and independent assortment, the biological reality of inheritance is rarely as binary as "purple vs. white." In the century following Mendel, geneticists discovered that the relationship between genotype and phenotype is often modulated by dosage effects, multi-locus interactions, and chromosomal positioning. This article explores the sophisticated mechanisms of non-Mendelian inheritance and the analytical frameworks used to trace these traits through biological lineages.
The Spectrum of Dominance: Beyond Binary Traits
In classical Mendelian genetics, the dominant allele completely masks the recessive one. However, at the molecular level, dominance is a description of the phenotypic manifestation of heterozygosity, not an inherent property of an allele itself.
Incomplete Dominance
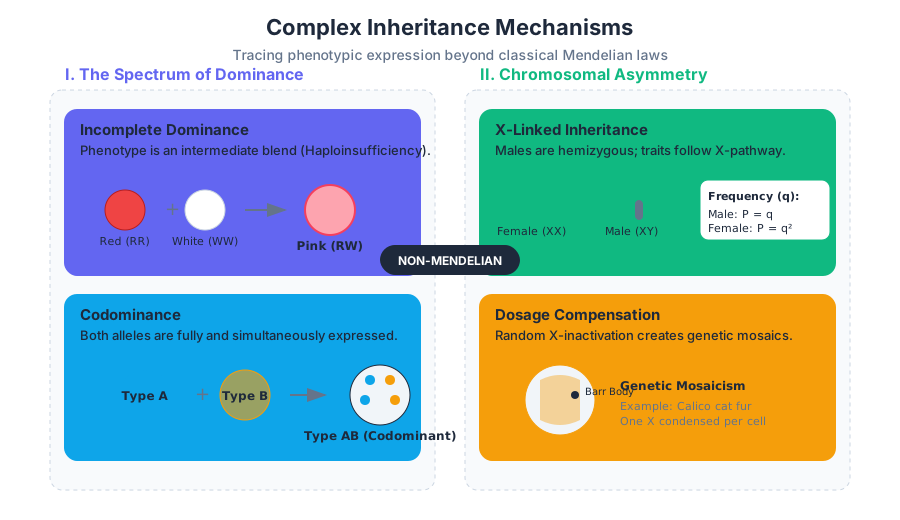
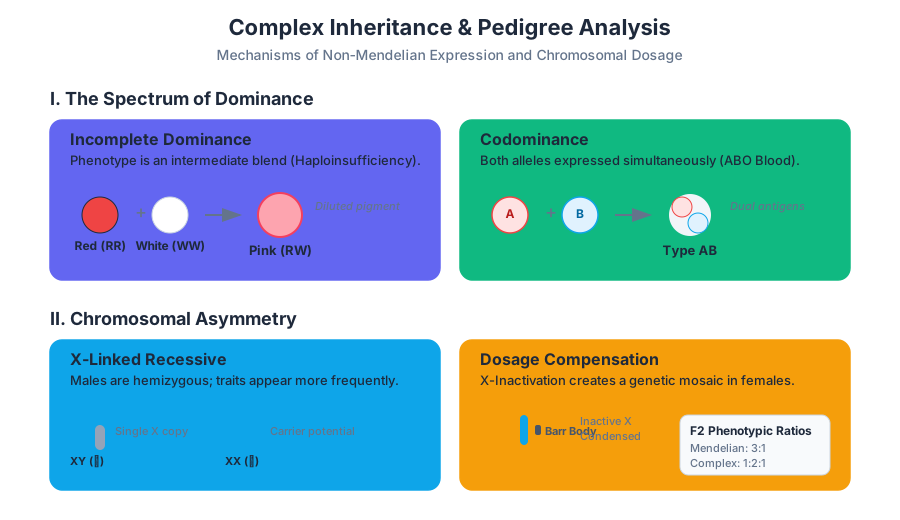
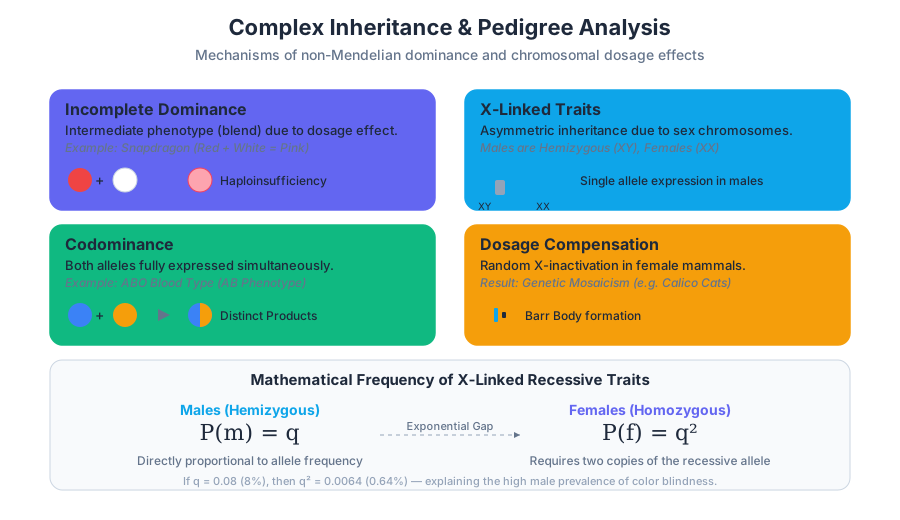
Incomplete dominance occurs when the phenotype of the heterozygote is an intermediate blend between the two homozygotes. This is typically a result of a "dosage effect," where a single functional allele cannot produce enough protein product to achieve the full homozygous phenotype.
Definition: Haploinsufficiency A situation where the total level of a gene product (protein) produced by a single functional allele is insufficient to maintain the normal (wild-type) function, leading to an intermediate or altered phenotype.
A classic example is the snapdragon (Antirrhinum majus). Crossing a homozygous red flower ($C^R C^R$) with a homozygous white flower ($C^W C^W$) results in pink offspring ($C^R C^W$). Here, the $C^R$ allele produces red pigment, but one copy is insufficient to saturate the petal tissue, resulting in a diluted pink appearance.
Codominance
In codominance, both alleles in the heterozygote are fully expressed, and neither masks the other. The resulting phenotype is not a blend, but a simultaneous display of both parental traits.
The most prominent human example is the ABO blood group system. The $I^A$ and $I^B$ alleles are codominant to each other, while both are dominant over the $i$ allele. An individual with the $I^A I^B$ genotype expresses both A and B antigens on the surface of their red blood cells.
| Feature | Complete Dominance | Incomplete Dominance | Codominance |
|---|---|---|---|
| Heterozygote Phenotype | Identical to dominant homozygote | Intermediate (blend) of parents | Both parental traits visible |
| Molecular Basis | One allele produces enough protein | Product dosage is insufficient | Both alleles produce distinct products |
| F2 Phenotypic Ratio | 3:1 | 1:2:1 | 1:2:1 |
| Example | Mendel's peas (Purple/White) | Snapdragon color (Pink) | Human AB blood type |
Sex-Linked Inheritance: The Chromosomal Asymmetry
Inheritance patterns shift dramatically when the gene of interest resides on a sex chromosome ($X$ or $Y$ in humans). Because males ($XY$) and females ($XX$) possess different "doses" of these chromosomes, the standard rules of autosomal probability do not apply.
X-Linked Traits
The X chromosome is significantly larger than the Y chromosome and carries thousands of genes unrelated to sex determination. Because males have only one X chromosome, they are hemizygous for X-linked traits.
- Recessive X-linked traits: More common in males. A male only needs one copy of the recessive allele (from his mother) to express the trait. A female needs two copies (one from each parent).
- Dominant X-linked traits: A father will pass the trait to all of his daughters but none of his sons.
Dosage Compensation and X-Inactivation
To prevent females from having twice as many X-linked gene products as males, placental mammals undergo X-inactivation. Early in embryonic development, one X chromosome in every female cell is randomly condensed into a transcriptionally inactive structure called a Barr body.
This creates a "genetic mosaic." For example, in calico cats, the gene for fur color is on the X chromosome. Depending on which X is inactivated in a specific patch of skin cells, the fur will be black or orange.
Mathematical Derivation of X-Linked Frequency
If the frequency of an X-linked recessive allele in a population is $q$, the probability of the phenotype appearing in the population is:
- In males: $P(m) = q$
- In females: $P(f) = q^2$
Since $q$ is usually a fraction (e.g., $0.08$ for color blindness), $q^2$ is significantly smaller ($0.0064$), explaining the sex disparity in disorders like Hemophilia A.
Polygenic Inheritance and Quantitative Genetics
Many traits do not fall into discrete categories but exist on a continuum (e.g., human height, skin pigmentation, or crop yield). These are polygenic traits, controlled by the cumulative effect of multiple genes, often interacting with environmental factors.
The Additive Model
In a simple polygenic model, each "active" allele contributes a specific "unit" to the phenotype. If three genes ($A, B, C$) control height, an individual with genotype $AABBCC$ would be the tallest, while $aabbcc$ would be the shortest.
The Bell Curve (Normal Distribution)
As the number of genes controlling a trait increases, the number of possible phenotypic variations increases exponentially, following a binomial distribution that approximates a Normal (Gaussian) Distribution.
f(x | \mu, \sigma^2) = \frac{1}{\sqrt{2\pi\sigma^2}} e^{ -\frac{(x-\mu)^2}{2\sigma^2} }
In this context:
- $\mu$ (Mean): The average phenotype produced by the most common combinations of alleles.
- $\sigma$ (Standard Deviation): Represents the phenotypic variance caused by both genetic diversity and environmental "noise."
| Property | Monogenic (Mendelian) | Polygenic (Quantitative) |
|---|---|---|
| Number of Genes | Single gene | Multiple genes (2 to hundreds) |
| Phenotypic Variation | Discrete (Discontinuous) | Continuous |
| Environmental Influence | Usually low | High |
| Analysis Method | Punnett Squares / Pedigrees | Statistical Analysis / QTL Mapping |
| Examples | Cystic Fibrosis, Pea Color | Height, Skin Tone, IQ |
Pedigree Analysis: The Logic of Genetic Inference
A pedigree is a graphical representation of a family’s genetic history. By analyzing the distribution of a trait across generations, we can determine the mode of inheritance (dominant vs. recessive, autosomal vs. sex-linked).
Standard Symbols
- Squares: Males
- Circles: Females
- Shaded: Affected individuals
- Unshaded: Unaffected individuals
- Horizontal Line: Mating
- Vertical Line: Offspring
Heuristics for Pattern Recognition
- Autosomal Recessive:
- Trait often skips generations.
- Two unaffected parents can have an affected child (both parents are carriers).
- If both parents are affected, all children must be affected.
- Autosomal Dominant:
- Trait appears in every generation (does not skip).
- Affected children must have at least one affected parent.
- Two affected parents can have an unaffected child (if both parents are heterozygous).
- X-Linked Recessive:
- Significantly more males are affected than females.
- An affected mother will have 100% affected sons.
- The trait is never passed from father to son (sons inherit Y from father).
- X-Linked Dominant:
- An affected father will pass the trait to all of his daughters and none of his sons.
- Affected females can pass the trait to both sons and daughters.
Theorem: The Exclusion Principle In pedigree analysis, the mode of inheritance is often determined by excluding impossible patterns rather than proving a single one. For instance, if a daughter expresses a recessive trait but her father does not, the trait cannot be X-linked recessive.
Pedigree Data Representation
In computational biology, pedigrees are often stored as relational tables or adjacency lists to allow for automated risk assessment.
Advanced Concepts: Epistasis and Pleiotropy
To fully master complex inheritance, one must look at how genes interact with each other and how a single gene can have multiple effects.
Epistasis
Epistasis occurs when the effect of one gene is dependent on the presence of one or more "modifier genes." Essentially, one gene masks or interferes with the expression of another.
Example: Labrador Retriever Coat Color.
- Gene 1 ($B$): Determines pigment color (Black $B$ vs. Brown $b$).
- Gene 2 ($E$): Determines if pigment is deposited in the hair ($E$ for yes, $e$ for no).
- If a dog has the genotype $ee$, it will be yellow regardless of whether its $B$ alleles are black or brown. The $e$ gene is epistatic to the $B$ gene.
Pleiotropy
Pleiotropy is the phenomenon where a single gene influences multiple, seemingly unrelated phenotypic traits. Most genetic diseases are pleiotropic. For example, Sickle Cell Anemia is caused by a single mutation in the hemoglobin gene, but it results in physical weakness, organ damage, brain damage, and even resistance to malaria.
Common Pitfalls in Genetic Analysis
- Small Sample Size: In human pedigrees, the number of offspring is usually too small to see perfect Mendelian ratios (e.g., a 3:1 ratio). Statistical significance is difficult to achieve without large multi-generational data.
- Lethal Alleles: Some genotypic combinations (usually homozygous dominant or recessive) are lethal in utero. This "removes" a class of offspring from the observed data, shifting the ratios (e.g., a 2:1 ratio instead of 3:1).
- Incomplete Penetrance: An individual may carry the dominant genotype but not express the phenotype due to environmental factors or other modifier genes.
- Variable Expressivity: Individuals with the same genotype may show the trait to different degrees of severity.
Summary of Inheritance Patterns
To conclude, inheritance is a multi-layered system of information transfer. While Mendel provided the "syntax," complex inheritance provides the "context." Understanding the nuances of dominance, sex-linkage, and polygenic interaction is essential for modern genomic medicine, agricultural optimization, and evolutionary biology.
| Pattern | Key Identifier | Molecular Mechanism |
|---|---|---|
| Incomplete Dominance | 1:2:1 Phenotypic Ratio | Enzyme saturation/Dosage |
| Codominance | Both traits expressed | Independent protein production |
| X-Linked Recessive | Male bias in pedigree | Hemizygosity in males |
| Polygenic | Continuous distribution | Additive effect of multiple loci |
| Epistasis | One gene masks another | Pathway-level interference |
| Pleiotropy | One gene, many effects | Protein used in multiple tissues |
Source Materials
Study High School Biology on Lykke
This course page is free to open: signed out, you can read its first two sections, and signing in, on any plan, opens the rest. The free Lykke Chrome extension syncs your own Canvas courses, so ChatGPT, Claude and Muse can answer from your classes and deadlines. It only reads Canvas.
Add the free extensionSign in to open every sectionAll sections of High School Biology · Browse more course pages