Environmental Science (Ha and Schleiger)
Institution: MIT
1 study materials · 4 sections
Environmental Science (Ha and Schleiger) is a comprehensive, interdisciplinary course that examines the complex interactions between the living and non-living components of our planet. Using the scientific method as a foundational framework, the course explores critical topics such as ecology, conservation biology, and the diverse impacts of human activity on natural systems. The ultimate goal of the curriculum is to provide students with the knowledge necessary to evaluate environmental challenges and implement sustainable solutions for the future.
Course Sections
Foundations and the Scientific Method
Key concepts: Scientific Method · Interdisciplinary Study · Sustainability · Environmental Ethics
An introduction to the interdisciplinary nature of environmental science and the application of the scientific method to environmental inquiry.
Foundations and the Scientific Method
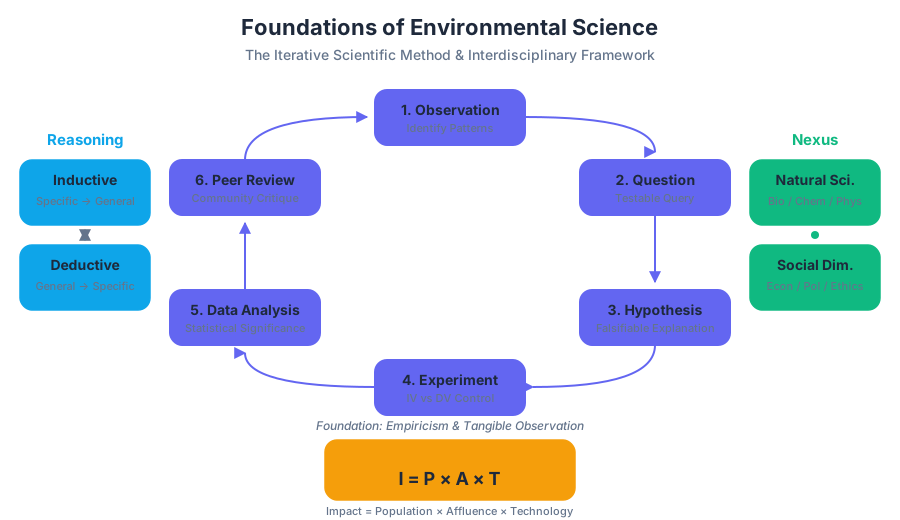
Environmental science is the systematic study of our environment and our proper place in it. Far from being a narrow specialty, it represents a "meta-discipline"—a complex, interdisciplinary nexus where biology, chemistry, physics, and geology intersect with the social, political, and ethical dimensions of human existence. At its core, environmental science seeks to understand the mechanics of the natural world, identify the impacts of human activity, and develop scalable, sustainable solutions for the future.
The Epistemology of Environmental Science
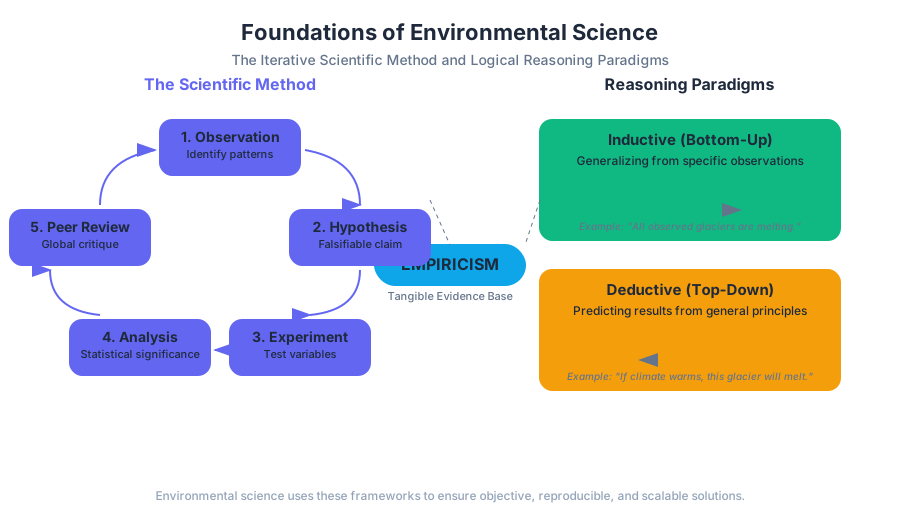
The foundation of environmental science is built upon Empiricism. We rely on the observation of real, tangible phenomena to understand the world. This distinguishes scientific inquiry from other forms of knowledge, such as aesthetics or theology, which may rely on subjective experience or revelation.
The Scientific Method: An Iterative Framework
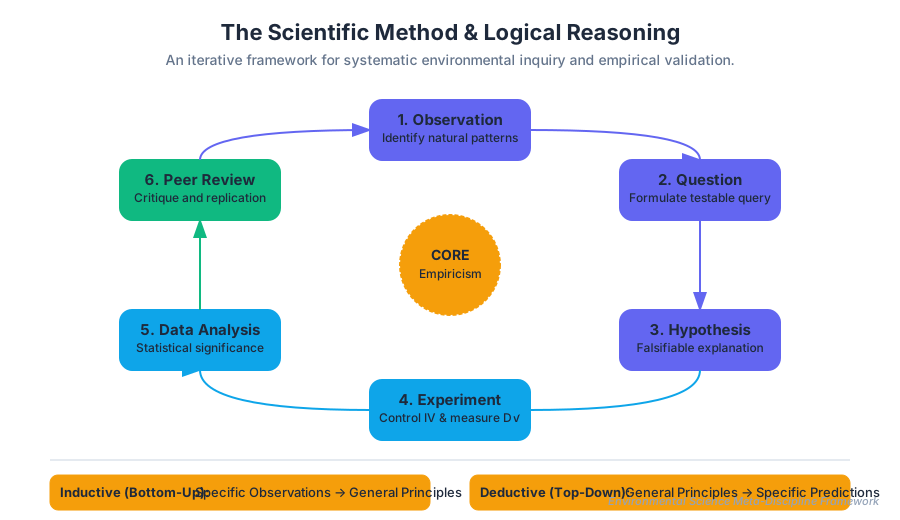
The Scientific Method is the standardized protocol used to minimize bias and maximize the reliability of our findings. It is not a linear checklist but a cyclical process of refinement.
- Observation: Identifying a pattern or a phenomenon in the natural world (e.g., "The population of amphibians in this wetland is declining").
- Question: Formulating a specific, testable query based on the observation.
- Hypothesis: Proposing a tentative explanation. A valid hypothesis must be falsifiable—it must be possible to prove it wrong.
- Experimentation: Designing a controlled test to gather data. This involves identifying the Independent Variable (the factor being manipulated) and the Dependent Variable (the factor being measured).
- Data Analysis: Using statistical tools to determine if the results are significant or merely the result of chance.
- Conclusion and Peer Review: Sharing findings with the global scientific community for rigorous critique and replication.
Definition: The Null Hypothesis ($H_0$) In environmental modeling, the Null Hypothesis typically states that there is no significant relationship between two variables. The goal of the researcher is often to "reject the null" in favor of an Alternative Hypothesis ($H_a$), providing evidence for a specific causal link.
Reasoning Paradigms
Scientists utilize two primary modes of logical reasoning to arrive at conclusions:
| Reasoning Type | Direction | Description | Example |
|---|---|---|---|
| Inductive | Bottom-Up | Generalizing from specific observations to broader principles. | Observing that many specific species of birds migrate south suggests a general rule of avian behavior. |
| Deductive | Top-Down | Applying a general principle to predict specific results. | If climate change causes warming, we predict that glaciers in specific regions will retreat. |
Quantitative Analysis in Environmental Science
To move beyond qualitative observation, environmental scientists utilize computational tools to model ecosystems and analyze data. Below is a Python implementation of a basic statistical analysis often used to determine the impact of a pollutant on a biological indicator.
import numpy as np
from scipy import stats

def analyze_environmental_impact(control_group, treatment_group, alpha=0.05):
    """
    Performs a T-test to determine if a pollutant (treatment)
    has a statistically significant effect on a population metric.
    """
    # Calculate basic descriptive statistics
    mean_ctrl = np.mean(control_group)
    mean_treat = np.mean(treatment_group)

    # Perform Independent Two-Sample T-Test
    t_stat, p_value = stats.ttest_ind(control_group, treatment_group)

    results = {
        "Mean Control": round(mean_ctrl, 3),
        "Mean Treatment": round(mean_treat, 3),
        "T-Statistic": round(t_stat, 3),
        "P-Value": round(p_value, 6),
        "Significant": p_value < alpha
    }

    return results

# Example: Measuring dissolved oxygen (mg/L) in two river segments
upstream_data = [8.2, 8.4, 8.1, 7.9, 8.3, 8.5, 8.0]
downstream_data = [6.1, 5.8, 6.4, 5.9, 6.0, 6.2, 5.7]

impact_report = analyze_environmental_impact(upstream_data, downstream_data)
print(f"Impact Analysis: {impact_report}")
Interdisciplinary Study and the "Wicked Problem"
Environmental science is inherently interdisciplinary. A single problem, such as the acidification of the oceans, cannot be solved by a biologist alone. It requires:
- Chemists to understand the $CO_2$ absorption rates.
- Oceanographers to map current shifts.
- Economists to calculate the impact on the fishing industry.
- Political Scientists to draft international treaties (like the Paris Agreement).
The IPAT Equation
One of the most critical conceptual frameworks for understanding human impact is the IPAT Equation, which quantifies how different factors contribute to environmental degradation.
I = P \times A \times T
Where:
- $I$ = Environmental Impact
- $P$ = Population (The number of people in a given area)
- $A$ = Affluence (The average consumption per person)
- $T$ = Technology (The resource intensity or efficiency of the technology used)
Sustainability: The Operational Goal
Sustainability is the "North Star" of environmental science. It is most famously defined by the Brundtland Commission (1987) as:
"Meeting the needs of the present without compromising the ability of future generations to meet their own needs."
The Triple Bottom Line
Modern sustainability is viewed through the lens of the Triple Bottom Line (TBL). For a solution to be truly sustainable, it must be viable across three distinct dimensions:
| Dimension | Focus | Key Metrics |
|---|---|---|
| Environmental | Planetary Health | Carbon footprint, biodiversity index, waste reduction. |
| Social | Human Equity | Labor rights, community health, environmental justice. |
| Economic | Financial Viability | Profitability, cost-benefit analysis, resource efficiency. |
Resource Management and the Tragedy of the Commons
A central challenge to sustainability is the Tragedy of the Commons, a concept popularized by Garrett Hardin. It describes a situation where individual users, acting independently according to their own self-interest, behave contrary to the common good of all users by depleting a shared resource through their collective action.
Common examples include:
- Overfishing in international waters.
- Atmospheric pollution.
- Groundwater depletion in shared aquifers.
Environmental Ethics and Philosophy
How we treat the environment depends heavily on our underlying ethical framework. Environmental ethics is the branch of philosophy that studies the moral relationship of human beings to the environment.
Major Ethical Frameworks
| Framework | Core Value | Perspective |
|---|---|---|
| Anthropocentrism | Human-centered | Nature is a resource intended for human use. Protection is only necessary if it benefits humans. |
| Biocentrism | Life-centered | All living things have intrinsic value, regardless of their utility to humans. |
| Ecocentrism | Ecosystem-centered | The entire ecosystem (including non-living components like water and soil) has value. The health of the system is paramount. |
The Land Ethic
Aldo Leopold’s "Land Ethic" is a cornerstone of modern ecocentrism. He argued that we should stop viewing land as a commodity and start viewing it as a community to which we belong. This shift from "conqueror" to "plain member and citizen" of the biotic community is a fundamental requirement for long-term sustainability.
Data Management in Environmental Research
Modern environmental science relies on massive datasets generated by sensor networks, satellites, and field observations. Managing this data requires robust database structures.
-- Schema for an Environmental Monitoring Station
CREATE TABLE monitoring_stations (
    station_id INT PRIMARY KEY,
    location_name VARCHAR(100),
    latitude DECIMAL(9,6),
    longitude DECIMAL(9,6),
    elevation_meters INT
);

CREATE TABLE air_quality_readings (
    reading_id SERIAL PRIMARY KEY,
    station_id INT REFERENCES monitoring_stations(station_id),
    timestamp TIMESTAMP DEFAULT CURRENT_TIMESTAMP,
    pm2_5_concentration DECIMAL(5,2), -- Particulate Matter < 2.5um
    no2_ppb INT,                      -- Nitrogen Dioxide in parts per billion
    o3_ppb INT                        -- Ozone in parts per billion
);

-- Query to find stations with high pollution events
SELECT s.location_name, r.timestamp, r.pm2_5_concentration
FROM monitoring_stations s
JOIN air_quality_readings r ON s.station_id = r.station_id
WHERE r.pm2_5_concentration > 35.5 -- EPA 24-hour standard threshold
ORDER BY r.timestamp DESC;
Applied Methodology: Experimental Design
When designing an environmental study, researchers must account for the inherent variability of natural systems.
Key Components of Experimental Design
- Control Group: A baseline group that does not receive the experimental treatment, used for comparison.
- Replication: Performing the experiment multiple times to ensure results aren't a fluke.
- Randomization: Assigning subjects to groups randomly to eliminate selection bias.
- Blind Studies: In some cases, researchers or subjects do not know which group is which to prevent observer bias.
Common Pitfalls in Environmental Science
- Correlation vs. Causation: Just because two variables (e.g., temperature and CO2) rise together doesn't mean one causes the other without a proven mechanism.
- Scale Mismatch: Applying data from a small-scale lab experiment to a global ecosystem without accounting for emergent properties.
- Confirmation Bias: Only seeking out data that supports a pre-existing hypothesis.
Automation and Data Acquisition
In the field, environmental scientists often use shell scripts to automate the retrieval of climate data from global repositories like NOAA or NASA.
#!/bin/bash
# Automating the download of daily climate records for a specific region

STATION_ID="GHCND:USW00094728" # Central Park, NY
START_DATE="2023-01-01"
END_DATE="2023-12-31"
API_TOKEN="your_noaa_token_here"

echo "Initiating data fetch for Station: $STATION_ID..."

curl -H "token:$API_TOKEN" \
     "https://www.ncei.noaa.gov/cdo-web/api/v2/data?datasetid=GHCND&stationid=$STATION_ID&startdate=$START_DATE&enddate=$END_DATE&limit=1000" \
     -o climate_data_2023.json

if [ $? -eq 0 ]; then
    echo "Download successful. File saved as climate_data_2023.json"
else
    echo "Error: Data fetch failed."
    exit 1
fi
Summary of Human-Environment Interaction
The interaction between humans and the environment is a feedback loop. Our activities (agriculture, industry, urbanization) alter the environment, and those alterations (climate change, resource scarcity, pollution) in turn affect human health, economic stability, and social structures.
Environmental science provides the tools to quantify these interactions. By applying the Scientific Method, adhering to Sustainability principles, and navigating the complexities of Environmental Ethics, we can move toward a future where human progress does not come at the expense of the planetary systems that support us.
Ecology and Conservation Biology
Key concepts: Ecology · Biodiversity · Conservation · Ecosystem Dynamics
Explores the interactions within ecosystems and the scientific strategies used to protect biological diversity.
Ecology and Conservation Biology
Overview
Ecology is the rigorous, quantitative study of the interactions between organisms and their environment. It is not merely "nature study" but a branch of biology that integrates physiology, evolution, genetics, and behavior to understand the distribution and abundance of life. Conservation Biology, conversely, is the "crisis discipline" that applies ecological principles to the preservation of biodiversity. It operates at the intersection of science, policy, and ethics, aiming to mitigate the anthropogenic drivers of the "Sixth Mass Extinction."
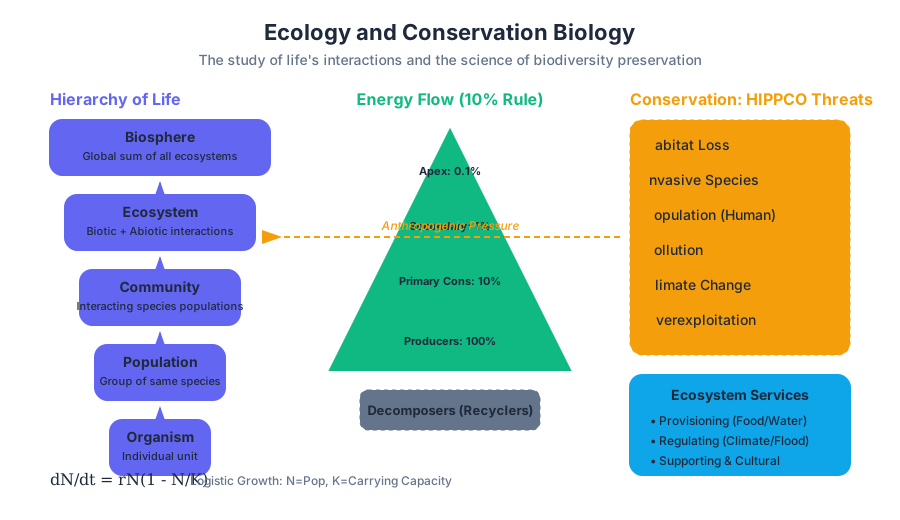
1. Fundamental Ecology: The Hierarchy of Life
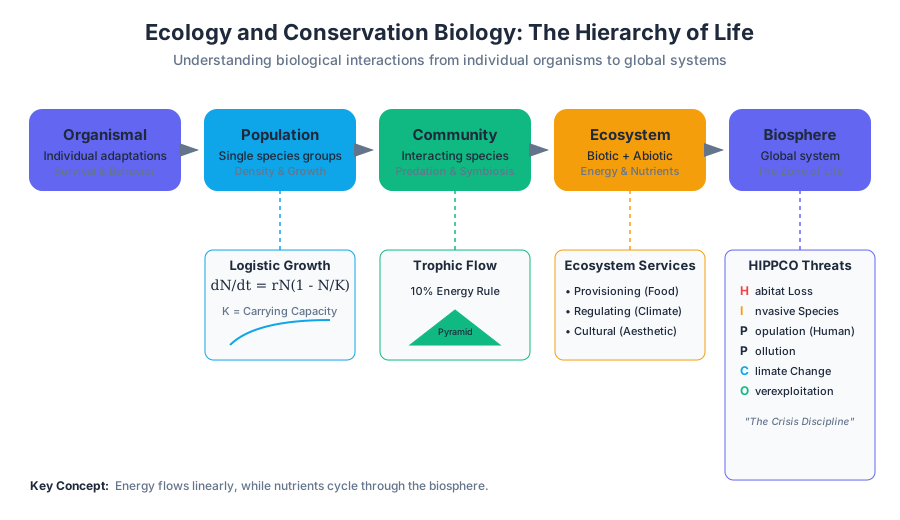
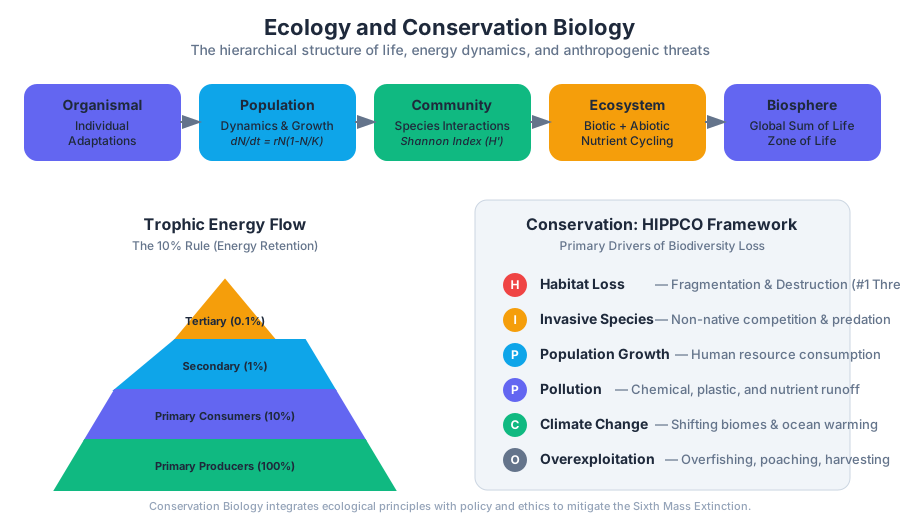
Ecological systems are organized into a nested hierarchy. Understanding these levels is critical for modeling how local changes (e.g., a single species' decline) propagate through a global system.
- Organismal Ecology: Focuses on the morphological, physiological, and behavioral adaptations that allow an individual to survive in a specific habitat.
- Population Ecology: Studies groups of individuals of the same species living in a specific area. Key metrics include density, dispersion, and birth/death rates.
- Community Ecology: Examines the interactions between different species in a shared geographic area, such as predation, competition, and symbiosis.
- Ecosystem Ecology: Integrates the biotic (living) and abiotic (non-living) components. It tracks the flow of energy and the cycling of nutrients (Carbon, Nitrogen, Phosphorus).
- Biosphere: The global sum of all ecosystems; the "zone of life" on Earth.
Trophic Dynamics and Energy Flow
Energy enters most ecosystems via photosynthesis and moves through Trophic Levels. Due to the Second Law of Thermodynamics, energy transfer is inefficient; typically, only about 10% of the energy at one level is passed to the next.
| Trophic Level | Role | Example | Energy Retention |
|---|---|---|---|
| Primary Producers | Autotrophs (Photosynthesis/Chemosynthesis) | Phytoplankton, Grasses | 100% (Baseline) |
| Primary Consumers | Herbivores | Zooplankton, Grasshoppers | ~10% |
| Secondary Consumers | Carnivores (eat herbivores) | Small fish, Birds | ~1% |
| Tertiary Consumers | Apex Predators | Sharks, Lions | ~0.1% |
| Decomposers | Break down organic matter | Fungi, Bacteria | N/A (Recyclers) |
2. Population Dynamics and Modeling
The core of ecology is predicting how populations change over time. Two primary models define this growth: Exponential Growth (unrestricted) and Logistic Growth (restricted by carrying capacity).
The Logistic Growth Equation: $$\frac{dN}{dt} = rN \left(1 - \frac{N}{K}\right)$$ Where $N$ is population size, $r$ is the intrinsic rate of increase, and $K$ is the Carrying Capacity—the maximum population size the environment can sustain indefinitely.
Implementation: Stochastic Population Projection
In real-world scenarios, we use stochastic models to account for environmental "noise" (e.g., a particularly harsh winter or a sudden disease outbreak).
import numpy as np
import matplotlib.pyplot as plt

def simulate_population(n0, r, k, sigma, generations):
    """
    Simulates population growth with environmental stochasticity.
    n0: Initial population
    r: Growth rate
    k: Carrying capacity
    sigma: Standard deviation of environmental noise
    """
    n = np.zeros(generations)
    n[0] = n0

    for t in range(1, generations):
        # Logistic growth + Gaussian noise
        noise = np.random.normal(0, sigma)
        growth = r * n[t-1] * (1 - n[t-1] / k)
        n[t] = max(0, n[t-1] + growth + (n[t-1] * noise))

    return n

# Parameters: 100 initial individuals, 10% growth, 1000 capacity
pop_history = simulate_population(n0=100, r=0.1, k=1000, sigma=0.05, generations=200)

plt.plot(pop_history)
plt.title("Stochastic Logistic Growth Model")
plt.xlabel("Generations")
plt.ylabel("Population (N)")
plt.show()
3. Biodiversity: Metrics and Value
Biodiversity is the variety of life across three main scales: Genetic Diversity (variation within a species), Species Diversity (number and evenness of species), and Ecosystem Diversity (variety of habitats).
Measuring Biodiversity
To quantify biodiversity, ecologists use indices that account for both Richness (the number of species) and Evenness (how close in numbers each species in an environment is).
\text{Shannon-Wiener Index (H')} = -\sum_{i=1}^{S} p_i \ln(p_i)
- $S$: Total number of species.
- $p_i$: Proportion of individuals belonging to the $i$-th species.
Ecosystem Services
Biodiversity is not just a moral concern; it provides "services" that are economically and biologically vital to human survival.
| Service Category | Description | Examples |
|---|---|---|
| Provisioning | Physical products obtained from ecosystems. | Food, timber, medicinal plants, fresh water. |
| Regulating | Benefits obtained from the regulation of ecosystem processes. | Climate regulation, flood control, water purification. |
| Supporting | Services necessary for the production of all other services. | Nutrient cycling, soil formation, primary production. |
| Cultural | Non-material benefits people obtain from ecosystems. | Aesthetic inspiration, recreation, spiritual value. |
4. Conservation Biology: The Science of Preservation
Conservation biology focuses on identifying and mitigating threats to biodiversity. The primary framework for understanding these threats is the HIPPCO acronym:
- Habitat Loss (The #1 threat)
- Invasive Species
- Population Growth (Human)
- Pollution
- Climate Change
- Overexploitation (Overfishing, poaching)
Island Biogeography and Habitat Fragmentation
The Theory of Island Biogeography (MacArthur and Wilson) is a cornerstone of conservation. It posits that the number of species on an "island" (which can be a literal island or a fragment of forest) is determined by a balance between immigration and extinction.
- Size Effect: Larger islands have lower extinction rates.
- Distance Effect: Islands closer to the mainland have higher immigration rates.
This theory informs the design of Protected Areas. Conservationists debate the SLOSS (Single Large Or Several Small) strategy, though current consensus favors "Single Large" connected by Wildlife Corridors to maintain gene flow.
Data Modeling for Conservation
Conservationists use relational databases to track species sightings, habitat health, and legislative status.
-- Schema for a Biodiversity Monitoring System
CREATE TABLE species (
    species_id INT PRIMARY KEY,
    scientific_name VARCHAR(255) UNIQUE,
    common_name VARCHAR(255),
    iucn_status ENUM('LC', 'NT', 'VU', 'EN', 'CR', 'EW', 'EX'),
    last_assessed DATE
);

CREATE TABLE observations (
    obs_id SERIAL PRIMARY KEY,
    species_id INT REFERENCES species(species_id),
    latitude DECIMAL(9,6),
    longitude DECIMAL(9,6),
    observation_date TIMESTAMP,
    observer_id INT,
    population_estimate INT
);

-- Query to find Critically Endangered species in a specific bounding box
SELECT s.common_name, o.latitude, o.longitude
FROM species s
JOIN observations o ON s.species_id = o.species_id
WHERE s.iucn_status = 'CR'
AND o.latitude BETWEEN 34.0 AND 35.0
AND o.longitude BETWEEN -118.0 AND -117.0;
5. Advanced Concepts: Resilience and Alternative Stable States
Ecosystems are not static; they are dynamic systems that can exist in different "states." Resilience is the capacity of an ecosystem to absorb disturbance and reorganize while undergoing change so as to still retain essentially the same function, structure, and identity.
Tipping Points
When an ecosystem is pushed beyond a certain threshold, it may undergo a Regime Shift to an alternative stable state. For example, a clear-water lake (State A) might suddenly flip to a turbid, algae-dominated state (State B) due to nutrient runoff (eutrophication). Reversing this shift is often much harder than preventing it—a phenomenon known as Hysteresis.
Performance-Critical Simulation: Spatial Modeling
To model how a disturbance (like a fire or an invasive species) spreads across a landscape, we use spatial grid simulations. For high-performance ecological modeling, low-level languages like Rust are used to handle millions of cell updates per second.
// A simplified Cellular Automata for Forest Fire Spread
struct Cell {
    state: State,
}

enum State {
    Empty,
    Tree,
    Burning,
}

fn update_grid(grid: &Vec<Vec<Cell>>) -> Vec<Vec<Cell>> {
    let mut next_grid = grid.clone();
    for r in 1..grid.len() - 1 {
        for c in 1..grid[0].len() - 1 {
            match grid[r][c].state {
                State::Burning => next_grid[r][c].state = State::Empty,
                State::Tree => {
                    // If any neighbor is burning, this tree catches fire
                    if has_burning_neighbor(grid, r, c) {
                        next_grid[r][c].state = State::Burning;
                    }
                }
                _ => {}
            }
        }
    }
    next_grid
}
6. Common Pitfalls and Misconceptions
- The "Balance of Nature" Myth: Many believe ecosystems exist in a permanent, static "balance." In reality, ecosystems are in constant flux, driven by disturbances (fires, storms, seasonal changes). Conservation aims to preserve the processes of change, not a frozen snapshot in time.
- Misunderstanding "Survival of the Fittest": In ecology, "fitness" is strictly about reproductive success, not physical strength. A small, drab bird that produces 10 surviving offspring is more "fit" than a large, strong bird that produces none.
- The "Single Species" Trap: Focusing exclusively on a "charismatic megafauna" (like pandas) can lead to neglecting the less visible species (fungi, insects, soil microbes) that actually provide the foundation for the ecosystem.
7. Global Conservation Frameworks
International cooperation is essential because ecosystems do not respect political borders.
| Agreement | Focus | Mechanism |
|---|---|---|
| CITES | Illegal Wildlife Trade | Regulates/bans international trade of endangered species (e.g., ivory). |
| IUCN Red List | Species Status | Provides the world's most comprehensive inventory of conservation status. |
| CBD | Biodiversity Strategy | A global treaty for the conservation and sustainable use of biological diversity. |
| Paris Agreement | Climate Change | Indirectly protects biodiversity by limiting global temperature rise. |
Human Impacts and Environmental Health
Key concepts: Environmental Impacts · Pollution · Human Population · Toxicology
A deep dive into how human population growth, industrialization, and pollution affect the global environment.
Human Impacts and Environmental Health
Overview
Humanity has entered the Anthropocene, a proposed geological epoch defined by the significant global impact of human activities on Earth's ecosystems. Unlike previous eras where change was driven by orbital mechanics or volcanic activity, the current shift is driven by the rapid expansion of the Human Population, the industrialization of resource extraction, and the resulting discharge of synthetic compounds into the biosphere.
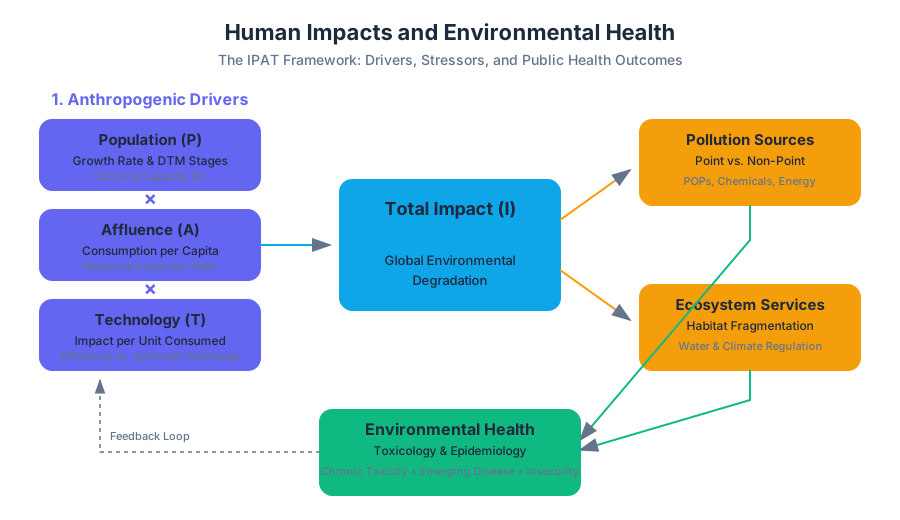
The study of human impacts and environmental health is an interdisciplinary synthesis of Ecology, Toxicology, and Epidemiology. It seeks to quantify how anthropogenic stressors—ranging from chemical pollutants to habitat fragmentation—alter the chemical and biological integrity of the environment and, by extension, human physiological well-being. This relationship is not unidirectional; as we degrade the ecosystem services (such as water purification and climate regulation) upon which we depend, we introduce new risks to public health, including chronic toxicity, emerging infectious diseases, and nutritional insecurity.
Human Population Dynamics
The fundamental driver of environmental impact is the scale and rate of human population growth. For most of human history, the population grew at a negligible rate, constrained by high infant mortality and limited food production. However, the Industrial and Green Revolutions triggered an exponential growth phase, characterized by a constant percentage increase over time.
The Demographic Transition Model (DTM)
The Demographic Transition Model (DTM) describes the historical shift from high birth and death rates to low birth and death rates as a country develops from a pre-industrial to an industrialized economic system.
| Stage | Description | Birth Rate | Death Rate | Population Growth |
|---|---|---|---|---|
| Stage 1: Pre-Industrial | Minimal technology; high disease burden. | High | High | Stable/Slow |
| Stage 2: Transitional | Improved sanitation and food supply. | High | Falling Rapidly | Rapid Increase |
| Stage 3: Industrial | Urbanization; increased education/contraception. | Falling | Falling Slowly | Slowing Increase |
| Stage 4: Post-Industrial | High standard of living; female empowerment. | Low | Low | Stable/Zero Growth |
| Stage 5: Declining | Aging population; sub-replacement fertility. | Very Low | Low | Slow Decrease |
Carrying Capacity and the Verhulst Equation
In ecology, the Carrying Capacity ($K$) is the maximum population size of a species that an environment can sustain indefinitely. While some argue that human ingenuity (technology) can infinitely expand $K$, others point to the finite nature of planetary boundaries.
The following Python implementation simulates human population growth using the Logistic Growth (Verhulst) Model, incorporating a dynamic carrying capacity that degrades as the population exceeds certain resource thresholds.
import numpy as np
import matplotlib.pyplot as plt

def simulate_population(years, initial_pop, r, initial_k, degradation_rate):
    """
    Simulates population growth with a degrading carrying capacity.
    r: Intrinsic growth rate
    initial_k: Starting carrying capacity
    degradation_rate: How much K drops per unit of population over K
    """
    pop = np.zeros(years)
    k_val = np.zeros(years)
    pop[0] = initial_pop
    k_val[0] = initial_k

    for t in range(1, years):
        # Calculate growth using the Verhulst Equation: dP/dt = rP(1 - P/K)
        growth = r * pop[t-1] * (1 - (pop[t-1] / k_val[t-1]))
        pop[t] = pop[t-1] + growth

        # Dynamic K: If population > 80% of K, K begins to degrade due to resource stress
        if pop[t] > 0.8 * k_val[t-1]:
            k_val[t] = k_val[t-1] - (degradation_rate * (pop[t] / k_val[t-1]))
        else:
            k_val[t] = k_val[t-1]

    return pop, k_val

# Parameters: 100 years, start at 2B, 2% growth, 10B capacity
years = 100
p_series, k_series = simulate_population(years, 2.0, 0.05, 10.0, 0.05)

print(f"Final Population: {p_series[-1]:.2f}B")
print(f"Final Carrying Capacity: {k_series[-1]:.2f}B")
Quantifying Impact: The IPAT Equation
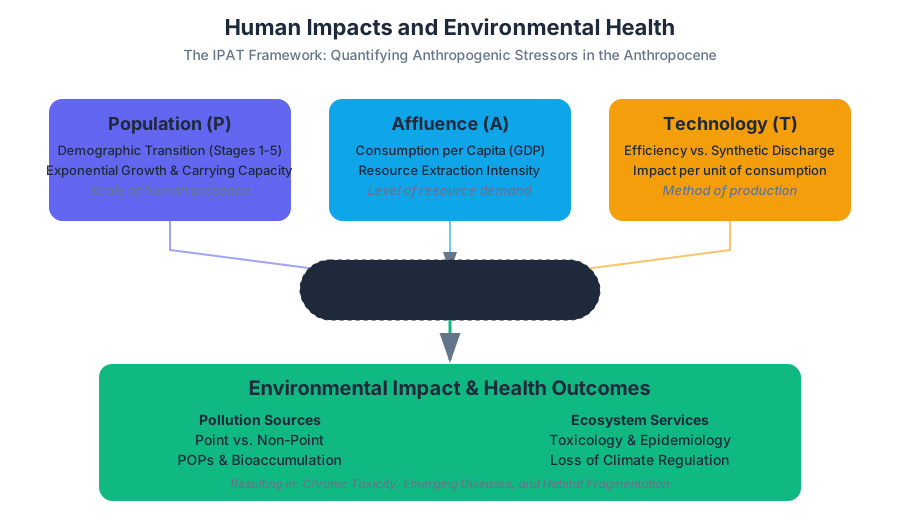
To move beyond simple headcounts, environmental scientists use the IPAT Equation to conceptualize how different factors contribute to environmental degradation.
The IPAT Equation: $I = P \times A \times T$
Where:
- $I$ (Impact): The total environmental degradation (e.g., CO2 emissions, tons of waste).
- $P$ (Population): The number of people in a given area.
- $A$ (Affluence): The average consumption per person (often measured as GDP per capita).
- $T$ (Technology): The impact per unit of consumption (can be negative if technology increases efficiency, or positive if it introduces new pollutants).
Variations of IPAT
A modern variation is the STIRPAT model (Stochastic Impacts by Regression on Population, Affluence, and Technology), which allows for statistical testing of the relative weights of each factor.
Environmental Pollution
Pollution is the introduction of contaminants into the natural environment that cause adverse change. These contaminants can be chemical substances or energy, such as noise, heat, or light.
Classification by Source
- Point Source: Pollution originating from a single, identifiable location (e.g., a factory discharge pipe or a leaking underground storage tank).
- Non-point Source: Diffuse pollution that does not have a single point of origin (e.g., agricultural runoff carrying fertilizers and pesticides from thousands of acres into a river system).
Major Pollutant Categories
| Category | Examples | Primary Environmental Impact |
|---|---|---|
| Persistent Organic Pollutants (POPs) | DDT, PCBs, Dioxins | Bioaccumulation; endocrine disruption. |
| Heavy Metals | Lead (Pb), Mercury (Hg), Cadmium (Cd) | Neurotoxicity; kidney damage; soil sterility. |
| Nutrients | Nitrates ($NO_3^-$), Phosphates ($PO_4^{3-}$) | Eutrophication: Algal blooms leading to "dead zones" (hypoxia). |
| Particulate Matter (PM) | $PM_{2.5}$, $PM_{10}$ | Respiratory disease; reduced visibility; climate forcing. |
| Xenobiotics | Microplastics, Pharmaceuticals | Disruption of microbial communities; reproductive failure in wildlife. |
Toxicology: The Science of Poisons
Toxicology is the study of the adverse effects of chemical, physical, or biological agents on living organisms and the ecosystem. In the context of environmental health, we focus on Ecotoxicology, which examines the impact of toxins at the population and ecosystem levels.
Dose-Response Relationships
The core tenet of toxicology, established by Paracelsus, is that "the dose makes the poison." Scientists use Dose-Response Curves to determine the potency of a substance.
- $LD_{50}$ (Lethal Dose 50%): The dose of a substance required to kill 50% of a test population.
- $ED_{50}$ (Effective Dose 50%): The dose that produces a specific biological effect in 50% of the population.
- Threshold Dose: The maximum dose that has no observable adverse effect (NOAEL).
The Hill Equation is often used to model the sigmoidal shape of these curves:
f(D) = \frac{E_{max} \cdot D^n}{ED_{50}^n + D^n}
Where $D$ is the dose, $E_{max}$ is the maximum response, and $n$ is the Hill coefficient (steepness).
Bioaccumulation and Biomagnification
One of the most dangerous aspects of environmental toxins is their ability to concentrate as they move through the food web.
- Bioaccumulation: The increase in concentration of a substance in a single organism over time (e.g., a fish absorbing mercury from water faster than it can excrete it).
- Biomagnification: The increase in concentration of a substance as it moves up the trophic levels (e.g., an osprey having much higher DDT levels than the fish it eats).
Environmental Health and Risk Assessment
Environmental health focuses on identifying and mitigating Environmental Hazards, which are categorized into four types:
- Physical: Natural disasters, UV radiation, noise.
- Chemical: Synthetic chemicals, lead, asbestos.
- Biological: Pathogens (viruses, bacteria, parasites).
- Cultural/Lifestyle: Smoking, diet, poverty-related lack of sanitation.
The Risk Assessment Pipeline
To manage these hazards, regulatory agencies (like the EPA or WHO) follow a structured Risk Assessment process:
- Hazard Identification: Determining if a substance causes adverse health effects.
- Dose-Response Assessment: Quantifying the relationship between dose and effect.
- Exposure Assessment: Estimating how often and how much of the substance people are in contact with.
- Risk Characterization: Combining the previous steps to estimate the probability of harm to the population.
Querying Toxicological Data
Professionals often interact with databases like the TOXNET or IRIS (Integrated Risk Information System). Below is a conceptual SQL query that a researcher might use to identify high-risk chemicals within a specific industrial zone.
-- Identify chemicals in the 'Water_Monitoring' table
-- that exceed the Reference Dose (RfD) for chronic oral exposure.

SELECT
    m.chemical_name,
    m.concentration_mg_L,
    t.reference_dose_mg_kg_day,
    (m.concentration_mg_L * 2 / 70) AS estimated_daily_intake -- Assumes 2L water/70kg adult
FROM
    water_quality_monitoring m
JOIN
    toxicology_standards t ON m.chemical_id = t.chemical_id
WHERE
    (m.concentration_mg_L * 2 / 70) > t.reference_dose_mg_kg_day
ORDER BY
    estimated_daily_intake DESC;
Common Pitfalls and Misconceptions
- Correlation vs. Causation in Epidemiology: Just because a disease cluster exists near a factory does not prove the factory caused it. Researchers must control for confounding variables (e.g., smoking, age, socioeconomic status).
- The "Natural is Safe" Fallacy: Many of the most potent toxins are natural (e.g., botulinum toxin, arsenic, aflatoxins). "Synthetic" does not automatically mean "more dangerous."
- Synergistic Effects: Most toxicological tests involve a single chemical. In the real world, humans are exposed to a "chemical soup." Synergism occurs when the combined effect of two chemicals is greater than the sum of their individual effects (e.g., asbestos exposure and smoking exponentially increasing lung cancer risk).
Synthesis: Sustainability and the Scientific Method
Addressing human impacts requires the rigorous application of the Scientific Method. We observe environmental degradation, form hypotheses about the causative agents (e.g., "Is $PM_{2.5}$ causing the observed increase in asthma?"), conduct controlled experiments or longitudinal cohort studies, and refine our models.
Sustainability is the ultimate goal: meeting the needs of the present without compromising the ability of future generations to meet their own needs. This requires a transition from a Linear Economy (Take -> Make -> Waste) to a Circular Economy, where waste is treated as a resource and human impacts are kept within the regenerative capacity of the Earth.
References & Further Reading
- Ha, M., & Schleiger, R. (2023). Environmental Science.
- Millennium Ecosystem Assessment (2005). Ecosystems and Human Well-being.
- Casarett & Doull's Toxicology: The Basic Science of Poisons.
- Rockström, J., et al. (2009). Planetary Boundaries: Exploring the Safe Operating Space for Humanity.
Energy Resources and Sustainable Futures
Key concepts: Renewable Energy · Non-renewable Energy · Sustainability · Resource Management
Evaluates current energy systems and the transition toward renewable resources and sustainable management.
Energy Resources and Sustainable Futures
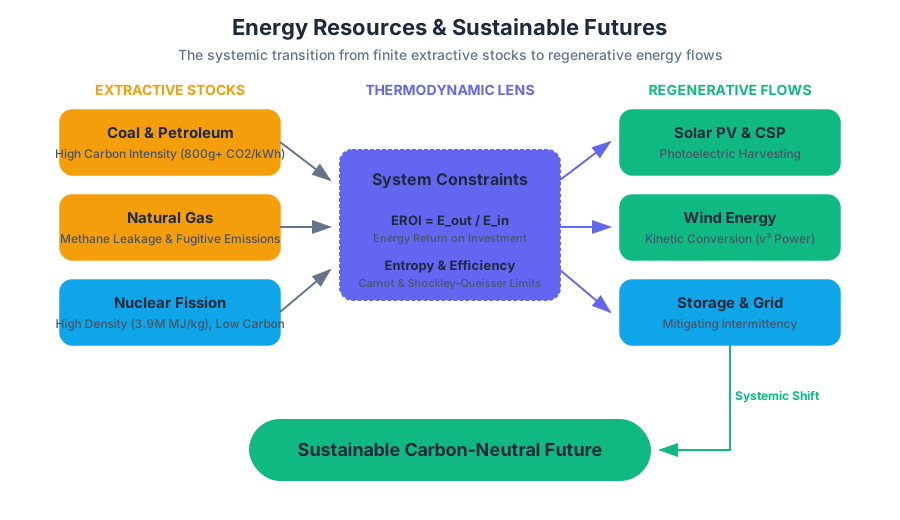
Energy is the fundamental currency of the universe. In the context of human civilization, it is the primary driver of economic development, technological progress, and social well-being. However, the methods by which we extract, transform, and consume energy are inextricably linked to the health of our planet. This section explores the transition from a high-carbon, extractive energy model to a sustainable, regenerative framework. We will examine the technical mechanics of energy sources, the thermodynamic constraints of resource management, and the systemic shifts required for a carbon-neutral future.
The Thermodynamics of Energy Systems
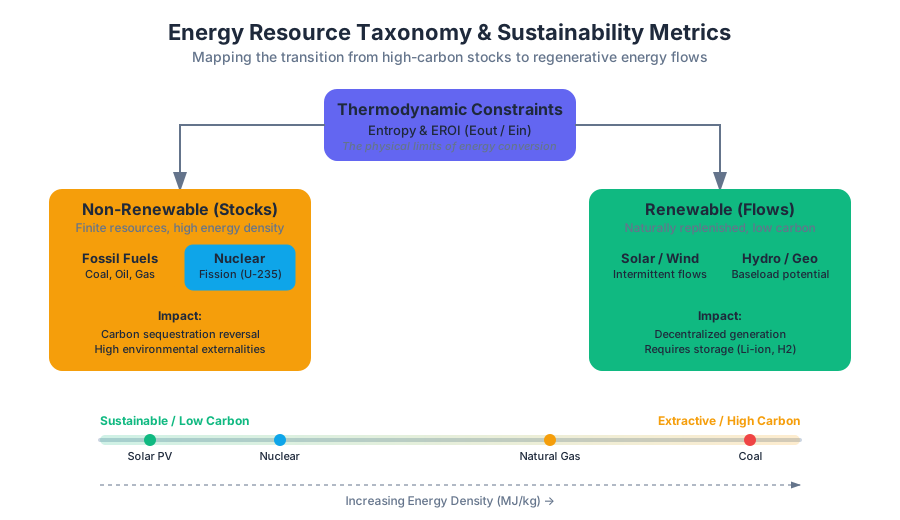
To understand energy resources, one must first understand the laws that govern them. Energy is never "created" or "destroyed" (First Law of Thermodynamics), but in every transformation, some energy is degraded into a less useful form, typically low-grade heat (Second Law of Thermodynamics).
The Entropy Constraint: In any energy conversion system, the total entropy of an isolated system can never decrease over time. For energy resource management, this means that "100% efficiency" is physically impossible, and every energy source has a theoretical maximum efficiency (e.g., the Carnot Limit for heat engines or the Shockley-Queisser Limit for solar cells).
The viability of an energy resource is often measured by its Energy Return on Investment (EROI). This is the ratio of the amount of usable energy delivered from a particular energy resource to the amount of energy used to obtain that energy resource.
$$EROI = \frac{E_{out}}{E_{in}}$$
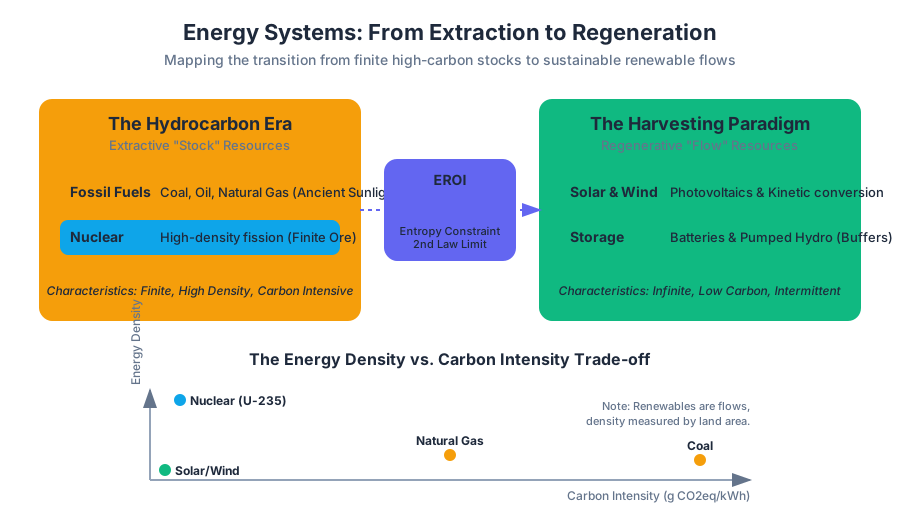
Comparison of Energy Density and Carbon Intensity
| Fuel Source | Energy Density (MJ/kg) | Carbon Intensity (g CO2eq/kWh) | Primary Use Case |
|---|---|---|---|
| Coal (Anthracite) | 24–35 | 820–1000 | Electricity Generation |
| Crude Oil | 42–47 | 650–900 | Transportation, Petrochemicals |
| Natural Gas | 50–55 | 400–500 | Heating, Peak Electricity |
| Uranium-235 | 3,900,000 | 12–110 | Baseload Electricity |
| Lithium-ion Battery | 0.5–0.9 | N/A (Storage) | Mobile Electronics, EVs |
Non-renewable Energy: The Hydrocarbon Era
Non-renewable energy refers to resources that exist in finite amounts and are consumed much faster than they are replenished by natural processes. These primarily include fossil fuels—coal, oil, and natural gas—and nuclear fuels.
Fossil Fuels and the Carbon Cycle
Fossil fuels are essentially "ancient sunlight" stored in the form of chemical bonds within organic matter that has undergone high pressure and temperature over millions of years. When we burn these fuels, we are re-introducing carbon into the atmosphere that was sequestered during the Carboniferous period, leading to a rapid increase in atmospheric $CO_2$.
- Coal: Formed from terrestrial plant matter in anaerobic swamp conditions. It is the most carbon-intensive fuel and a major source of sulfur dioxide ($SO_2$) and mercury.
- Petroleum (Oil): Derived from marine microorganisms. Its versatility in liquid form makes it the backbone of global logistics.
- Natural Gas: Primarily methane ($CH_4$). While it burns cleaner than coal, methane leakage during extraction (fugitive emissions) is a potent driver of short-term global warming.
Nuclear Energy: The High-Density Outlier
Nuclear energy occupies a unique space. It is non-renewable (based on finite uranium ore) but produces virtually no greenhouse gases during operation. It relies on Nuclear Fission, where the nucleus of a heavy atom (like U-235) is split into smaller nuclei, releasing a massive amount of binding energy.
# Python: A simplified model to calculate the Carbon Footprint
# of a power plant based on its thermal efficiency and fuel type.

def calculate_emissions(power_output_mw, efficiency, fuel_type):
    """
    Calculates CO2 emissions in kg per hour.
    :param power_output_mw: Output in Megawatts
    :param efficiency: Thermal efficiency (0.0 to 1.0)
    :param fuel_type: 'coal', 'gas', or 'nuclear'
    """
    # Emission factors in kg CO2 per GJ of fuel energy
    emission_factors = {
        'coal': 94.6,
        'gas': 56.1,
        'nuclear': 0.0
    }

    if fuel_type not in emission_factors:
        raise ValueError("Unknown fuel type")

    # Convert MW to GJ/hr: 1 MW = 3.6 GJ/hr
    energy_out_gj = power_output_mw * 3.6

    # Calculate energy input required based on efficiency
    energy_in_gj = energy_out_gj / efficiency

    # Calculate total emissions
    total_emissions = energy_in_gj * emission_factors[fuel_type]

    return {
        "fuel_input_gj_hr": energy_in_gj,
        "co2_kg_hr": total_emissions
    }

# Example: 500MW Coal Plant at 35% efficiency
print(calculate_emissions(500, 0.35, 'coal'))
Renewable Energy: The Harvesting Paradigm
Renewable energy is derived from natural processes that are replenished at a rate equal to or faster than the rate at which they are consumed. Unlike fossil fuels, which are "stocks" of energy, renewables are "flows."
Solar Energy
Solar power utilizes the Photoelectric Effect to convert photons directly into electrons (Photovoltaics, PV) or uses mirrors to concentrate thermal energy (Concentrated Solar Power, CSP).
- Photovoltaics (PV): Semiconductor materials (usually Silicon) create a p-n junction that generates direct current (DC) when exposed to light.
- Capacity Factor: Solar typically has a lower capacity factor (15-25%) because it is diurnal and weather-dependent.
Wind Energy
Wind turbines convert the kinetic energy of moving air into mechanical energy, then electricity. The power available in the wind is proportional to the cube of the wind speed ($v^3$).
Betz's Law: No turbine can capture more than 59.3% of the kinetic energy in wind. This is the theoretical maximum efficiency for a wind turbine.
P_{wind} = \frac{1}{2} \rho A v^3 C_p
Where:
- $P$ = Power (Watts)
- $\rho$ = Air density ($kg/m^3$)
- $A$ = Swept area of blades ($m^2$)
- $v$ = Wind velocity ($m/s$)
- $C_p$ = Power coefficient (Max 0.593)
Hydroelectric and Geothermal
- Hydroelectric: Uses the gravitational potential energy of water. It is highly efficient and provides dispatchable power (can be turned on/off quickly), but it faces geographical limits and ecological impacts on river systems.
- Geothermal: Taps into the internal heat of the Earth. It provides reliable baseload power but is restricted to tectonically active regions.
Comparison of Renewable Technologies
| Technology | LCOE ($/MWh) | Land Use (m²/MWh) | Dispatchability | Scalability |
|---|---|---|---|---|
| Utility Solar PV | $30 - $45 | High | Low (Intermittent) | Very High |
| Onshore Wind | $25 - $50 | Medium | Low (Intermittent) | High |
| Geothermal | $60 - $100 | Low | High (Baseload) | Low (Site specific) |
| Hydropower | $40 - $80 | Very High | High (Storage) | Medium |
Sustainability and Resource Management
Sustainability is the practice of meeting the needs of the present without compromising the ability of future generations to meet their own needs. In energy, this requires a transition from a linear "take-make-waste" model to a Circular Economy.
The Triple Bottom Line
Sustainable resource management evaluates decisions based on three pillars:
- Environmental: Minimizing ecological footprint and carbon emissions.
- Social: Ensuring energy justice, public health, and equitable access.
- Economic: Ensuring long-term financial viability and internalizing "externalities" (like the cost of pollution).
Critical Minerals and the Green Transition
The shift to renewables is a shift from a fuel-intensive system to a material-intensive system. Building wind turbines, solar panels, and EV batteries requires significant amounts of "critical minerals."
| Mineral | Primary Use | Sustainability Concern |
|---|---|---|
| Lithium | Battery Anodes | Water scarcity in extraction regions (e.g., Chile) |
| Cobalt | Battery Cathodes | Human rights and ethical mining (e.g., DRC) |
| Copper | Wiring/Grid | Massive volume required for electrification |
| Neodymium | Wind Turbine Magnets | High environmental cost of Rare Earth processing |
Resource Management Strategies
- Decoupling: Increasing economic output while decreasing environmental impact.
- Life Cycle Assessment (LCA): Evaluating the environmental impact of a product from "cradle to grave" (extraction to disposal).
- Demand-Side Management (DSM): Using technology to shift consumer energy use to off-peak hours or reduce overall consumption.
# YAML: Configuration for a Smart Grid / Home Energy Management System
# This defines how a sustainable home prioritizes energy sources.

system_id: "eco_smart_001"
priorities:
  - source: "solar_pv"
    action: "consume_directly"
  - source: "battery_storage"
    condition: "solar_output < house_load"
  - source: "grid_renewable"
    condition: "battery_soc < 20%"
  - source: "grid_standard"
    condition: "emergency_only"

load_shedding:
  - device: "ev_charger"
    priority: 3
    threshold_soc: 15
  - device: "hvac_system"
    priority: 2
    eco_mode_temp_delta: 3
  - device: "refrigerator"
    priority: 1 # Never shed
Challenges in the Energy Transition
Intermittency and the "Duck Curve"
Solar and wind are intermittent. The Duck Curve is a graph of net load (total demand minus solar/wind generation) that shows a drastic drop in midday demand followed by a sharp ramp-up at sunset. Solving this requires:
- Energy Storage: Batteries, Pumped Hydro, or Green Hydrogen.
- Grid Modernization: Smart grids that can balance supply and demand in real-time.
- Interconnection: High-voltage DC (HVDC) lines to move power from windy/sunny areas to load centers.
Common Pitfalls and Misconceptions
- The "Natural Gas as a Bridge" Fallacy: While gas emits less $CO_2$ than coal, the methane leaks and the "lock-in" of fossil fuel infrastructure can delay the transition to true zero-carbon sources.
- Nuclear Waste: While the volume of high-level nuclear waste is small, the political and long-term storage challenges remain significant.
- Energy Efficiency Paradox (Jevons Paradox): Increases in efficiency often lead to lower costs, which can paradoxically increase total consumption.
Implementation: Modeling and Data
Managing a sustainable future requires rigorous data tracking. We must monitor resource depletion rates, carbon intensity, and recycling efficiency.
-- SQL: Schema for a Resource Management Database
-- Tracks the extraction, use, and recycling of critical minerals.

CREATE TABLE resources (
    resource_id INT PRIMARY KEY,
    name VARCHAR(50),
    total_estimated_reserve FLOAT, -- in metric tons
    current_extraction_rate FLOAT, -- tons per year
    recycling_rate_pct FLOAT       -- percentage
);

CREATE TABLE energy_mix (
    year INT,
    country_code CHAR(3),
    source_type VARCHAR(20),
    generation_twh FLOAT,
    carbon_intensity_g_kwh FLOAT
);

-- Query to find resources at risk of depletion within 50 years
SELECT name,
       (total_estimated_reserve / current_extraction_rate) AS years_remaining
FROM resources
WHERE (total_estimated_reserve / current_extraction_rate) < 50;
Summary of Strategies for a Sustainable Future
- Electrify Everything: Transition transportation and heating from combustion to electricity.
- Decarbonize the Grid: Replace fossil fuel plants with a mix of wind, solar, nuclear, and storage.
- Circular Material Flows: Design products for modularity and 100% recyclability to reduce mining pressure.
- Policy and Carbon Pricing: Internalize the cost of carbon through taxes or cap-and-trade systems to incentivize clean investment.
Source Materials
Study Environmental Science (Ha and Schleiger) with AI — Free on Lykke
Sign up for free to generate personalized flashcards, quizzes, and study guides from this course. Chat with an AI tutor that knows the material.
Get Started FreeView this course wiki on Lykke · Browse all public course wikis