From the free course Computing on Lykke
Debugging Strategies
Key concepts: Syntax errors · Runtime errors · Logic errors · Program tracing
Identifying and fixing different types of errors that occur during the programming process.
Debugging Strategies
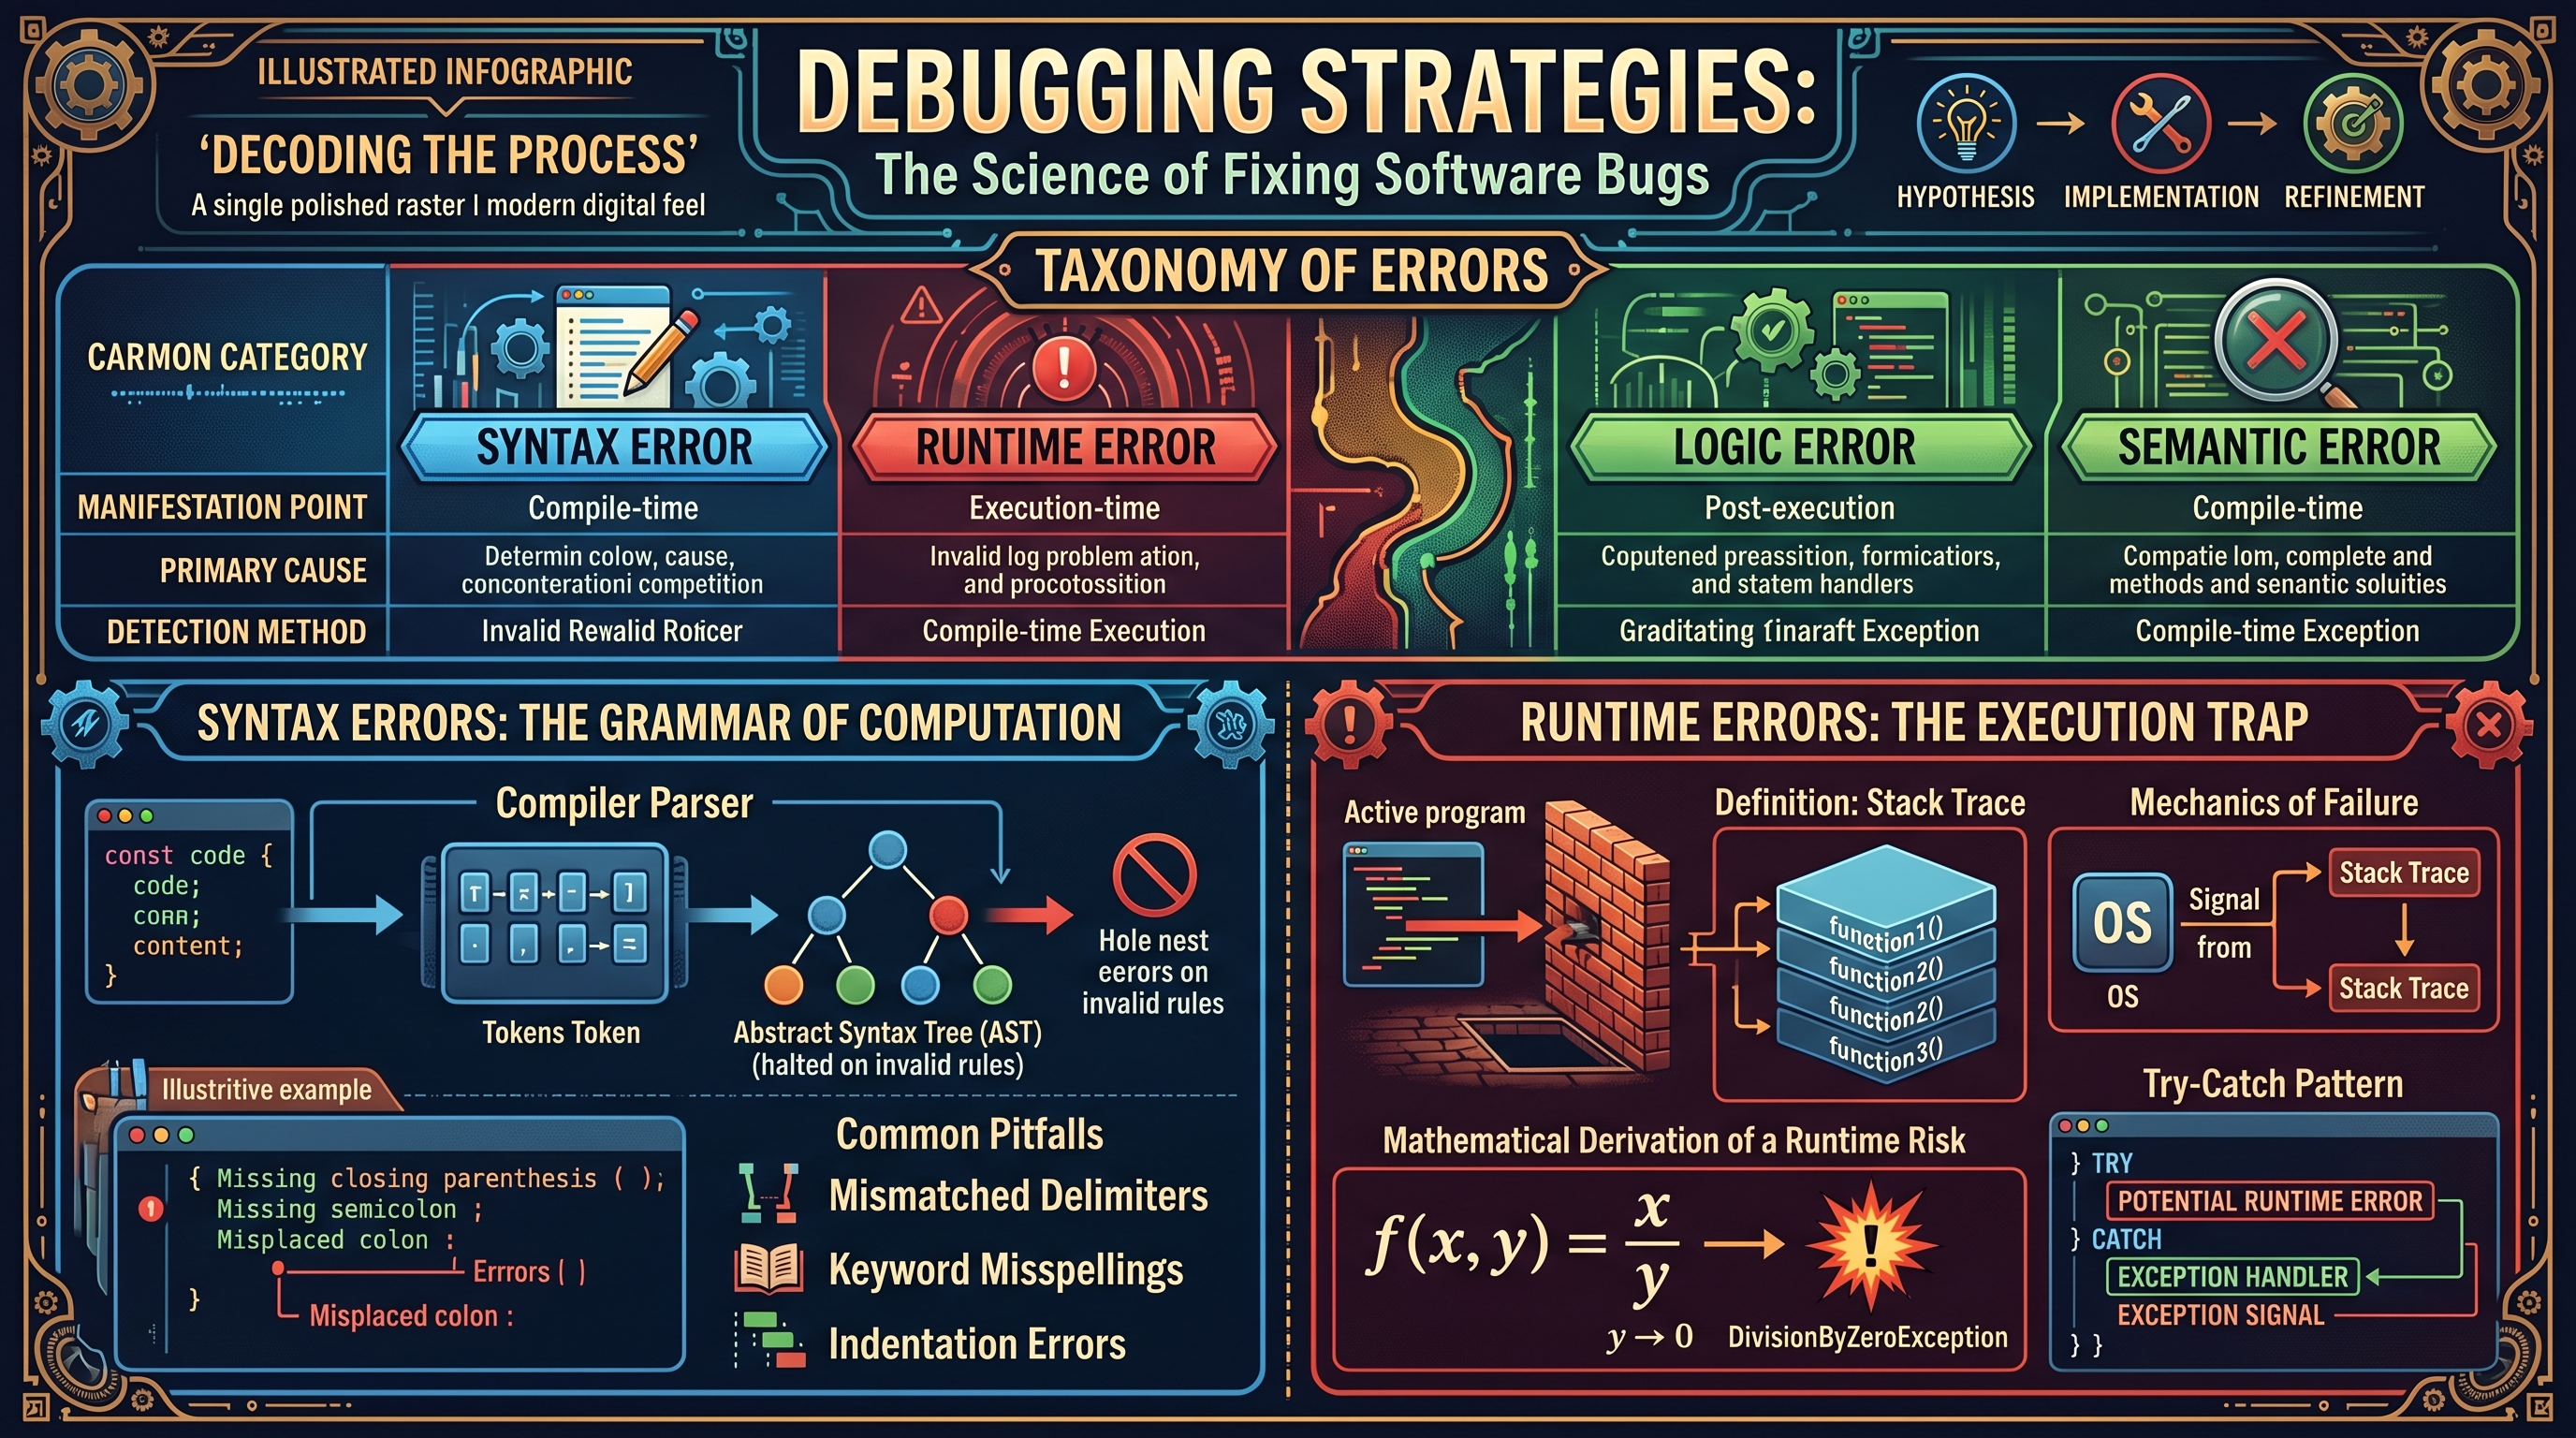
In the realm of computer science, the act of programming is rarely a linear path from conception to execution. Rather, it is a cyclical process of hypothesis, implementation, and refinement. Debugging is the systematic process of identifying, isolating, and fixing "bugs"—defects or problems in a computer program that prevent it from operating correctly. To the novice, debugging is a frustration; to the expert, it is a forensic science.
The Taxonomy of Errors
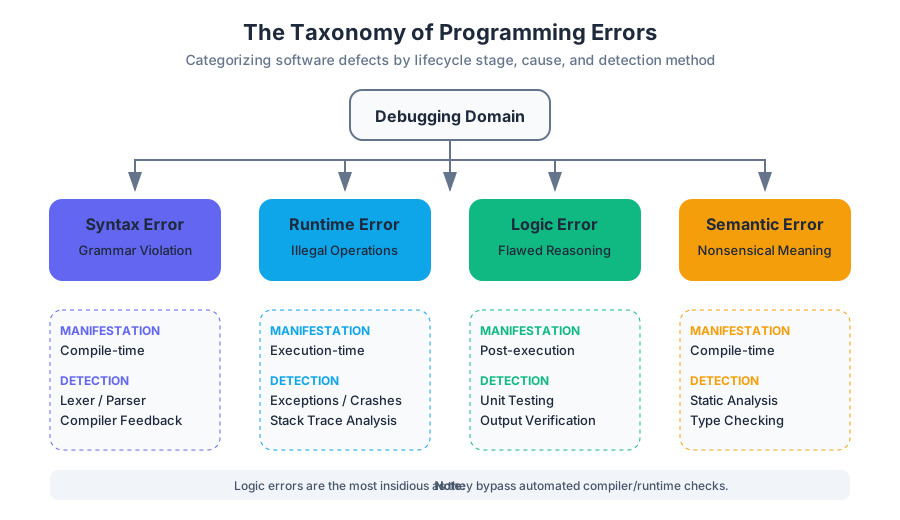
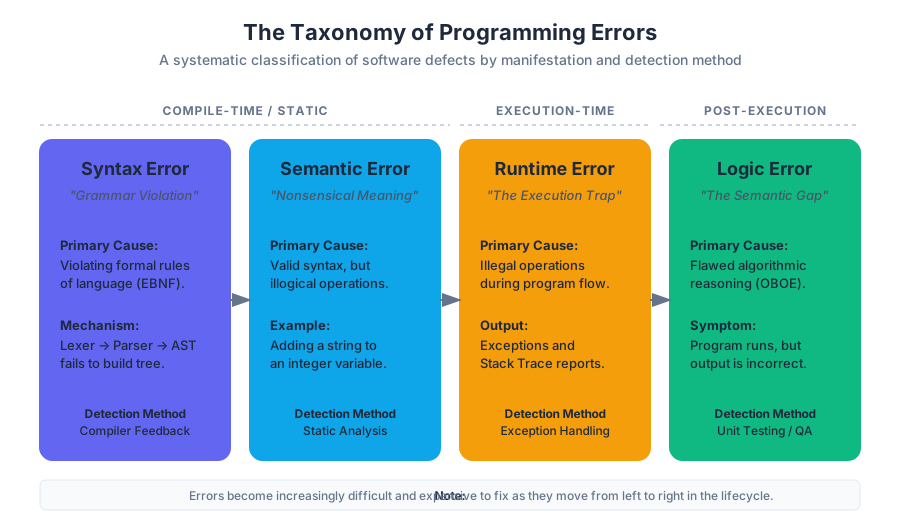
Before one can master the strategies of resolution, one must understand the anatomy of the failure. Errors are generally categorized by the stage of the development lifecycle in which they manifest.
| Error Category | Manifestation Point | Primary Cause | Detection Method |
|---|---|---|---|
| Syntax Error | Compile-time / Interpretation-time | Violation of language grammar | Parser/Compiler feedback |
| Runtime Error | Execution-time | Illegal operations (e.g., Div by Zero) | Exception handling / Crashes |
| Logic Error | Post-execution | Flawed algorithmic reasoning | Unit testing / Output verification |
| Semantic Error | Compile-time | Valid syntax, but nonsensical meaning | Static analysis |
Syntax Errors: The Grammar of Computation
A Syntax Error occurs when the code violates the structural rules of the programming language. Just as a natural language has rules for sentence structure, programming languages have strict formal grammars, often defined by Extended Backus-Naur Form (EBNF).
What it is
The compiler or interpreter acts as a linguist. When it encounters a sequence of tokens that does not match any valid production rule in the language's grammar, it halts execution. Because the computer cannot "guess" the programmer's intent, even a single missing character can render a million-line system unrunnable.
How it works
Modern compilers use a Lexer to turn characters into tokens (keywords, identifiers, operators) and a Parser to build an Abstract Syntax Tree (AST). A syntax error occurs when the Parser reaches a state where no valid transition exists for the next token.
/*
   Example 1: Low-level C implementation demonstrating
   common syntax errors in a memory allocation routine.
*/

#include <stdio.h>
#include <stdlib.h>

int main() {
    int *arr;
    int size = 10;

    // SYNTAX ERROR: Missing closing parenthesis in malloc call
    // SYNTAX ERROR: Missing semicolon at the end of the line
    arr = (int *)malloc(size * sizeof(int)

    if (arr == NULL) {
        printf("Allocation failed\n");
        return 1;
    }

    for (int i = 0; i < size; i++) {
        // SYNTAX ERROR: Using a colon instead of a semicolon in loop
        arr[i] = i * 2:
    }

    free(arr);
    return 0;
}
Common Pitfalls
- Mismatched Delimiters: Forgetting to close
(,[, or{. - Keyword Misspellings: Writing
functoninstead offunction. - Indentation Errors: In languages like Python, whitespace is a syntactic element; a single misplaced space can trigger an
IndentationError.
Runtime Errors: The Execution Trap
A Runtime Error (often called an Exception) occurs while the program is running. Unlike syntax errors, the code is "grammatically correct," but it asks the computer to perform an impossible or illegal operation.
Why it Matters
Runtime errors are particularly dangerous because they can bypass initial testing if the specific conditions required to trigger them (e.g., a specific user input or a full disk) are not met during the QA phase.
Mechanics of Failure
When a runtime error occurs, the operating system or the language runtime environment typically sends a signal to the process. If the program does not have an "exception handler" to catch this signal, the process is terminated (crashed), and a Stack Trace is generated.
Definition: Stack Trace A report that provides the active stack frames at a specific point in time during the execution of a program. it allows developers to see the sequence of function calls that led to the failure.
Mathematical Derivation of a Runtime Risk
Consider a simple division operation $f(x, y) = \frac{x}{y}$.
The domain of this function is $(x, y) \in \mathbb{R} \times (\mathbb{R} \setminus {0})$.
A runtime error occurs when the input vector violates the domain constraints:
$$\lim_{y \to 0} \frac{x}{y} = \infty$$
In computational terms, this triggers a DivisionByZeroException because hardware registers cannot represent infinity.
# Example 2: Pseudocode representation of Exception Handling Logic
# This demonstrates the 'Try-Catch' pattern used to mitigate runtime errors.

FUNCTION process_data(input_list):
    TRY:
        target_index = GET_USER_INPUT("Enter index: ")
        # Potential Runtime Error: IndexError if target_index > len(input_list)
        value = input_list[target_index]

        # Potential Runtime Error: ZeroDivisionError
        result = 100 / value

        RETURN result
    CATCH IndexError:
        PRINT "Error: The index provided is out of bounds."
    CATCH ZeroDivisionError:
        PRINT "Error: Cannot divide by a zero value in the list."
    CATCH GeneralException AS e:
        PRINT "An unexpected error occurred: " + e.message
    FINALLY:
        PRINT "Cleaning up resources..."
END FUNCTION
Logic Errors: The Semantic Gap
A Logic Error is the most insidious type of bug. The program runs to completion without crashing, but the output is incorrect. This happens when there is a discrepancy between the programmer's mental model and the actual code logic.
The "Semantic Gap"
The computer does exactly what you told it to do, not what you wanted it to do. Logic errors often stem from:
- Off-by-one errors (OBOE): Iterating $n$ times instead of $n-1$.
- Operator Precedence: Misunderstanding how
3 + 4 * 2is evaluated ($11$, not $14$). - Boolean Logic Flaws: Using
ANDwhenORwas required.
Concrete Example: The Accumulator Pattern
Imagine a function designed to calculate the average of a list of numbers. If the programmer initializes the sum variable inside the loop rather than outside, the "average" will always just be the last element divided by the count.
| Step | Variable: total (Correct) |
Variable: total (Buggy) |
|---|---|---|
| Initial | 0 | - |
| Iteration 1 (val=10) | 10 | 10 |
| Iteration 2 (val=20) | 30 | 20 |
| Iteration 3 (val=30) | 60 | 30 |
| Final Result | 20 (60/3) | 10 (30/3) |
# Example 3: Real-world Logic Error in a Data Normalization Pipeline
# This snippet shows a subtle logic error in feature scaling for ML.

import numpy as np

def buggy_normalize(data):
    """
    Intended: Perform Min-Max scaling: (x - min) / (max - min)
    Bug: Uses the global max instead of the column-wise max due to axis omission.
    """
    # Logic Error: np.min(data) without axis=0 flattens the whole matrix
    # instead of calculating per-feature minimums.
    data_min = np.min(data)
    data_max = np.max(data)

    # This results in incorrect scaling if features have different ranges.
    return (data - data_min) / (data_max - data_min)

# Correct Implementation
def correct_normalize(data):
    data_min = np.min(data, axis=0)
    data_max = np.max(data, axis=0)
    return (data - data_min) / (data_max - data_min)

# Usage
sample_data = np.array([[10, 0.1], [20, 0.2], [30, 0.3]])
print("Buggy Output:\n", buggy_normalize(sample_data))
Program Tracing: The Forensic Method
Program Tracing is the process of manually or digitally following the execution of a program's state, line by line. This is the primary method for resolving logic errors.
Manual Tracing (The Trace Table)
A Trace Table is a technique used to track the values of variables as they change during the execution of an algorithm. It is an essential skill for "mental execution" of code.
Algorithm to Trace:
x = 5
y = 2
while x > 0:
    y = y + x
    x = x - 2
Trace Table:
| Line # | x |
y |
Condition (x > 0) |
|---|---|---|---|
| 1 | 5 | - | - |
| 2 | 5 | 2 | - |
| 3 | 5 | 2 | True |
| 4 | 5 | 7 | - |
| 5 | 3 | 7 | - |
| 3 | 3 | 7 | True |
| 4 | 3 | 10 | - |
| 5 | 1 | 10 | - |
| 3 | 1 | 10 | True |
| 4 | 1 | 11 | - |
| 5 | -1 | 11 | - |
| 3 | -1 | 11 | False (Exit) |
Tools for Tracing
While manual tracing is good for small snippets, complex systems require Debuggers. Modern debuggers provide:
- Breakpoints: Pausing execution at a specific line.
- Stepping: Moving through code line-by-line (
Step Over,Step Into,Step Out). - Watches: Monitoring specific variables for changes.
# Example 4: CLI-based Tracing using Python's PDB (Debugger)
# This shows how a senior engineer interacts with a running process.

$ python3 -m pdb my_script.py
> /home/user/my_script.py(1)<module>()
-> x = [1, 2, 3]
(Pdb) n  # Step to next line
> /home/user/my_script.py(2)<module>()
-> y = sum(x)
(Pdb) p x # Print value of x
[1, 2, 3]
(Pdb) b 5 # Set breakpoint at line 5
Breakpoint 1 at /home/user/my_script.py:5
(Pdb) c # Continue execution until breakpoint
Advanced Strategies: Heuristics for the Modern Engineer
Beyond the basic types of errors, professional debugging involves high-level strategies to narrow down the "search space" of a bug.
1. Binary Search Debugging
If a bug exists in a large codebase, you can find it by systematically disabling halves of the code (or using git bisect to find the specific commit that introduced the bug). This reduces the complexity from $O(N)$ to $O(\log N)$.
2. Rubber Ducking
The Rubber Ducking method involves explaining your code, line-by-line, to an inanimate object (or a colleague). The act of translating code into natural language often forces the brain to notice the "Semantic Gap" where logic failed.
3. The "Heisenbug" and the Observer Effect
In some cases, the act of debugging (e.g., adding a print statement) changes the timing of the program enough that the bug disappears. These are known as Heisenbugs. They typically occur in multi-threaded environments where "race conditions" are present.
| Strategy | Best Used For | Pros | Cons |
|---|---|---|---|
| Print Debugging | Quick checks, simple logic | Low overhead, no tools needed | Clutters code, fails for timing bugs |
| Interactive Debugger | Complex state, deep call stacks | High visibility, state mutation | Steep learning curve |
| Unit Testing | Preventing regressions | Automated, permanent | High initial time investment |
| Log Analysis | Production issues, distributed systems | Historical record | Requires "log-heavy" architecture |
Conclusion: The Debugging Mindset
Debugging is not a sign of failure; it is an inherent part of the engineering process. As programs grow in complexity, the probability of errors approaches 100%. The goal of a senior engineer is not to write perfect code on the first pass, but to write code that is observable, testable, and traceable. By mastering the distinction between syntax, runtime, and logic errors, and by employing rigorous tracing techniques, one transforms from a coder who "guesses" to an engineer who "knows."
- Syntax Error: A violation of the formal grammar of a programming language, caught during parsing.
- Runtime Error: An error that occurs during execution, often resulting in an exception or crash.
- Logic Error: A bug where the program runs but produces incorrect results due to flawed reasoning.
- Trace Table: A manual grid used to track variable states and loop conditions line-by-line.
- Breakpoint: A marker set by a programmer to pause execution at a specific line in a debugger.
- Stack Trace: A report showing the active function calls at the moment of a crash.
- Heisenbug: A bug that disappears or changes behavior when one attempts to study it.
- Off-by-one Error (OBOE): A common logic error where a loop or sequence is iterated one time too many or too few.
-
Which type of error is generally considered the hardest to find and why?
- A) Syntax Error, because the compiler stops.
- B) Runtime Error, because it crashes the computer.
- C) Logic Error, because the program provides no error message and continues to run.
- D) Semantic Error, because the grammar is wrong. (Correct: C)
-
If a program runs perfectly on a developer's machine but crashes on a user's machine due to a missing file, what type of error is this?
- A) Syntax
- B) Runtime
- C) Logic
- D) Compilation (Correct: B)
-
In a Trace Table, what is the primary purpose of the "Condition" column?
- A) To store the final result of the program.
- B) To track whether a loop or 'if' statement evaluates to True or False at each step.
- C) To list the names of all variables.
- D) To record the time it takes for a line to execute. (Correct: B)
-
What is the complexity of finding a bug using the Binary Search (Bisect) method in a codebase of N commits?
- A) O(N)
- B) O(N^2)
- C) O(log N)
- D) O(1) (Correct: C)
Core Objectives:
- Differentiate between the three main types of programming errors.
- Construct a manual trace table for a loop-based algorithm.
- Understand the role of the stack trace in diagnosing runtime failures.
- Apply the "Rubber Duck" and "Binary Search" heuristics to complex problems.
Practice Exercise: Take a simple sorting algorithm (like Bubble Sort) and intentionally introduce one of each error type.
- Remove a colon (Syntax).
- Try to sort a list containing a string and an integer (Runtime).
- Change a
>to a<in the comparison logic (Logic). Observe how the computer reacts to each change and use a debugger to trace the state of the list during the "Logic Error" version.
Source Materials
Study Computing on Lykke
This course page is free to open: signed out, you can read its first two sections, and signing in, on any plan, opens the rest. The free Lykke Chrome extension syncs your own Canvas courses, so ChatGPT, Claude and Muse can answer from your classes and deadlines. It only reads Canvas.
Add the free extensionSign in to open every section