From the free course Computer Applications and Information Technology on Lykke
Spreadsheet Management and Data Visualization
Key concepts: Formulas and Functions · Logical and Lookup Functions · Data Visualization · Spreadsheet Fundamentals · Mathematical Computations
Mastering Microsoft Excel and other spreadsheet software for data organization, mathematical computation, and charting.
Spreadsheet Management and Data Visualization
The modern spreadsheet is more than a digital ledger; it is a functional programming environment and a sophisticated engine for relational data modeling. Since the inception of VisiCalc in 1979, spreadsheets have evolved into the primary interface through which the business world interacts with quantitative data. This section explores the mechanics of spreadsheet computation, the logic of data retrieval, and the cognitive principles of effective visualization.
Spreadsheet Fundamentals: The Architecture of the Grid
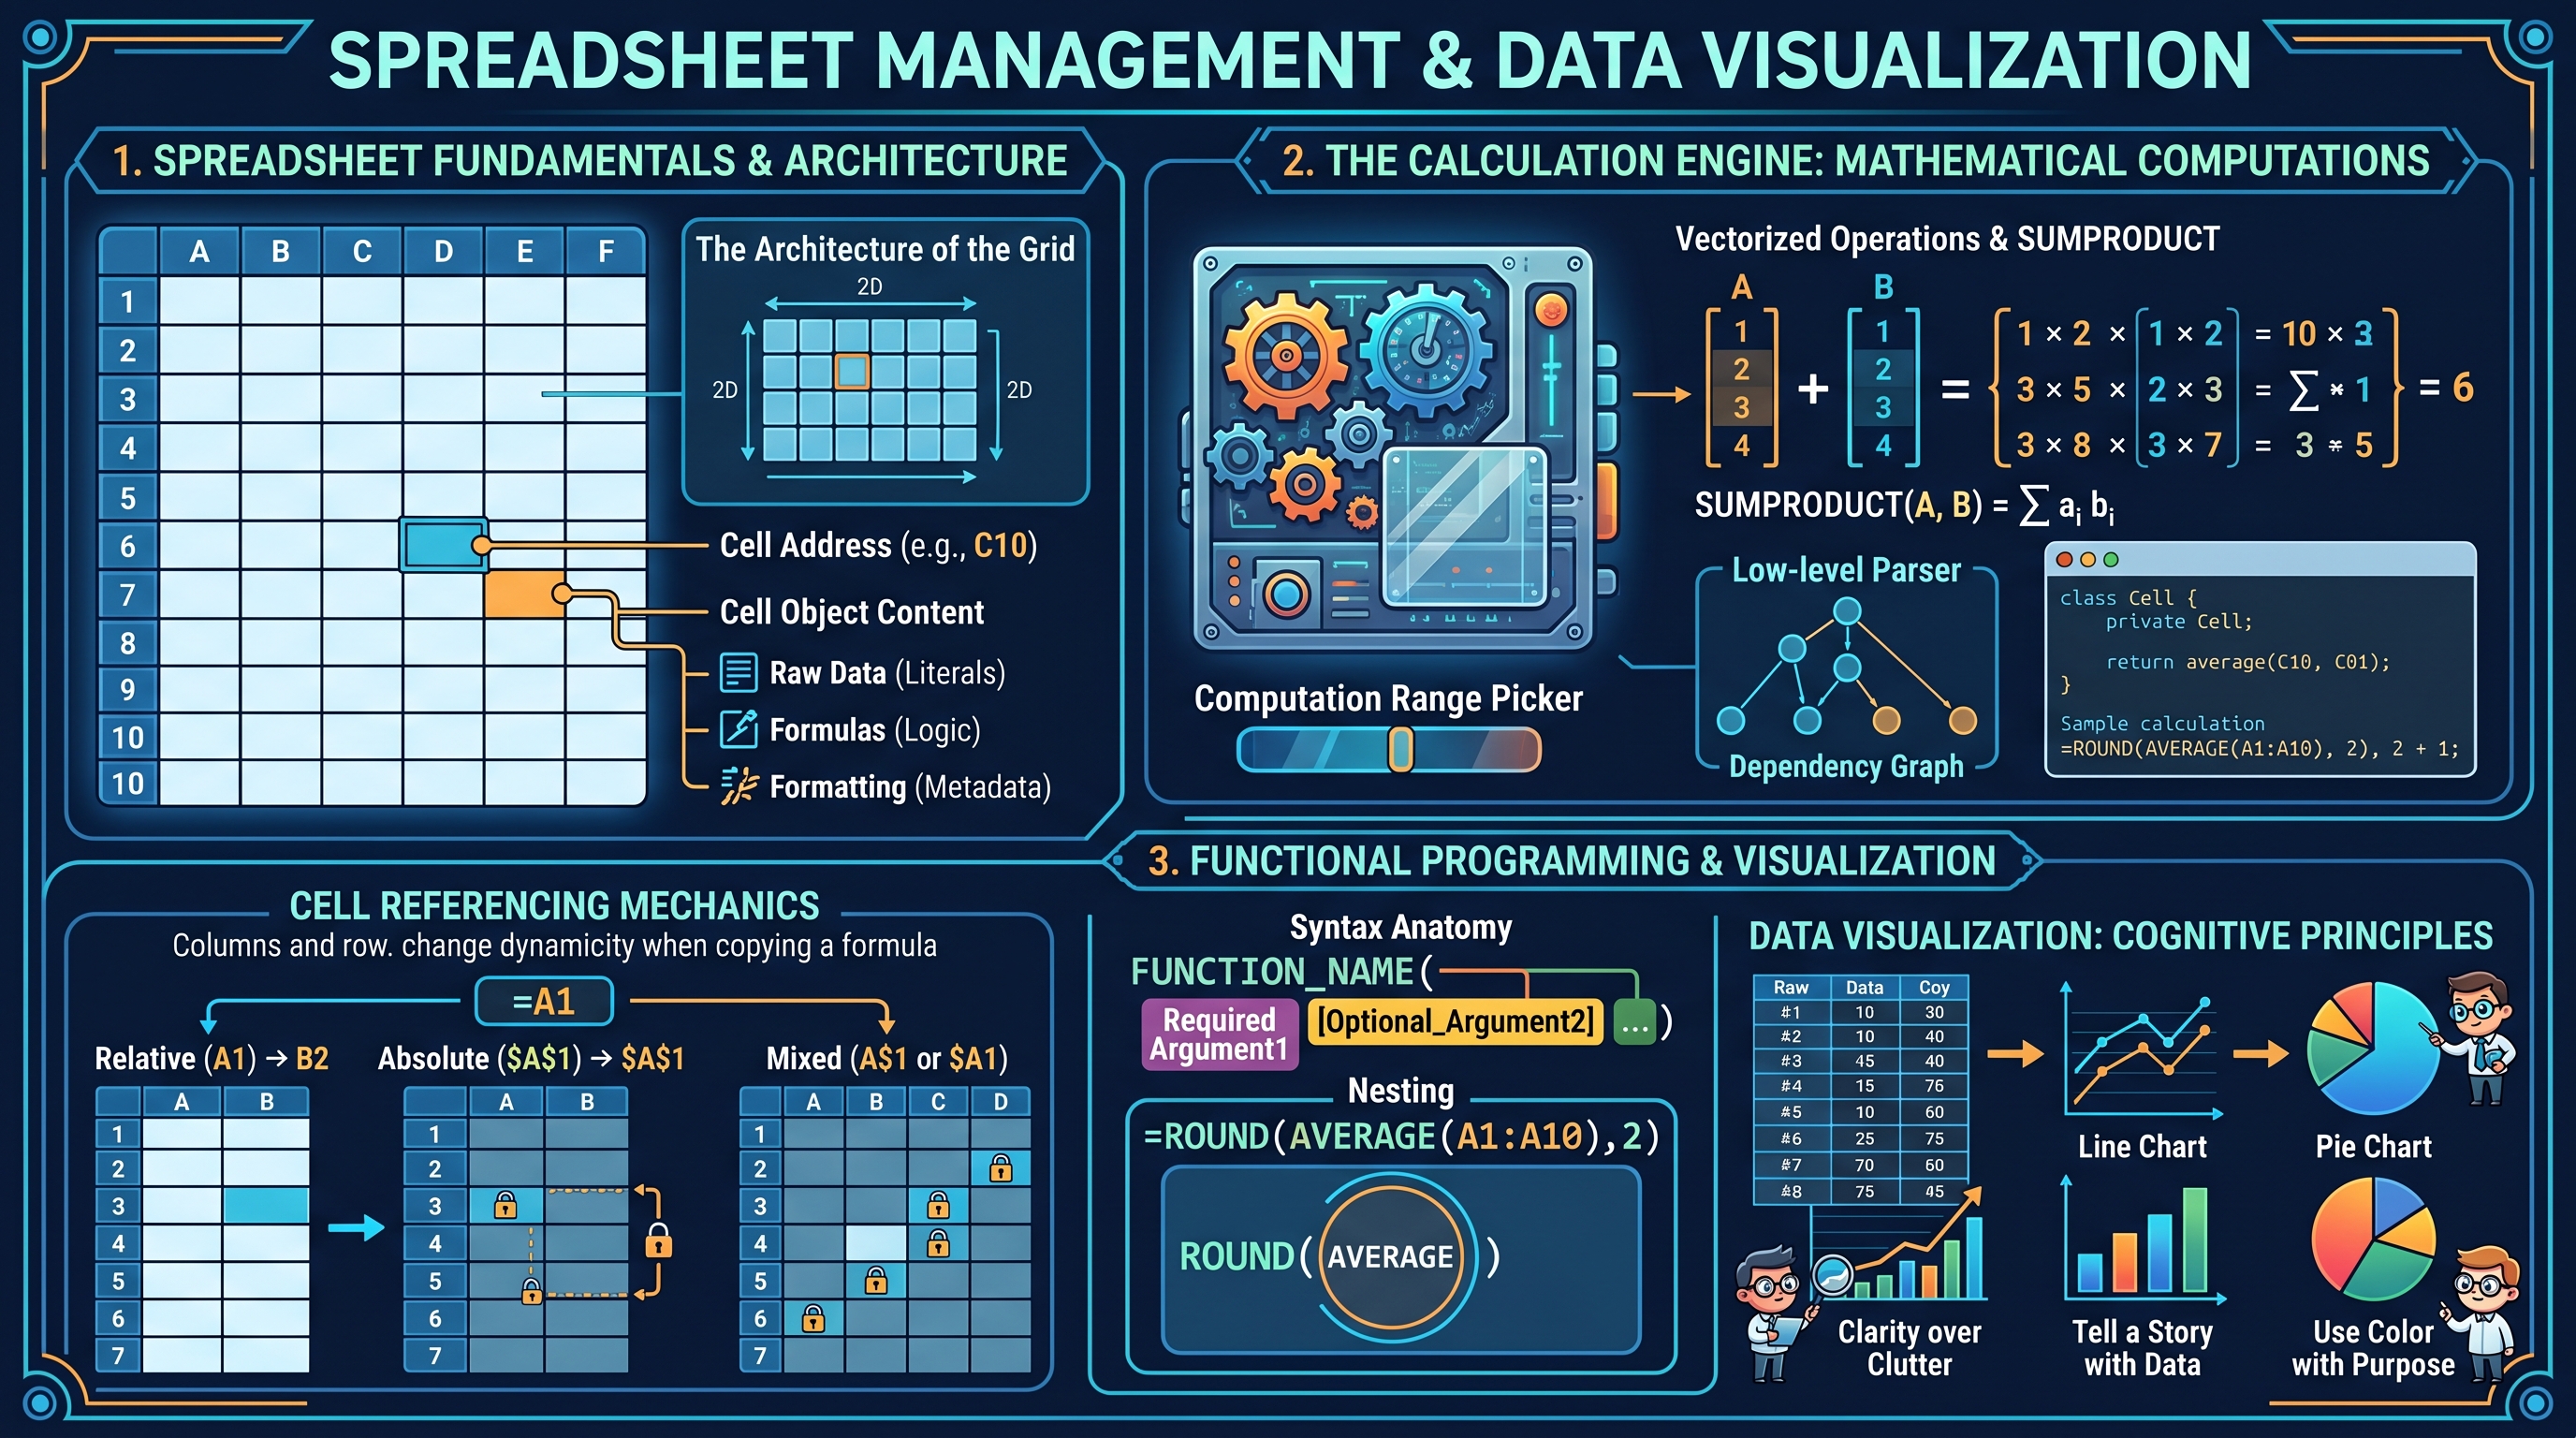
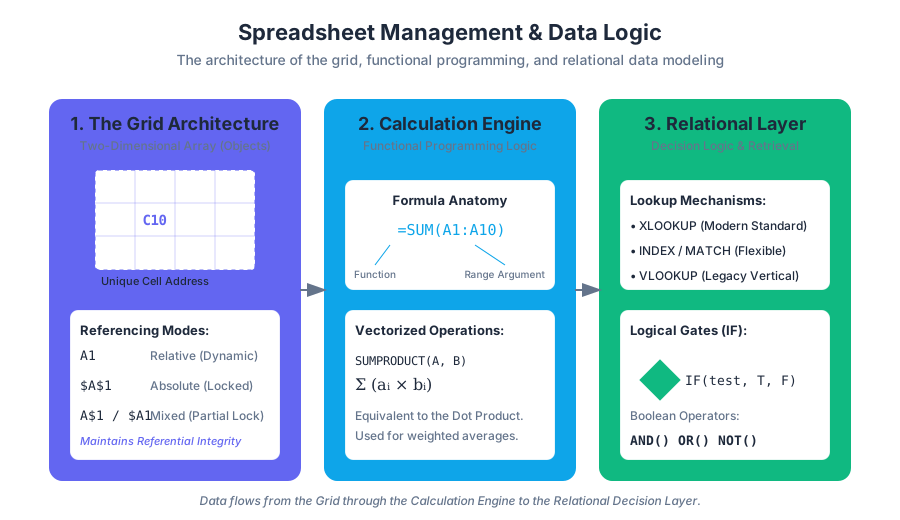
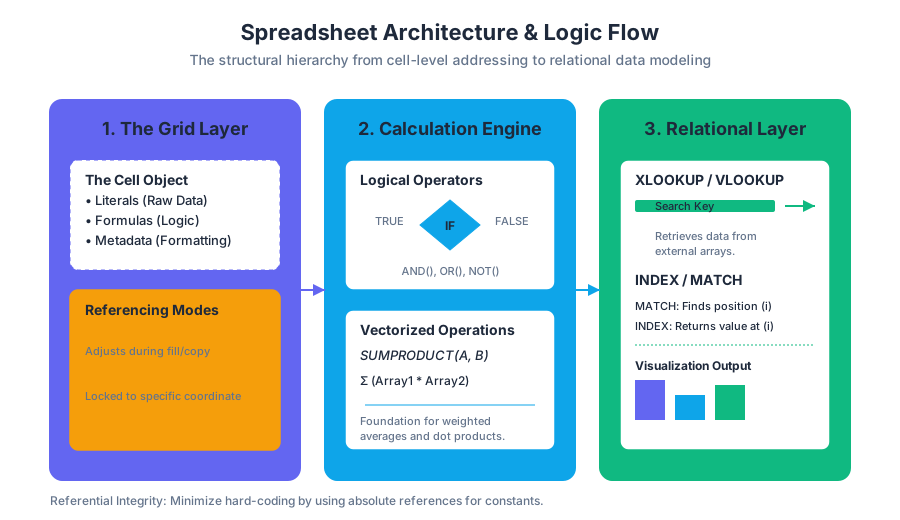
At its core, a spreadsheet is a two-dimensional array of cells, where each cell is an object capable of holding three distinct types of information: raw data (literals), formulas (logic), and formatting (metadata). The intersection of a column (identified by letters) and a row (identified by numbers) creates a unique Cell Address (e.g., C10).
Cell Referencing and Memory Addressing
The most critical concept in spreadsheet architecture is the distinction between Relative, Absolute, and Mixed references. This determines how formulas behave when they are copied across the grid.
| Reference Type | Syntax | Behavior during Fill/Copy | Use Case |
|---|---|---|---|
| Relative | A1 |
Both column and row adjust based on the displacement. | Calculating line-item totals in a list. |
| Absolute | $A$1 |
Neither column nor row changes; the reference is "locked." | Referencing a constant tax rate or discount factor. |
| Mixed (Row) | A$1 |
The column adjusts, but the row remains fixed. | Creating a multiplication table or header-based logic. |
| Mixed (Col) | $A1 |
The row adjusts, but the column remains fixed. | Comparing multiple scenarios against a fixed baseline. |
The Principle of Referential Integrity: A robust spreadsheet model should minimize "hard-coding" (typing numbers directly into formulas). Instead, constants should be placed in dedicated input cells and referenced absolutely, allowing for global updates by changing a single value.
Mathematical Computations: The Calculation Engine
Spreadsheets follow the standard Order of Operations (PEMDAS/BODMAS), but they also introduce specific computational behaviors for handling ranges and arrays.
Vectorized Operations and SUMPRODUCT
While basic arithmetic (+, -, *, /) operates on scalars, functions like SUMPRODUCT introduce vectorized math.
$$ \text{SUMPRODUCT}(A, B) = \sum_{i=1}^{n} a_i b_i $$
This is mathematically equivalent to the dot product of two vectors. It is the foundation for weighted averages and complex conditional sums.
# Low-level representation of a Spreadsheet Cell and Formula Parser
# This simulates how a dependency graph might evaluate cell values

class Cell:
    def __init__(self, expression, sheet):
        self.expression = expression  # Can be a literal (5) or formula ("=A1+B1")
        self.sheet = sheet
        self.value = None

    def evaluate(self):
        if not str(self.expression).startswith('='):
            self.value = float(self.expression)
            return self.value

        # Simple parser for "=CELL+CELL"
        tokens = self.expression[1:].split('+')
        total = 0
        for token in tokens:
            # Recursive lookup in the sheet's cell dictionary
            total += self.sheet[token].evaluate()
        self.value = total
        return self.value

# Usage
data_grid = {
    'A1': Cell(10, None),
    'B1': Cell(20, None),
    'C1': Cell('=A1+B1', None)
}
# Link sheet context
for cell in data_grid.values(): cell.sheet = data_grid

print(f"Evaluated Value of C1: {data_grid['C1'].evaluate()}")
Formulas and Functions: Functional Programming for Non-Programmers
A Formula is a user-defined expression (e.g., =A1+A2), while a Function is a pre-built routine (e.g., SUM(), VLOOKUP()). Functions are the "API" of the spreadsheet, abstracting complex algorithms into simple arguments.
Syntax Anatomy
A function call typically follows the pattern: FUNCTION_NAME(argument1, [optional_argument2], ...).
- Arguments can be literals, cell references, or nested functions.
- Nesting allows for functional composition, where the output of one function becomes the input of another:
=ROUND(AVERAGE(A1:A10), 2).
Logical and Lookup Functions: The Decision Layer
Logical functions allow the spreadsheet to react to data dynamically, while lookup functions transform the grid from a flat list into a relational database.
The IF Logic Gate
The IF function is a ternary operator: IF(test, value_if_true, value_if_false). It is the fundamental building block of spreadsheet automation.
| Operator | Meaning | Example |
|---|---|---|
= |
Equal to | IF(A1=100, "Pass", "Fail") |
<> |
Not equal to | IF(A1<>0, B1/A1, 0) |
> / < |
Greater/Less than | IF(A1>50, "High", "Low") |
AND() |
All conditions true | IF(AND(A1>0, A1<10), "Valid", "Invalid") |
OR() |
Any condition true | IF(OR(A1="Red", A1="Blue"), 1, 0) |
Lookup Mechanisms: VLOOKUP vs. INDEX/MATCH vs. XLOOKUP
Lookup functions are used to retrieve data from a table based on a key.
- VLOOKUP (Vertical Lookup): Searches the first column of a range and returns a value in the same row from a specified column.
- INDEX/MATCH: A more flexible combination where
MATCHfinds the position of a value andINDEXretrieves the value at that position. - XLOOKUP: The modern successor that handles horizontal and vertical searches, defaults to exact matches, and can return entire ranges.
MATHEMATICAL DERIVATION OF INDEX/MATCH LOGIC

Let T be a Table of size m x n.
Let K be the search key.
Let C_search be the column vector in T containing keys.
Let C_return be the column vector in T containing desired values.

Step 1: MATCH(K, C_search, 0)
Find index i such that C_search[i] == K.
i = argmin | j | where C_search[j] == K

Step 2: INDEX(C_return, i)
Retrieve the value at index i from the return vector.
Result = C_return[i]

This decoupling allows C_return to be to the LEFT of C_search,
a feat VLOOKUP cannot perform.
Data Visualization: Mapping Numbers to Optics
Data visualization is the graphical representation of information. Its goal is to communicate complex relationships clearly and efficiently by mapping data variables to visual aesthetics (position, length, color, and shape).
The Grammar of Graphics
Effective visualization follows the "Data-Ink Ratio" principle proposed by Edward Tufte: Maximize the share of ink used to represent data, and minimize the ink used for non-data elements (gridlines, borders, decorations).
Chart Selection Matrix
Choosing the wrong chart type can lead to "misinformation by design."
| Data Relationship | Recommended Chart | Why? |
|---|---|---|
| Trend over Time | Line Chart | Emphasizes continuity and the "slope" of change. |
| Comparison (Categories) | Bar/Column Chart | Uses length to provide an accurate baseline for comparison. |
| Correlation | Scatter Plot | Reveals clusters, outliers, and the strength of relationships ($R^2$). |
| Part-to-Whole | Treemap / Pie | Shows how a total is broken down (Pie is limited to <5 slices). |
| Distribution | Histogram | Shows the frequency of data points within specific "bins." |
Principles of Cognitive Load
- Preattentive Attributes: Use color and size to draw attention to the most important data point before the user consciously processes the chart.
- Avoid 3D Effects: 3D bars and pies distort the viewer's perception of area and length, making accurate comparison impossible.
- Color Theory: Use sequential scales for ordered data (light to dark) and diverging scales for data with a neutral midpoint (e.g., profit/loss).
Advanced Data Management: PivotTables and Power Query
As datasets grow, manual formulas become inefficient. PivotTables allow for the multi-dimensional aggregation of data without writing a single function.
The Pivot Mechanism
A PivotTable takes a flat data source and allows the user to define:
- Rows/Columns: The categorical variables to group by.
- Values: The numerical variable to aggregate (Sum, Count, Average).
- Filters: The subset of data to include.
Data Validation and Cleaning
Before visualization, data must be "tidy." This involves:
- Removing Duplicates: Ensuring each observation is unique.
- Data Validation: Restricting cell input to specific types (e.g., dates only, or a list of names) to prevent "Garbage In, Garbage Out" (GIGO).
- Conditional Formatting: Using logic-based styling to highlight outliers or trends automatically.
/**
 * Real-world usage: Google Apps Script (JavaScript)
 * Custom function to fetch live currency exchange rates into a spreadsheet.
 * This extends spreadsheet functionality beyond static data.
 */

/**
 * Converts currency using an external API.
 * @param {number} amount The amount to convert.
 * @param {string} fromCurrency The source currency code (e.g., "USD").
 * @param {string} toCurrency The target currency code (e.g., "EUR").
 * @return {number} The converted amount.
 * @customfunction
 */
function LIVE_EXCHANGE(amount, fromCurrency, toCurrency) {
  const cache = CacheService.getScriptCache();
  const cacheKey = `${fromCurrency}_${toCurrency}`;
  let rate = cache.get(cacheKey);

  if (!rate) {
    const url = `https://api.exchangerate-api.com/v4/latest/${fromCurrency}`;
    const response = UrlFetchApp.fetch(url);
    const data = JSON.parse(response.getContentText());
    rate = data.rates[toCurrency];
    // Cache for 1 hour to stay within API limits
    cache.put(cacheKey, rate.toString(), 3600);
  }

  return amount * parseFloat(rate);
}
Common Pitfalls in Spreadsheet Management
- Circular References: Occurs when a formula refers to its own cell, either directly or indirectly, creating an infinite loop. Most engines will throw an error unless "Iterative Calculation" is enabled.
- Hidden Rows in Calculations: Functions like
SUM()include hidden rows, whereasSUBTOTAL()can be configured to ignore them. This is a frequent source of reporting errors. - Floating Point Errors: Because computers represent decimal numbers in binary, calculations involving many decimals can result in tiny errors (e.g.,
0.1 + 0.2 = 0.30000000000000004). UseROUND()to mitigate this in financial models. - Hard-coding: Putting numbers inside formulas (e.g.,
=A1*0.07) makes the sheet difficult to audit and update.
Summary of Best Practices
To build professional-grade spreadsheets, one must treat the workbook like a software application:
- Separation of Concerns: Keep raw data, calculations, and presentation (dashboards) on separate tabs.
- Documentation: Use cell comments or a "ReadMe" tab to explain complex logic and data sources.
- Consistency: Use uniform header styles and naming conventions for named ranges.
- Verification: Always cross-check PivotTable totals against the raw data
SUM().
Source Materials
- Beginning Excel (Brown et al.)
- Computer Fundamentals for Technical Students (Heisserer)
- Workplace Software and Skills (OpenStax)
- Information Systems
- Business Computers 365 (Lacher)
- Introduction to Spreadsheets (Lumen)
- 2: Data Management and Information Systems Business Strategies
- 6: Enterprise Security, Data Privacy, and Risk Management
Study Computer Applications and Information Technology on Lykke
This course page is free to open: signed out, you can read its first two sections, and signing in, on any plan, opens the rest. The free Lykke Chrome extension syncs your own Canvas courses, so ChatGPT, Claude and Muse can answer from your classes and deadlines. It only reads Canvas.
Add the free extensionSign in to open every sectionAll sections of Computer Applications and Information Technology · Browse more course pages