From the free course Computer Applications and Information Technology on Lykke
Cloud Computing and Data Analytics
Key concepts: Cloud Computing · Cloud Infrastructure · Data Analytics · Data Modeling · SaaS/PaaS/IaaS
Exploring modern infrastructure through cloud computing and the use of data analytics for business modeling.
Cloud Computing and Data Analytics: The Architectural Synergy
The modern enterprise has undergone a fundamental shift from localized, capital-intensive hardware deployments to a decentralized, utility-based model of computing. This transition, known as the Cloud Revolution, is not merely a change in where code executes, but a radical reimagining of how data is captured, stored, and transformed into actionable intelligence. At the intersection of this shift lies Data Analytics, a discipline that leverages the near-infinite scalability of cloud infrastructure to solve problems that were computationally intractable only a decade ago.
The Genesis of Cloud Computing
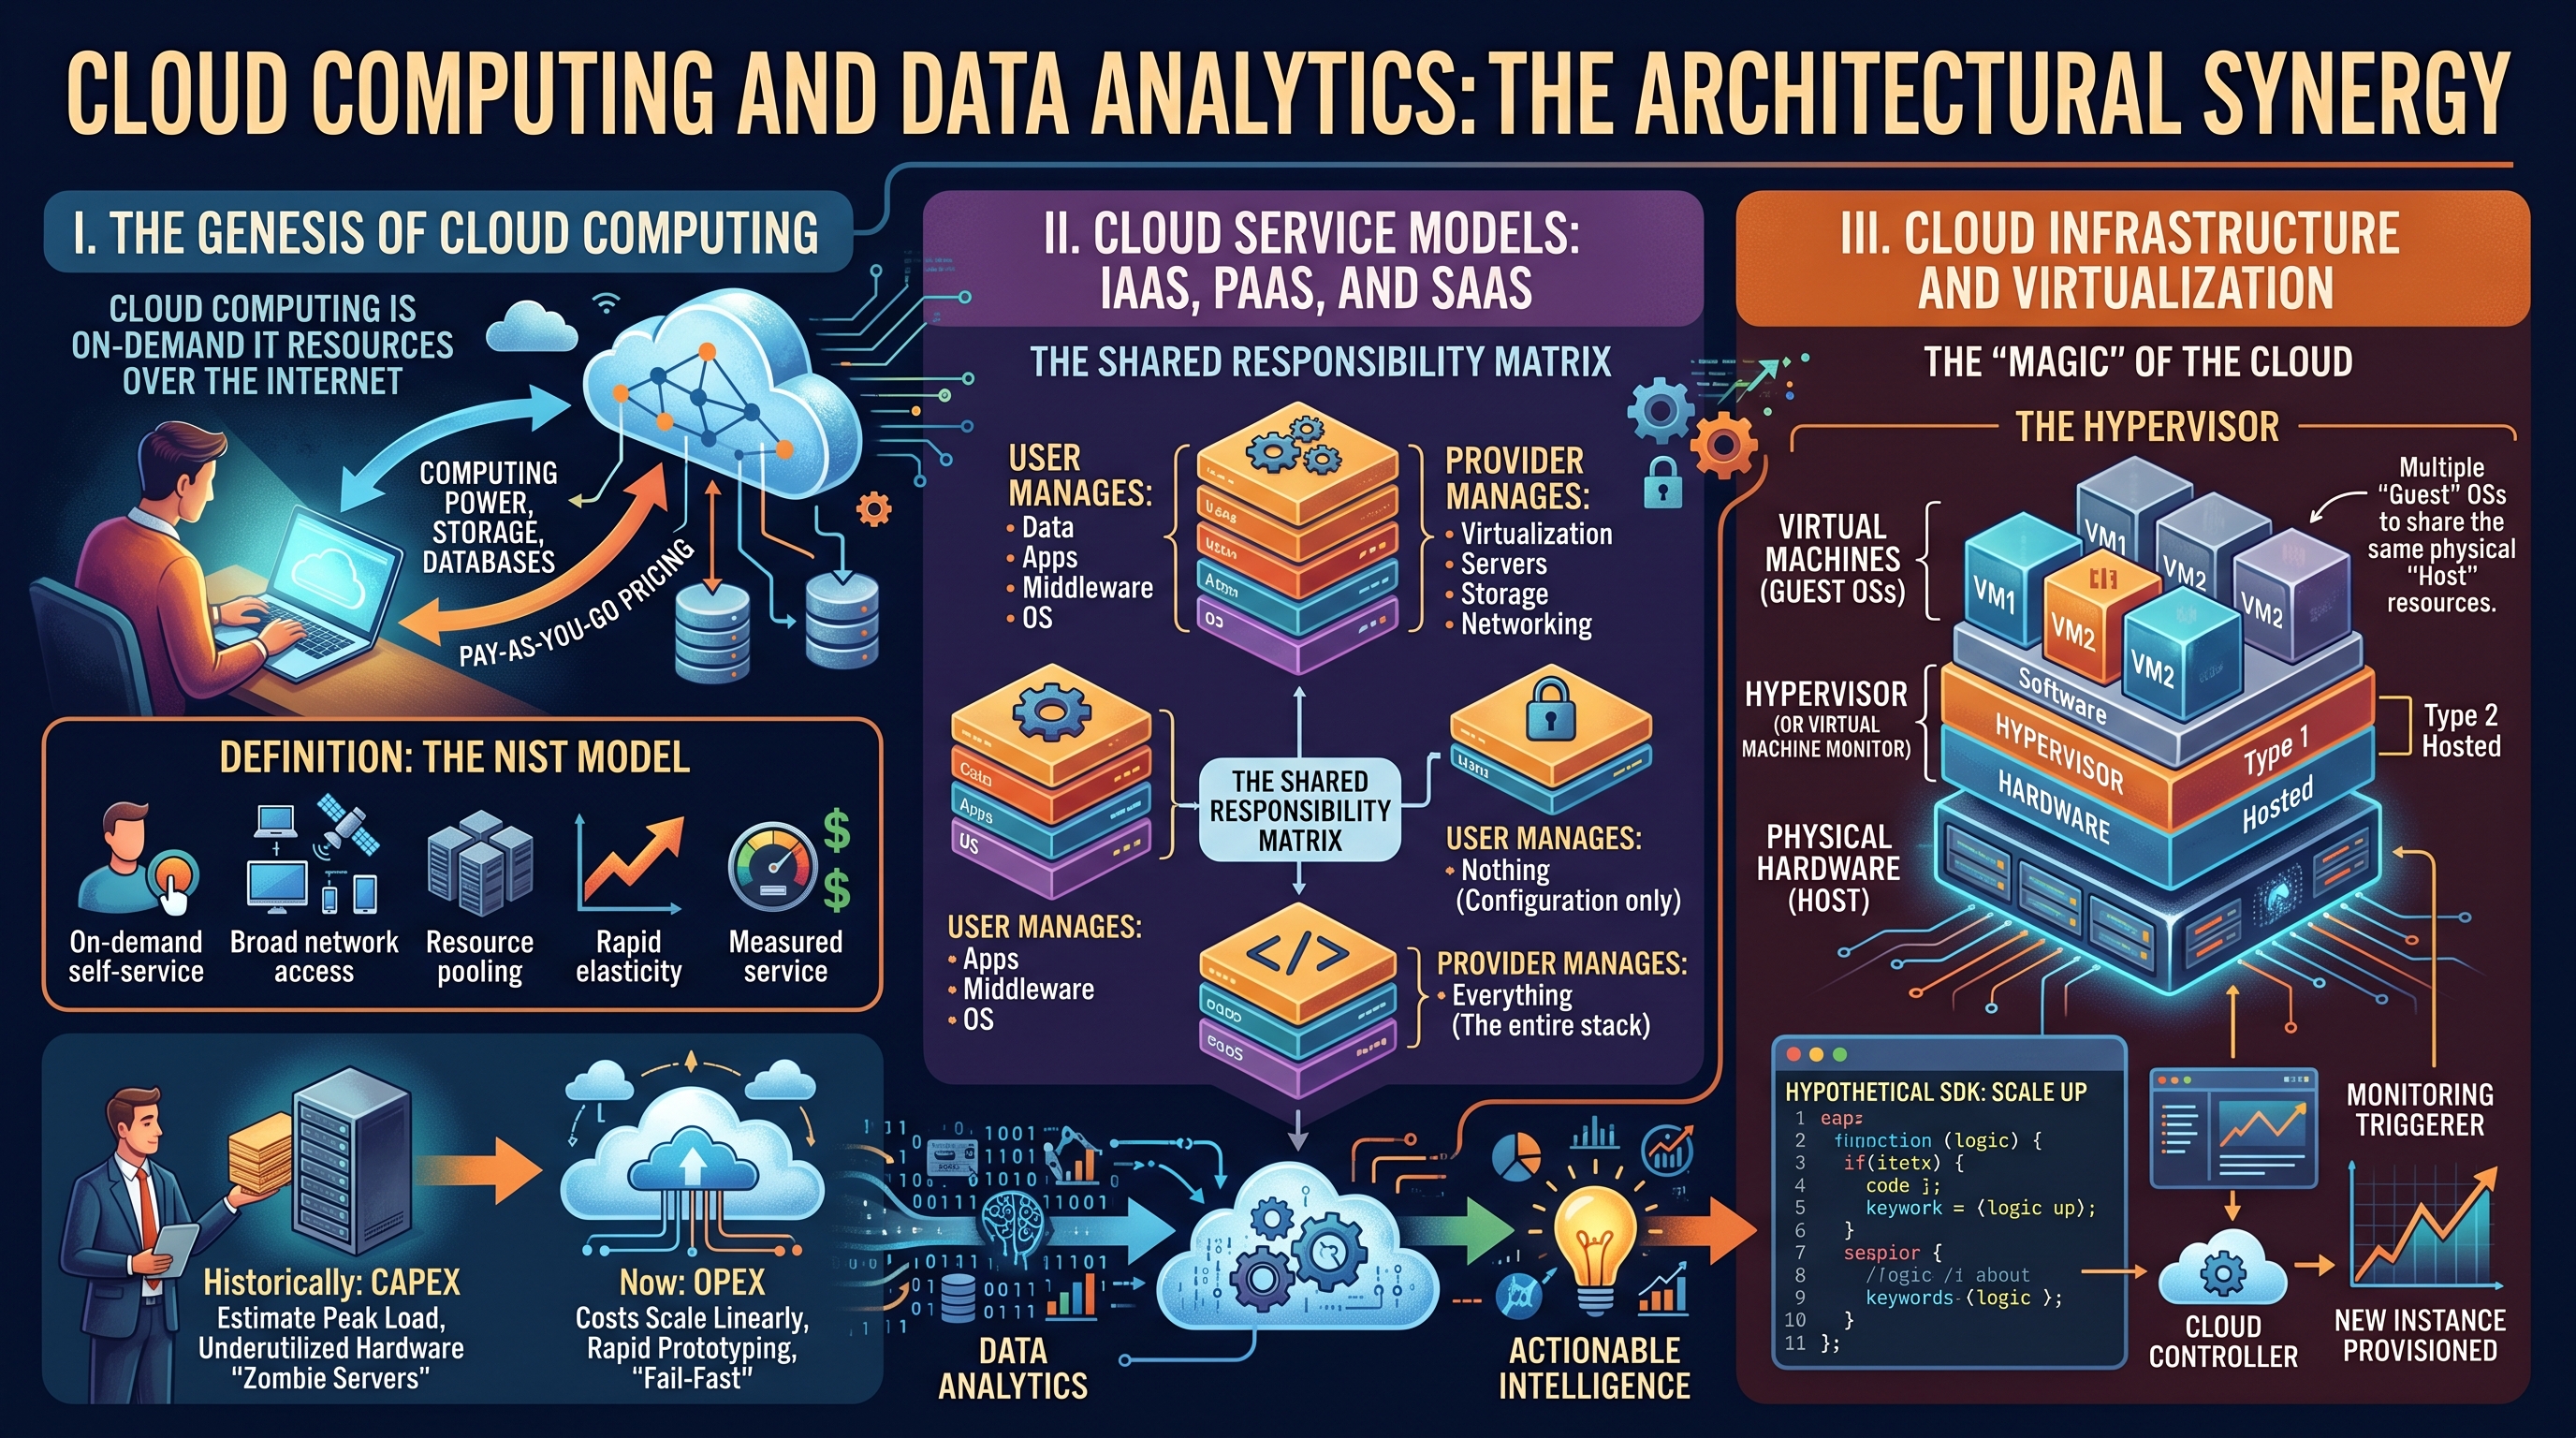
Cloud computing is defined as the on-demand delivery of IT resources over the internet with pay-as-you-go pricing. Rather than buying, owning, and maintaining physical data centers and servers, organizations access technology services, such as computing power, storage, and databases, from providers like Amazon Web Services (AWS), Microsoft Azure, and Google Cloud Platform (GCP).
Definition: The NIST Model According to the National Institute of Standards and Technology (NIST), cloud computing is characterized by five essential characteristics: On-demand self-service, Broad network access, Resource pooling, Rapid elasticity, and Measured service.
Why Cloud Computing Matters
Historically, IT departments operated under a CAPEX (Capital Expenditure) model. To launch a new application, one had to estimate peak load, purchase hardware, wait for shipping, and manually configure the stack. This led to "zombie servers"—underutilized hardware that drained resources. Cloud computing introduces the OPEX (Operational Expenditure) model, where costs scale linearly with usage. This enables Rapid Prototyping and Fail-Fast methodologies, as the cost of experimentation is drastically reduced.
Cloud Service Models: IaaS, PaaS, and SaaS
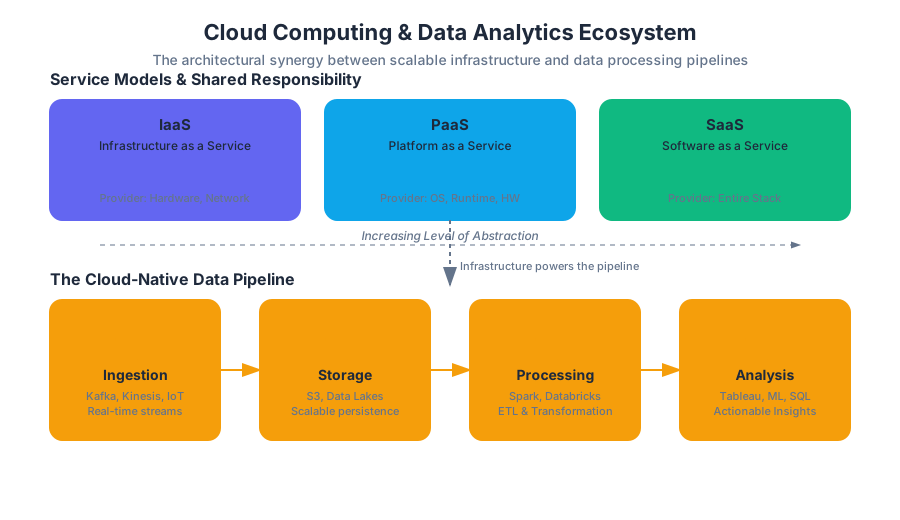
The "Cloud" is not a monolithic entity but a spectrum of abstraction. The choice of service model determines the "Shared Responsibility" between the provider and the consumer.
| Model | Acronym | Description | User Manages | Provider Manages |
|---|---|---|---|---|
| Infrastructure as a Service | IaaS | Fundamental building blocks of computing. | OS, Middleware, Data, Apps | Virtualization, Servers, Storage, Networking |
| Platform as a Service | PaaS | Framework for developers to build/deploy apps. | Applications, Data | OS, Runtime, Middleware, Hardware |
| Software as a Service | SaaS | Completed software products delivered via web. | Nothing (Configuration only) | Everything (The entire stack) |
The Shared Responsibility Matrix
In an IaaS environment, the user is responsible for patching the Operating System (OS). In a SaaS environment, the provider handles everything from the physical security of the data center to the encryption of data at rest within the application.
Cloud Infrastructure and Virtualization
The "magic" of the cloud relies on Virtualization. This is the process of creating a software-based (virtual) representation of something, such as virtual applications, servers, storage, and networks.
The Hypervisor
The core component of virtualization is the Hypervisor (or Virtual Machine Monitor). It is a layer of software that sits between the physical hardware and the Operating Systems, allowing multiple "Guest" OSs to share the same physical "Host" resources.
- Type 1 (Bare Metal): Runs directly on the host's hardware (e.g., VMware ESXi, Xen).
- Type 2 (Hosted): Runs on a conventional OS (e.g., Oracle VirtualBox).
Code Example 1: Low-Level Resource Management
In a cloud environment, we often interact with infrastructure via APIs. Below is a Python implementation using a hypothetical SDK to demonstrate how a cloud controller might balance load by spinning up new instances based on CPU utilization metrics.
import time

class CloudController:
    def __init__(self, threshold=80.0):
        self.threshold = threshold
        self.active_instances = []

    def get_cpu_utilization(self, instance_id):
        # In a real system, this calls a monitoring API like CloudWatch
        # Returns a float representing percentage
        pass

    def scale_up(self):
        new_id = f"inst-{len(self.active_instances) + 1}"
        print(f"[ACTION] Provisioning new instance: {new_id}")
        self.active_instances.append(new_id)

    def monitor_and_scale(self):
        while True:
            total_load = sum(self.get_cpu_utilization(i) for i in self.active_instances)
            avg_load = total_load / len(self.active_instances) if self.active_instances else 100

            print(f"[MONITOR] Average Cluster Load: {avg_load}%")

            if avg_load > self.threshold:
                self.scale_up()

            time.sleep(60) # Polling interval

# Note: This represents the logic behind 'Auto-scaling Groups' in Cloud Infrastructure.
Data Analytics: Extracting Value from the Cloud
If Cloud Computing is the engine, Data Analytics is the fuel. Data Analytics is the science of analyzing raw data to make conclusions. In the cloud, this is often categorized into four types:
- Descriptive: What happened? (e.g., Monthly sales reports)
- Diagnostic: Why did it happen? (e.g., Drill-down into churn data)
- Predictive: What will happen? (e.g., Forecasting demand using ML)
- Prescriptive: How can we make it happen? (e.g., Optimization algorithms)
The Big Data Pipeline
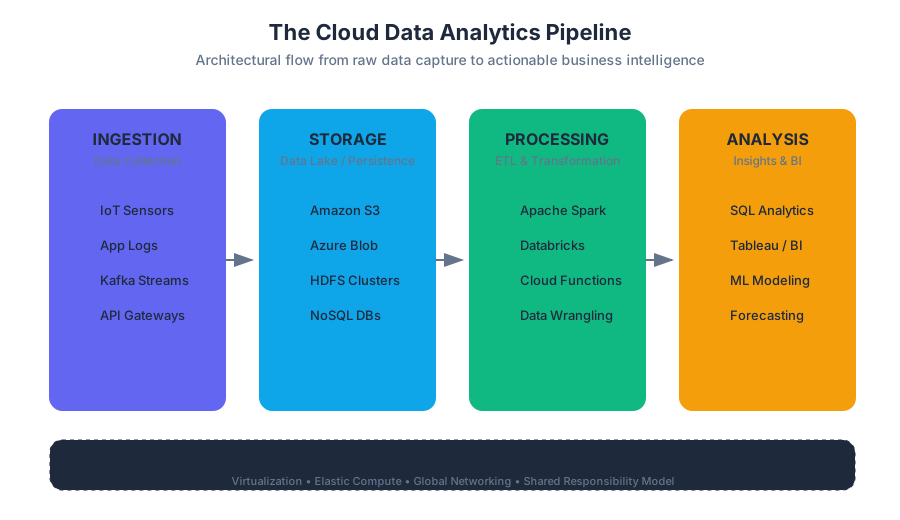
Cloud-native analytics typically follows a pipeline architecture: Ingestion (Kafka, Kinesis) → Storage (S3, Data Lake) → Processing (Spark, Databricks) → Analysis/Visualization (Tableau, Looker).
Data Modeling and Structuring
To analyze data effectively, it must be modeled. Data Modeling is the process of creating a visual representation of either a whole information system or parts of it to communicate connections between data points and structures.
Relational vs. Non-Relational
- RDBMS (SQL): Structured data, ACID compliance, fixed schema. Best for transactional data (e.g., banking).
- NoSQL: Unstructured or semi-structured data (JSON), horizontal scalability. Best for big data and real-time web apps.
The Star Schema
In cloud data warehousing (like Amazon Redshift or Snowflake), the Star Schema is the gold standard for performance. It consists of:
- Fact Tables: Quantitative data (e.g.,
sale_amount,quantity). - Dimension Tables: Descriptive attributes (e.g.,
product_name,store_location).
| Feature | Star Schema | Snowflake Schema |
|---|---|---|
| Normalization | Denormalized | Normalized |
| Query Complexity | Low (fewer joins) | High (more joins) |
| Data Redundancy | High | Low |
| Performance | Faster for OLAP | Slower but more organized |
Code Example 2: Infrastructure as Code (IaC)
To deploy these analytical environments, engineers use Declarative Configuration. Below is a pseudocode representation (similar to Terraform/HCL) for defining a Cloud Data Warehouse and its associated storage.
# Define a Cloud Storage Bucket for the Data Lake
resource "cloud_storage_bucket" "raw_data_lake" {
  name          = "enterprise-analytics-raw-prod"
  location      = "US-EAST-1"
  storage_class = "STANDARD"
  encryption    = "AES256"
}

# Define a Data Warehouse Instance
resource "cloud_data_warehouse" "main_dw" {
  cluster_identifier = "bi-analytics-cluster"
  node_type          = "dw2.large"
  number_of_nodes    = 4
  database_name      = "sales_analytics"

  # Link to the Data Lake for ELT processes
  iam_roles = [cloud_iam_role.dw_read_access.arn]
}
Advanced Data Analytics: The Power of Big Data
Big Data is often defined by the 5 Vs: Volume, Velocity, Variety, Veracity, and Value. Cloud computing solves the "Volume" and "Velocity" problems through Distributed Computing.
Amdahl's Law and Parallelism
In data processing, we aim to parallelize tasks. However, Amdahl's Law reminds us that the speedup of a program using multiple processors is limited by the sequential fraction of the program.
Amdahl's Law Formula $S_{latency}(s) = \frac{1}{(1-p) + \frac{p}{s}}$ Where:
- $S$ is the theoretical speedup.
- $s$ is the number of processors.
- $p$ is the proportion of the execution time that the part benefiting from improved resources originally occupied.
This formula explains why cloud analytics platforms focus on Horizontal Scaling (adding more machines) rather than just Vertical Scaling (adding more RAM/CPU to one machine).
Concrete Example: E-commerce Analytics Pipeline
Imagine an e-commerce giant processing 10,000 transactions per second.
- Ingestion: User clicks are streamed via
cURLor SDKs to a message bus. - Storage: The raw JSON is dumped into an S3 bucket (Data Lake).
- Transformation: A nightly Spark job transforms JSON into a structured Parquet format.
- Modeling: Data is loaded into a Star Schema in a Data Warehouse.
- Querying: Business analysts run SQL queries to find the "Top 10 products by region."
Code Example 3: Analytical SQL Query
This SQL query demonstrates a multi-table join in a Star Schema to calculate regional performance—a classic "Descriptive Analytics" task.
SELECT
    d.region_name,
    p.category,
    SUM(f.sales_amount) AS total_revenue,
    COUNT(DISTINCT f.transaction_id) AS transaction_count
FROM
    fact_sales f
JOIN
    dim_location d ON f.location_key = d.location_key
JOIN
    dim_product p ON f.product_key = p.product_key
WHERE
    f.order_date >= '2023-01-01'
GROUP BY
    d.region_name, p.category
HAVING
    SUM(f.sales_amount) > 10000
ORDER BY
    total_revenue DESC;
Common Pitfalls in Cloud and Analytics
Even with powerful tools, several common mistakes can lead to project failure or massive cost overruns.
- The "Lift and Shift" Trap: Moving a legacy application to the cloud without re-architecting it for cloud-native features (like auto-scaling). This often results in higher costs than on-premise.
- Data Silos: Creating fragmented data sets that cannot be joined, leading to "multiple versions of the truth."
- Ignoring Egress Costs: Cloud providers often charge very little to bring data in, but significant amounts to take data out.
- Over-provisioning: Allocating more resources than necessary.
- Security Misconfiguration: Leaving S3 buckets or databases open to the public internet—a leading cause of data breaches.
Ethics, Privacy, and Governance
As we aggregate massive datasets in the cloud, ethical considerations become paramount. Data Sovereignty laws (like GDPR in Europe) dictate where data can be stored and processed. Organizations must implement Data Governance frameworks to ensure data quality, security, and compliance.
- Anonymization: Removing PII (Personally Identifiable Information) before analysis.
- Auditability: Keeping logs of who accessed what data and when.
- Bias in Analytics: Ensuring that predictive models do not reinforce historical biases (e.g., in hiring or lending algorithms).
Summary of Key Formulae and Concepts
- Total Cost of Ownership (TCO): $TCO = Acquisition + Operating + Maintenance$. In the cloud, $Acquisition$ approaches zero.
- Availability: Measured in "Nines." 99.9% (Three Nines) allows for ~9 hours of downtime per year; 99.999% (Five Nines) allows for only ~5 minutes.
- ETL vs. ELT:
- ETL (Extract, Transform, Load): Data is transformed before reaching the warehouse.
- ELT (Extract, Load, Transform): Data is loaded raw into the warehouse and transformed using the warehouse's compute power (preferred in modern cloud architectures).
| Metric | On-Premise | Cloud (IaaS/PaaS) |
|---|---|---|
| Scaling Speed | Weeks/Months | Seconds/Minutes |
| Cost Structure | Fixed (CAPEX) | Variable (OPEX) |
| Maintenance | High (Physical) | Low (Software-defined) |
| Global Reach | Difficult | Instant (Multi-region) |
The synergy of Cloud Computing and Data Analytics has democratized high-performance computing. Today, a startup with a credit card has access to the same computational power that was once reserved for global superpowers, enabling a new era of data-driven innovation.
Source Materials
- Information Systems
- 7: Cloud Computing and Managing the Cloud Infrastructure
- 8: Data Analytics and Modeling
- Computer Applications and Information Technology
- Workplace Software and Skills (OpenStax)
- Introduction to Computer Applications and Concepts (Lumen)
- Beginning Excel (Brown et al.)
- 2: Data Management and Information Systems Business Strategies
Study Computer Applications and Information Technology on Lykke
This course page is free to open: signed out, you can read its first two sections, and signing in, on any plan, opens the rest. The free Lykke Chrome extension syncs your own Canvas courses, so ChatGPT, Claude and Muse can answer from your classes and deadlines. It only reads Canvas.
Add the free extensionSign in to open every sectionAll sections of Computer Applications and Information Technology · Browse more course pages