From the free course Statistics and Probability on Lykke
Statistical Investigations and Study Design
Key concepts: Random Sampling · Observational Studies vs. Experiments · Sources of Bias · Experimental Design Principles · Random Assignment
Learning how to collect data through sampling and experiments while avoiding bias.
Statistical Investigations and Study Design
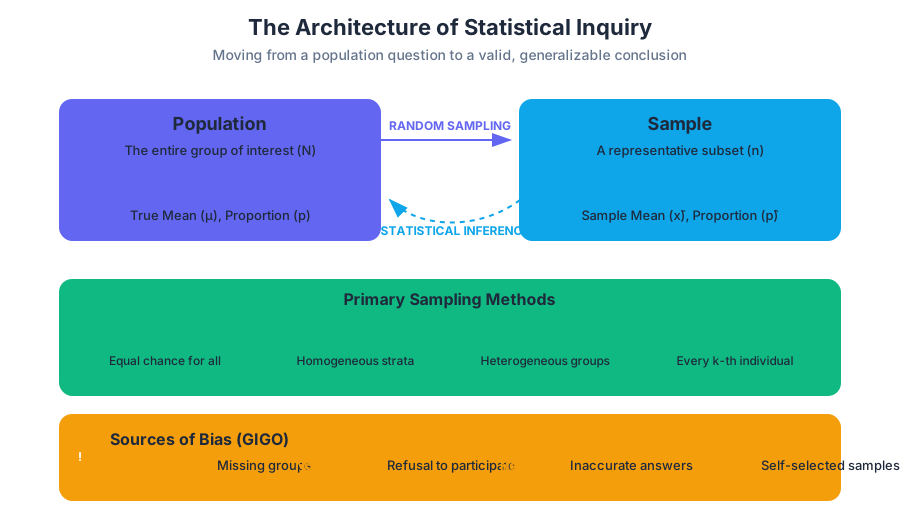
The integrity of any statistical conclusion rests entirely upon the quality of the data collection process. In the field of data science and statistics, we often say "Garbage In, Garbage Out" (GIGO). No amount of sophisticated machine learning or high-level calculus can rescue a study built on a biased sample or a poorly designed experiment. This article explores the rigorous frameworks required to move from a simple question to a valid, generalizable conclusion.
The Architecture of Statistical Inquiry
Before a single data point is collected, a researcher must distinguish between a statistical question and a non-statistical question. A statistical question is one that anticipates variability in the data. For example, "How much does a typical laptop weigh?" is a statistical question because weights vary. "How much does this specific MacBook Pro weigh?" is not; it has a single, deterministic answer.
The Population vs. The Sample
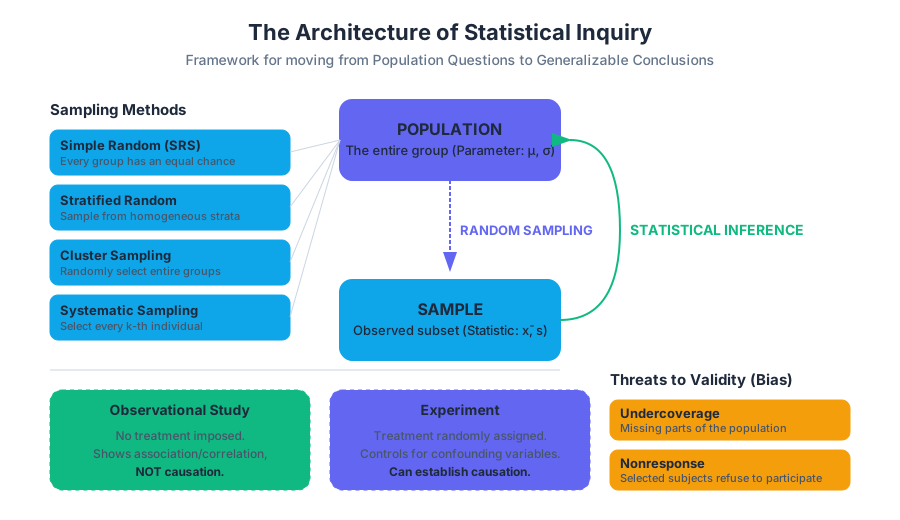
In statistical investigations, we seek to understand a population—the entire group of individuals we are interested in. Because it is usually impossible or impractical to measure every member of a population (a census), we instead collect a sample.
Definition: Parameter vs. Statistic A parameter is a numerical summary of a population (e.g., the true mean height of all humans, $\mu$). A statistic is a numerical summary of a sample (e.g., the mean height of 100 people in a study, $\bar{x}$). We use statistics to estimate parameters.
Random Sampling: The Science of Selection
The goal of sampling is to obtain a representative subset of the population. To achieve this, we must use randomization. If every individual in the population has an equal chance of being selected, we minimize the risk of systematic error.
Primary Sampling Methods
| Method | Description | Best For... |
|---|---|---|
| Simple Random Sample (SRS) | Every group of size $n$ has an equal chance of selection. | General populations with no distinct sub-groups. |
| Stratified Random Sample | Population is divided into strata (homogeneous groups); an SRS is taken from each. | Ensuring representation of specific demographics (e.g., age, gender). |
| Cluster Sample | Population is divided into clusters (heterogeneous groups); entire clusters are randomly selected. | Reducing costs/logistics when the population is geographically spread. |
| Systematic Sample | Selecting every $k$-th individual from a list after a random starting point. | Quality control on assembly lines or large databases. |
Why it Matters: Variance Reduction
Stratified sampling is not just about "fairness." Mathematically, it reduces the sampling variability (standard error) of our estimate if the strata are significantly different from one another. By ensuring we capture the variation between groups, we only have to worry about the variation within groups.
Sources of Bias: The Silent Killers of Validity
Bias is a systematic error that results in an estimate that is consistently higher or lower than the true population parameter. It is distinct from sampling error, which is the natural variation that occurs because we are looking at a sample rather than a population.
Common Types of Bias
| Bias Type | Mechanism | Example |
|---|---|---|
| Undercoverage | Some members of the population are left out of the sampling frame. | Conducting a "national" survey via landline phones (missing cell-only users). |
| Nonresponse | Selected individuals cannot be contacted or refuse to participate. | A long email survey where only people with strong opinions reply. |
| Response Bias | Inaccurate responses due to wording, interviewer behavior, or social desirability. | Asking "Do you support the illegal use of drugs?" (People lie). |
| Voluntary Response | Participants choose themselves to be part of the sample. | Online polls on news websites; usually attracts extremists. |
The Mathematical Perspective on Bias
If we let $\theta$ be the true parameter and $\hat{\theta}$ be our estimator, the bias is defined as: $$ \text{Bias}(\hat{\theta}) = E[\hat{\theta}] - \theta $$ An unbiased estimator is one where $E[\hat{\theta}] = \theta$. Random sampling is the primary tool used to drive this bias toward zero.
Observational Studies vs. Experiments
The most critical distinction in study design is the level of control the researcher exerts over the subjects.
- Observational Study: The researcher observes individuals and measures variables of interest but does not attempt to influence the responses. We can identify associations or correlations, but we cannot establish causation.
- Experiment: The researcher deliberately imposes a treatment on individuals to measure their responses. This is the "gold standard" for establishing causation.
The Confounding Variable
The reason observational studies cannot prove causation is the presence of confounding variables. A confounding variable is an "extra" variable that is associated with both the explanatory variable and the response variable, making it impossible to tell which is causing the effect.
Example: Data shows that ice cream sales are positively correlated with drowning incidents. Does ice cream cause drowning? No. The confounding variable is temperature. Hot weather increases both ice cream consumption and swimming activity.
Experimental Design Principles
To conduct a valid experiment that can prove causation, researchers must adhere to four fundamental principles.
1. Comparison
You must compare at least two treatments. This often involves a control group that receives a placebo (a dummy treatment) or the current standard of care. This allows us to isolate the effect of the specific treatment being tested.
2. Randomization (Random Assignment)
This is the most important step. Subjects must be assigned to treatment groups using a chance process.
- Random Sampling allows us to generalize to the population.
- Random Assignment allows us to determine causation.
3. Control
Researchers must keep other variables constant for all groups to prevent confounding. For example, in a plant growth experiment, all plants should receive the same amount of water and sunlight, regardless of the fertilizer (treatment) they receive.
4. Replication
The experiment must be applied to enough experimental units so that any observed effects can be distinguished from chance variation.
The Logic of Causal Inference (Counterfactuals)
In a perfect world, we would observe the same person both taking a drug and not taking a drug at the same time. This is the "Counterfactual." Since we cannot do this, we use random assignment to create two groups that are, on average, identical.
Potential Outcomes Framework (Rubin Causal Model):
Let Y_i(1) be the outcome for individual i if treated.
Let Y_i(0) be the outcome for individual i if not treated.

Causal Effect = Y_i(1) - Y_i(0)

Problem: We only observe ONE of these for any individual.
Solution: E[Y(1) | Treatment] - E[Y(0) | Control]
If assignment is RANDOM, then:
E[Y(1) | Treatment] = E[Y(1)] and E[Y(0) | Control] = E[Y(0)]
Therefore, Average Treatment Effect (ATE) = E[Y(1)] - E[Y(0)]
Advanced Experimental Structures
Not all experiments are "Completely Randomized Designs." Sometimes, we need more nuance to handle known variability.
Randomized Block Design
If we know a specific variable (like gender or age) will affect the response, we can group subjects into blocks based on that variable and then randomly assign treatments within each block. This is the experimental equivalent of stratified sampling.
Matched Pairs Design
A special case of blocking where we compare two very similar units (e.g., identical twins) or measure the same unit before and after a treatment. This significantly reduces "noise" in the data.
Blinding and the Placebo Effect
- Single-Blind: The subject does not know which treatment they are receiving.
- Double-Blind: Neither the subject nor the researcher interacting with them knows which treatment is being administered. This prevents the researcher from subconsciously influencing the results.
Common Pitfalls in Study Design
- Confusing Random Sampling with Random Assignment:
- Sampling is about how you get your subjects (affects generalizability).
- Assignment is about what you do with them (affects causality).
- Ignoring the Placebo Effect: Humans often improve simply because they believe they are being treated. Without a control group, you cannot tell if the drug works or if the "idea" of the drug works.
- Over-generalizing: If you conduct an experiment on college students, your results might not apply to 70-year-olds. The scope of inference is limited to the population from which you sampled.
- Data Dredging (P-hacking): Running dozens of observational comparisons and only reporting the one that looks "significant" by chance.
Summary Table: Scope of Inference
| Randomly Selected? (Yes) | Randomly Selected? (No) | |
|---|---|---|
| Randomly Assigned? (Yes) | Can infer causation; can generalize to population. | Can infer causation; cannot generalize to population. |
| Randomly Assigned? (No) | Cannot infer causation; can generalize to population. | Cannot infer causation; cannot generalize to population. |
Source Materials
Study Statistics and Probability on Lykke
This course page is free to open: signed out, you can read its first two sections, and signing in, on any plan, opens the rest. The free Lykke Chrome extension syncs your own Canvas courses, so ChatGPT, Claude and Muse can answer from your classes and deadlines. It only reads Canvas.
Add the free extensionSign in to open every sectionAll sections of Statistics and Probability · Browse more course pages