From the free course Statistics and Probability on Lykke
Significance Testing
Key concepts: Null and Alternative Hypotheses · P-values · Significance Level (Alpha) · Type I and Type II Errors · Statistical Power
The formal process of hypothesis testing to evaluate claims about a population.
Significance Testing
Significance testing, often referred to as Null Hypothesis Statistical Testing (NHST), is the formal mathematical framework used to determine whether an observed effect in a dataset is likely a result of true underlying patterns or merely a product of random sampling error. In the rigorous world of empirical research, we rarely "prove" a theory; instead, we evaluate the strength of the evidence against a default state of "no effect."
At its core, significance testing is a decision-making tool. It allows researchers to quantify uncertainty and set a threshold for when an observation becomes "interesting" enough to warrant rejecting the status quo. Whether you are validating a new pharmaceutical compound, optimizing a machine learning model, or analyzing A/B test results for a web application, significance testing provides the guardrails against seeing patterns in noise.
The Hypothesis Framework: H₀ vs. Hₐ
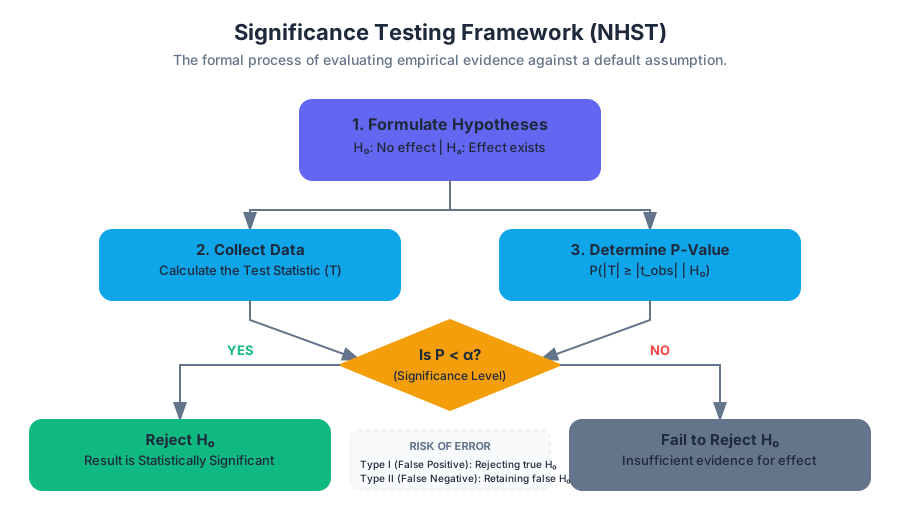
The foundation of any significance test is the formulation of two mutually exclusive hypotheses. This binary structure is designed to mimic the logic of "proof by contradiction" found in mathematics.
The Null Hypothesis (H₀)
The Null Hypothesis represents the baseline assumption: that there is no relationship, no difference, or no effect. It is the "innocent until proven guilty" stance of the statistical world. We assume $H_0$ is true until the data provides overwhelming evidence to the contrary.
The Alternative Hypothesis (Hₐ)
The Alternative Hypothesis (sometimes denoted as $H_1$) is the claim the researcher hopes to support. It posits that an effect, difference, or relationship actually exists.
| Feature | Null Hypothesis ($H_0$) | Alternative Hypothesis ($H_a$) |
|---|---|---|
| Core Assumption | Status quo, no change, no effect. | There is an effect or change. |
| Mathematical Sign | Usually contains equality ($=, \leq, \geq$). | Usually contains inequality ($\neq, <, >$). |
| Burden of Proof | Assumed true by default. | Must be supported by evidence. |
| Goal of Test | To be rejected or "failed to be rejected." | To be supported via the rejection of $H_0$. |
The Principle of Falsification: In significance testing, we never "accept" the null hypothesis. We either reject it or fail to reject it. Failing to reject $H_0$ does not mean $H_0$ is true; it simply means the evidence was insufficient to prove it false.
The P-value: Quantifying Surprise
The P-value is perhaps the most critical—and most frequently misunderstood—metric in statistics. Formally, the P-value is the probability of obtaining a test statistic at least as extreme as the one observed, assuming that the null hypothesis is true.
Mathematically, if $T$ is the test statistic and $t_{obs}$ is the value calculated from our sample: $$P\text{-value} = P(|T| \geq |t_{obs}| \mid H_0)$$
A low P-value indicates that the observed data is highly unlikely under the assumption of the null hypothesis. It is a measure of the "strength of evidence" against $H_0$.
Common Misconceptions
- Misconception 1: A P-value of 0.05 means there is a 5% chance the null hypothesis is true. (False: The P-value describes the data, not the hypothesis).
- Misconception 2: A P-value of 0.05 means there is a 95% chance the alternative hypothesis is true. (False: This ignores prior probabilities).
- Misconception 3: A small P-value means the effect is large or important. (False: A tiny effect can have a tiny P-value if the sample size is large enough).
Significance Level (Alpha)
The Significance Level, denoted by $\alpha$, is the pre-determined threshold for rejecting the null hypothesis. It represents the maximum risk a researcher is willing to take of committing a Type I Error (rejecting $H_0$ when it is actually true).
The most common value for $\alpha$ is 0.05, meaning we require the evidence to be so strong that it would occur by chance only 5% of the time. However, $\alpha$ should be chosen based on the consequences of being wrong.
| Field | Typical $\alpha$ | Reasoning |
|---|---|---|
| Social Sciences | 0.05 | Standard balance of risk and discovery. |
| Manufacturing (Six Sigma) | 0.0027 | High cost of false alarms in production lines. |
| Genomics | $10^{-8}$ | Correcting for millions of simultaneous tests. |
| Particle Physics | $3 \times 10^{-7}$ | The "5-sigma" rule required to claim a discovery (e.g., Higgs Boson). |
Type I and Type II Errors
In a world of uncertainty, our decisions can be wrong in two distinct ways. Understanding the trade-off between these errors is the essence of experimental design.
Type I Error (False Positive)
A Type I Error occurs when we reject a null hypothesis that is actually true. We "find" an effect that isn't there. The probability of this error is exactly $\alpha$.
Type II Error (False Negative)
A Type II Error occurs when we fail to reject a null hypothesis that is actually false. We "miss" a real effect. The probability of this error is denoted by $\beta$.
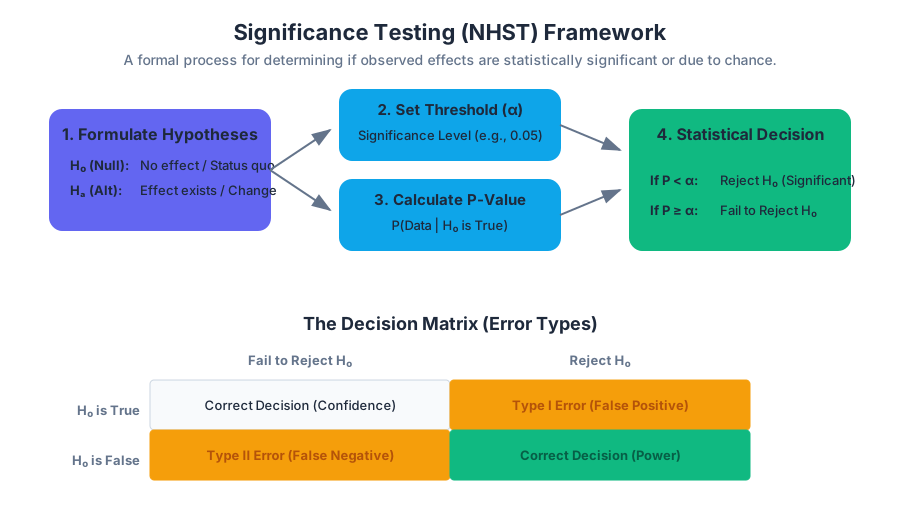
The Decision Matrix
| $H_0$ is True | $H_0$ is False | |
|---|---|---|
| Fail to Reject $H_0$ | Correct Decision (Confidence: $1-\alpha$) | Type II Error ($\beta$) |
| Reject $H_0$ | Type I Error ($\alpha$) | Correct Decision (Power: $1-\beta$) |
Statistical Power (1 - Beta)
Statistical Power is the probability that a test will correctly reject a false null hypothesis. In simpler terms, it is the sensitivity of the test—its ability to detect an effect if one truly exists.
A high-power test is one where the probability of a Type II error ($\beta$) is low. Most researchers aim for a power of at least 0.80 (80%).
Factors Influencing Power
- Sample Size ($n$): Larger samples reduce standard error, making it easier to detect effects.
- Effect Size ($\delta$): Large differences are easier to detect than subtle ones.
- Significance Level ($\alpha$): If you make $\alpha$ stricter (e.g., 0.01), power decreases because you require more evidence to reject $H_0$.
- Variance ($\sigma^2$): High noise in the data obscures the signal, reducing power.
Mathematical Derivation of the Z-Test Statistic
To understand how these variables interact, we look at the derivation of the Z-score for a sample mean:
\begin{aligned}
& \text{Standard Error (SE)} = \frac{\sigma}{\sqrt{n}} \\
& Z = \frac{\bar{x} - \mu_0}{SE} = \frac{\bar{x} - \mu_0}{\sigma / \sqrt{n}} \\
& \text{To reject } H_0 \text{ at } \alpha=0.05, \text{ we need: } |Z| > 1.96 \\
& \text{Power } (1-\beta) = P\left(Z > 1.96 - \frac{|\mu_a - \mu_0|}{\sigma / \sqrt{n}}\right)
\end{aligned}
This derivation shows that as $n$ increases, the denominator of the fraction decreases, which increases the overall value, thereby increasing the probability of exceeding the critical threshold (Power).
Worked Example: A/B Testing for Conversion Rates
Imagine an e-commerce company testing a new checkout button color. They want to know if the new color (Treatment) increases the conversion rate compared to the current color (Control).
Step 1: State Hypotheses
- $H_0: p_{new} = p_{old}$ (The conversion rates are the same)
- $H_a: p_{new} > p_{old}$ (The new color is better - One-tailed test)
Step 2: Choose Alpha We set $\alpha = 0.05$.
Step 3: Collect Data
- Control: $n=1000$, Conversions=100 ($10%$)
- Treatment: $n=1000$, Conversions=130 ($13%$)
Step 4: Calculate the Test Statistic (Z-test for proportions) Using the pooled proportion $p$: $$p = \frac{100+130}{1000+1000} = 0.115$$ $$SE = \sqrt{0.115 \times (1-0.115) \times (\frac{1}{1000} + \frac{1}{1000})} \approx 0.0143$$ $$Z = \frac{0.13 - 0.10}{0.0143} \approx 2.097$$
Step 5: Determine P-value and Decision A Z-score of 2.097 corresponds to a P-value of approximately 0.018. Since $0.018 < 0.05$, we reject the null hypothesis. The evidence suggests the new button color significantly improves conversion.
Common Pitfalls and the Replicability Crisis
Significance testing is a powerful tool, but it is often abused. The "Replicability Crisis" in science is largely attributed to the misuse of P-values.
1. P-Hacking (Data Dredging)
This involves running multiple tests on the same dataset and only reporting the ones that come up significant. If you run 20 different tests on random data, by definition, one of them is likely to have a P-value $< 0.05$ purely by chance.
2. Ignoring Effect Size
A result can be "statistically significant" but "practically useless." For example, a drug that lowers blood pressure by 0.1 mmHg might have a P-value of 0.0001 in a study of 1 million people, but it doesn't actually help the patient.
3. Confusing Correlation with Causation
Significance tests tell you if a relationship exists, not why it exists. Observational data can yield highly significant P-values for relationships driven by confounding variables.
4. The "File Drawer" Problem
Journals are more likely to publish studies with "significant" results. This leads to a biased body of literature where the 19 failed experiments are hidden in the file drawer, and only the 1 lucky "significant" result is published.
Summary of Test Selection
Choosing the right test is as important as interpreting the P-value. The choice depends on the data type and the number of groups.
| Data Type | Comparison | Statistical Test |
|---|---|---|
| Quantitative | 1 Group vs. Known Mean | One-sample T-test |
| Quantitative | 2 Independent Groups | Independent Samples T-test |
| Quantitative | 2 Related Groups (Before/After) | Paired T-test |
| Quantitative | 3+ Groups | ANOVA (Analysis of Variance) |
| Categorical | Observed vs. Expected Frequencies | Chi-Square Goodness of Fit |
| Categorical | Relationship between 2 variables | Chi-Square Test of Independence |
Source Materials
Study Statistics and Probability on Lykke
This course page is free to open: signed out, you can read its first two sections, and signing in, on any plan, opens the rest. The free Lykke Chrome extension syncs your own Canvas courses, so ChatGPT, Claude and Muse can answer from your classes and deadlines. It only reads Canvas.
Add the free extensionSign in to open every sectionAll sections of Statistics and Probability · Browse more course pages