From the free course Principles of Macroeconomics on Lykke
Market Mechanics and Macroeconomic Goals
Key concepts: Supply and Demand · GDP · Inflation · Unemployment
An exploration of how supply and demand interact and the primary metrics used to measure national economic health.
Market Mechanics and Macroeconomic Goals
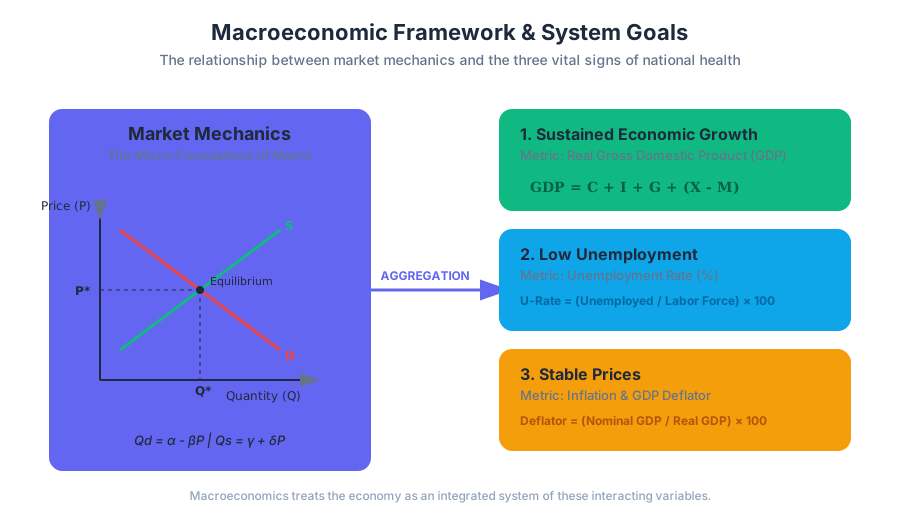
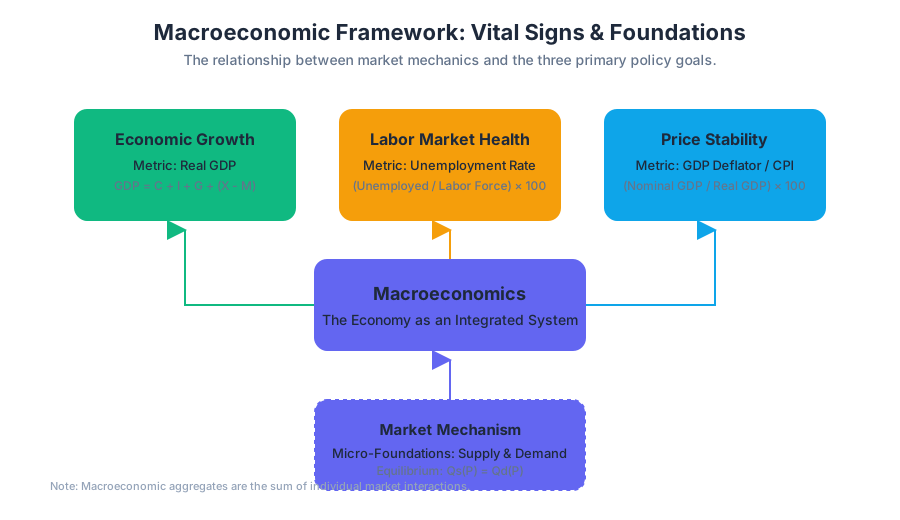
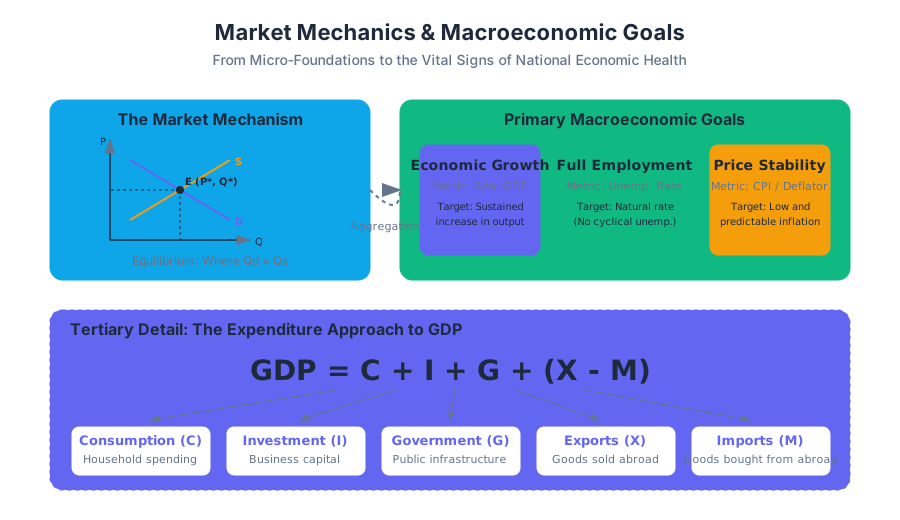
Macroeconomics is the study of the economy as an integrated system. Unlike microeconomics, which examines the decisions of individual agents, macroeconomics focuses on aggregate variables—the "vital signs" of a nation's health. To understand these signs, we must first master the underlying mechanics of market interaction and the specific metrics used to quantify progress toward three primary goals: sustained economic growth, low unemployment, and stable prices.
Supply and Demand: The Micro-Foundations of Macro
At the core of every macroeconomic aggregate lies the Market Mechanism, specifically the model of Supply and Demand. This model describes how the interaction between producers and consumers determines the Equilibrium Price ($P^$) and Equilibrium Quantity ($Q^$) of a good or service.
The Law of Demand and Supply
The Law of Demand states that, ceteris paribus (all other things being equal), as the price of a good increases, the quantity demanded decreases. Conversely, the Law of Supply posits that as the price increases, the quantity supplied increases.
Definition: Market Equilibrium A state where the quantity demanded ($Q_d$) equals the quantity supplied ($Q_s$). Mathematically, this is the intersection of the demand function $D(P)$ and the supply function $S(P)$.
Mathematical Derivation of Equilibrium
Consider a linear market model:
- Demand Function: $Q_d = \alpha - \beta P$
- Supply Function: $Q_s = \gamma + \delta P$
To find the equilibrium price ($P^$), we set $Q_d = Q_s$: $$\alpha - \beta P = \gamma + \delta P$$ $$\alpha - \gamma = P(\delta + \beta)$$ $$P^ = \frac{\alpha - \gamma}{\delta + \beta}$$
Once $P^$ is found, substitute it back into either equation to find $Q^$.
Worked Example: Solving a Market System
In a specialized labor market for software engineers, suppose:
- $Q_d = 500 - 5P$
- $Q_s = 100 + 3P$ (where $P$ is the hourly wage in dollars).
Setting them equal: $500 - 5P = 100 + 3P \implies 400 = 8P \implies P^* = 50$. The equilibrium quantity is $Q^* = 500 - 5(50) = 250$ engineers.
Gross Domestic Product (GDP): Measuring Economic Output
Gross Domestic Product (GDP) is the total market value of all final goods and services produced within a country's borders in a specific time period. It is the primary metric for Economic Growth.
The Expenditure Approach
The most common way to calculate GDP is the expenditure approach, which sums the spending of four sectors: $$GDP = C + I + G + (X - M)$$
| Component | Symbol | Description |
|---|---|---|
| Consumption | $C$ | Household spending on durable and non-durable goods and services. |
| Investment | $I$ | Business spending on equipment, structures, and changes in inventories. |
| Government | $G$ | Government spending on goods and services (excludes transfer payments). |
| Net Exports | $NX$ | Exports ($X$) minus Imports ($M$). |
Real vs. Nominal GDP
Nominal GDP measures output using current prices, while Real GDP adjusts for inflation by using constant prices from a base year. This distinction is critical: an increase in Nominal GDP could be caused by rising prices (inflation) rather than an increase in actual production.
The GDP Deflator The ratio of Nominal GDP to Real GDP, used to measure the level of prices of all new, domestically produced, final goods and services in an economy. $$GDP\ Deflator = \left( \frac{Nominal\ GDP}{Real\ GDP} \right) \times 100$$
Limitations of GDP
While a powerful metric, GDP has significant blind spots:
- Non-market transactions: Housework and volunteer work are excluded.
- The Underground Economy: Unreported income and illegal activities.
- Environmental Externalities: GDP counts the production of goods but ignores the pollution generated.
- Income Inequality: GDP per capita is an average and does not show how wealth is distributed.
Unemployment: The Human Capital Metric
The Unemployment Rate measures the health of the labor market. It represents the percentage of the labor force that is jobless, actively seeking work, and available to take a job.
Calculation and Definitions
The population is divided into three categories:
- Employed: Currently working for pay.
- Unemployed: Out of work but actively looking (within the last 4 weeks).
- Out of the Labor Force: Not working and NOT looking (students, retirees, discouraged workers).
$$Unemployment\ Rate = \frac{Unemployed}{Employed + Unemployed} \times 100$$
Types of Unemployment
Economic theory distinguishes between different causes of joblessness:
| Type | Cause | Economic Context |
|---|---|---|
| Frictional | Time spent searching for a job or transitioning between jobs. | Natural and healthy in a flexible economy. |
| Structural | Mismatch between worker skills and employer requirements. | Often caused by technological change or globalization. |
| Cyclical | Lack of aggregate demand during a recession. | The primary focus of stabilization policy. |
The Natural Rate of Unemployment
The Natural Rate of Unemployment ($u^*$) is the sum of frictional and structural unemployment. When the economy is at "Full Employment," cyclical unemployment is zero, but the natural rate remains.
% Mathematical representation of the Labor Force Participation Rate (LFPR)
LFPR = \frac{Labor\ Force}{Total\ Adult\ Population} \times 100

% Okun's Law: The relationship between unemployment and GDP growth
\frac{\Delta Y}{Y} = k - c \Delta u
% Where Y is output, u is the unemployment rate, and k, c are constants.
Inflation: The Stability of Value
Inflation is a general increase in prices and a corresponding fall in the purchasing power of money. It is not an increase in the price of a single good, but a rise in the overall price level.
Measuring Inflation: The Consumer Price Index (CPI)
The CPI is calculated by tracking the price of a "basket of goods" representing the average consumer's purchases.
- Select a Base Year: Assign it a value of 100.
- Calculate Basket Cost: $\sum (Price_i \times Quantity_i)$ for all items in the basket.
- Compute Index: $CPI_t = \frac{Cost\ in\ Year\ t}{Cost\ in\ Base\ Year} \times 100$.
- Calculate Inflation Rate: $\pi = \frac{CPI_t - CPI_{t-1}}{CPI_{t-1}} \times 100$.
The Quantity Theory of Money
Economists often explain long-run inflation using the Equation of Exchange: $$M \cdot V = P \cdot Y$$ Where:
- $M$ = Money Supply
- $V$ = Velocity of Money (how fast money changes hands)
- $P$ = Price Level
- $Y$ = Real Output (Real GDP)
If $V$ and $Y$ are relatively stable, an increase in $M$ (Money Supply) leads directly to an increase in $P$ (Inflation).
Inflation Indices Comparison
| Index | Scope | Primary Use |
|---|---|---|
| CPI | Consumer goods/services | Cost-of-living adjustments (COLAs). |
| PPI | Wholesale prices for producers | Early warning sign for future CPI changes. |
| PCE | Personal Consumption Expenditures | Preferred metric for the Federal Reserve. |
| Core Inflation | CPI minus Food and Energy | Measures underlying long-term trends. |
Synthesis: The Phillips Curve and Policy Trade-offs
The relationship between these goals is often characterized by trade-offs. The Phillips Curve historically suggested an inverse relationship between inflation and unemployment: as unemployment falls, inflation tends to rise (due to wage pressure).
The AD-AS Model
Macroeconomists use the Aggregate Demand (AD) and Aggregate Supply (AS) model to visualize these interactions.
- AD: Total spending in the economy at different price levels.
- AS: Total production in the economy at different price levels.
A shift in AD to the right (increased spending) increases GDP and reduces unemployment but puts upward pressure on prices (inflation). Conversely, a "Supply Shock" (like an oil price spike) can shift AS to the left, causing Stagflation—a nightmare scenario of both high inflation and high unemployment.
Summary of Macroeconomic Goals
| Goal | Ideal State | Metric | Primary Tool |
|---|---|---|---|
| Growth | 2-3% Annual Increase | Real GDP | Investment/Innovation |
| Low Unemployment | 4-5% (Natural Rate) | U-3 Rate | Labor Market Policy |
| Price Stability | 2% Target Inflation | CPI / PCE | Monetary Policy |
Common Pitfalls and Misconceptions
- Confusing Stock and Flow: GDP is a flow (measured over a year), while national wealth is a stock (measured at a point in time). A country can have high GDP but be depleting its wealth (natural resources).
- The "Lump of Labor" Fallacy: The incorrect belief that there is a fixed amount of work to be done. In reality, as the economy grows, new jobs are created, meaning technology does not inherently cause permanent unemployment.
- Inflation vs. Relative Price Changes: If the price of iPhones goes up but the price of Androids goes down, that is a relative price change, not inflation. Inflation is a simultaneous rise in the average of all prices.
- Real vs. Nominal Interest Rates: Borrowers and lenders must account for inflation. The Fisher Equation states: $r = i - \pi$ (Real interest rate = Nominal rate - Inflation). If you earn 5% interest but inflation is 6%, your purchasing power actually decreased by 1%.
Source Materials
Study Principles of Macroeconomics on Lykke
This course page is free to open: signed out, you can read its first two sections, and signing in, on any plan, opens the rest. The free Lykke Chrome extension syncs your own Canvas courses, so ChatGPT, Claude and Muse can answer from your classes and deadlines. It only reads Canvas.
Add the free extensionSign in to open every sectionAll sections of Principles of Macroeconomics · Browse more course pages