Principles Marketing
Institution: MIT
1 study materials · 4 sections
Principles of Marketing by OpenStax is a comprehensive, open-access textbook designed for undergraduate business students to build a foundational understanding of marketing theory and analysis. The course utilizes a modular approach and real-world scenarios to bridge the gap between theoretical concepts and practical application. As an Open Educational Resource (OER), it ensures that high-quality business education is accessible and affordable for a global audience. Students will explore the strategic processes involved in creating, communicating, and delivering value to customers in a competitive marketplace.
Course Sections
Foundations of Marketing and Value Creation
Key concepts: Value Proposition · Marketing Mix (4 Ps) · Marketing Ethics · Stakeholder Theory
An introduction to the core definitions of marketing, the evolution of marketing philosophy, and the central role of value creation for customers and stakeholders.
Foundations of Marketing and Value Creation
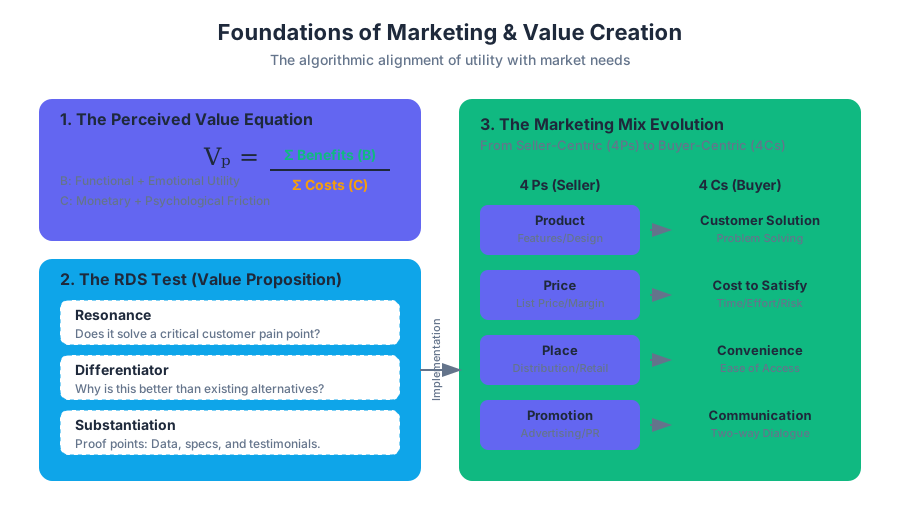
Marketing is the architectural framework through which organizations identify, create, communicate, and deliver value to a target audience. In a modern technical context, marketing is less about "persuasion" and more about value-matching: the algorithmic alignment of a solution's utility with a specific market's latent or active needs. It is a multi-disciplinary field that synthesizes psychology, economics, data science, and ethics to facilitate an exchange that leaves both the provider and the consumer better off.
1. The Value Proposition: The Core "Why"
At the heart of every marketing strategy lies the Value Proposition. This is a clear statement that explains how a product solves customers' problems or improves their situation (relevancy), delivers specific benefits (quantified value), and tells the ideal customer why they should buy from this provider and not from the competition (unique differentiation).
Definition: A Value Proposition is the full positioning of a brand—the full mix of benefits on which it is positioned. It is the answer to the customer’s question: "Why should I buy your brand rather than a competitor’s?"
1.1 The Value Equation
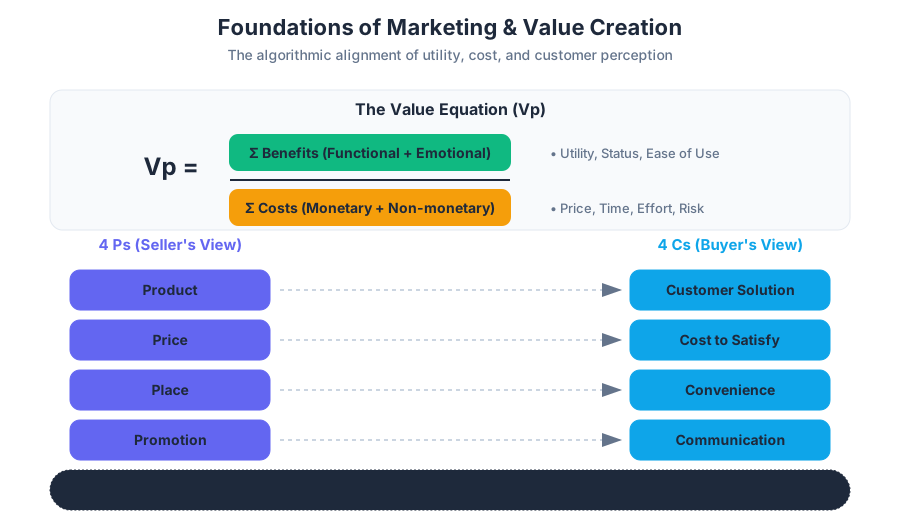
Mathematically, value is not an absolute number but a perceived ratio. We can represent it as:
$$V_{p} = \frac{\sum B_{functional} + \sum B_{emotional}}{\sum C_{monetary} + \sum C_{non-monetary}}$$
Where:
- $V_{p}$: Perceived Value
- $B$: Benefits (Utility, status, ease of use)
- $C$: Costs (Price, time, effort, psychological risk)
1.2 Components of a Strong Value Proposition
A robust value proposition must pass the "Resonance-Differentiator-Substantiation" (RDS) test:
| Component | Focus | Objective |
|---|---|---|
| Resonance | Customer Pain Points | Does this solve a problem the customer actually cares about? |
| Differentiator | Competitive Landscape | Is this significantly different or better than existing alternatives? |
| Substantiation | Proof Points | Can the claims be backed by data, testimonials, or technical specs? |
1.3 Pitfalls in Value Creation
A common mistake is the Product Myth: assuming that a superior technical product will automatically create value. Value is only realized when the product is mapped to a specific "Job to be Done" (JTBD). If the friction of adoption (cost) exceeds the perceived utility (benefit), the value proposition is effectively zero.
2. The Marketing Mix (The 4 Ps)
The Marketing Mix is the operational toolkit used by marketers to implement a strategy. Originally proposed by E. Jerome McCarthy in 1960, the 4 Ps provide a structured way to manage the variables of a market offering.
2.1 The Four Pillars
- Product: The tangible good or intangible service. This includes design, features, quality, and branding.
- Price: The amount a customer pays. This involves pricing strategy (skimming vs. penetration), discounts, and credit terms.
- Place: The distribution channels. How the product reaches the consumer (e-commerce, retail, wholesale).
- Promotion: The communication strategy. Advertising, public relations, social media, and direct sales.
2.2 Technical Implementation: Calculating Customer Lifetime Value (CLV)
To optimize the Marketing Mix, firms must understand the long-term value of the customers they are acquiring. The following Python implementation uses a simplified BG/NBD (Beta-Geometric/Negative Binomial Distribution) logic to estimate future transactions.
import numpy as np

def calculate_clv(average_order_value, purchase_frequency, churn_rate, profit_margin, discount_rate):
    """
    Calculates the simplified Customer Lifetime Value (CLV).

    Parameters:
    average_order_value (float): Mean revenue per transaction.
    purchase_frequency (float): Average transactions per customer per period (e.g., yearly).
    churn_rate (float): Probability of a customer stopping the relationship in a period.
    profit_margin (float): The percentage of revenue that is profit.
    discount_rate (float): The cost of capital (used to calculate Present Value).

    Returns:
    float: The estimated CLV.
    """
    # Customer Lifetime (Expected duration in periods)
    customer_lifetime = 1 / churn_rate

    # Total Revenue over lifetime
    total_revenue = average_order_value * purchase_frequency * customer_lifetime

    # Simple CLV calculation
    # CLV = (AOV * Frequency * Margin) / (Churn + Discount)
    clv = (average_order_value * purchase_frequency * profit_margin) / (churn_rate + discount_rate)

    return round(clv, 2)

# Example: SaaS Subscription Model
aov = 50.00         # $50 per month
freq = 12           # 12 months a year
churn = 0.05        # 5% annual churn
margin = 0.80       # 80% gross margin
discount = 0.10     # 10% annual discount rate

print(f"Projected CLV: ${calculate_clv(aov, freq, churn, margin, discount)}")
2.3 Evolution: From 4 Ps to 4 Cs
As marketing shifted from a production-centric to a customer-centric model, the 4 Ps were mirrored by the 4 Cs, focusing on the consumer's perspective.
| 4 Ps (Seller's View) | 4 Cs (Buyer's View) | Strategic Shift |
|---|---|---|
| Product | Customer Solution | Focus on solving a problem, not just features. |
| Price | Cost to Satisfy | Includes time, effort, and opportunity cost. |
| Place | Convenience | How easy is it to find and purchase? |
| Promotion | Communication | A two-way dialogue rather than a broadcast. |
3. Marketing Ethics and Social Responsibility
Marketing Ethics refers to the moral principles and values that govern the actions and decisions of marketers. In an era of big data and algorithmic targeting, ethics have moved from a "nice-to-have" to a core component of brand equity.
3.1 Ethical Frameworks
Marketers typically navigate three primary ethical lenses:
- Utilitarianism: The greatest good for the greatest number. (e.g., Is this data collection beneficial for the majority of users?)
- Deontology: Adherence to moral rules and duties regardless of the outcome. (e.g., "Never lie in an advertisement," even if it reduces sales.)
- Virtue Ethics: Focusing on the character of the marketer and the organization.
3.2 Common Ethical Dilemmas
- Data Privacy: The tension between personalization and surveillance.
- Vulnerable Populations: Targeting children or those with addictions (e.g., loot boxes in gaming).
- Greenwashing: Misleading consumers about the environmental benefits of a product.
3.3 The Triple Bottom Line (TBL)
Modern marketing ethics often integrates the TBL framework, which suggests that companies should be measured on three "Ps":
- Profit: Traditional financial performance.
- People: Social equity and fair labor practices.
- Planet: Environmental stewardship.
\text{Corporate Sustainability} = \int (\text{Economic Growth} + \text{Social Equity} + \text{Environmental Protection}) \, dt
4. Stakeholder Theory in Marketing
Stakeholder Theory, popularized by R. Edward Freeman, posits that a business's goal is to create value for all stakeholders, not just shareholders. In a marketing context, this means the strategy must account for the interests of employees, suppliers, customers, communities, and the environment.
4.1 Stakeholder Mapping
Marketers use stakeholder mapping to prioritize communication and value delivery.
| Stakeholder Group | Primary Interest | Marketing Impact |
|---|---|---|
| Customers | Product quality, fair pricing | Direct revenue, brand loyalty. |
| Employees | Job security, company reputation | Brand ambassadors, service quality. |
| Suppliers | Fair terms, long-term partnership | Supply chain stability, ethical sourcing. |
| Regulators | Compliance, consumer protection | Legal "license to operate," data usage. |
| Community | Environmental impact, philanthropy | Local brand perception, CSR. |
4.2 The Interconnectedness of Stakeholders
A failure to provide value to one stakeholder often cascades. For example, if a company exploits Suppliers (leading to poor quality), the Customers receive a sub-par Product, which damages the Brand Equity and eventually reduces Shareholder value.
5. The Evolution of Marketing Thought
Marketing has evolved through several distinct eras, reflecting changes in technology and social organization.
5.1 Historical Eras
- Production Era (Pre-1920s): "A good product will sell itself." Focus on manufacturing efficiency (e.g., Henry Ford’s Model T).
- Sales Era (1920s–1950s): Focus on aggressive selling and advertising to move oversupply.
- Marketing Concept Era (1950s–1990s): The "Customer is King." Focus on identifying needs before developing products.
- Relationship Era (1990s–Present): Focus on long-term engagement and Customer Relationship Management (CRM).
- Social/Mobile Era (2010s–Present): Real-time interaction, transparency, and social influence.
5.2 Technical Perspective: Marketing Data Schema
In the Relationship Era, marketing is managed via complex relational databases. Below is a conceptual SQL schema for a modern Marketing Automation platform.
-- Schema for a basic Marketing Attribution & Stakeholder Management System
CREATE TABLE stakeholders (
    stakeholder_id INT PRIMARY KEY,
    name VARCHAR(255),
    category ENUM('Customer', 'Supplier', 'Employee', 'Partner'),
    sentiment_score DECIMAL(3,2) -- Derived from NLP analysis of interactions
);

CREATE TABLE value_propositions (
    vp_id INT PRIMARY KEY,
    segment_name VARCHAR(100),
    core_benefit TEXT,
    differentiation_factor TEXT
);

CREATE TABLE marketing_interactions (
    interaction_id SERIAL PRIMARY KEY,
    stakeholder_id INT REFERENCES stakeholders(stakeholder_id),
    channel ENUM('Email', 'Social', 'Direct', 'Web'),
    cost_per_interaction DECIMAL(10,2),
    conversion_achieved BOOLEAN,
    timestamp TIMESTAMP DEFAULT CURRENT_TIMESTAMP
);

-- Query to calculate ROI per Channel
SELECT
    channel,
    COUNT(*) as total_interactions,
    SUM(CAST(conversion_achieved AS INT)) as total_conversions,
    SUM(cost_per_interaction) / NULLIF(SUM(CAST(conversion_achieved AS INT)), 0) as cost_per_acquisition
FROM marketing_interactions
GROUP BY channel;
6. Summary and Synthesis
The foundations of marketing represent a shift from transactional mechanics to relational value creation. By integrating the 4 Ps within an ethical framework and considering the needs of all stakeholders, organizations can build sustainable Value Propositions.
- Value is the numerator of the business equation; without it, no amount of promotion can sustain a brand.
- The Marketing Mix is the execution engine; it must be balanced and data-driven.
- Ethics and Stakeholders are the guardrails; they ensure that value creation does not come at the cost of social or environmental degradation.
Strategic Planning and Market Research
Key concepts: SWOT Analysis · Market Segmentation · Targeting and Positioning (STP) · Primary vs. Secondary Research
Focuses on the strategic planning process, environmental scanning, and the use of market research to inform business decisions.
Strategic Planning and Market Research
Strategic planning in marketing is the architectural process of aligning an organization’s internal capabilities with the external environment to achieve sustainable competitive advantage. It is not a static document but a dynamic feedback loop driven by rigorous data collection and analytical frameworks. At its core, the process seeks to answer three fundamental questions: Where are we now? Where do we want to go? How do we get there?
Environmental Scanning and SWOT Analysis
The first phase of strategic planning is Environmental Scanning, the systematic monitoring of the internal and external environments to identify early signs of opportunities and threats that may influence the organization's current and future plans. The primary tool for synthesizing this information is the SWOT Analysis.
Defining SWOT
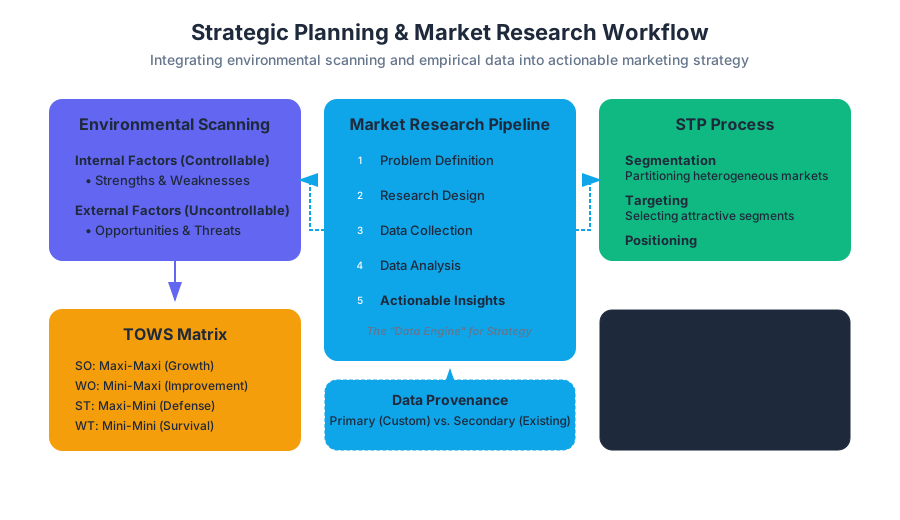
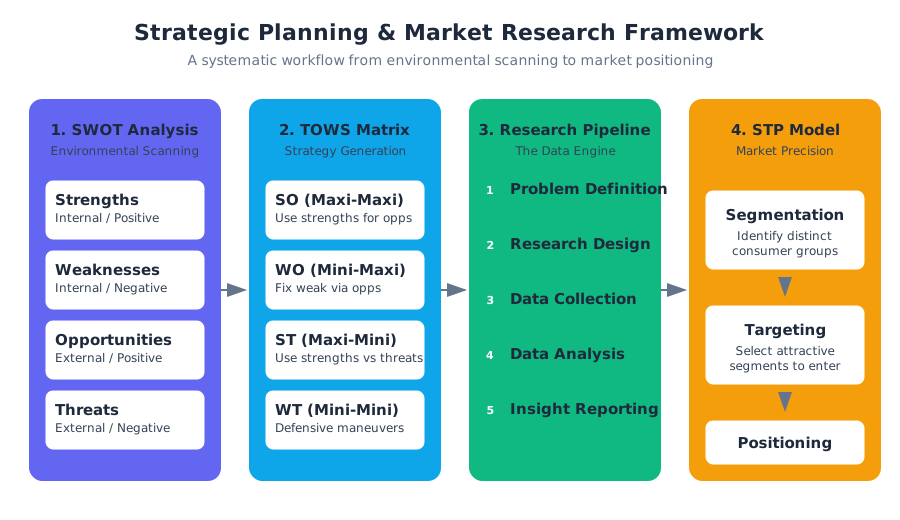
SWOT Analysis is a strategic framework used to evaluate the Strengths, Weaknesses, Opportunities, and Threats involved in a project or business venture. It categorizes factors into internal (controllable) and external (uncontrollable) origins.
| Factor Category | Origin | Nature | Description |
|---|---|---|---|
| Strengths | Internal | Positive | Core competencies, proprietary technology, brand equity, or human capital. |
| Weaknesses | Internal | Negative | Resource gaps, lack of expertise, poor location, or outdated infrastructure. |
| Opportunities | External | Positive | Market growth, technological shifts, regulatory changes, or competitor failure. |
| Threats | External | Negative | Economic downturns, new entrants, substitute products, or shifting consumer tastes. |
The TOWS Matrix: From Analysis to Strategy
A common pitfall in SWOT analysis is the "listing trap," where organizations simply list factors without deriving action. The TOWS Matrix (a variant of SWOT) addresses this by cross-referencing factors to generate four distinct strategic types:
- SO (Maxi-Maxi) Strategies: Using internal strengths to capitalize on external opportunities.
- WO (Mini-Maxi) Strategies: Overcoming internal weaknesses by exploiting external opportunities.
- ST (Maxi-Mini) Strategies: Utilizing strengths to avoid or mitigate external threats.
- WT (Mini-Mini) Strategies: Defensive tactics aimed at reducing internal weaknesses and avoiding external threats.
Market Research: The Data Engine
Market research is the systematic design, collection, analysis, and reporting of data relevant to a specific marketing situation. It serves as the empirical foundation for the STP process and SWOT analysis.
Primary vs. Secondary Research
The distinction between primary and secondary research is defined by the provenance and purpose of the data.
| Feature | Secondary Research | Primary Research |
|---|---|---|
| Definition | Data previously collected for other purposes. | Data collected specifically for the current problem. |
| Cost | Low to Moderate (often free). | High (requires design, labor, and tools). |
| Time | Immediate availability. | Lengthy collection and processing period. |
| Specificity | General; may not fit the specific problem. | Highly tailored to the research objectives. |
| Examples | Census data, industry reports, internal sales logs. | Focus groups, surveys, A/B testing, ethnographic study. |
The Research Process Pipeline
The execution of market research follows a rigorous scientific method:
- Problem Definition: Identifying the "decision problem" and translating it into a "research problem."
- Research Design: Determining the approach (Exploratory, Descriptive, or Causal).
- Data Collection: Executing the sampling plan and gathering raw data.
- Data Analysis: Cleaning, weighting, and analyzing data using statistical methods.
- Reporting: Translating findings into actionable business insights.
Implementation: Automated Data Collection
In modern marketing, primary research often involves digital behavioral tracking. Below is a low-level implementation of a Python-based scraper designed to gather "Secondary Data" from a competitor's public pricing page for benchmarking.
import requests
from bs4 import BeautifulSoup
import pandas as pd
import datetime

def fetch_competitor_pricing(url):
    """
    Scrapes pricing data for secondary research benchmarking.
    Implements error handling and structured data extraction.
    """
    headers = {'User-Agent': 'MarketResearchBot/1.0 (Strategic Analysis)'}
    try:
        response = requests.get(url, headers=headers, timeout=10)
        response.raise_for_status()

        soup = BeautifulSoup(response.text, 'html.parser')
        products = []

        # Assume products are in cards with class 'product-card'
        for card in soup.find_all(class_='product-card'):
            name = card.find('h2').get_text(strip=True)
            price = card.find(class_='price').get_text(strip=True)
            products.append({
                'timestamp': datetime.datetime.now(),
                'product_name': name,
                'price_raw': price,
                'source': url
            })

        return pd.DataFrame(products)
    except Exception as e:
        print(f"Critical failure in data acquisition: {e}")
        return None

# Usage in a strategic planning workflow
df = fetch_competitor_pricing("https://competitor-alpha.com/pricing")
The STP Process: Segmentation, Targeting, and Positioning
The STP Model represents the transition from a broad, "one-size-fits-all" approach to a precision-targeted strategy. It recognizes that markets are heterogeneous—composed of diverse consumers with varying needs.
1. Market Segmentation
Segmentation is the process of partitioning a large market into distinct subsets of consumers who share common characteristics and respond similarly to marketing stimuli.
Segmentation Variables:
- Geographic: Region, urban/rural, climate.
- Demographic: Age, income, gender, education, occupation.
- Psychographic: Lifestyle, personality, values (often measured via VALS framework).
- Behavioral: Usage rate, brand loyalty, benefits sought, readiness to buy.
Mathematical Basis for Segmentation
Segmentation often utilizes K-Means Clustering, where the goal is to minimize the within-cluster sum of squares (WCSS).
J = \sum_{i=1}^{k} \sum_{x \in S_i} ||x - \mu_i||^2
Where:
- $J$ is the objective function to minimize.
- $k$ is the number of clusters (segments).
- $S_i$ is the set of points in the $i$-th cluster.
- $\mu_i$ is the centroid (mean) of points in $S_i$.
2. Targeting
Once segments are identified, the firm must evaluate them and decide which to pursue. This is Targeting. A segment is "attractive" if it meets the MASA criteria:
- Measurable: Can we quantify the size and purchasing power?
- Accessible: Can we reach them through distribution and communication?
- Substantial: Is it large/profitable enough to justify the effort?
- Actionable: Can we actually design effective programs to attract them?
3. Positioning
Positioning is the act of designing the company’s offering and image to occupy a distinctive place in the mind of the target market. It is defined by the Value Proposition.
Perceptual Mapping
Marketers use Perceptual Maps to visualize how brands are perceived relative to competitors across two key dimensions (e.g., Price vs. Quality).
Advanced Targeting: SQL for Segment Extraction
In a real-world enterprise environment, targeting is performed by querying a Data Warehouse (e.g., Snowflake, BigQuery) to identify high-value segments based on Recency, Frequency, and Monetary (RFM) metrics.
-- Identifying the 'Champions' segment for a Targeting Campaign
-- Criteria: Top 20% in both Frequency and Monetary value
WITH CustomerMetrics AS (
    SELECT
        customer_id,
        COUNT(order_id) as frequency,
        SUM(total_spend) as monetary,
        MAX(order_date) as last_purchase_date
    FROM sales_warehouse.orders
    WHERE order_date >= DATE_SUB(CURRENT_DATE(), INTERVAL 1 YEAR)
    GROUP BY customer_id
),
RankedCustomers AS (
    SELECT
        customer_id,
        NTILE(5) OVER (ORDER BY frequency DESC) as freq_rank,
        NTILE(5) OVER (ORDER BY monetary DESC) as monetary_rank
    FROM CustomerMetrics
)
SELECT
    customer_id,
    'Champion' as segment_label
FROM RankedCustomers
WHERE freq_rank = 1 AND monetary_rank = 1;
Common Pitfalls in Strategic Planning
- The SWOT Hallucination: Listing "Strengths" that are actually just "Table Stakes" (features every competitor has). A true strength must be a Differential Advantage.
- Segmentation Over-Granularity: Creating segments so small that the cost of reaching them exceeds the potential revenue (violating the "Substantial" criteria).
- Positioning Drift: Attempting to be "everything to everyone," which results in a diluted brand image that resonates with no one.
- Confirmation Bias in Research: Designing survey questions that lead the respondent toward a desired answer rather than uncovering objective truth.
Research Configuration Example
To avoid bias and ensure data integrity, research parameters must be strictly defined. Below is a YAML configuration for a headless survey deployment tool.
survey_metadata:
  study_id: "STP-2024-Q3-ALPHA"
  methodology: "Double-Blind Quantitative"
  sampling:
    type: "Stratified Random"
    strata: ["Age", "Income_Bracket"]
    confidence_level: 0.95
    margin_of_error: 0.03
  logic_rules:
    - if: "respondent_age < 18"
      action: "terminate_with_disqualification"
    - if: "competitor_usage == 'None'"
      action: "skip_to_section_4"
  validation:
    min_time_on_page: 5 # seconds to prevent bot spam
    trap_questions: [2, 7] # consistency checks
Synthesis: The Strategic Loop
Strategic planning is not a linear path but a cycle. Market research informs the SWOT analysis; the SWOT analysis identifies the strategic direction; the STP process defines the execution focus; and the results of that execution are fed back into market research for the next planning cycle.
Organizations that master this loop can pivot faster than competitors because their decisions are rooted in data-driven positioning rather than executive intuition.
Consumer and Business Buyer Behavior
Key concepts: Consumer Decision-Making Process · B2B vs. B2C Marketing · Psychological Influences · Social Factors
An exploration of the psychological, social, and situational factors that influence how individuals and businesses make purchasing decisions.
Consumer and Business Buyer Behavior
Overview
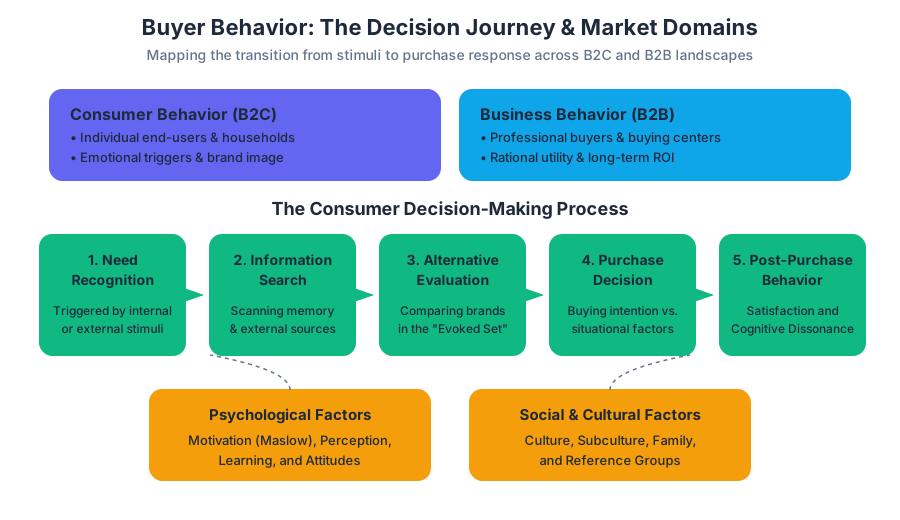
Buyer behavior is the study of the processes involved when individuals or groups select, purchase, use, or dispose of products, services, ideas, or experiences to satisfy needs and desires. In the modern marketing landscape, this field is divided into two primary domains: Consumer Buyer Behavior (B2C), which focuses on the individual end-user, and Business Buyer Behavior (B2B), which examines how organizations purchase goods and services for use in the production of other products or for resale.
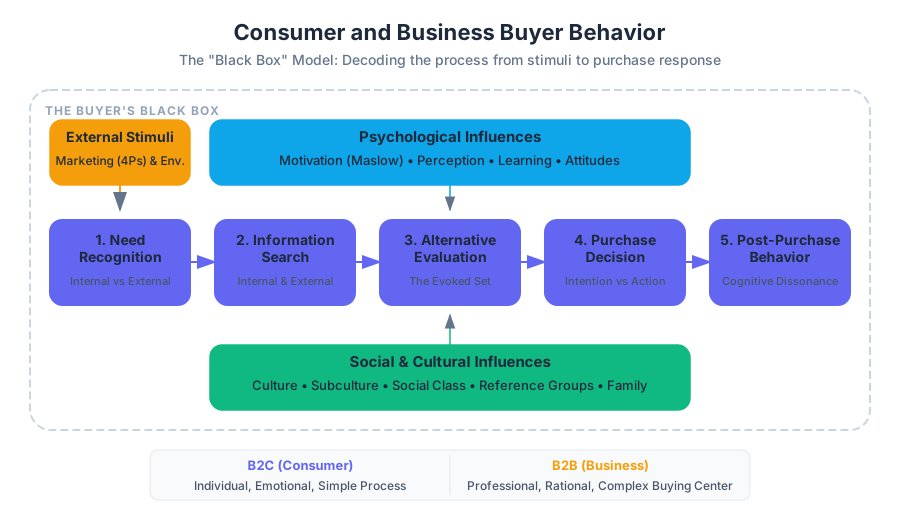
Understanding buyer behavior requires a multi-disciplinary approach, synthesizing insights from psychology, sociology, economics, and neuroscience. For the marketer, the goal is to decode the "Black Box" of the buyer—the internal mental processes that translate external stimuli into specific purchase responses.
The Consumer Decision-Making Process (CDMP)
The CDMP is a conceptual model describing the stages a consumer passes through when making a purchase. While the process is often depicted as linear, it can be cyclical or truncated depending on the consumer's level of involvement—the degree of personal relevance and risk associated with the item.
1. Need Recognition
The process begins when a consumer perceives a significant difference between their current state and a desired state. This is triggered by internal stimuli (hunger, thirst) or external stimuli (an advertisement, a friend’s new car).
2. Information Search
Once a need is recognized, the consumer seeks information to resolve it.
- Internal Search: Scanning memory for previous experiences or knowledge.
- External Search: Consulting personal sources (family), public sources (reviews), or marketer-dominated sources (websites).
3. Evaluation of Alternatives
The consumer processes information to arrive at a set of final brand choices, known as the Evoked Set. Marketers must understand the evaluative criteria—the specific attributes (price, quality, status) the consumer uses to compare products.
4. Purchase Decision
The consumer forms an intention to buy the most preferred brand. However, two factors can intervene between the intention and the actual purchase: the attitudes of others and unexpected situational factors (e.g., the product is out of stock).
5. Post-Purchase Behavior
The relationship with the customer does not end at the transaction. Marketers monitor Cognitive Dissonance—the psychological discomfort or "buyer's remorse" felt after a difficult purchase decision.
| Decision Type | Involvement Level | Information Search | Example |
|---|---|---|---|
| Routine Response | Low | Minimal / Internal | Milk, Toothpaste |
| Limited Decision Making | Medium | Moderate | Clothing, Small Appliances |
| Extensive Decision Making | High | Extensive / External | Home, Automobile, Education |
Implementation: Multi-Attribute Utility Model
To predict which product a consumer will choose, marketers often use a weighted scoring model. The following Python snippet demonstrates how a consumer might evaluate three smartphones based on weighted attributes.
import numpy as np

def evaluate_alternatives(brands, attributes, weights):
    """
    Simulates consumer choice using a Multi-Attribute Utility Model.

    Args:
        brands (list): List of brand names.
        attributes (np.array): Matrix of scores (0-10) for each brand across attributes.
        weights (np.array): Importance weight for each attribute (summing to 1.0).
    """
    # Calculate weighted scores for each brand
    scores = np.dot(attributes, weights)

    results = dict(zip(brands, scores))
    sorted_results = sorted(results.items(), key=lambda x: x[1], reverse=True)

    print("Consumer Evaluation Results:")
    for brand, score in sorted_results:
        print(f"Brand: {brand:10} | Utility Score: {score:.2f}")

    return sorted_results[0][0]

# Example Data
brand_names = ["Phone_A", "Phone_B", "Phone_C"]
# Attributes: [Camera Quality, Battery Life, Price (Affordability), Brand Prestige]
attribute_scores = np.array([
    [9, 6, 4, 9],  # Phone_A
    [7, 9, 7, 5],  # Phone_B
    [5, 5, 9, 3]   # Phone_C
])
# Consumer weights: Values Camera and Prestige highly
consumer_weights = np.array([0.4, 0.1, 0.2, 0.3])

winner = evaluate_alternatives(brand_names, attribute_scores, consumer_weights)
print(f"\nPredicted Purchase: {winner}")
Psychological Influences on Behavior
Psychological factors operate within the individual to determine how they perceive and react to marketing stimuli.
Motivation and Maslow’s Hierarchy
Motivation is the inner driving force that directs behavior toward goals. Abraham Maslow’s Hierarchy of Needs suggests that individuals seek to satisfy lower-level physiological needs before moving toward higher-level psychological needs (Safety, Social, Esteem, and Self-Actualization).
Perception
Perception is the process by which people select, organize, and interpret information. It is governed by three filters:
- Selective Attention: The tendency to screen out most information.
- Selective Distortion: Interpreting information in a way that supports existing beliefs.
- Selective Retention: Remembering only the good points of a favored brand and forgetting the good points of competitors.
Learning and Attitudes
Learning involves changes in behavior resulting from experience. Classical Conditioning (associating a brand with a positive stimulus) and Operant Conditioning (rewarding purchase via loyalty points) are common tactics. These lead to the formation of Attitudes—a person’s relatively consistent evaluations, feelings, and tendencies toward an object.
Social and Cultural Influences
Consumers do not make decisions in a vacuum; they are heavily influenced by their environment.
Definition: Reference Groups A reference group is any group that serves as a point of comparison or consultation for an individual in forming attitudes or behavior. This includes Membership Groups (direct influence), Aspirational Groups (groups the person wants to join), and Dissociative Groups (groups the person avoids).
Culture and Subculture
Culture is the most basic cause of a person's wants and behavior. It includes basic values, perceptions, and preferences learned from family and other institutions. Subcultures (nationalities, religions, racial groups, geographic regions) provide more specific identification for their members.
Social Class
Social classes are society's relatively permanent and ordered divisions whose members share similar values, interests, and behaviors. It is measured as a combination of occupation, income, education, and wealth.
Business Buyer Behavior (B2B)
B2B marketing involves selling goods or services to other businesses, governments, or institutions. While the core decision stages are similar to B2C, the complexity, scale, and logic differ significantly.
The Buying Center
Unlike B2C, where one person often decides, B2B decisions are made by a Decision-Making Unit (DMU) or Buying Center.
| Role | Function |
|---|---|
| Initiators | Recognize the need (e.g., a factory manager needing a new machine). |
| Users | Those who will actually work with the product. |
| Influencers | Technical personnel who help define specifications. |
| Deciders | Those with the formal or informal power to select suppliers. |
| Buyers | Those with formal authority to arrange terms of purchase. |
| Gatekeepers | Control the flow of information (e.g., purchasing agents, secretaries). |
B2B Demand Characteristics
- Derived Demand: Business demand ultimately comes from (is derived from) the demand for consumer goods. If consumer demand for cars drops, the demand for steel and tires drops.
- Inelastic Demand: Total demand for many business products is not affected much by price changes in the short run.
- Fluctuating Demand: Small changes in consumer demand can cause large changes in business demand (the Bullwhip Effect).
The Buygrid Framework
The complexity of the B2B process depends on the "Buyclass"—the novelty of the purchase.
| Buyclass | Complexity | Information Needs | Focus |
|---|---|---|---|
| Straight Rebuy | Low | Low | Efficiency / Automation |
| Modified Rebuy | Medium | Moderate | Comparison of specs/price |
| New Task | High | High | Problem solving / Trust |
Formalizing B2B Lead Scoring
In B2B, marketers use lead scoring to prioritize accounts. This can be expressed as a logical algorithm.
ALGORITHM LeadScoring(Account A):
    Score = 0

    // Firmographic Fit
    IF A.Industry == "Technology" THEN Score += 20
    IF A.Revenue > 100M THEN Score += 15
    IF A.EmployeeCount > 500 THEN Score += 10

    // Behavioral Signals
    Score += (A.WhitepaperDownloads * 5)
    Score += (A.WebinarAttendance * 10)
    Score += (A.PricingPageVisits * 15)

    // Intent Data
    IF A.SearchingForCompetitorKeywords == TRUE THEN Score += 25

    // Negative Constraints
    IF A.Unsubscribed == TRUE THEN Score = 0

    RETURN Score
END ALGORITHM
Comparing B2B vs. B2C Markets
The fundamental differences between these markets dictate different strategic approaches. B2C focuses on emotional triggers and mass media, while B2B focuses on relationship management and rational ROI.
| Feature | B2C (Consumer) | B2B (Business) |
|---|---|---|
| Market Structure | Many buyers, small purchases | Fewer but larger buyers |
| Buying Unit | Individual or family | Professional buying committees |
| Decision Process | Faster, more emotional | Slower, more formal/rational |
| Relationship | Impersonal / Transactional | Close, long-term relationships |
| Promotion | Advertising, Social Media | Personal selling, Trade shows |
| Pricing | List price, fixed | Negotiated, volume-based |
Data Modeling for B2B Relationships
In a B2B context, the database schema must account for the relationship between individuals (contacts) and organizations (accounts).
-- Schema for B2B Account-Based Marketing (ABM)
CREATE TABLE Accounts (
    account_id INT PRIMARY KEY,
    company_name VARCHAR(255),
    industry VARCHAR(100),
    annual_revenue DECIMAL(15, 2),
    tier ENUM('Strategic', 'Enterprise', 'Mid-Market')
);

CREATE TABLE Contacts (
    contact_id INT PRIMARY KEY,
    account_id INT,
    first_name VARCHAR(100),
    last_name VARCHAR(100),
    job_role ENUM('Decision Maker', 'Influencer', 'Gatekeeper', 'User'),
    email VARCHAR(255),
    FOREIGN KEY (account_id) REFERENCES Accounts(account_id)
);

CREATE TABLE Interactions (
    interaction_id INT PRIMARY KEY,
    contact_id INT,
    interaction_type VARCHAR(50), -- 'Email', 'Meeting', 'Demo'
    interaction_date TIMESTAMP,
    sentiment_score FLOAT, -- Derived from NLP on meeting notes
    FOREIGN KEY (contact_id) REFERENCES Contacts(contact_id)
);
Behavioral Analytics and Tracking
Modern marketers use event-driven architectures to track behavior in real-time. This allows for hyper-personalization and "Nudge" marketing.
Event Tracking Schema
To capture the "Information Search" and "Evaluation" phases, marketers define specific event schemas.
# Segment/Snowplow Event Definition for Behavior Tracking
event: "Product Viewed"
properties:
  product_id: "sku_99821"
  category: "Electronics > Laptops"
  price: 1299.00
  currency: "USD"
  referral_source: "google_search"
  user_segment: "high_intent_returning"
  session_id: "abc-123-xyz"
  timestamp: "2023-10-27T10:15:30Z"
  context:
    device: "Desktop"
    os: "macOS"
    browser: "Chrome"
Common Pitfalls in Buyer Behavior Analysis
- Over-Reliance on Rationality: Assuming consumers always act in their best economic interest. In reality, Heuristics (mental shortcuts) and emotions often dominate.
- Ignoring the Gatekeeper: In B2B, a marketer might convince the "User" but fail because they ignored the "Gatekeeper" (e.g., IT security or Procurement).
- The "Average Consumer" Fallacy: Designing for the average person often results in a product that appeals to no one. Segmentation is essential.
- Post-Purchase Neglect: Focusing entirely on the acquisition and ignoring the post-purchase phase, which is critical for Customer Lifetime Value (CLV).
Summary of Key Concepts
- CDMP: The 5-stage journey from need recognition to post-purchase evaluation.
- Involvement: The variable that determines the depth of the decision process.
- The Buying Center: The multi-stakeholder reality of B2B purchasing.
- Derived Demand: The link between B2B and B2C economic cycles.
- Perception Filters: How consumers selectively process marketing messages.
Integrated Marketing and Digital Trends
Key concepts: Integrated Marketing Communications (IMC) · Digital Marketing · Social Media Strategy · Marketing Analytics
Covers the execution of marketing campaigns through various channels, with a focus on digital transformation and integrated communications.
Integrated Marketing and Digital Trends
In the contemporary landscape of commerce, the boundary between "marketing" and "digital marketing" has effectively dissolved. Modern marketing is defined by the Integrated Marketing Communications (IMC) framework—a strategic approach that ensures all brand messaging, regardless of the medium, is consistent, synergistic, and customer-centric. This section explores the transition from fragmented promotional tactics to a unified digital ecosystem driven by data analytics and algorithmic precision.
Integrated Marketing Communications (IMC)
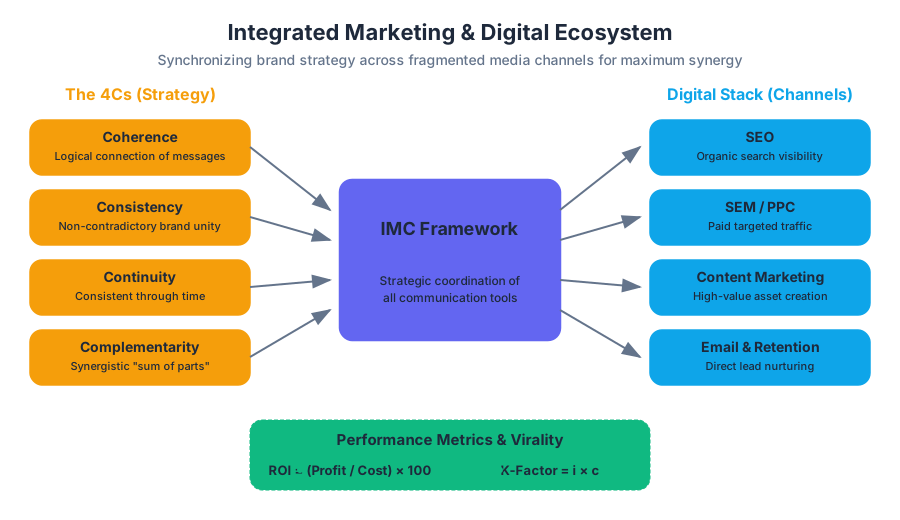
Integrated Marketing Communications (IMC) is the strategic coordination of all marketing communication tools, functions, and sources within an organization into a seamless program that maximizes the impact on consumers and other end users at a minimal cost.
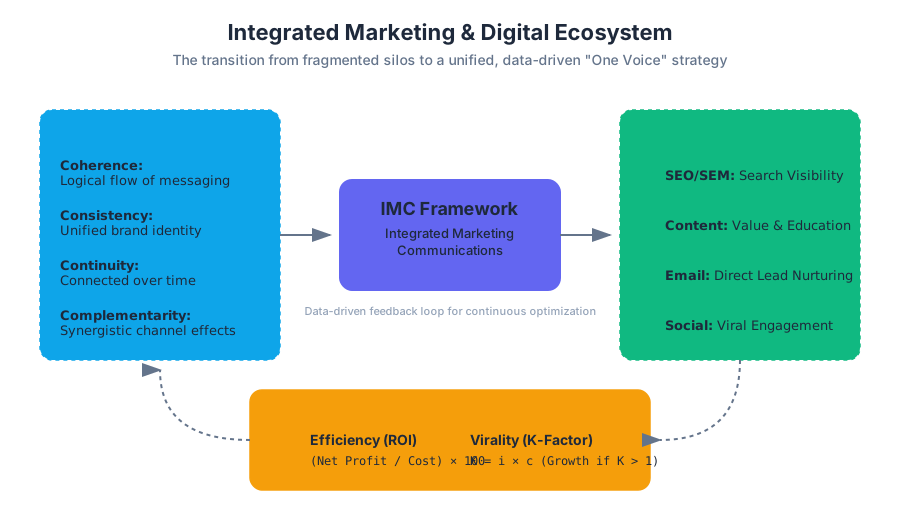
Historically, marketing departments operated in silos: the advertising team handled TV spots, the PR team handled press releases, and the digital team handled the website. IMC breaks these silos to ensure that the brand speaks with "one voice."
Definition: IMC is a planning process designed to assure that all brand contacts received by a customer or prospect for a product, service, or organization are relevant to that person and consistent over time.
The 4Cs of IMC
To move from a traditional mindset to an integrated one, marketers often shift from the 4Ps (Product, Price, Place, Promotion) to the 4Cs:
| Concept | Description | Focus |
|---|---|---|
| Coherence | Are the different communications logically connected? | Logical Flow |
| Consistency | Are the messages supporting each other without contradiction? | Brand Unity |
| Continuity | Is the communication connected and consistent through time? | Temporal Unity |
| Complementarity | Is the sum of all parts greater than the individual channels? | Synergistic Effect |
Why IMC Matters
The primary motivation for IMC is the fragmentation of media. In the 1970s, a brand could reach 80% of the population with three TV ads. Today, consumers are bombarded with thousands of messages daily across smartphones, tablets, smart TVs, and physical billboards. Without integration, the brand message becomes "noise." IMC solves the problem of message decay and cognitive dissonance in the consumer journey.
Digital Marketing Ecosystems
Digital Marketing encompasses all marketing efforts that use an electronic device or the internet. Unlike traditional marketing, digital marketing is inherently two-way, allowing for real-time feedback, precise targeting, and granular measurement.
Core Components of the Digital Stack
- Search Engine Optimization (SEO): The process of optimizing web content to rank higher in organic search engine results pages (SERPs).
- Search Engine Marketing (SEM): The use of paid advertising (PPC) to increase visibility within search engines.
- Content Marketing: The strategic creation of high-value assets (whitepapers, videos, blogs) to drive profitable customer action.
- Email Marketing: A direct-to-consumer channel used for lead nurturing and retention.
Technical Implementation: ROI Calculation
In digital marketing, the Return on Ad Spend (ROAS) and Return on Investment (ROI) are the primary north-star metrics. Below is a Python implementation of a marketing performance analyzer that calculates these metrics across different channels.
import pandas as pd

def analyze_marketing_performance(data):
    """
    Calculates ROI and ROAS for various marketing channels.
    Input: DataFrame with columns ['channel', 'spend', 'revenue', 'other_costs']
    """
    df = pd.DataFrame(data)

    # ROAS = Revenue / Ad Spend
    df['roas'] = df['revenue'] / df['spend']

    # ROI = (Net Profit / Total Cost) * 100
    # Net Profit = Revenue - (Ad Spend + Other Costs)
    df['net_profit'] = df['revenue'] - (df['spend'] + df['other_costs'])
    df['roi_percentage'] = (df['net_profit'] / (df['spend'] + df['other_costs'])) * 100

    # Sort by ROI to find the most efficient channel
    return df.sort_values(by='roi_percentage', ascending=False)

# Example Dataset
marketing_data = {
    'channel': ['Paid Search', 'Social Media', 'Email', 'Affiliate'],
    'spend': [12000, 8500, 1200, 5000],
    'revenue': [45000, 22000, 15000, 12000],
    'other_costs': [2000, 1500, 500, 1000]
}

performance_report = analyze_marketing_performance(marketing_data)
print(performance_report[['channel', 'roas', 'roi_percentage']])
Social Media Strategy and Virality
Social media strategy is the systematic approach to using social platforms to achieve business goals. It is not merely "posting content" but managing the Viral Loop—the mechanism by which a user's engagement leads to more users joining or engaging.
The Virality Formula
The success of a social strategy can often be modeled using the K-factor, a concept borrowed from epidemiology.
The K-Factor Theorem: $K = i \times c$ Where:
- $i$ = The number of invitations/shares sent by each user.
- $c$ = The conversion rate of each invitation (percentage of people who click/engage).
If $K > 1$, the content is growing exponentially (viral). If $K < 1$, the growth is sub-exponential and will eventually die out without further paid injection.
Platform Comparison Matrix
| Platform | Primary Demographic | Content Format | Marketing Strength |
|---|---|---|---|
| Professionals (25-55) | Text, Long-form, PDF | B2B Lead Gen, Thought Leadership | |
| Gen Z, Millennials | Visual, Short-form Video | Brand Lifestyle, Influencer Marketing | |
| TikTok | Gen Z, Gen Alpha | Lo-fi Vertical Video | Algorithmic Discovery, Virality |
| X (Twitter) | News Seekers, Tech | Real-time Text | PR, Customer Service, Real-time Trends |
Common Pitfalls in Social Strategy
- Chasing Vanity Metrics: Focusing on "Likes" or "Followers" rather than "Conversion Rate" or "Customer Lifetime Value (CLV)."
- Platform Agnosticism: Posting the exact same content to LinkedIn and TikTok. Each platform has a unique "cultural grammar" that must be respected.
- Ignoring the Feedback Loop: Social media is a two-way street. Brands that fail to engage in the comments section suffer from lower algorithmic reach.
Marketing Analytics and Attribution
Marketing analytics is the practice of measuring, managing, and analyzing marketing performance to maximize its effectiveness and optimize ROI. The central challenge in modern analytics is Attribution: determining which touchpoint in a customer's journey led to the conversion.
Attribution Models
In a typical journey, a customer might see a Facebook ad, later search for the product on Google, and finally click an email link to buy. Who gets the credit?
| Model | Description | Best For |
|---|---|---|
| First-Touch | 100% credit to the first interaction. | Brand Awareness campaigns. |
| Last-Touch | 100% credit to the final interaction. | Bottom-of-funnel conversion. |
| Linear | Equal credit to all touchpoints. | Long sales cycles (B2B). |
| Time Decay | Credit increases as it gets closer to the conversion. | Short, high-intent cycles. |
| Data-Driven | Uses ML to assign credit based on historical patterns. | Complex, multi-channel ecosystems. |
Data Integration via SQL
To perform advanced attribution, marketers must join web session data with CRM conversion data. Below is a SQL query illustrating a Last-Touch Attribution logic.
-- Identifying the last touchpoint before a conversion
WITH UserTouchpoints AS (
    SELECT
        s.user_id,
        s.channel,
        s.session_timestamp,
        c.conversion_id,
        c.revenue,
        ROW_NUMBER() OVER (PARTITION BY s.user_id ORDER BY s.session_timestamp DESC) as touchpoint_rank
    FROM web_sessions s
    JOIN conversions c ON s.user_id = c.user_id
    WHERE s.session_timestamp <= c.conversion_timestamp
)
SELECT
    channel,
    COUNT(conversion_id) as total_conversions,
    SUM(revenue) as attributed_revenue
FROM UserTouchpoints
WHERE touchpoint_rank = 1
GROUP BY channel
ORDER BY attributed_revenue DESC;
Customer Lifetime Value (CLV)
A critical extension of marketing analytics is shifting focus from a single transaction to the total value of a customer.
$$CLV = \sum_{t=1}^{n} \frac{(R_t - C_t)}{(1 + d)^t}$$
Where:
- $R_t$ = Revenue from the customer at time $t$.
- $C_t$ = Cost of serving the customer at time $t$.
- $d$ = Discount rate (cost of capital).
- $n$ = Total number of periods.
Emerging Trends in Digital Marketing
The landscape is currently undergoing a paradigm shift driven by privacy regulations and artificial intelligence.
1. The Cookieless Future
With the deprecation of third-party cookies (e.g., Google Chrome's Privacy Sandbox, Apple's ATT), marketers are losing the ability to track users across the web. This is forcing a return to First-Party Data strategies—collecting data directly from customers through newsletters, loyalty programs, and direct interactions.
2. Generative AI in Content Orchestration
AI is no longer just for data analysis; it is now for content creation. However, the "AI Paradox" suggests that as content becomes cheaper to produce, the value of human brand voice and unique insights increases.
3. Hyper-Personalization
Using real-time data to adjust the website experience for each visitor. This involves API calls to a Customer Data Platform (CDP) to fetch user segments and serve tailored content.
# Example: Fetching a user segment from a CDP API to personalize a web landing page
curl -X GET "https://api.cdp-provider.com/v1/users/user_88234/segments" \
     -H "Authorization: Bearer $MARKETING_API_KEY" \
     -H "Content-Type: application/json"

# Response might return: {"segments": ["high_value_shopper", "tech_enthusiast", "churn_risk_low"]}
Summary of Pitfalls and Best Practices
Marketing at scale is a balancing act between creative intuition and mathematical rigor.
Common Pitfalls
- The "Attribution Trap": Over-investing in "Last-Click" channels (like Search) because they look good in reports, while neglecting "Top-of-Funnel" channels (like Video) that actually feed the system.
- Data Silos: Having a CRM that doesn't talk to the Email platform, leading to customers receiving "Buy Now" emails for products they already purchased.
- Ignoring Privacy: Failing to comply with GDPR or CCPA, which can lead to massive fines and brand erosion.
Best Practices
- Test and Learn: Use A/B testing for every variable—headlines, images, send times, and landing page layouts.
- Omnichannel Consistency: Ensure that the "vibe" of a TikTok video matches the professional tone of the whitepaper it eventually leads to.
- Focus on Retention: It is 5-25x more expensive to acquire a new customer than to retain an existing one. Use analytics to identify churn signals before the customer leaves.
Source Materials
Study Principles Marketing with AI — Free on Lykke
Sign up for free to generate personalized flashcards, quizzes, and study guides from this course. Chat with an AI tutor that knows the material.
Get Started FreeView this course wiki on Lykke · Browse all public course wikis