From the free course pandas documentation on Lykke
Core Data Structures: Series and DataFrames
Key concepts: Series · DataFrame · Data Alignment · Index Labels · NaN handling
An in-depth look at the primary objects in pandas: the 1D Series and the 2D DataFrame.
Core Data Structures: Series and DataFrames
Pandas is the foundational library for data manipulation in the Python ecosystem, serving as the bridge between the raw computational power of NumPy and the structured requirements of relational databases and spreadsheets. At its heart, pandas provides two primary data structures: the Series and the DataFrame. These are not merely wrappers around arrays; they are sophisticated objects that integrate data storage, metadata (labels), and automatic alignment logic.
AI_SVGI_SVG## The Series: Labeled One-Dimensional Arrays
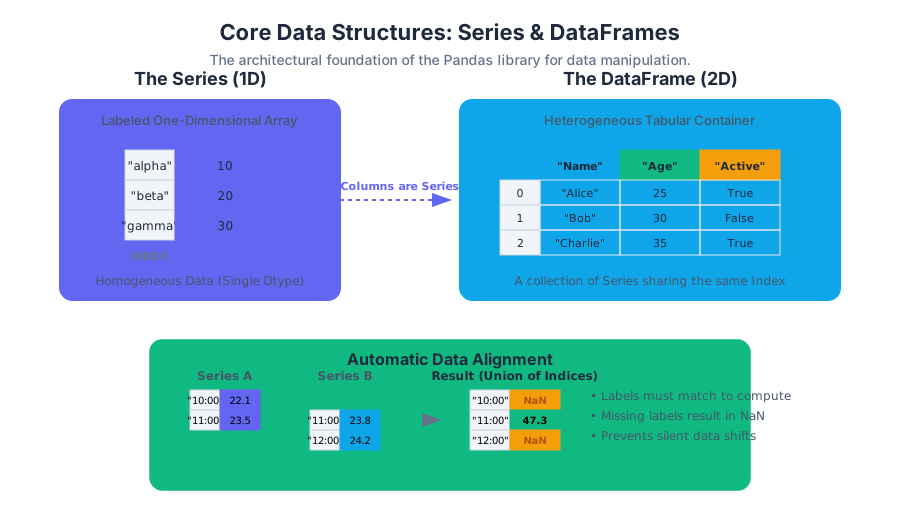
A Series is a one-dimensional ndarray with axis labels. While a NumPy array relies on integer-based positional indexing, a Series associates each element with a label, collectively known as the Index. Mathematically, a Series can be viewed as a mapping from a set of labels to a set of values.
Definition: A Series $S$ is a tuple $(V, I, \tau)$ where $V$ is an ordered collection of values, $I$ is an ordered set of unique (or non-unique) labels of the same length as $V$, and $\tau$ is the data type (dtype) of the elements in $V$.
Why the Series Matters
The Series solves the "context loss" problem inherent in standard arrays. In a raw array, the value 32.5 is just a float. In a Series, 32.5 can be associated with the label 2023-10-01, providing immediate temporal or categorical context. This labeling is the mechanism that enables Data Alignment, the most critical feature for handling real-world, "messy" data.
Implementation Mechanics
Internally, a Series stores its data in a contiguous block of memory (usually a NumPy ndarray or a specialized pandas ExtensionArray). The Index is maintained as a separate, highly optimized hash-map-like structure that allows for $O(1)$ lookups of values based on labels.
# Block 1: Low-level implementation and inspection
import numpy as np
import pandas as pd

# Creating a Series with explicit dtype and index
data = np.array([10, 20, 30], dtype=np.int64)
idx = ['alpha', 'beta', 'gamma']
s = pd.Series(data, index=idx, name="GreekData")

# Accessing the underlying memory and index structure
print(f"Dtype: {s.dtype}")
print(f"Values (NumPy): {s.values}")
print(f"Index object: {s.index}")

# Demonstration of label-based vs position-based access
# s.iloc[0] uses the integer offset; s.loc['alpha'] uses the hash map
assert s.iloc[0] == s.loc['alpha']

# Memory usage inspection
print(f"Memory usage (bytes): {s.memory_usage(deep=True)}")
The DataFrame: Heterogeneous Tabular Data
The DataFrame is a two-dimensional, size-mutable, and potentially heterogeneous tabular data structure. It is essentially a container for Series objects, where each Series represents a column. While the Series has one axis (the index), the DataFrame has two: the index (rows) and the columns.
Structural Properties
- Heterogeneity: Unlike a NumPy matrix, which requires a single dtype for the entire grid, a DataFrame allows each column to have a different dtype (e.g., one column of integers, one of strings, one of datetimes).
- Dual-Indexing: Operations can be performed along either axis (axis 0 for rows, axis 1 for columns).
- Dict-like Behavior: A DataFrame can be thought of as a
dictof Series objects, where the keys are column names.
| Property | Series | DataFrame |
|---|---|---|
| Dimensionality | 1D | 2D |
| Data Types | Single dtype per Series | Heterogeneous (per-column) |
| Primary Use | Vectorized sequences | Tabular datasets / SQL-like tables |
| Mutability | Value mutable | Value and Size mutable |
| Index | Single Index | Row Index + Column Index |
The "Tidy Data" Philosophy
Pandas encourages the "Tidy Data" structure, where:
- Each variable forms a column.
- Each observation forms a row.
- Each type of observational unit forms a table.
AI_DEMOI_DEMO## Data Alignment: The Killer Feature
Data alignment is the process by which pandas automatically matches data from different objects based on their labels during an operation. If you add two Series, pandas does not add them by position (like NumPy); it adds them by matching labels.
The Alignment Algorithm
When an operation is performed between two objects (e.g., $S_1 + S_2$):
- Union of Indices: Pandas computes the union of the indices of $S_1$ and $S_2$.
- Reindexing: Both objects are reindexed to this new union index.
- NaN Injection: Labels present in one object but not the other are filled with
NaN(Not a Number). - Vectorized Operation: The operation is performed on the aligned values.
% Block 2: Mathematical Derivation of Alignment
Let S_1 = { (l_i, v_i) } and S_2 = { (k_j, w_j) }
The result R = S_1 \oplus S_2 is defined as:

Index(R) = I_{S1} \cup I_{S2}

Value(R)_m =
\begin{cases}
v_m \oplus w_m & \text{if } m \in I_{S1} \cap I_{S2} \\
\text{NaN} & \text{otherwise}
\end{cases}
Worked Example of Alignment
Imagine two sensors recording temperatures at different times. Sensor A records at 10:00 and 11:00. Sensor B records at 11:00 and 12:00.
# Block 3: Real-world usage - Alignment in Action
s_a = pd.Series([22.1, 23.5], index=['10:00', '11:00'])
s_b = pd.Series([23.8, 24.2], index=['11:00', '12:00'])

# Adding these Series aligns them by timestamp
avg_temp = (s_a + s_b) / 2

print(avg_temp)
# Output:
# 10:00     NaN
# 11:00    23.65
# 12:00     NaN
# dtype: float64
This behavior prevents "silent errors" where data from different time points or categories are accidentally combined due to shifts in the data array.
Index Labels and Selection Logic
The Index is the most misunderstood component of pandas. It is not just a row counter; it is an immutable array acting as a metadata layer. Pandas provides several ways to access data, primarily through loc (label-based) and iloc (integer-position-based).
Indexing Methods Comparison
| Method | Access Type | Logic | Use Case |
|---|---|---|---|
.loc[] |
Label-based | Strict matching of index/column labels. | Production code, filtering by ID/Date. |
.iloc[] |
Position-based | 0-based integer indexing (like Python lists). | Programmatic loops, train/test splits. |
.at[] |
Label-based | Fast access for a single scalar value. | High-performance single-cell updates. |
[] |
Hybrid | Column selection or slicing. | Quick interactive exploration. |
Common Pitfall: The SettingWithCopyWarning
A common error for senior engineers is attempting to modify a subset of a DataFrame: df[df['A'] > 5]['B'] = 10. This often fails because df[df['A'] > 5] might return a view or a copy. Pandas cannot guarantee that the assignment will propagate back to the original DataFrame. The correct approach is always to use .loc: df.loc[df['A'] > 5, 'B'] = 10.
Handling Missing Data (NaN)
Pandas was one of the first libraries to treat missing data as a first-class citizen. It primarily uses np.nan (from the IEEE 754 floating-point specification) to represent missing values.
The Nature of NaN
NaNis a float. Therefore, an integer column containing aNaNwill be automatically cast tofloat64.NaN != NaN. This is a standard floating-point rule. To detect missing values, one must usepd.isna()orpd.isnull().- Propagation: In arithmetic,
5 + NaN = NaN. In aggregations (like.sum()), pandas defaults to ignoringNaN(treating it as 0 or simply skipping it), which differs from NumPy's default behavior.
Strategies for Missing Data
| Strategy | Method | Description |
|---|---|---|
| Detection | isna() / notna() |
Returns a boolean mask of missing values. |
| Removal | dropna() |
Removes rows or columns containing missing values. |
| Imputation | fillna() |
Replaces NaN with a scalar or a calculated value (mean/median). |
| Interpolation | interpolate() |
Fills NaN using linear, polynomial, or time-based logic. |
# Block 4: Edge cases and Nullable Types
# Traditional behavior: Integer column becomes float due to NaN
s_int = pd.Series([1, 2, None], dtype=object) # Forced to object or float
print(f"Traditional dtype with None: {pd.Series([1, 2, np.nan]).dtype}")

# Modern Pandas (1.0+): Nullable Integer Types
# Using the capital 'I' Integer dtype allows NaNs without casting to float
s_nullable = pd.Series([1, 2, None], dtype="Int64")
print(f"Nullable Integer dtype: {s_nullable.dtype}")
print(f"Is element 2 null? {s_nullable.isna()[2]}")

# Performance comparison: Vectorized fillna vs manual loop
# df.fillna(0) is orders of magnitude faster than iterating rows
Advanced Concept: MultiIndex (Hierarchical Indexing)
While DataFrames are 2D, the MultiIndex allows pandas to represent higher-dimensional data within a 2D structure. This is essentially "nesting" indices.
Why MultiIndex?
It allows for sophisticated "group-by" operations and data reshaping (pivoting). For example, a dataset tracking "Sales" across "Year" and "Region" can have a MultiIndex of ['Year', 'Region'].
Mechanics
A MultiIndex is stored as a list of levels (the unique labels for each level) and codes (integers mapping each position to a level label). This representation is extremely memory-efficient.
# Block 5: DevOps/Environment Setup for Pandas Performance
# High-performance pandas often requires specific C-extensions and engines
# Install pandas with performance extras:
pip install "pandas[performance, excel, parquet]"

# For faster I/O, ensure 'pyarrow' or 'fastparquet' is available
# For faster expression evaluation, 'numexpr' is recommended
pip install pyarrow numexpr

# Set environment variable to use the 'PyArrow' backed strings (Pandas 3.0+ default)
export PANDAS_USE_PYARROW=1
Summary of Best Practices
- Vectorization over Loops: Never iterate over a DataFrame with
for index, row in df.iterrows()unless absolutely necessary. Use vectorized Series operations. - Explicit Indexing: Use
.locand.ilocto avoid ambiguity andSettingWithCopywarnings. - Dtype Management: Downcast numeric types (
float64tofloat32) and usecategorydtypes for low-cardinality strings to save up to 90% memory. - Alignment Awareness: Always check indices before joining or adding Series to ensure you aren't creating unintended
NaNvalues.
AI_STUDY_GUIDEI_STUDY_GUIDE### Further Reading
- The "Tidy Data" paper by Hadley Wickham.
- Pandas Internals: The BlockManager vs. the new ArrayManager.
- IEEE 754 Floating-Point Standard and its implications for data science.
Source Materials
Study pandas documentation on Lykke
This course page is free to open: signed out, you can read its first two sections, and signing in, on any plan, opens the rest. The free Lykke Chrome extension syncs your own Canvas courses, so ChatGPT, Claude and Muse can answer from your classes and deadlines. It only reads Canvas.
Add the free extensionSign in to open every sectionAll sections of pandas documentation · Browse more course pages