From the free course pandas documentation on Lykke
Community Tutorials and Next Steps
Key concepts: Beginner-friendly tutorials · Real-world data examples · Diverse learning formats (cookbooks, workshops, videos)
A collection of tutorials, workshops, and articles created by the pandas community. These resources are aimed at new users and often use real-world datasets to demonstrate fundamental and advanced concepts in diverse formats.
Community Tutorials and Next Steps
The official pandas documentation provides a robust and comprehensive foundation for learning the library's API. It is the canonical source for syntax, parameters, and core functionality. However, mastering pandas—or any powerful tool—involves more than just memorizing function signatures. It requires developing an intuition for problem-solving, understanding idiomatic patterns, and learning to navigate the complexities of real-world, messy data. This is where the vibrant ecosystem of community-created tutorials, workshops, and articles becomes an indispensable resource for the aspiring data practitioner.
This section serves as a curated portal to that ecosystem. It moves beyond the "what" of the API to the "how" and "why" of its application. These resources, built by fellow users and experts, offer diverse perspectives, practical examples, and domain-specific insights that bridge the gap between theoretical knowledge and practical mastery. They demonstrate not just how to use a function, but how to think with data.
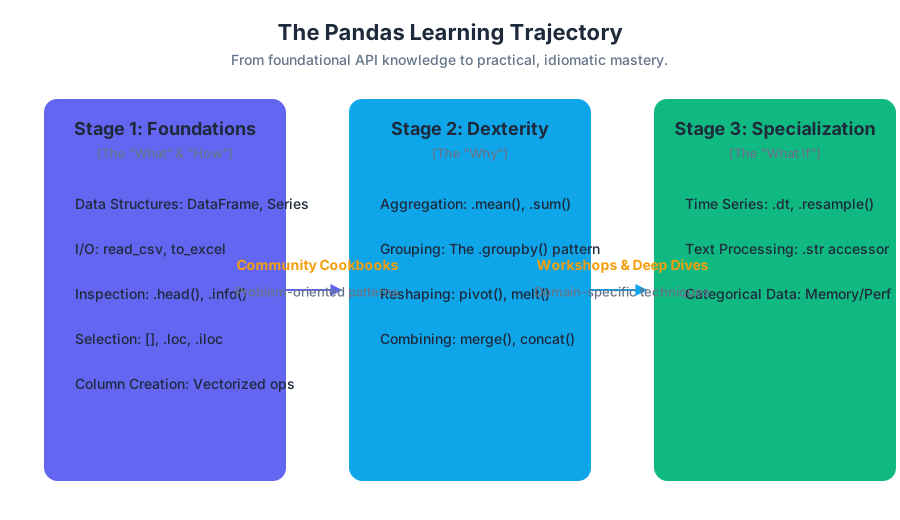
AI_SVGI_SVG## The Learning Trajectory: From Fundamentals to Mastery
The journey to pandas proficiency can be conceptualized as a series of stages, each building upon the last. Community resources are particularly valuable for accelerating the transition between these stages, providing context and motivation that documentation alone often cannot.
Stage 1: Foundational Fluency (The "What" and "How")
This initial stage is about building a core vocabulary and understanding the fundamental objects. The goal is to become comfortable with the basic mechanics of data manipulation.
Core Concepts:
- Data Structures: The
DataFrameas a 2D table and theSeriesas its 1D column counterpart.- I/O: Reading data from common formats like CSV (
pd.read_csv) and writing to formats like Excel (.to_excel).- Inspection: Basic examination of a
DataFrameusing.head(),.tail(),.info(), and.describe().- Selection: Subsetting data using column selection (
df['col']), conditional filtering (boolean indexing), and the primary accessors: label-based.locand integer-position-based.iloc.- Creation: Deriving new columns from existing ones through vectorized arithmetic operations.
At this stage, learning is focused on direct, single-step operations. Community tutorials often excel here by providing compelling, real-world datasets (like the Titanic or air quality data mentioned in the official guides) that make these initial steps more engaging than working with abstract, manually created tables.
Stage 2: Analytical Dexterity (The "Why")
Once the fundamentals are in place, the focus shifts to combining these building blocks to answer complex analytical questions. This is the heart of data analysis, where raw data is transformed into insight.
Core Concepts:
- Aggregation: Calculating summary statistics (
.mean(),.sum(),.count()) across an entire dataset or specific columns.- Grouping: The split-apply-combine pattern, implemented via the
.groupby()method, is arguably the most powerful concept in pandas. It allows for calculating statistics on a per-category basis.- Reshaping: Transforming the layout of data. This includes pivoting from a long format to a wide format (
.pivot()or.pivot_table()) and un-pivoting from wide to long (.melt()).- Combining: Merging and concatenating multiple
DataFrameobjects. This involvespd.concat()for stacking data andpd.merge()for database-style joins.
This stage is less about learning new functions in isolation and more about composing them into analytical pipelines. Community "cookbooks" and project-based tutorials are invaluable here, as they frame these operations within the context of a larger analytical goal.
Stage 3: Specialized Applications (The "What If")
With a solid grasp of general data manipulation, practitioners often need to develop expertise in specific domains. pandas has rich, specialized toolsets for common data types that go far beyond basic operations.
Core Concepts:
- Time Series: Handling date and time data, including parsing strings to datetime objects (
pd.to_datetime), using the.dtaccessor to extract components (year, month, weekday), and resampling data to different frequencies (.resample()).- Text Processing: Manipulating string data using the
.straccessor, which provides vectorized access to Python's string methods like.lower(),.contains(),.split(), and.replace().- Categorical Data: Using the
categorydata type for columns with a fixed, limited number of unique values to save memory and improve performance.
Workshops and deep-dive articles from the community are critical for this stage. They often focus on a single domain, such as financial time series analysis or natural language processing (NLP) preprocessing, showcasing advanced techniques and idiomatic patterns that are not immediately obvious from the API reference.
A Curated Guide to Community Resources
The landscape of community content is vast. Understanding the different formats and their strengths can help you choose the right resource for your learning goals.
Interactive Cookbooks: Problem-Oriented Learning
A cookbook is a collection of "recipes," where each recipe provides a step-by-step solution to a specific, practical problem. This format is highly effective for moving from Stage 1 to Stage 2, as it directly connects code to a tangible outcome.
- What It Is: A goal-oriented guide, often structured as a series of questions (e.g., "How do I find the top 3 items per category?"). Julia Evans's pandas cookbook is a classic example of this style.
- Why It Matters: Cookbooks teach patterns, not just functions. They help you recognize recurring analytical problems and map them to idiomatic pandas solutions. They are excellent for building a mental library of reusable code snippets.
- Concrete Example: A common and non-trivial task is to select the top N rows within each group defined by a categorical column. For example, finding the three most expensive products in each product category.
This problem requires a combination of .groupby() and a selection method. Here is a robust, real-world implementation in Python.
import pandas as pd
import numpy as np

# Create a realistic, non-trivial DataFrame
np.random.seed(42)
num_rows = 1000
data = {
    'category': np.random.choice(['Electronics', 'Apparel', 'Home Goods', 'Groceries'], num_rows),
    'product_id': [f'P{i:04d}' for i in range(num_rows)],
    'price': np.round(np.random.lognormal(mean=3.5, sigma=1.0, size=num_rows), 2),
    'stock_level': np.random.randint(0, 200, size=num_rows)
}
products_df = pd.DataFrame(data)

# --- The "Recipe": Find the top 3 most expensive products per category ---

# Method 1: Using sort_values() and groupby().head()
# This is intuitive and often sufficient for moderately sized data.
top_3_expensive_v1 = (
    products_df
    .sort_values(by=['category', 'price'], ascending=[True, False])
    .groupby('category')
    .head(3)
)

# Method 2: Using groupby().nlargest()
# This can be more performant as it avoids a full sort of the entire DataFrame.
# It performs a selection within each group.
top_3_expensive_v2 = (
    products_df
    .groupby('category', group_keys=False)
    .apply(lambda x: x.nlargest(3, 'price'))
)

# Method 3: A more modern approach with .nlargest() on the grouped object directly
# This is often the most efficient and idiomatic way.
top_3_expensive_v3 = products_df.groupby('category')['price'].nlargest(3).reset_index()
# This returns the indices, so we need to merge back to get full data
top_products_df = pd.merge(
    top_3_expensive_v3,
    products_df.drop('price', axis=1),
    left_on=['category', 'level_1'],
    right_on=['category', products_df.index.name or 'index']
).drop(columns=['level_1'])

print("--- Top 3 Expensive Products (Method 1: sort_values) ---")
print(top_3_expensive_v1)
This single problem highlights a key aspect of pandas: there are often multiple ways to achieve the same result, with different trade-offs in readability and performance. A good cookbook recipe not only provides a solution but often compares alternatives. This same problem is a classic in the database world, where it is typically solved using window functions.
-- SQL equivalent for finding the top 3 most expensive products per category
-- This uses a Common Table Expression (CTE) and the ROW_NUMBER() window function.

WITH RankedProducts AS (
    SELECT
        category,
        product_id,
        price,
        stock_level,
        ROW_NUMBER() OVER(PARTITION BY category ORDER BY price DESC) as price_rank
    FROM
        products
)
SELECT
    category,
    product_id,
    price,
    stock_level
FROM
    RankedProducts
WHERE
    price_rank <= 3;
Comparing the pandas and SQL approaches reveals deep parallels in data manipulation logic, reinforcing the underlying concepts of partitioning, ordering, and filtering.
| Method Comparison for Top-N-per-Group | Readability | Performance | Key Idea |
|---|---|---|---|
sort_values().groupby().head(N) |
High | Good (can be slow on huge data due to full sort) | Sort everything first, then take the top from each group. |
groupby().apply(lambda x: x.nlargest(N)) |
Medium | Variable (Python lambda overhead) | Apply a selection function to each group sub-frame. |
groupby().nlargest(N) |
High | Excellent | Uses optimized internal C-level implementation for selection. |
SQL ROW_NUMBER() |
High (for SQL users) | Excellent (in a database engine) | Assign a rank within each partition, then filter on rank. |
Deep-Dive Workshops and Video Series: Guided Exploration
Workshops and video tutorials offer a narrative-driven learning experience. They guide the user through a complete project, from data acquisition to final analysis or visualization, showing the thought process, debugging steps, and decision-making along the way.
- What It Is: A structured, multi-part educational series, often led by an instructor. Examples include conference tutorials (from PyCon, SciPy) or online courses.
- Why It Matters: This format excels at teaching workflow and context. You don't just see the final, polished code; you see the iterative process of building it. This is crucial for understanding how pandas fits into a larger data science pipeline.
- Concrete Example: A common workshop theme is building an end-to-end data cleaning pipeline. This typically involves steps that occur before pandas is even imported. A shell script might be used to orchestrate the initial stages.
#!/bin/bash

# --- Data Acquisition and Preparation Script ---
# This script demonstrates the steps before data even enters a Python environment.

# Set variables
DATA_URL="https://raw.githubusercontent.com/datasciencedojo/datasets/master/titanic.csv"
RAW_DIR="data/raw"
PROCESSED_DIR="data/processed"
FILENAME="titanic.csv"
RAW_FILE_PATH="$RAW_DIR/$FILENAME"

echo "--- Setting up directories ---"
mkdir -p $RAW_DIR
mkdir -p $PROCESSED_DIR

echo "--- Downloading Titanic dataset from $DATA_URL ---"
# Use curl to download the data, -s for silent, -o for output file
curl -s -o $RAW_FILE_PATH $DATA_URL

# Basic validation and inspection in the shell
echo "--- Basic file inspection ---"
if [ -f "$RAW_FILE_PATH" ]; then
    echo "File downloaded successfully."
    echo "First 5 lines of the raw data:"
    head -n 5 $RAW_FILE_PATH
    echo "Number of lines in the file (including header):"
    wc -l < $RAW_FILE_PATH
else
    echo "ERROR: File download failed."
    exit 1
fi

echo "--- Running the pandas cleaning script ---"
# Now, invoke the Python script that will use pandas to clean the data
# We pass the input and output paths as arguments for a robust pipeline
python scripts/clean_titanic.py --input_path $RAW_FILE_PATH --output_path $PROCESSED_DIR/cleaned_titanic.parquet

echo "--- Pipeline finished. Cleaned data is in $PROCESSED_DIR ---"
This script shows that a data analysis project is more than just a Jupyter Notebook. It involves orchestration, file management, and clear separation of raw and processed data—all concepts that a good workshop will emphasize.
| Typical Data Cleaning Workshop Curriculum | Key pandas Functions | Learning Objective |
|---|---|---|
| Module 1: Ingestion & Inspection | pd.read_csv, .info(), .describe(), .dtypes |
Load data correctly and perform an initial diagnostic assessment. |
| Module 2: Handling Missing Data | .isna(), .sum(), .dropna(), .fillna() |
Identify, quantify, and implement strategies for missing values (imputation, deletion). |
| Module 3: Data Type Correction | .astype(), pd.to_datetime, pd.to_numeric |
Ensure all columns are represented by the correct and most efficient data type. |
| Module 4: Outlier & Error Correction | Boolean indexing, .clip(), .loc |
Detect and handle anomalous or invalid data points. |
| Module 5: Text & Categorical Cleanup | .str accessor, .replace(), .map() |
Standardize string data (e.g., trim whitespace, fix casing) and encode categoricals. |
AI_DEMOI_DEMO### Articles and Blog Posts: Specialized Knowledge
While cookbooks solve common problems and workshops teach workflows, articles and blog posts are where the community shares deep, specialized knowledge. These are often written by advanced practitioners who have encountered and solved a particularly tricky problem.
- What It Is: A focused, in-depth written piece on a specific topic, such as performance optimization, a subtle aspect of the API, or a comparison with another library.
- Why It Matters: This is the frontier of community knowledge. It's where you learn about performance bottlenecks, memory management, and how to push the boundaries of what's possible with the library.
- Concrete Example: A frequent topic of advanced articles is memory optimization. A default
pd.read_csvoften uses far more memory than necessary by assigning genericint64,float64, andobjectdtypes. An expert-level article would demonstrate how to significantly reduce aDataFrame's memory footprint.
Here is a before-and-after code block demonstrating these optimization techniques.
import pandas as pd
import numpy as np

# Create a large, unoptimized DataFrame to simulate real-world data
num_rows = 5_000_000
data = {
    'user_id': np.random.randint(1, 100_000, size=num_rows),
    'product_category': np.random.choice(['CatA', 'CatB', 'CatC', 'CatD', 'CatE'] * 20, size=num_rows),
    'rating': np.random.randint(1, 6, size=num_rows),
    'price': np.random.uniform(10.0, 1000.0, size=num_rows).round(2),
    'country_code': np.random.choice(['US', 'GB', 'DE', 'FR', 'CA', 'JP'], size=num_rows)
}
df_unoptimized = pd.DataFrame(data)

# --- BEFORE: Check memory usage of the unoptimized DataFrame ---
mem_before = df_unoptimized.memory_usage(deep=True).sum() / 1024**2  # in MiB
print(f"--- Unoptimized DataFrame ---")
print(df_unoptimized.info(memory_usage='deep'))
print(f"\nInitial memory usage: {mem_before:.2f} MiB")

# --- AFTER: Apply memory optimization techniques ---
df_optimized = df_unoptimized.copy()

# 1. Downcast integer columns
df_optimized['user_id'] = pd.to_numeric(df_optimized['user_id'], downcast='integer')
df_optimized['rating'] = pd.to_numeric(df_optimized['rating'], downcast='integer')

# 2. Downcast float columns
df_optimized['price'] = pd.to_numeric(df_optimized['price'], downcast='float')

# 3. Convert object columns with low cardinality to 'category'
for col in ['product_category', 'country_code']:
    if df_optimized[col].nunique() / len(df_optimized[col]) < 0.5:
        df_optimized[col] = df_optimized[col].astype('category')

mem_after = df_optimized.memory_usage(deep=True).sum() / 1024**2
print(f"\n--- Optimized DataFrame ---")
print(df_optimized.info(memory_usage='deep'))
print(f"\nOptimized memory usage: {mem_after:.2f} MiB")

# --- Report the results ---
reduction = (mem_before - mem_after) / mem_before * 100
print(f"\nMemory reduction: {reduction:.2f}%")
This practical example provides a powerful lesson: understanding data types is not just an academic exercise; it has a direct and massive impact on performance and resource consumption, especially when working with large datasets.
Data Type Comparison: object vs. category |
object (String) |
category |
|---|---|---|
| Memory Storage | Stores a full Python string for each element. High memory usage. | Stores integer "codes" and a single lookup table (the "categories"). Very low memory for low-cardinality data. |
| Performance | Group-by and merge operations are string-based, which is computationally slow. | Operations are performed on the integer codes, which is extremely fast. |
| Use Case | High-cardinality text data (e.g., user comments, unique IDs). | Low-cardinality text data (e.g., country codes, status flags, product categories). |
| Common Pitfall | The default dtype for non-numeric columns from read_csv. Can silently consume vast amounts of RAM. |
Can cause issues if new, unseen categories are introduced without being added to the category list first. |
By engaging with these community resources, you not only learn the syntax of pandas but also the craft of data analysis. You learn to write code that is not only correct but also efficient, readable, and idiomatic, preparing you for complex, real-world data challenges.
Source Materials
Study pandas documentation on Lykke
This course page is free to open: signed out, you can read its first two sections, and signing in, on any plan, opens the rest. The free Lykke Chrome extension syncs your own Canvas courses, so ChatGPT, Claude and Muse can answer from your classes and deadlines. It only reads Canvas.
Add the free extensionSign in to open every sectionAll sections of pandas documentation · Browse more course pages