Interactive Demo
Data Ingestion & Memory Layout Visualizer
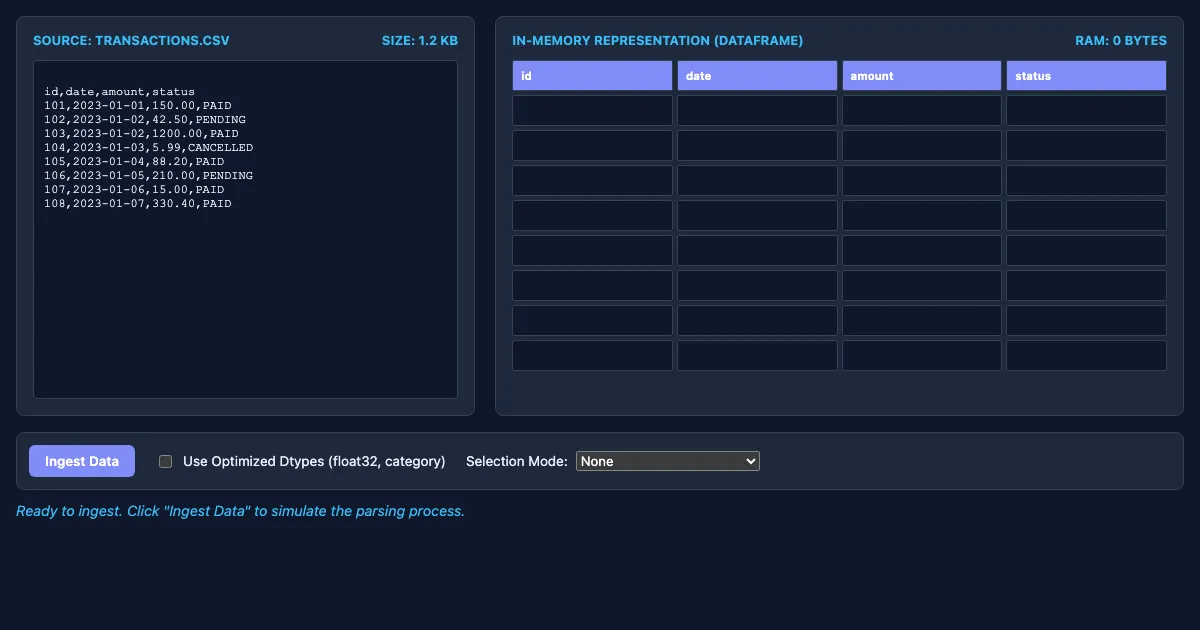
Data Ingestion & Memory Layout Visualizer is a free, interactive learning demo from the pandas documentation course on Lykke. It helps you build intuition for read_csv, read_excel, Boolean indexing, loc vs iloc. Play with it directly in your browser — it features 1 dropdown, 1 toggle and 1 button. Click "Ingest Data" to simulate the parsing process. This demo lives in the “Data Ingestion and Selection” section of the course.
How to use this demo
- Click "Ingest Data" to simulate the parsing process.
- Use the “Ingest Data” button to trigger actions or reset the demo.
- Pick an option from the dropdown to switch between scenarios.
- Toggle the checkboxes to show or hide layers and compare cases.
- Experiment freely — there's nothing to break, and every change is reversible.
What you'll explore
- read_csv
- read_excel
- Boolean indexing
- loc vs iloc
- isin
- notna
Frequently asked questions
What does the Data Ingestion & Memory Layout Visualizer demo do?
Techniques for reading data from external files and navigating through datasets using labels and positions. Data Ingestion & Memory Layout Visualizer turns that idea into something you can manipulate directly and watch respond.
What pandas documentation concept does Data Ingestion & Memory Layout Visualizer teach?
Techniques for reading data from external files and navigating through datasets using labels and positions. It focuses on read_csv, read_excel, Boolean indexing, loc vs iloc, isin, notna from the “Data Ingestion and Selection” section.
What can I control in Data Ingestion & Memory Layout Visualizer?
A dropdown switches between scenarios; toggles show or hide layers so you can compare cases; the “Ingest Data” button run actions or reset the demo. Every change updates the visualization in real time, so you can see exactly how each variable affects the outcome.
How does Data Ingestion & Memory Layout Visualizer fit into the pandas documentation course?
Pandas is the definitive open-source Python library for high-performance data analysis and manipulation, centered around its powerful DataFrame and Series structures. This documentation course covers the entire ecosyste… This demo is the interactive piece for the “Data Ingestion and Selection” section. Open the full pandas documentation course wiki at https://www.getlykke.com/explore/public/pandas-documentation-fd56bdc9-3ee0-47fa-b411-17a802c549ef for notes, flashcards, quizzes and the other demos.
What will I understand better after using Data Ingestion & Memory Layout Visualizer?
You'll build intuition for read_csv, read_excel, Boolean indexing, loc vs iloc, isin, notna — and, crucially, see how they behave when you change the inputs, which is hard to get from a textbook or lecture on pandas documentation alone.
From the pandas documentation course
This interactive demo is part of the Data Ingestion and Selection section. Explore the full pandas documentation course wiki on Lykke — with notes, flashcards, quizzes and more interactive demos.
Open the pandas documentation course →