Principles Microeconomics 3e
Institution: MIT
1 study materials · 4 sections
OpenStax provides high-quality, peer-reviewed textbooks at no cost to students, aiming to increase the accessibility and affordability of higher education. This course focuses on the 'Principles of Microeconomics 3e,' a comprehensive introductory resource that balances economic theory with real-world applications. The curriculum emphasizes diverse perspectives and utilizes modern digital tools like OpenStax Assignable for seamless classroom integration.
Course Sections
Open Education and Accessibility
Key concepts: Creative Commons Attribution License · Peer-Reviewed Educational Resources · Educational Affordability
An introduction to the OpenStax mission and the legal framework of Creative Commons licensing that makes free education possible.
Open Education and Accessibility
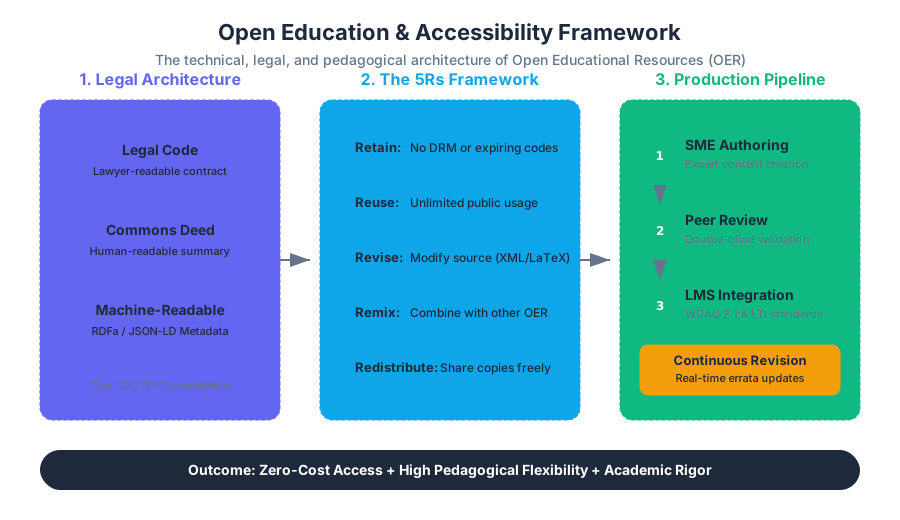
The landscape of higher education is undergoing a fundamental shift from a proprietary, "closed-source" model of knowledge distribution to an open-access framework. At the center of this transition is the concept of Open Educational Resources (OER)—teaching, learning, and research materials that reside in the public domain or have been released under an intellectual property license that permits their free use and re-purposing by others.
The OpenStax initiative, based at Rice University, represents the vanguard of this movement. By synthesizing rigorous academic standards with the legal flexibility of the Creative Commons Attribution License (CC BY), OpenStax addresses the dual crises of educational affordability and pedagogical rigidity. This article explores the technical, legal, and economic architectures that make open education possible, focusing on the mechanisms of peer review, the mechanics of open licensing, and the integration of these resources into modern Learning Management Systems (LMS).
The Creative Commons Attribution License (CC BY)
The Creative Commons Attribution License (CC BY) is the most permissive of the six standard Creative Commons licenses. It serves as the legal backbone for the OER movement by decoupling the right to use content from the requirement to pay for it, while still preserving the author's moral right to credit.
The Legal Architecture of CC BY
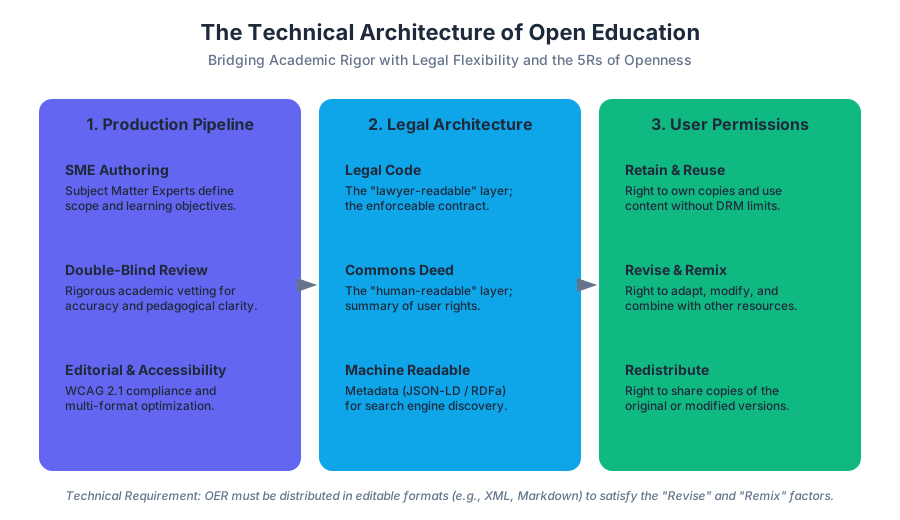
Unlike traditional "All Rights Reserved" copyright, which functions as a default "No" to any use, CC BY functions as a "Yes, provided that..." The license is built on a three-layer design:
- Legal Code: The "lawyer-readable" layer that contains the actual enforceable contract.
- Commons Deed: The "human-readable" layer that summarizes the key terms (Attribution).
- Machine-Readable: A CC REL (Rights Expression Language) metadata layer that allows search engines and software to identify the license automatically.
The 5Rs of Openness
To be considered truly "Open," a resource must facilitate the 5Rs, a framework developed by David Wiley to define the degrees of freedom granted to the user:
| R-Factor | Definition | Technical Implication |
|---|---|---|
| Retain | The right to make, own, and control copies of the content. | No "Digital Rights Management" (DRM) or expiring access codes. |
| Reuse | The right to use the content in a wide range of ways (e.g., in a class, on a website). | Content can be hosted on local servers or offline devices. |
| Revise | The right to adapt, adjust, modify, or alter the content itself. | Source files (e.g., LaTeX, Markdown, XML) must be available. |
| Remix | The right to combine the original or revised content with other material. | Interoperability between different CC-licensed works. |
| Redistribute | The right to share copies of the original content, your revisions, or your remixes. | Permission to host mirrors or distribute via USB/Print. |
Key Insight: The "Revise" and "Remix" capabilities are what distinguish OER from "Free-to-Read" resources. A PDF that is free to download but illegal to modify is not OER; it is merely a zero-cost proprietary asset.
Metadata Implementation
In a technical context, CC BY is often implemented via RDFa or JSON-LD to ensure that the license is discoverable by web crawlers.
{
  "@context": "https://schema.org/",
  "@type": "Book",
  "name": "Principles of Microeconomics 3e",
  "author": "OpenStax",
  "license": "https://creativecommons.org/licenses/by/4.0/",
  "publisher": {
    "@type": "Organization",
    "name": "Rice University"
  },
  "isAccessibleForFree": "True",
  "educationalLevel": "College/University"
}
Peer-Reviewed Educational Resources
A common critique of free online content is the perceived lack of quality control. OpenStax mitigates this by applying the Peer-Review model—traditionally used in academic journals—to the production of introductory textbooks.
The OpenStax Workflow
The production of a resource like Principles of Microeconomics 3e follows a rigorous pipeline that mirrors the complexity of commercial publishing but operates with the goal of public benefit rather than profit maximization.
- Scope and Sequence Development: Subject matter experts (SMEs) define the learning objectives to ensure alignment with standard curriculum requirements.
- Authoring: Experts write the initial draft, ensuring that "Diverse Economic Perspectives" are integrated rather than added as an afterthought.
- Double-Blind Peer Review: Multiple reviewers evaluate the manuscript for accuracy, pedagogical clarity, and bias.
- Editorial Refinement: Professional editors ensure a consistent voice and adherence to accessibility standards (e.g., WCAG 2.1).
- Continuous Revision: Unlike static print editions, digital OER can be updated "in-place" to correct errata or reflect new economic data.
Comparison: Traditional vs. Open Peer Review
| Feature | Traditional Publishing | OpenStax OER Model |
|---|---|---|
| Incentive Structure | Royalties and sales volume. | Grant funding and institutional support. |
| Update Cycle | 3–5 years (New editions forced for profit). | Continuous (Errata corrected in real-time). |
| Reviewer Profile | Often anonymous, internal. | Transparent list of contributors/reviewers. |
| Accessibility | Proprietary formats (e.g., VitalSource). | Multi-format (Web, PDF, EPUB, Print). |
Educational Affordability and the Access Gap
Educational Affordability is not merely a financial metric; it is a pedagogical one. When the cost of a textbook exceeds $200, a significant percentage of students attempt to complete the course without the material, leading to higher DFW (Drop, Fail, Withdraw) rates.
The Economics of the "First-Day Access"
In the traditional model, students often wait for financial aid disbursements to purchase books, missing the first 2–3 weeks of reading. OER provides First-Day Access, ensuring that the "Access Gap" is zero.
Case Study: Principles of Microeconomics 3e
The third edition of Principles of Microeconomics by OpenStax provides a comprehensive look at market forces, labor markets, and international trade. By being free, it eliminates the "asymmetric information" problem where students don't know the value of the book until they have already paid for it.
Theorem of Educational Elasticity: As the price of required course materials ($P_m$) approaches zero, the probability of student engagement ($E_s$) increases non-linearly, particularly for students in lower-income deciles.
Technical Integration and LMS Interoperability
For OER to be effective in a modern university, it must integrate seamlessly with the Learning Management System (LMS) like Canvas, Moodle, or Blackboard. OpenStax achieves this through OpenStax Assignable.
LTI (Learning Tools Interoperability)
OpenStax uses the LTI standard to allow its content and assessment tools to "talk" to the LMS. This allows for:
- Single Sign-On (SSO): Students don't need a separate account.
- Gradebook Sync: Scores from OpenStax assessments automatically populate the instructor's gradebook.
- Deep Linking: Instructors can link directly to specific chapters or sections within the LMS modules.
Implementation Example: LTI Launch Request
When a student clicks on an OpenStax link in Canvas, a POST request is sent to the OpenStax tool provider.
# Conceptual LTI 1.3 Launch Request (Simplified)
curl -X POST https://assignable.openstax.org/launch \
  -H "Content-Type: application/x-www-form-urlencoded" \
  -d "iss=https://canvas.instructure.com" \
  -d "login_hint=user_id_12345" \
  -d "target_link_uri=https://openstax.org/books/microeconomics-3e/" \
  -d "lti_message_hint=eyJhY2Nlc3NfdG9rZW4iOiAiYmFyIn0="
Diverse Economic Perspectives in OER
One of the most significant advantages of the CC BY license is the ability to localize and diversify content. Traditional textbooks often present a monolithic view of economic theory. OpenStax's Principles of Microeconomics 3e explicitly incorporates diverse perspectives, including:
- Behavioral Economics: Moving beyond the "rational actor" model.
- Environmental Economics: Integrating externalities and sustainability.
- Global Context: Using examples from emerging markets, not just the US/EU.
The "Remix" as a Tool for Inclusion
Because the license allows for revision, a professor in South Africa can take the OpenStax Microeconomics book and replace US-centric examples (like the Federal Reserve) with local examples (the South African Reserve Bank) without seeking permission. This ensures the material is culturally and contextually relevant.
Mathematical Representation of Market Equilibrium
In the textbook, the core concepts are presented with mathematical rigor. For instance, the equilibrium where Quantity Supplied ($Q_s$) equals Quantity Demanded ($Q_d$) is derived as follows:
\begin{aligned}
Q_d &= a - bP \\
Q_s &= c + dP \\
\text{At Equilibrium: } Q_d &= Q_s \\
a - bP &= c + dP \\
a - c &= (b + d)P \\
P^* &= \frac{a - c}{b + d}
\end{aligned}
This level of detail ensures that "free" does not mean "simplified." The academic rigor is maintained while the financial barrier is removed.
Common Pitfalls and Misconceptions
- "OER is just a PDF": While many OERs are distributed as PDFs, true OER is a philosophy of access. A PDF that cannot be edited or that is hosted behind a paywall is not OER.
- The "Quality-Price" Fallacy: The assumption that if a resource is free, it must be low quality. Peer-reviewed OER like OpenStax often undergoes more rigorous vetting than commercial books, which are sometimes rushed to market to meet sales cycles.
- Licensing Confusion: Users often confuse CC BY (Attribution) with CC BY-NC (Non-Commercial). OpenStax uses CC BY, meaning you can actually sell the book (e.g., a bookstore selling a printed copy for the cost of ink and paper).
Summary of Educational Affordability Metrics
| Metric | Traditional Model | OER Model (OpenStax) |
|---|---|---|
| Average Cost per Student | $100 - $300 | $0 (Digital) / ~$30 (Print) |
| Access Date | Day 10 - 20 (Post-purchase) | Day 1 |
| Long-term Access | Ends after semester (Rental/Access Code) | Perpetual |
| Customizability | Zero (Copyright restricted) | High (CC BY licensed) |
Principles of Microeconomics 3e
Key concepts: Principles of Microeconomics 3e · Economic Theory · Introductory College-Level Economics
A deep dive into the core textbook for this course, covering its structure and approach to introductory economic theory.
Principles of Microeconomics 3e
The third edition of Principles of Microeconomics represents a significant evolution in introductory economic pedagogy. Published by OpenStax, this peer-reviewed resource adheres to a rigorous academic standard while embracing the Creative Commons Attribution License (CC-BY), ensuring that high-level economic theory remains accessible to a global audience. Unlike traditional static textbooks, the 3e revision integrates modern data sets, diverse economic perspectives (including behavioral and institutional economics), and seamless LMS Integration via OpenStax Assignable.
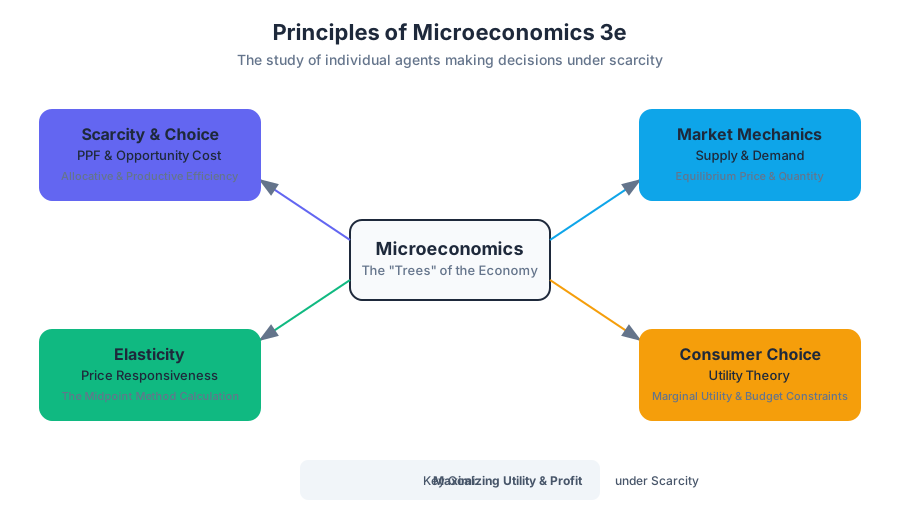
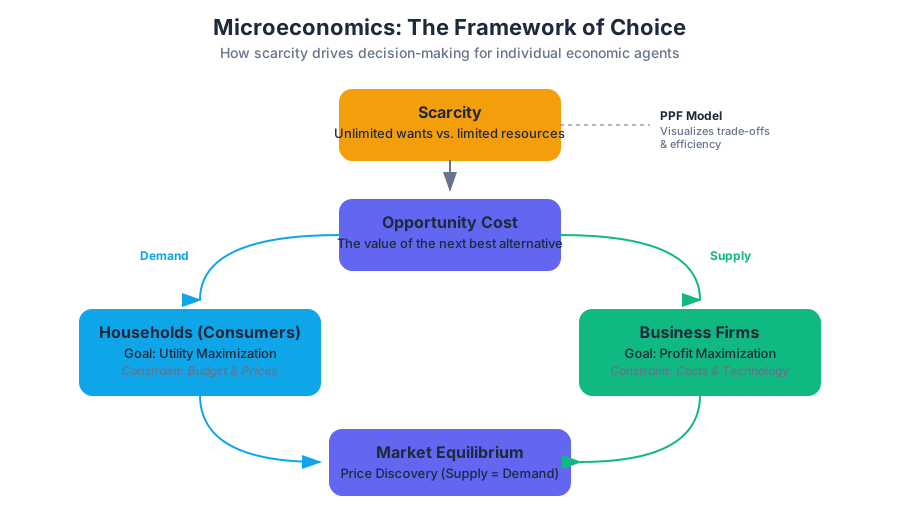
At its core, microeconomics is the study of how individual agents—households, workers, and business firms—make decisions in the face of scarcity. While macroeconomics looks at the "forest" (the national economy), microeconomics examines the "trees" (individual markets and price mechanisms).
The Economic Problem: Scarcity and Choice
The foundational axiom of all economic theory is scarcity: the reality that human wants for goods, services, and resources exceed what is available. This necessitates choice, and every choice involves an opportunity cost.
The Production Possibilities Frontier (PPF)
The Production Possibilities Frontier (PPF) is a graphical representation of the possible combinations of two goods an economy can produce given its available resources and technology. It illustrates the concepts of efficiency, trade-offs, and economic growth.
Definition: Opportunity Cost The value of the next best alternative foregone as the result of making a decision. Mathematically, the opportunity cost of good $x$ in terms of good $y$ is the slope of the PPF: $OC_x = |\Delta y / \Delta x|$.
| Concept | Description | Graphical Representation |
|---|---|---|
| Productive Efficiency | Producing without waste; any point on the PPF. | Points on the curve. |
| Allocative Efficiency | Producing the specific mix of goods most desired by society. | A specific point on the curve. |
| Law of Diminishing Returns | As additional increments of resources are added to a certain purpose, the marginal benefit will decline. | The "bowed-out" shape of the PPF. |
Market Mechanics: Supply and Demand
The Demand and Supply model is the primary tool for analyzing how prices and quantities are determined in a market. It describes the behavior of buyers and sellers and how they interact to reach an equilibrium.
The Law of Demand and Supply
The Law of Demand states that, ceteris paribus (all other things being equal), as the price of a good increases, the quantity demanded decreases. Conversely, the Law of Supply states that as the price increases, the quantity supplied increases.
To find the market equilibrium, we solve for the price $P$ where $Q_d = Q_s$.
import numpy as np
from scipy.optimize import fsolve

# Define a linear market model
# Qd = a - bP (Demand)
# Qs = c + dP (Supply)

def market_system(P, a, b, c, d):
    Qd = a - b * P
    Qs = c + d * P
    return Qd - Qs

# Parameters: a=100 (intercept), b=2 (slope), c=10 (intercept), d=1 (slope)
params = (100, 2, 10, 1)
equilibrium_price = fsolve(market_system, x0=20, args=params)
equilibrium_quantity = 100 - 2 * equilibrium_price[0]

print(f"Equilibrium Price: ${equilibrium_price[0]:.2f}")
print(f"Equilibrium Quantity: {equilibrium_quantity:.2f} units")
Shifts vs. Movements
A movement along the curve occurs only when the price of the good itself changes. A shift of the curve occurs when exogenous factors change, such as:
- Demand Shifts: Changes in income, tastes, prices of related goods (substitutes/complements), or expectations.
- Supply Shifts: Changes in input prices (labor, raw materials), technology, or government policies (taxes/subsidies).
Elasticity: Measuring Responsiveness
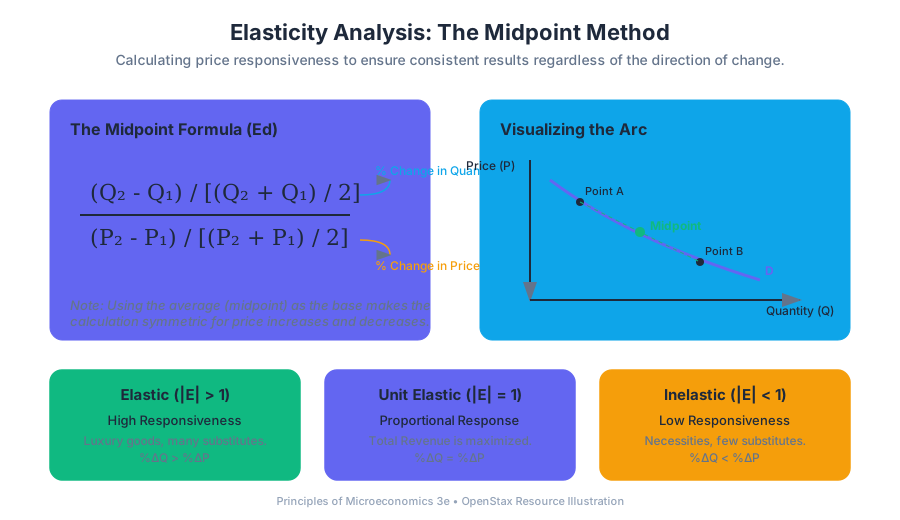
Elasticity is a unitless measure of how much one variable responds to changes in another. In Principles of Microeconomics 3e, the Midpoint Method is emphasized to ensure that the percentage change is the same regardless of whether the price is increasing or decreasing.
The Midpoint Formula
The Price Elasticity of Demand ($E_d$) is calculated as:
E_d = \frac{(Q_2 - Q_1) / [(Q_2 + Q_1) / 2]}{(P_2 - P_1) / [(P_2 + P_1) / 2]}
| Elasticity Value | Terminology | Interpretation |
|---|---|---|
| $ | E | > 1$ |
| $ | E | < 1$ |
| $ | E | = 1$ |
| $E = 0$ | Perfectly Inelastic | Quantity does not change regardless of price (e.g., life-saving medicine). |
Consumer Choice and Utility
Microeconomics 3e explores the "why" behind demand through Utility Theory. Consumers aim to maximize their total utility subject to a budget constraint.
Marginal Utility and Optimization
Marginal Utility (MU) is the additional satisfaction gained from consuming one more unit of a good. The Law of Diminishing Marginal Utility suggests that as a person consumes more of a good, the additional utility from each new unit decreases.
To maximize utility, a consumer should allocate their budget such that the marginal utility per dollar spent is equal across all goods:
\text{Utility Maximization Rule: } \frac{MU_1}{P_1} = \frac{MU_2}{P_2} = \dots = \frac{MU_n}{P_n}
Income and Substitution Effects
When the price of a good falls, two things happen:
- Substitution Effect: The good becomes relatively cheaper compared to others, so consumers buy more of it.
- Income Effect: The consumer's "real" purchasing power increases, allowing them to buy more of all normal goods.
Production, Costs, and Industry Structure
For a firm, the goal is typically profit maximization, where $\text{Profit} = \text{Total Revenue} - \text{Total Cost}$.
Cost Categories
- Fixed Costs (FC): Costs that do not change with output (e.g., rent).
- Variable Costs (VC): Costs that change with output (e.g., labor, materials).
- Marginal Cost (MC): The cost of producing one additional unit: $MC = \Delta TC / \Delta Q$.
Market Structures
The 3rd edition categorizes industries based on the number of firms and the degree of product differentiation.
| Structure | Number of Firms | Product Type | Barriers to Entry | Pricing Power |
|---|---|---|---|---|
| Perfect Competition | Many | Identical | None | None (Price Taker) |
| Monopolistic Competition | Many | Differentiated | Low | Some |
| Oligopoly | Few | Identical/Differentiated | High | Significant (Strategic) |
| Monopoly | One | Unique | Very High | Price Maker |
The Profit Maximization Rule
Regardless of market structure, a firm maximizes profit by producing the quantity where Marginal Revenue (MR) equals Marginal Cost (MC).
-- Conceptual SQL query to find the profit-maximizing quantity
-- for a firm in a database of production logs.

SELECT
    quantity,
    (total_revenue - total_cost) AS profit,
    (total_revenue - LAG(total_revenue) OVER (ORDER BY quantity)) AS marginal_revenue,
    (total_cost - LAG(total_cost) OVER (ORDER BY quantity)) AS marginal_cost
FROM firm_production_data
WHERE marginal_revenue >= marginal_cost
ORDER BY profit DESC
LIMIT 1;
Perfect Competition vs. Monopoly
In Perfect Competition, $P = MR = MC$. Firms earn zero economic profit in the long run. In a Monopoly, the firm faces the entire downward-sloping market demand curve, meaning $MR < P$. This leads to deadweight loss, as the monopolist produces less and charges more than the socially optimal level.
Market Failures: Externalities and Public Goods
Markets are efficient only when all costs and benefits are internalized. When they are not, we encounter Market Failure.
Externalities
An externality occurs when a third party, outside the transaction, is affected by a market exchange.
- Negative Externality: Pollution. The social cost exceeds the private cost.
- Positive Externality: Vaccination. The social benefit exceeds the private benefit.
Public Goods
Public goods are characterized by two traits:
- Non-excludable: It is impossible to prevent someone from using the good.
- Non-rivalrous: One person's use does not diminish another's.
This leads to the Free Rider Problem, where individuals consume the good without paying for it, often requiring government intervention to provide the service (e.g., national defense).
Labor Markets and Poverty
Principles of Microeconomics 3e places a strong emphasis on the Labor Market. Unlike the market for goods, in the labor market, households are the suppliers and firms are the demanders.
The Marginal Productivity of Labor
A firm will hire workers up to the point where the Value of the Marginal Product of Labor ($VMPL$) equals the market wage ($W$). $VMPL = MP_L \times P_{output}$.
Income Inequality
The text discusses the Lorenz Curve and the Gini Coefficient as tools to measure inequality. It explores the trade-off between economic equality and incentives, often referred to as the "leaky bucket" experiment.
Variations and Extensions: Behavioral Economics
A major addition to the 3rd edition is the expanded coverage of Behavioral Economics. While traditional theory assumes "Homo Economicus" (a perfectly rational actor), behavioral economics integrates psychology to explain:
- Loss Aversion: The tendency to feel the pain of a loss more strongly than the joy of an equivalent gain.
- Nudging: Small changes in environment that influence behavior without forbidding options (e.g., making organ donation the "opt-out" default).
- Sunk Cost Fallacy: Continuing an endeavor because of previously invested resources, even when it no longer makes sense.
Common Pitfalls in Microeconomic Analysis
- Confusing Demand with Quantity Demanded: A change in price moves you along the curve; it does not shift the curve.
- Ignoring Opportunity Cost: Only looking at "out-of-pocket" (explicit) costs and ignoring implicit costs like time or alternative investments.
- The Fallacy of Composition: Assuming that what is true for one individual (e.g., saving more money) is true for the entire economy (which could lead to a recession if everyone stops spending).
- $MR = MC$ vs. $P = MC$: Remembering that only perfectly competitive firms produce where $P = MC$. Monopolists produce where $MR = MC$, but charge a price $P > MC$.
Diverse Economic Perspectives
Key concepts: Diverse Economic Perspectives · Inclusion in Economics · Real-World Application
Exploration of how the course incorporates various viewpoints and real-world contexts into economic study.
Diverse Economic Perspectives: The Evolution of Pluralistic Economic Modeling
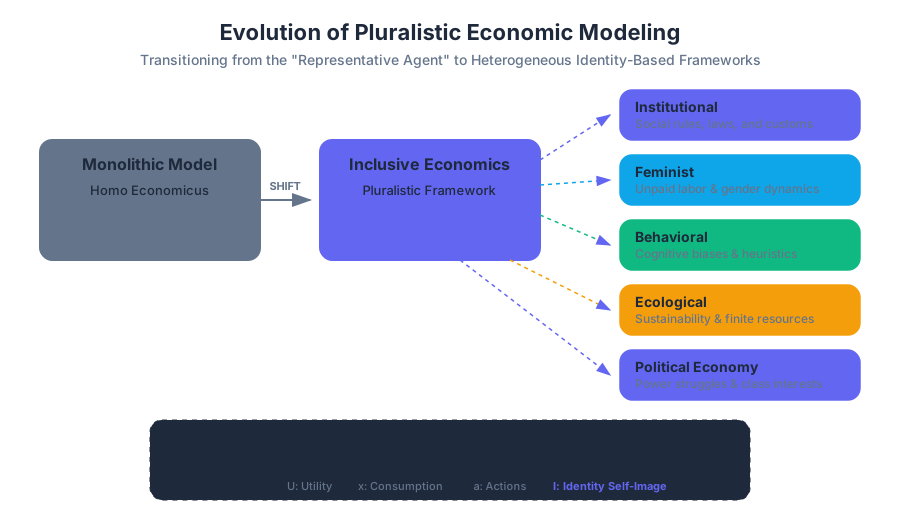
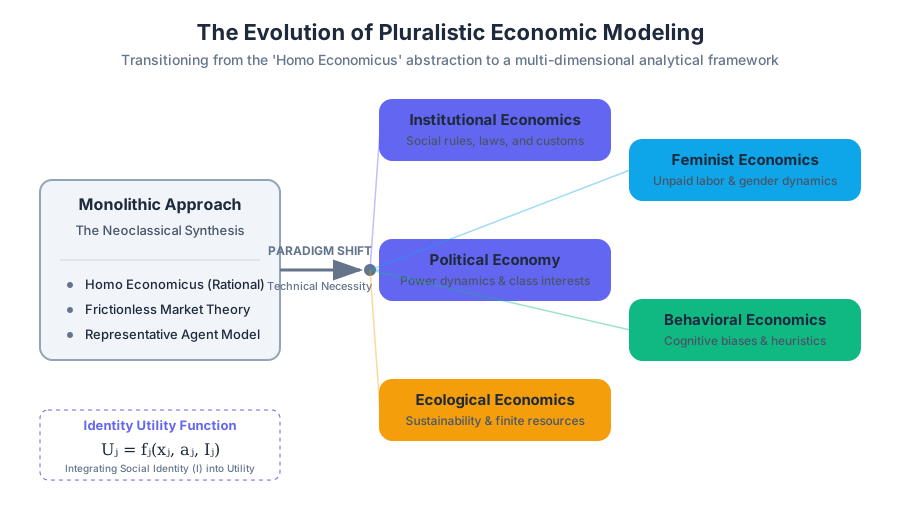
Modern economics is undergoing a fundamental paradigm shift. Historically, the field was dominated by a "monolithic" approach—primarily the Neoclassical synthesis—which relied on the assumption of the Homo Economicus: a perfectly rational, self-interested actor operating in frictionless markets. However, the contemporary landscape, as reflected in the Principles of Microeconomics 3e, recognizes that this model often fails to account for the complexities of human identity, institutional barriers, and systemic inequities.
Diverse Economic Perspectives represent an analytical framework that integrates heterodox theories, demographic variables, and multi-disciplinary insights into the core of economic inquiry. This is not merely a matter of "social representation"; it is a technical necessity for improving the predictive power and descriptive accuracy of economic models. By incorporating perspectives from different demographic groups, geographic regions, and schools of thought, economists can better understand how policy interventions propagate through a heterogeneous population.
The Framework of Inclusive Economics
Inclusive economics moves beyond the "representative agent" model to acknowledge that economic agents are embedded in social structures. This transition requires a shift from Positive Economics (what is) to a more robust integration of Normative Economics (what ought to be) and Institutional Economics (how rules shape outcomes).
Core Pillars of Diversity in Economic Theory
To understand the breadth of this field, we must categorize the primary schools of thought that contribute to a diverse perspective.
| School of Thought | Primary Focus | Key Critique of Neoclassical Model |
|---|---|---|
| Institutional Economics | The role of social institutions, laws, and customs in shaping economic behavior. | Markets do not exist in a vacuum; they are "instituted" by social rules. |
| Feminist Economics | The inclusion of unpaid labor (care work), gendered wage gaps, and intra-household resource allocation. | Traditional GDP and utility models ignore non-market production and gendered power dynamics. |
| Behavioral Economics | Psychological factors and cognitive biases that lead to "irrational" decision-making. | Humans are not "rational optimizers" but "satisficers" prone to heuristics. |
| Ecological Economics | The economy as a subsystem of the Earth's ecosystem, focusing on sustainability and finite resources. | Infinite growth is impossible on a finite planet; externalities are not "glitches" but central features. |
| Political Economy | The interplay between political power, class interests, and economic policy. | Economic outcomes are often the result of power struggles rather than pure market efficiency. |
Quantitative Modeling of Identity and Bias
One of the most significant technical advancements in diverse economics is the formalization of Identity Economics. This subfield, pioneered by George Akerlof and Rachel Kranton, introduces social identity into the utility function.
The Identity Utility Function
In a standard model, utility $U$ is a function of consumption $x$. In a diverse model, utility is expressed as:
$$U_j = f_j(x_j, a_j, I_j)$$
Where:
- $x_j$: Consumption of goods and services.
- $a_j$: Actions taken by individual $j$.
- $I_j$: The individual’s Identity Self-Image, which depends on the social category they belong to and the extent to which their actions $a_j$ conform to the "prescriptions" (norms) of that category.
Implementation: Simulating Labor Market Bias
To see how these perspectives manifest in data, we can model a labor market where "diverse perspectives" (or the lack thereof) result in structural disparities. The following Python implementation uses a Monte Carlo simulation to show how implicit bias in hiring affects long-term wealth distribution among different demographic groups.
import numpy as np
import pandas as pd

class LaborMarketSimulation:
    def __init__(self, num_agents=1000, bias_factor=0.1):
        self.num_agents = num_agents
        self.bias_factor = bias_factor  # Penalty applied to minority group
        self.agents = pd.DataFrame({
            'id': range(num_agents),
            'group': np.random.choice(['Majority', 'Minority'], num_agents, p=[0.7, 0.3]),
            'skill_level': np.random.normal(100, 15, num_agents),
            'wealth': np.zeros(num_agents)
        })

    def run_hiring_cycle(self, cycles=50):
        for _ in range(cycles):
            # Calculate 'Perceived Merit'
            # The bias_factor reduces the perceived skill of the minority group
            self.agents['perceived_merit'] = self.agents.apply(
                lambda row: row['skill_level'] * (1 - self.bias_factor)
                if row['group'] == 'Minority' else row['skill_level'], axis=1
            )

            # Top 20% get 'High-Wage' jobs
            threshold = np.percentile(self.agents['perceived_merit'], 80)
            self.agents['wealth'] += self.agents['perceived_merit'].apply(
                lambda x: 5000 if x >= threshold else 1000
            )

            # Skill appreciation: those with high-wage jobs improve skills faster
            self.agents['skill_level'] += self.agents['perceived_merit'].apply(
                lambda x: 2.0 if x >= threshold else 0.5
            )

    def get_results(self):
        return self.agents.groupby('group')['wealth'].mean()

# Execute Simulation
sim = LaborMarketSimulation(bias_factor=0.15)
sim.run_hiring_cycle(cycles=20)
print(f"Average Wealth by Group:\n{sim.get_results()}")
Measuring Disparity: The Oaxaca-Blinder Decomposition
In the study of Inclusion in Economics, it is not enough to observe that a wage gap exists. We must determine why it exists. The Oaxaca-Blinder Decomposition is a statistical method used to partition the difference in an outcome (like wages) into a part that is explained by individual characteristics (education, experience) and an "unexplained" part, often attributed to discrimination or structural barriers.
Mathematical Derivation
Given two groups, $L$ (Lead) and $C$ (Comparison), we estimate a linear regression for wages ($Y$):
$$Y_L = \beta_L X_L + \epsilon_L$$ $$Y_C = \beta_C X_C + \epsilon_C$$
The difference in mean outcomes $\bar{Y}_L - \bar{Y}_C$ can be decomposed as:
$$\Delta \bar{Y} = \underbrace{(\bar{X}_L - \bar{X}_C)\hat{\beta}C}{\text{Endowments (Explained)}} + \underbrace{\bar{X}_C(\hat{\beta}_L - \hat{\beta}C)}{\text{Coefficients (Unexplained)}} + \underbrace{(\bar{X}_L - \bar{X}_C)(\hat{\beta}_L - \hat{\beta}C)}{\text{Interaction}}$$
Key Insight: If the "Coefficients" term is large, it suggests that the market rewards the same characteristics differently depending on the group, highlighting a lack of inclusion and the presence of systemic bias.
Real-World Application: Urban Economics and "Redlining"
A concrete example of how diverse perspectives change economic analysis is the study of Redlining in the United States. A traditional neoclassical model might view neighborhood decline as a simple result of "market preferences." However, an inclusive perspective looks at the historical institutional data.
The Impact of Discriminatory Lending
In the 1930s, the Home Owners' Loan Corporation (HOLC) created maps that color-coded neighborhoods by "mortgage fitness." Minority neighborhoods were shaded red ("hazardous"), leading to a systemic denial of credit.
| Metric | Redlined Area (Historical) | Greenlined Area (Historical) | Long-term Economic Impact |
|---|---|---|---|
| Home Equity | Stagnant/Low | High Growth | Massive wealth gap (intergenerational) |
| Public Investment | Minimal | Robust | Disparities in school funding and infrastructure |
| Environmental Risk | High (Urban Heat Islands) | Low (Tree Canopy) | Health costs and lower labor productivity |
Data Analysis via SQL
To analyze these disparities in a modern context, economists often join census data with financial transaction logs.
-- Analyzing loan denial rates by demographic and neighborhood risk-score
SELECT
    census.neighborhood_id,
    census.demographic_group,
    COUNT(loans.id) AS total_applications,
    SUM(CASE WHEN loans.status = 'Denied' THEN 1 ELSE 0 END) * 100.0 / COUNT(loans.id) AS denial_rate,
    AVG(loans.interest_rate) AS avg_rate
FROM
    census_data AS census
JOIN
    loan_applications AS loans ON census.neighborhood_id = loans.neighborhood_id
WHERE
    loans.year BETWEEN 2010 AND 2022
GROUP BY
    census.neighborhood_id, census.demographic_group
HAVING
    total_applications > 100
ORDER BY
    denial_rate DESC;
Variations and Extensions
1. Intersectionality in Modeling
Diverse perspectives also require an Intersectional approach. This means recognizing that the economic experience of a person is not just the sum of their parts (e.g., "Woman" + "Black"), but a unique experience created by the intersection of these identities. In regression analysis, this is handled through interaction terms.
2. The "Global South" Perspective
Development economics has shifted from "Washington Consensus" models (which prescribed universal deregulation) to models that respect local institutional contexts. This includes recognizing the role of the Informal Economy, which accounts for over 60% of employment in some developing regions but is often ignored in standard GDP calculations.
3. Stratification Economics
This subfield focuses specifically on how social groups (race, caste, class) maintain their relative status through the control of resources and the creation of "social distance." It challenges the idea that markets naturally erode discrimination over time.
Common Pitfalls in Diverse Economic Analysis
- Tokenism in Data: Including a "diversity variable" in a model without adjusting the underlying theoretical framework. If the model still assumes a frictionless market, the variable will likely show up as "noise" or be misinterpreted.
- The "Essentialism" Fallacy: Assuming that all members of a specific demographic group share the same economic preferences or behaviors. Diversity exists within groups as much as between them.
- Survivorship Bias: Analyzing only the successful members of a marginalized group to draw conclusions about the group's economic mobility, while ignoring those who were filtered out by structural barriers.
- Ignoring Unpaid Labor: Failing to account for the "Care Economy." If a policy increases labor force participation but destroys the informal care network for children and the elderly, the net economic impact may be negative despite a rise in GDP.
Conclusion: The Future of the Discipline
The integration of diverse economic perspectives is not a "political" addition to the field; it is an analytical upgrade. As global markets become more interconnected and social structures more complex, the ability to model heterogeneity becomes the hallmark of a sophisticated economist. The Principles of Microeconomics 3e serves as a foundational step in this direction, equipping students with the tools to see the economy not as a series of abstract curves, but as a vibrant, complex system of human interaction.
# Example: Setting up a research environment for Pluralistic Economic Analysis
# Using 'R' for advanced econometrics and 'Python' for agent-based modeling

# 1. Create a virtual environment
python3 -m venv econ_diversity_env
source econ_diversity_env/bin/activate

# 2. Install core libraries
pip install numpy pandas matplotlib seaborn statsmodels

# 3. Install R-specific bridges for Oaxaca decomposition
# (Requires R to be installed on the system)
pip install rpy2

# 4. Initialize a git repo for reproducible research
git init
echo "data/*.csv" >> .gitignore
echo "results/plots/" >> .gitignore
- Pluralism: The practice of using multiple theoretical frameworks to understand economic phenomena.
- Oaxaca-Blinder Decomposition: A statistical method to split differences in outcomes into explained and unexplained (discriminatory) components.
- Identity Economics: A subfield that incorporates social identity and norms into the utility function.
- Informal Economy: Economic activities, enterprises, and jobs that are not regulated or protected by the state.
- Stratification Economics: A branch of economics investigating the social and economic barriers that keep certain groups in a lower status.
- Care Economy: The sector of the economy that encompasses unpaid domestic work and social reproduction.
-
Which term describes the "unexplained" portion of the Oaxaca-Blinder decomposition?
- A) Endowments
- B) Coefficients (Discrimination)
- C) Interaction
- D) Residual Variance Correct: B
-
How does Feminist Economics critique the standard calculation of GDP?
- A) It claims GDP is too high.
- B) It argues GDP ignores the value of unpaid care work and domestic labor.
- C) It suggests GDP should only measure government spending.
- D) It claims GDP is a purely political metric with no economic value. Correct: B
-
In the Identity Utility Function $U = f(x, a, I)$, what does $I$ represent?
- A) Interest rates
- B) Investment capital
- C) Identity self-image and social norms
- D) Inflationary expectations Correct: C
-
Institutional Economics argues that markets...
- A) Are perfectly efficient by nature.
- B) Are social constructs shaped by laws and customs.
- C) Should be abolished in favor of central planning.
- D) Operate independently of political influence. Correct: B
-
Which pitfall involves assuming all members of a demographic group behave identically?
- A) Tokenism
- B) Essentialism
- C) Survivorship Bias
- D) Omitted Variable Bias Correct: B
Key Learning Objectives:
- Contrast Neoclassical assumptions with the reality of diverse economic agents.
- Identify the primary heterodox schools of thought (Feminist, Institutional, Behavioral).
- Understand the mathematical integration of identity into utility functions.
- Analyze the historical and structural roots of economic disparity (e.g., Redlining).
- Apply statistical tools like the Oaxaca-Blinder decomposition to real-world data.
Review Questions:
- Why is the "Representative Agent" model often insufficient for policy-making in diverse societies?
- How do social norms influence individual economic choices according to Identity Economics?
- What are the long-term economic consequences of systemic exclusion from credit markets?
- How can an intersectional approach change the results of a standard labor market regression?
Further Reading:
- Principles of Microeconomics 3e, Chapter 1: "Welcome to Economics!"
- Akerlof and Kranton, Identity Economics: How Our Identities Shape Our Work, Wages, and Well-Being.
- Amartya Sen, Development as Freedom.
Digital Tools and LMS Integration
Key concepts: OpenStax Assignable (LMS Integration) · Digital Learning Tools · Educational Technology
An overview of the digital ecosystem surrounding OpenStax, specifically focusing on LMS integration for instructors and students.
Digital Tools and LMS Integration: The Architecture of Open Educational Ecosystems
The modern educational landscape has shifted from static content delivery to dynamic, integrated learning environments. At the center of this evolution is the challenge of interoperability: the ability of disparate software systems—such as an Open Educational Resource (OER) provider like OpenStax and a Learning Management System (LMS) like Canvas or Blackboard—to exchange data securely and seamlessly.
Digital tools like OpenStax Assignable represent the bridge between high-quality, peer-reviewed content (e.g., Principles of Microeconomics 3e) and the administrative and pedagogical workflows of the classroom. This integration is not merely a convenience; it is a technical solution to the "fragmentation problem" in EdTech, where students and instructors are often forced to juggle multiple logins, disparate interfaces, and disconnected data streams.
The Foundation: Learning Tools Interoperability (LTI)
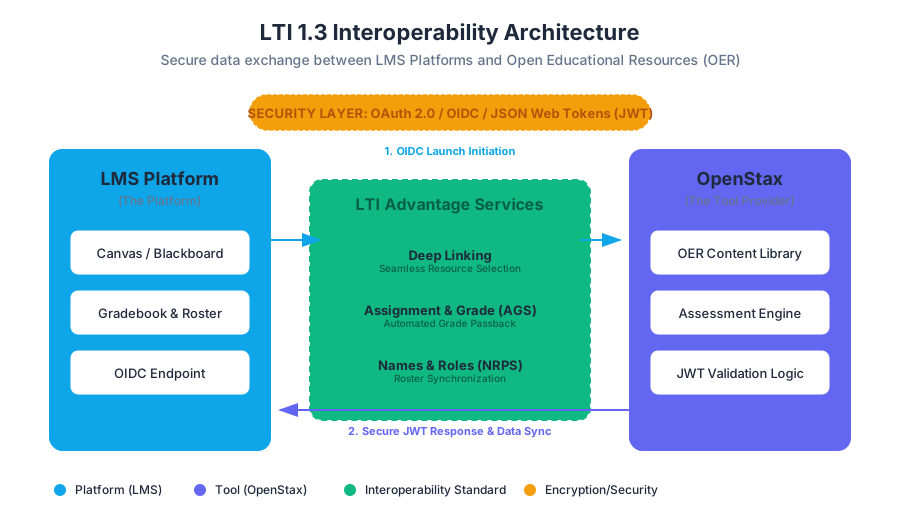
To understand how OpenStax Assignable functions, one must first understand the Learning Tools Interoperability (LTI) standard. Developed by 1EdTech (formerly IMS Global), LTI is the "lingua franca" of educational technology. It allows an LMS (the Platform) to securely connect with an external tool (the Tool Provider) without requiring the user to log in twice.
The Evolution of LTI Standards
The transition from LTI 1.1 to LTI 1.3 (and the LTI Advantage suite) marked a significant shift from simple form-post security to robust, asymmetric encryption using JSON Web Tokens (JWT) and OAuth2.
| Feature | LTI 1.1 (Legacy) | LTI 1.3 / LTI Advantage (Modern) |
|---|---|---|
| Security Model | OAuth 1.0a (Shared Secret) | OAuth 2.0 / JWT (Asymmetric Keys) |
| Authentication | Simple Launch | OIDC (OpenID Connect) Flow |
| Data Privacy | Limited | High (Granular PII control) |
| Deep Linking | Not native (CIM extension) | Native (Deep Linking Service) |
| Grade Passback | Basic (Single score) | Advanced (Assignment & Grade Services) |
| Roster Sync | Manual/External | Names and Role Provisioning Services |
Definition: LTI Advantage is a package of three essential services built on top of LTI 1.3: Deep Linking, Assignment and Grade Services (AGS), and Names and Role Provisioning Services (NRPS). It is the technical requirement for tools like OpenStax Assignable to provide a "native" feel within the LMS.
OpenStax Assignable: Mechanics and Implementation
OpenStax Assignable is an LTI-compliant middleware that allows instructors to treat OER content as first-class citizens within their LMS. Instead of simply linking to a PDF or a web page, instructors can "assign" specific sections, interactive modules, or assessment banks.
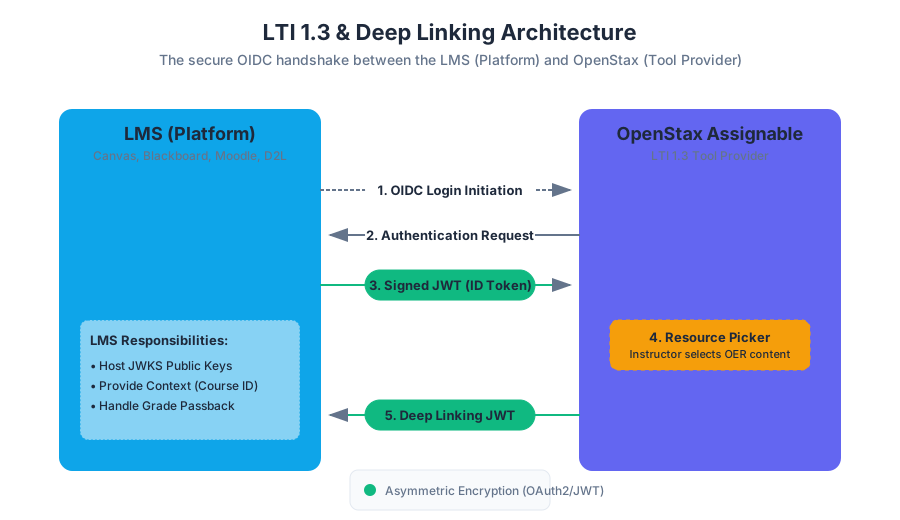
How It Works: The Deep Linking Flow
When an instructor clicks "OpenStax Assignable" within their LMS, the following sequence occurs:
- OIDC Login Initiation: The LMS sends a request to the OpenStax OIDC endpoint.
- Authentication Request: OpenStax redirects back to the LMS to verify the user's identity.
- Authentication Response: The LMS provides a signed JWT containing the user's role (Instructor) and context (Course ID).
- Resource Selection: OpenStax displays a "picker" interface where the instructor selects content from Principles of Microeconomics 3e.
- Deep Linking Response: OpenStax sends a JWT back to the LMS containing the specific
resource_linkand metadata for the chosen content.
Implementation Example: JWT Decryption and Validation
In a production environment, the Tool Provider (OpenStax) must validate the incoming JWT from the LMS to ensure the request is legitimate. Below is a low-level implementation logic using TypeScript and the jose library to handle the asymmetric key validation.
import * as jose from 'jose';

/**
 * Validates an LTI 1.3 Launch Request
 * @param token The JWT string sent by the LMS
 * @param jwksUri The JSON Web Key Set URI provided by the LMS (e.g., Canvas)
 */
async function validateLTILaunch(token: string, jwksUri: string) {
  try {
    // 1. Fetch the Public Key from the LMS JWKS endpoint
    const JWKS = jose.createRemoteJWKSet(new URL(jwksUri));

    // 2. Verify the JWT signature and expiration
    const { payload, protectedHeader } = await jose.jwtVerify(token, JWKS, {
      issuer: 'https://canvas.instructure.com', // Example Issuer
      audience: '10000000000001', // The Client ID assigned to OpenStax
    });

    // 3. Extract LTI Claims
    const ltiMessageType = payload['https://purl.imsglobal.org/spec/lti/claim/message_type'];
    const roles = payload['https://purl.imsglobal.org/spec/lti/claim/roles'] as string[];

    if (ltiMessageType === 'LtiResourceLinkRequest') {
      console.log('Valid Resource Launch by:', payload.name);
      return { success: true, context: payload['https://purl.imsglobal.org/spec/lti/claim/context'] };
    }
  } catch (error) {
    console.error('LTI Validation Failed:', error.message);
    throw new Error('Unauthorized EdTech Access');
  }
}
Data Synchronization and Grade Passback
One of the primary motivations for using OpenStax Assignable is the automated synchronization of student performance data. Without integration, instructors must manually export grades from a third-party tool and import them into the LMS—a process prone to human error and data latency.
The Assignment and Grade Services (AGS) Algorithm
The AGS (part of LTI Advantage) allows OpenStax to manage "Line Items" (columns in the gradebook). When a student completes a quiz in the Microeconomics module, the tool calculates the score and pushes it via an asynchronous REST call.
The logic for grade normalization is critical. Since different platforms use different scales (e.g., 0-1, 0-100, or letter grades), the tool must communicate the raw score and the maximum possible score.
Mathematical Representation of Grade Normalization:
Let $S_{raw}$ be the student's raw score, $S_{max}$ be the maximum possible points in the tool, and $G_{lms}$ be the points assigned to the assignment in the LMS. The normalized score $S_{final}$ reported to the LMS is often handled as a decimal ratio $R$:
$$R = \frac{S_{raw}}{S_{max}}$$
The LMS then calculates the display grade: $$DisplayGrade = R \times G_{lms}$$
Pseudocode: Asynchronous Grade Submission
# Pseudocode for Grade Passback via LTI AGS
def submit_student_grade(student_id, assignment_id, raw_score, max_score):
    # 1. Obtain OAuth2 Access Token for the LMS API
    access_token = get_lms_oauth_token(scope="https://purl.imsglobal.org/spec/lti-ags/scope/score")

    # 2. Construct the Score JSON object
    # timestamp must be ISO 8601
    score_payload = {
        "userId": student_id,
        "scoreGiven": raw_score,
        "scoreMaximum": max_score,
        "comment": "Completed OpenStax Microeconomics Ch. 3 Quiz",
        "timestamp": "2023-10-27T10:00:00Z",
        "activityProgress": "Completed",
        "gradingProgress": "FullyGraded"
    }

    # 3. POST to the LMS LineItem Score URL
    endpoint = f"https://lms.api/courses/{course_id}/lineitems/{assignment_id}/scores"
    response = http.post(endpoint, headers={"Authorization": f"Bearer {access_token}"}, json=score_payload)

    if response.status_code == 201:
        return "Grade Synced Successfully"
    else:
        return "Sync Failed: " + response.text
Comparative Analysis: Integration Methods
While LTI is the gold standard, other methods of digital tool integration exist. Choosing the right one depends on the required depth of data exchange.
| Method | Implementation Complexity | Data Depth | User Experience | Best For |
|---|---|---|---|---|
| Simple Hyperlink | Low | None | Poor (Manual login) | External reading lists |
| Common Cartridge | Medium | Metadata only | Moderate | Bulk content import |
| LTI 1.1 | Medium | Basic Grade | Good | Legacy tool support |
| LTI 1.3 + Advantage | High | Full Roster/Grade | Excellent | OpenStax Assignable |
| API-Level (Custom) | Very High | Unlimited | Variable | Proprietary ecosystems |
Common Pitfalls in LMS Integration
Even with robust standards like LTI 1.3, technical friction points remain. Senior EdTech engineers and administrators must account for these edge cases:
- Cookie Blocking (The "Third-Party Cookie" Problem): Modern browsers (Safari, Chrome) increasingly block third-party cookies. Since LTI tools often load in an
<iframe>, the tool may fail to maintain a session.- Solution: Use OIDC Post-Message patterns or redirect the user to a new tab for the initial launch.
- Roster Mismatches: If a student changes their email address in the LMS, but the Tool Provider uses email as the primary key, a duplicate account may be created.
- Solution: Always use the
sub(Subject) claim from the JWT, which is a stable, unique identifier provided by the LMS, rather than an email address.
- Solution: Always use the
- Timezone Desynchronization: Grade timestamps sent in local time instead of UTC can lead to "late" flags in the LMS gradebook.
- Solution: Strictly adhere to ISO 8601 UTC format for all
timestampfields.
- Solution: Strictly adhere to ISO 8601 UTC format for all
Advanced Configuration: The Tool Provider JSON
To set up OpenStax Assignable, an LMS administrator typically uses a configuration URL or a JSON block. This defines the endpoints and security keys required for the handshake.
{
  "title": "OpenStax Assignable",
  "description": "Integrated OER assignments for Microeconomics",
  "oidc_initiation_url": "https://assignable.openstax.org/api/lti/authorize",
  "target_link_uri": "https://assignable.openstax.org/api/lti/launch",
  "public_jwk_set": {
    "keys": [
      {
        "kty": "RSA",
        "alg": "RS256",
        "use": "sig",
        "kid": "openstax-key-2023",
        "n": "v9...[truncated]...",
        "e": "AQAB"
      }
    ]
  },
  "extensions": [
    {
      "domain": "assignable.openstax.org",
      "tool_id": "openstax-micro-3e",
      "platform": "canvas.instructure.com",
      "settings": {
        "selection_height": 800,
        "selection_width": 1000
      }
    }
  ]
}
The Pedagogical Impact of Integration
Beyond the technical specifications, the integration of tools like OpenStax Assignable fundamentally alters the student experience. By embedding Diverse Economic Perspectives and Peer-Reviewed Resources directly into the workflow, the "cost of access" is reduced—both financially and cognitively.
- Reduced Cognitive Load: Students do not need to learn a new interface for every textbook. The assignment appears as a native task within their familiar LMS dashboard.
- Real-time Feedback: Through AGS, students receive immediate grade updates, allowing them to gauge their understanding of microeconomic concepts like Elasticity or Market Failure before moving to the next module.
- Accessibility (A11y): Centralizing content within the LMS allows students to use the LMS's built-in accessibility tools (like screen readers or high-contrast modes) more effectively.
Summary of Key Parameters for Administrators
When deploying OpenStax Assignable, administrators should track the following metrics to ensure system health:
| Parameter | Metric Type | Target Value | Description |
|---|---|---|---|
| Launch Success Rate | Reliability | > 99.8% | Percentage of LTI launches that complete without 4xx/5xx errors. |
| Grade Sync Latency | Performance | < 5 seconds | Time between student submission and grade appearance in LMS. |
| PII Transmission | Security | Minimal | Ensure only necessary claims (name, email, sub) are shared. |
| Uptime (SLA) | Availability | 99.9% | Availability of the OpenStax Assignable middleware. |
- LTI (Learning Tools Interoperability): The standard protocol for connecting educational applications to platforms like LMS.
- JWT (JSON Web Token): A compact, URL-safe means of representing claims to be transferred between two parties.
- Deep Linking: An LTI service that allows instructors to pick specific content (like a chapter) from a tool and place it in the LMS.
- Grade Passback: The automated process of sending student scores from an external tool back to the LMS gradebook.
- OIDC (OpenID Connect): An identity layer on top of the OAuth 2.0 protocol, used for the initial LTI 1.3 handshake.
- Canvas/Blackboard/Moodle: Common examples of Learning Management Systems (LMS) that act as LTI Platforms.
- Middleware: Software that acts as a bridge between an operating system or database and applications, especially on a network.
-
Which LTI version introduced the use of asymmetric (Public/Private) keys for security?
- A) LTI 1.0
- B) LTI 1.1
- C) LTI 1.3
- D) Common Cartridge 1.2
- Answer: C
-
In the context of OpenStax Assignable, what does "Deep Linking" solve?
- A) It encrypts student passwords.
- B) It allows instructors to select specific textbook sections instead of the whole book.
- C) It speeds up the loading of high-resolution images.
- D) It translates the textbook into different languages.
- Answer: B
-
If a student completes a quiz but the grade does not appear in the LMS, which service is likely failing?
- A) NRPS (Names and Role Provisioning)
- B) OIDC Initiation
- C) AGS (Assignment and Grade Services)
- D) JWKS Fetching
- Answer: C
-
Why is the
subclaim preferred over theemailclaim for identifying users?- A) The
subclaim is shorter. - B) Emails can change, but the
subis a stable, unique identifier. - C) The
subclaim contains the student's grade. - D) Emails are not allowed in LTI 1.3.
- Answer: B
- A) The
-
What is the primary role of a "Tool Provider" in an LTI interaction?
- A) To host the student's official transcript.
- B) To provide the primary login page for the university.
- C) To deliver the educational content or assessment (e.g., OpenStax).
- D) To manage the school's physical hardware.
- Answer: C
Study Guide: Digital Tools and LMS Integration
1. Core Architecture Understand the relationship between the Platform (LMS) and the Tool (OpenStax). The interaction is governed by the LTI 1.3 standard, which uses a "Three-Legged Redirect" (OIDC) to establish trust.
2. Security Protocols Be able to explain why LTI 1.3 is superior to LTI 1.1. Focus on the shift from a "Shared Secret" (vulnerable to interception) to "Public/Private Key Pairs" (RSA/ECDSA) and the use of JWTs for message integrity.
3. The Instructor Workflow
- Discovery: Finding the tool in the LMS.
- Selection: Using Deep Linking to choose Principles of Microeconomics content.
- Deployment: Creating the link in the course module.
4. The Student Workflow
- Launch: Clicking the link (OIDC handshake).
- Engagement: Interacting with OpenStax content.
- Submission: Completing tasks that trigger the AGS grade passback.
5. Troubleshooting Checklist
- Verify the Deployment ID and Client ID match between the LMS and the Tool.
- Check browser settings for Third-Party Cookie restrictions.
- Ensure the LMS has granted the necessary Scopes (e.g.,
https://purl.imsglobal.org/spec/lti-ags/scope/score) to the tool.
6. Key Terminology
- LTI Advantage: The bundle of Deep Linking, AGS, and NRPS.
- Line Item: A specific entry (column) in the LMS gradebook.
- Score Maximum: The denominator in the grade calculation.
- Context: The specific course or classroom where the tool is launched.
Source Materials
Study Principles Microeconomics 3e with AI — Free on Lykke
Sign up for free to generate personalized flashcards, quizzes, and study guides from this course. Chat with an AI tutor that knows the material.
Get Started FreeView this course wiki on Lykke · Browse all public course wikis