Information Systems - A Manager's Guide to Harnessing Technology
Institution: MIT
76 study materials · 14 sections
This course provides a comprehensive overview of how information systems and technology drive competitive advantage in the modern business landscape. It combines theoretical frameworks like Moore's Law, Porter's Five Forces, and network effects with real-world case studies of industry leaders like Zara, Netflix, and Google to prepare managers for technical decision-making. Students will explore the shift from physical to digital assets, the rise of cloud computing, and the critical importance of data assets and information security in the modern enterprise.
Course Sections
Technology and the Modern Enterprise
Key concepts: Tech’s Tectonic Shift · Business Landscape Transformation · Technological Literacy · Modern Enterprise
An introduction to how technology is fundamentally reshaping the global business landscape and why technological literacy is essential for modern managers.
Technology and the Modern Enterprise
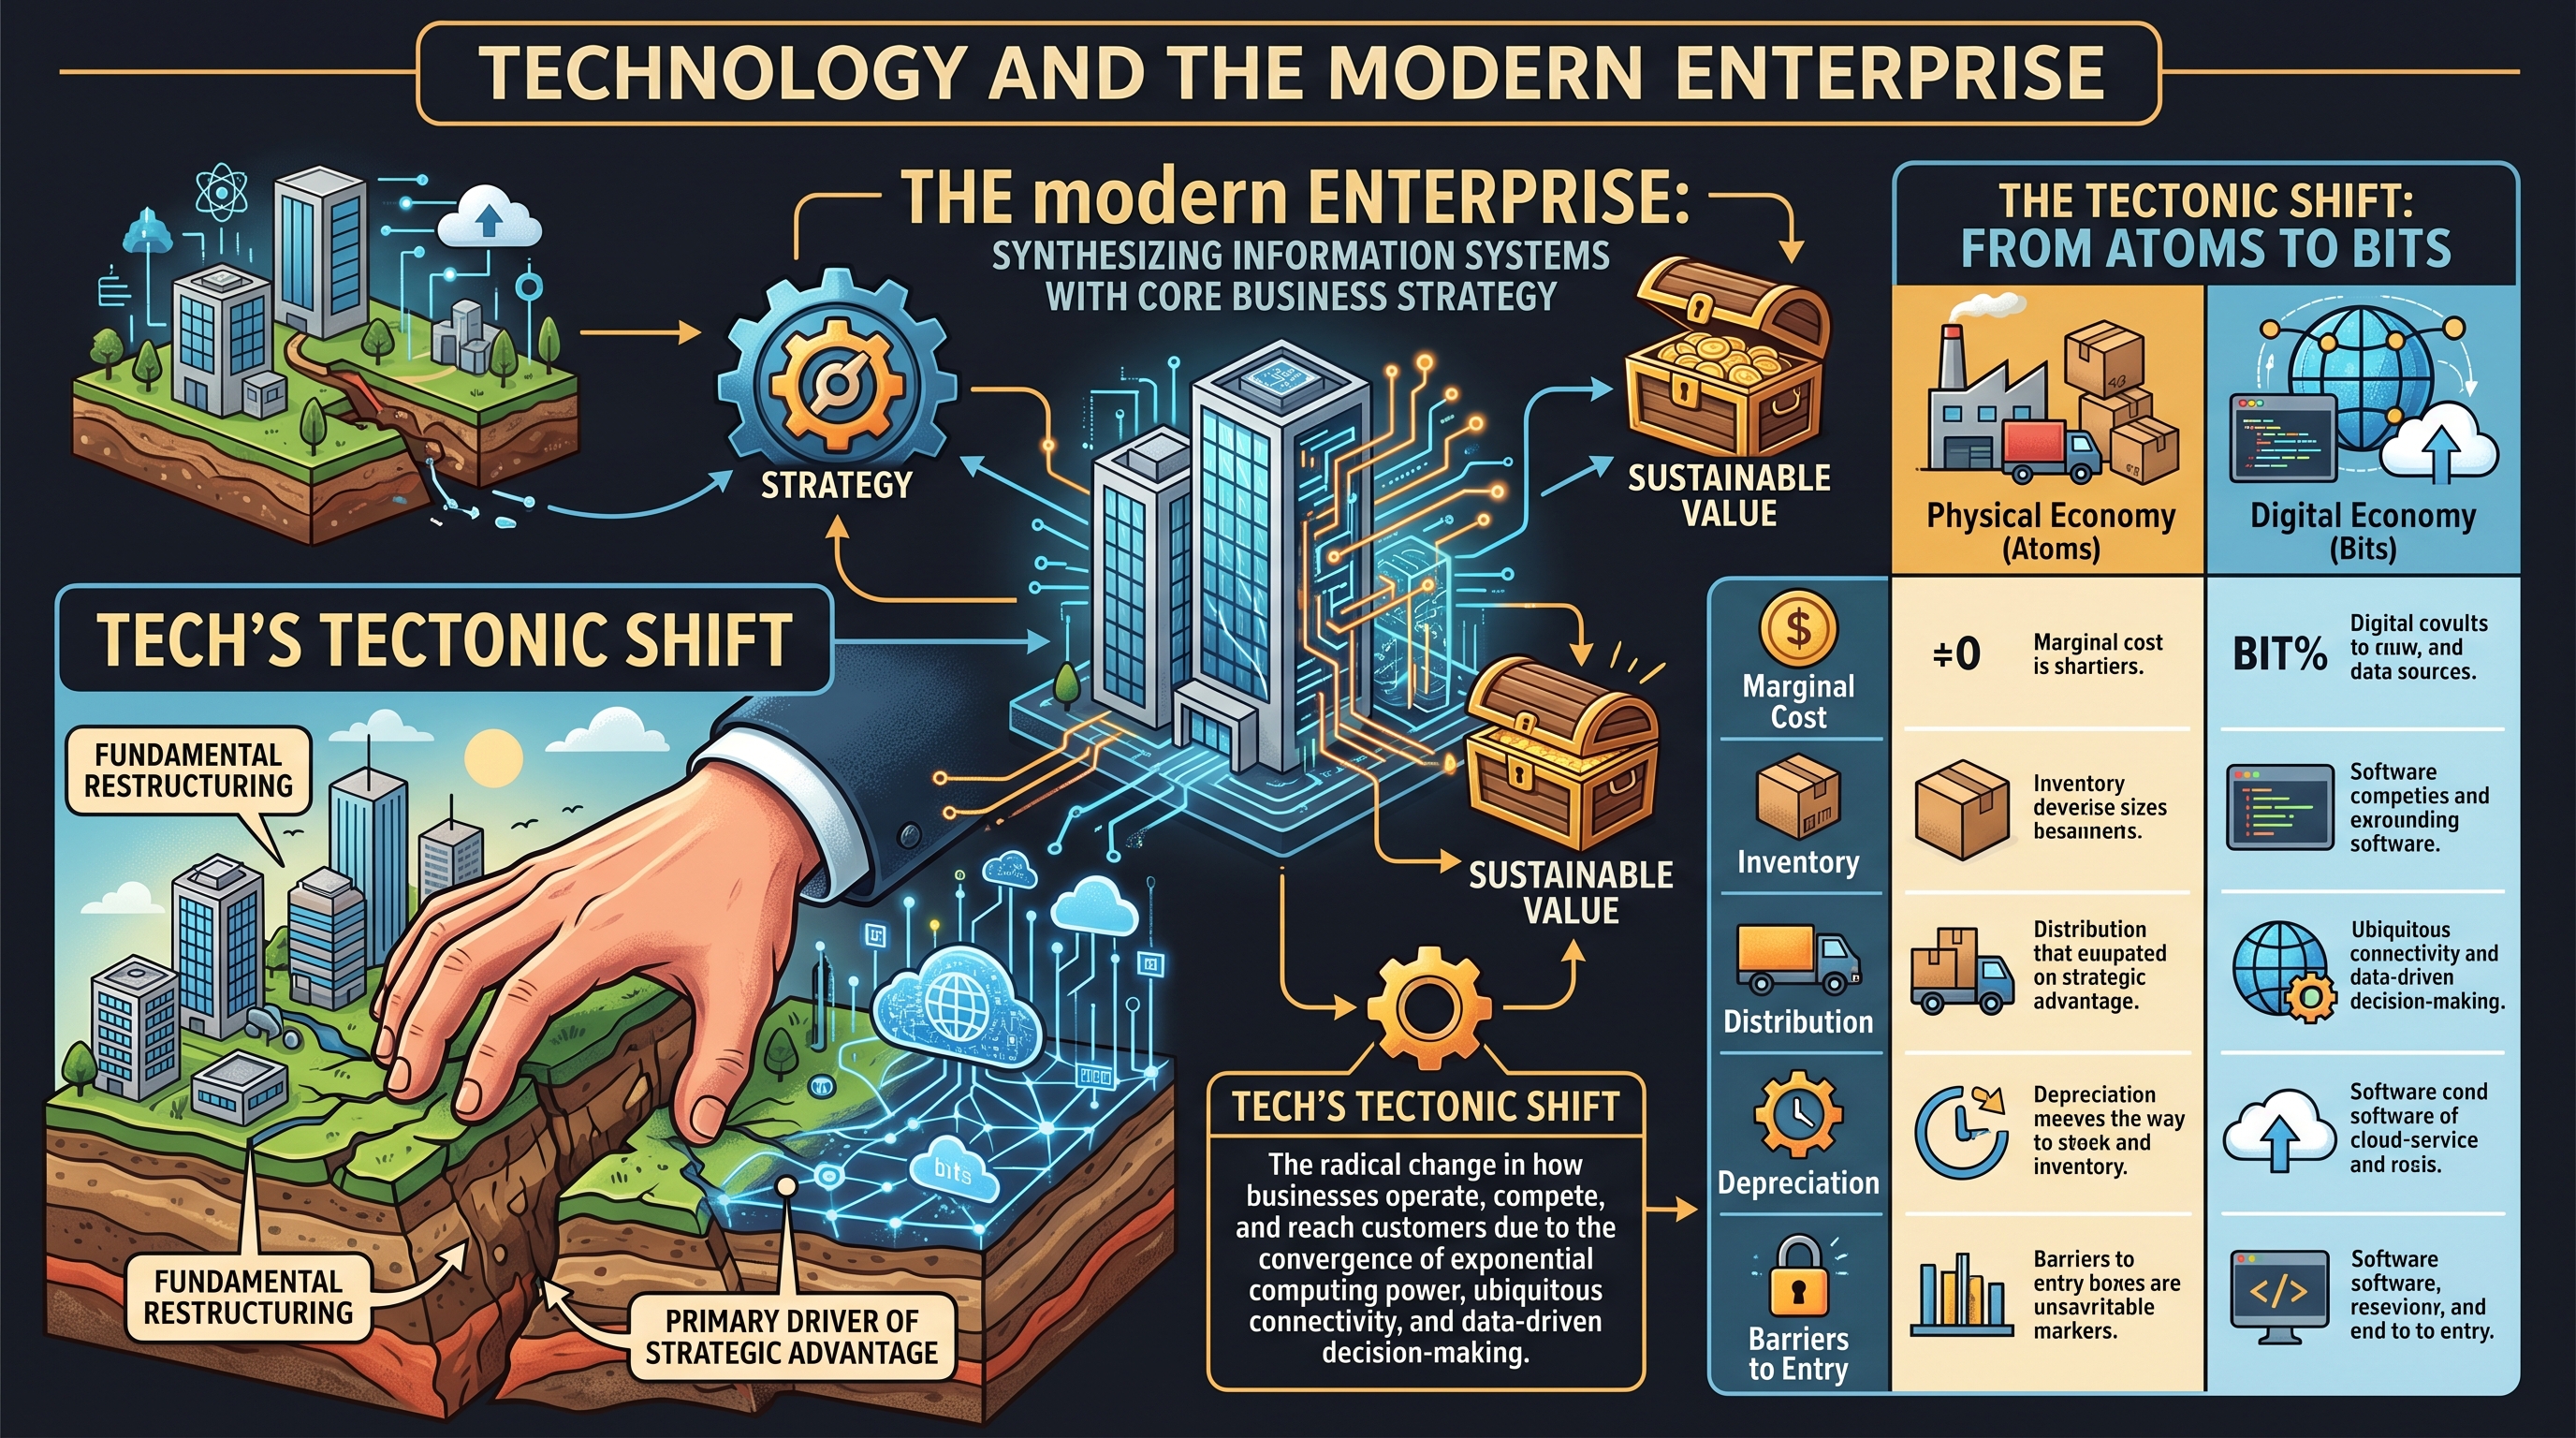
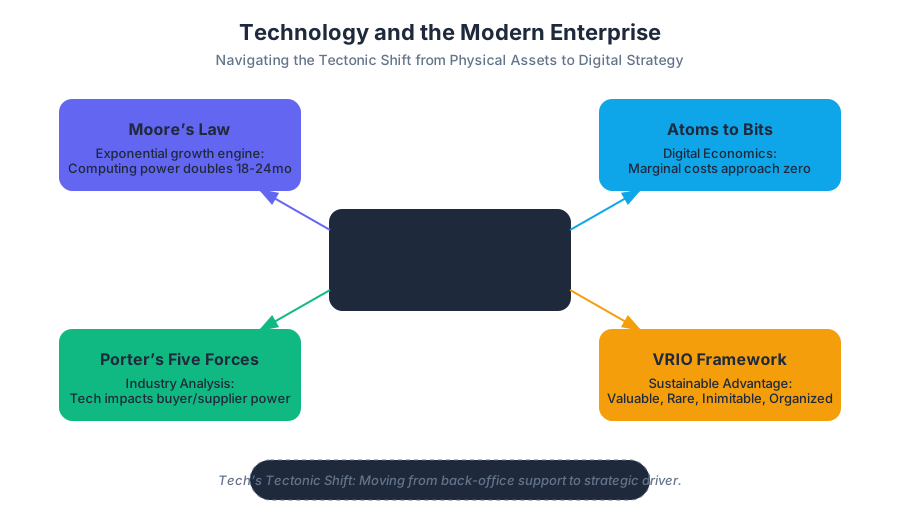
The contemporary business environment is currently undergoing what is described as Tech’s Tectonic Shift. This is not merely an incremental improvement in tools, but a fundamental restructuring of the global economy where technology has moved from a supporting "back-office" function to the primary driver of strategic advantage and market disruption. In this landscape, the Modern Enterprise is defined by its ability to synthesize information systems with core business strategy to create sustainable value.
The Tectonic Shift: From Atoms to Bits
The most profound driver of the modern enterprise is the transition from a physical-centric economy to a digital-centric one. This shift is often characterized as the move from Atoms to Bits. While physical goods (atoms) are subject to the laws of traditional logistics—shipping costs, inventory decay, and geographic limitations—digital goods (bits) operate under a different economic reality.
The Economics of Digital Transformation
In a digital economy, the marginal cost of producing an additional unit of a good often approaches zero. This allows for massive scalability that was previously impossible.
| Feature | Physical Economy (Atoms) | Digital Economy (Bits) |
|---|---|---|
| Marginal Cost | Significant (Materials + Labor) | Near Zero (Bandwidth + Storage) |
| Inventory | Limited by shelf space | Virtually infinite (The Long Tail) |
| Distribution | Slow, physical logistics | Instantaneous, global |
| Depreciation | High (Physical wear/obsolescence) | Low (Software can be updated) |
| Barriers to Entry | High (Capital intensive) | Lower (Cloud infrastructure) |
Definition: Tech’s Tectonic Shift The radical change in how businesses operate, compete, and reach customers due to the convergence of exponential computing power, ubiquitous connectivity, and data-driven decision-making.
Moore’s Law: The Engine of Change
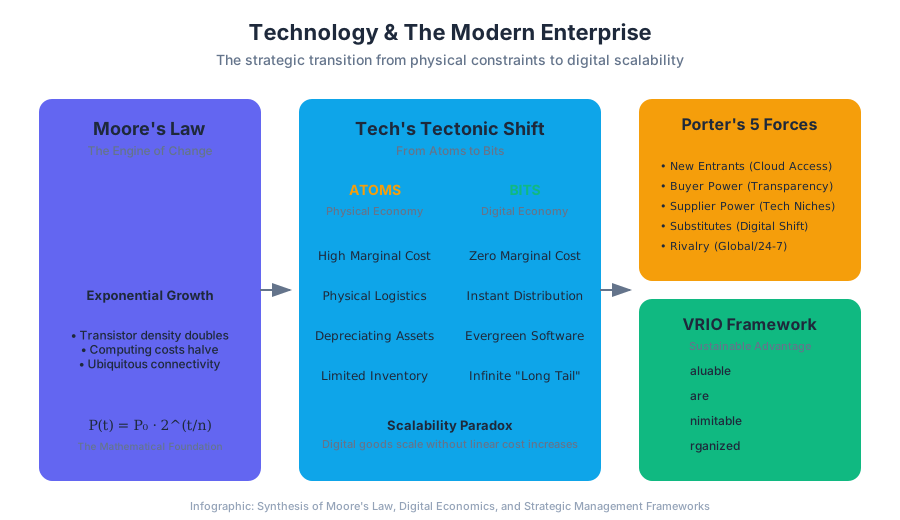
At the heart of this tectonic shift is Moore’s Law, the observation that the number of transistors on a chip doubles approximately every two years, while the cost of computing halves. This exponential growth has transformed computing from a rare, expensive resource into a cheap, ubiquitous commodity.
The Mathematical Foundation
Moore's Law is often expressed as a function of time $t$:
$$P(t) = P_0 \cdot 2^{(t/n)}$$
Where:
- $P(t)$ is the computing power at time $t$.
- $P_0$ is the initial computing power.
- $n$ is the doubling period (historically ~18 to 24 months).
For a manager, this means that the "impossible" calculation of today becomes the "standard" calculation of tomorrow. However, Moore's Law is facing physical limits, such as the Triple Threat of size, heat, and power consumption, leading to a shift toward multicore processors and cloud-based Grid Computing.
Low-Level Implementation: Simulating Transistor Density
The following C code demonstrates a simulation of transistor density growth over several decades, accounting for a slight slowdown in the doubling rate as physical limits are approached.
#include <stdio.h>
#include <math.h>

/**
 * Moore's Law Simulation
 * Calculates transistor density over time.
 * @param start_year The year to begin simulation
 * @param end_year The year to end simulation
 * @param doubling_period The number of years it takes to double
 */
void simulate_moores_law(int start_year, int end_year, double doubling_period) {
    double initial_density = 2300.0; // Intel 4004 (1971)
    printf("Year | Transistor Count | Growth Factor\n");
    printf("---------------------------------------\n");

    for (int year = start_year; year <= end_year; year += 2) {
        double elapsed = (double)(year - start_year);
        double current_density = initial_density * pow(2.0, elapsed / doubling_period);

        // Adjust for physical limits after 2020
        if (year > 2020) {
            current_density *= 0.85; // Simulated thermal throttling impact
        }

        printf("%d | %15.0f | %10.2fx\n", year, current_density, current_density / initial_density);
    }
}

int main() {
    simulate_moores_law(1971, 2030, 2.0);
    return 0;
}
Strategic Frameworks for the Modern Enterprise
Technological literacy is not just about knowing how to code; it is about understanding how technology alters the competitive landscape. To analyze this, managers use frameworks like Porter’s Five Forces and the Resource-Based View (RBV).
Porter’s Five Forces in the Tech Age
Technology can either strengthen or weaken a firm's position within its industry.
| Force | Impact of Technology | Example |
|---|---|---|
| Threat of New Entrants | Decreased by high tech barriers; Increased by cloud accessibility. | Netflix's proprietary recommendation engine vs. new streaming startups. |
| Bargaining Power of Buyers | Increased by price transparency and switching ease. | Comparison shopping engines (Google Shopping). |
| Bargaining Power of Suppliers | Increased if the supplier provides a unique tech component. | Intel’s dominance in the PC processor market. |
| Threat of Substitutes | High; digital versions often replace physical ones. | Digital streaming replacing physical DVDs. |
| Rivalry Among Competitors | Intensified; competition is now global and 24/7. | Amazon vs. Walmart in e-commerce. |
Sustainable Competitive Advantage (VRIO)
For a technology to provide a Sustainable Competitive Advantage, it must meet the VRIO criteria. If a resource is merely valuable and rare, it may provide a temporary advantage, but it must be inimitable and organized to be sustainable.
% Logic for Sustainable Competitive Advantage
\text{IF } (Resource = \text{Valuable}) \text{ AND } (Resource = \text{Rare}) \text{ THEN} \\
\quad \text{IF } (Resource = \text{Inimitable}) \text{ AND } (Resource = \text{Organized}) \text{ THEN} \\
\quad \quad \text{Status} = \text{Sustainable Competitive Advantage} \\
\quad \text{ELSE} \\
\quad \quad \text{Status} = \text{Temporary Competitive Advantage} \\
\text{ELSE} \\
\quad \text{Status} = \text{Competitive Disadvantage or Parity}
Case Study: Zara and the Data-Driven Supply Chain
Zara, the flagship brand of the Inditex Group, serves as the quintessential example of using Information Systems to achieve a strategic advantage. While competitors like Gap and H&M rely on seasonal predictions (guessing what customers will want six months in advance), Zara uses a "pull" model driven by real-time data.
The Zara Feedback Loop
- Data Collection: Store managers use PDAs to record customer preferences and "misses" (what customers asked for but didn't find).
- Real-Time Analysis: Data is sent to "The Cube" (central command) where designers iterate on styles in days, not months.
- Vertical Integration: Zara owns its factories and distribution centers, allowing for rapid production.
- Just-in-Time Manufacturing: Small batches are produced to create a "sense of scarcity" and reduce the need for markdowns.
Inventory Optimization Query
The following SQL snippet illustrates how a modern enterprise like Zara might query inventory levels across regions to trigger an automated replenishment order.
-- Automated Replenishment Trigger
SELECT
    p.product_id,
    p.style_name,
    s.store_id,
    s.region,
    i.stock_level,
    i.reorder_threshold
FROM
    inventory i
JOIN
    products p ON i.product_id = p.product_id
JOIN
    stores s ON i.store_id = s.store_id
WHERE
    i.stock_level < i.reorder_threshold
    AND p.last_sold_date > CURRENT_DATE - INTERVAL '2 days'
ORDER BY
    (i.reorder_threshold - i.stock_level) DESC;
Case Study: Netflix and the Transition to Streaming
Netflix’s evolution from a DVD-by-mail service to a streaming giant highlights the challenges of the Atoms to Bits transition. Netflix leveraged its "Cinematch" recommendation engine to build a data asset that competitors could not easily replicate.
The Long Tail
In the physical world, Blockbuster was limited by shelf space, focusing only on "hits." Netflix used the Long Tail—a strategy of offering a near-limitless selection of niche content. Because the cost of "storing" a digital file is negligible, Netflix could profit from low-demand titles that, in aggregate, outweighed the hits.
Data Analysis: The Long Tail Distribution
This Python snippet calculates the revenue potential of "Long Tail" items vs. "Hits" in a digital catalog.
import numpy as np
import pandas as pd

def analyze_long_tail(catalog_size, alpha=1.5):
    """
    Simulates a Power Law distribution for content popularity.
    alpha: The shape parameter (higher = more concentrated in hits)
    """
    # Generate ranks
    ranks = np.arange(1, catalog_size + 1)

    # Calculate popularity based on Power Law (Zipf's Law)
    popularity = 1 / (ranks ** alpha)
    popularity /= popularity.sum() # Normalize to 1

    df = pd.DataFrame({
        'rank': ranks,
        'popularity': popularity,
        'cumulative_share': np.cumsum(popularity)
    })

    hits = df[df['cumulative_share'] <= 0.20]
    long_tail = df[df['cumulative_share'] > 0.20]

    print(f"Top 20% (Hits) control {hits['popularity'].sum()*100:.2f}% of views.")
    print(f"Bottom {len(long_tail)/catalog_size*100:.2f}% (Long Tail) control {long_tail['popularity'].sum()*100:.2f}% of views.")

analyze_long_tail(catalog_size=10000, alpha=0.8)
Technological Literacy: The Managerial Imperative
In the modern enterprise, Technological Literacy is no longer the sole domain of the IT department. It is a core competency for every manager. Understanding how systems work allows managers to:
- Avoid "The Silver Bullet" Fallacy: Realizing that buying software doesn't solve process problems.
- Manage Risk: Understanding cybersecurity, data privacy, and the ethical implications of AI.
- Drive Innovation: Identifying opportunities to use technology to disrupt existing markets.
The Information Systems (IS) Components
A common pitfall is confusing "Information Technology" (IT) with "Information Systems" (IS). An Information System is a five-component framework:
- Hardware: The physical components (Moore's Law).
- Software: The instructions for the hardware.
- Data: The raw facts that serve as the "new oil."
- Procedures: The strategies and processes used by the organization.
- People: The most critical and often overlooked component.
Key Insight Technology is an accelerator of business success, but it is also an accelerator of failure. If you automate a broken process, you simply fail faster.
Modern Infrastructure: Cloud and DevOps
The modern enterprise increasingly relies on cloud-native architectures to maintain agility. The following YAML configuration shows a basic deployment for a microservice, illustrating how infrastructure is now "code."
# Kubernetes Deployment for a Modern Enterprise Microservice
apiVersion: apps/v1
kind: Deployment
metadata:
  name: inventory-service
  labels:
    app: zara-inventory
spec:
  replicas: 3
  selector:
    matchLabels:
      app: zara-inventory
  template:
    metadata:
      labels:
        app: zara-inventory
    spec:
      containers:
      - name: inventory-api
        image: gcr.io/enterprise-prod/inventory-v2:latest
        ports:
        - containerPort: 8080
        resources:
          limits:
            cpu: "500m"
            memory: "512Mi"
          requests:
            cpu: "200m"
            memory: "256Mi"
Common Pitfalls in Tech Management
- The "Me-Too" Strategy: Implementing technology just because a competitor did. This leads to competitive parity, not advantage.
- Ignoring Path Dependence: Failing to realize that early technical choices (technical debt) can constrain future strategic options.
- Underestimating the "People" Component: Focusing on the software while ignoring the training and cultural shifts required for digital transformation.
- Confusing Data with Insight: Having massive amounts of data (Big Data) without the analytical capability to turn it into actionable strategy.
Conclusion: The Future of the Enterprise
As Moore's Law continues to evolve and the tectonic shifts of AI and ubiquitous connectivity accelerate, the gap between "winners" and "losers" will be defined by Strategic Information Systems Management. The modern enterprise is not a company that uses technology, but a company that is technology.
Strategy and Technology: Concepts and Frameworks
Key concepts: Competitive Advantage · Resource-Based View · Barriers to Entry · Porter's Five Forces
Exploration of the relationship between business strategy and technology, focusing on frameworks used to achieve and sustain competitive advantage.
Strategy and Technology: Concepts and Frameworks
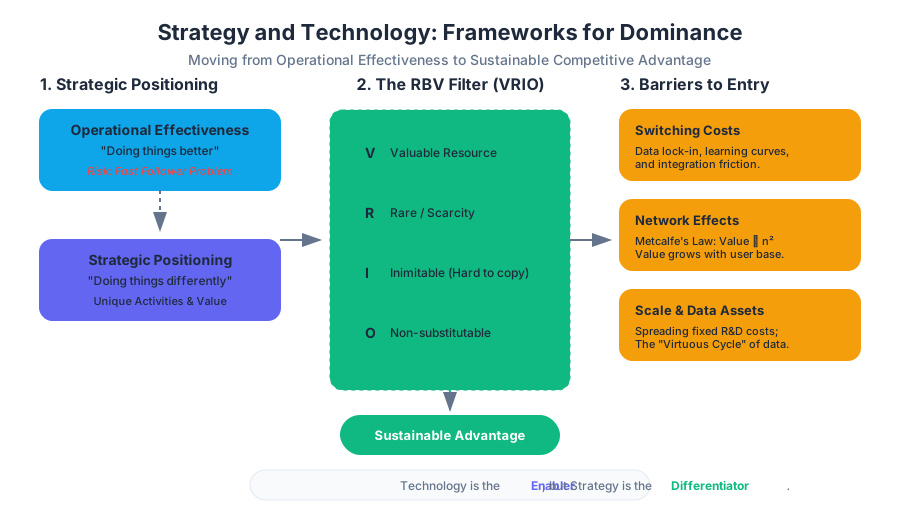
In the modern enterprise, the boundary between "business strategy" and "technological implementation" has effectively dissolved. For a firm to survive in an era defined by Moore’s Law and the "atoms to bits" transition, it must move beyond viewing Information Technology (IT) as a utility. Instead, technology must be leveraged as a primary driver of Competitive Advantage. This article explores the foundational frameworks—the Resource-Based View (RBV), Porter’s Five Forces, and the mechanics of Barriers to Entry—that allow managers to distinguish between fleeting tactical wins and sustainable strategic dominance.
The Nature of Competitive Advantage
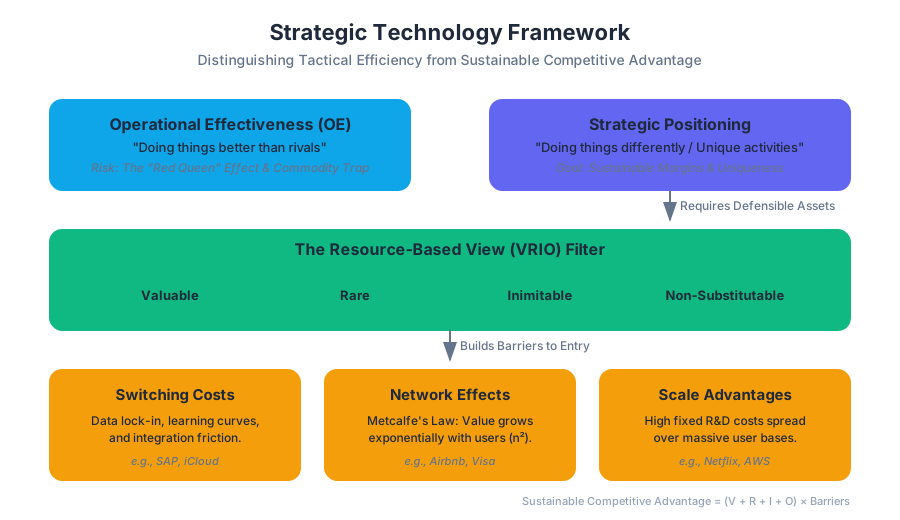
At its core, Competitive Advantage is the ability of a firm to outperform its industry peers by generating higher economic value. However, the tech industry is plagued by the "Red Queen" effect: running as fast as you can just to stay in the same place. To understand how to win, we must distinguish between two often-confused concepts.
Operational Effectiveness vs. Strategic Positioning
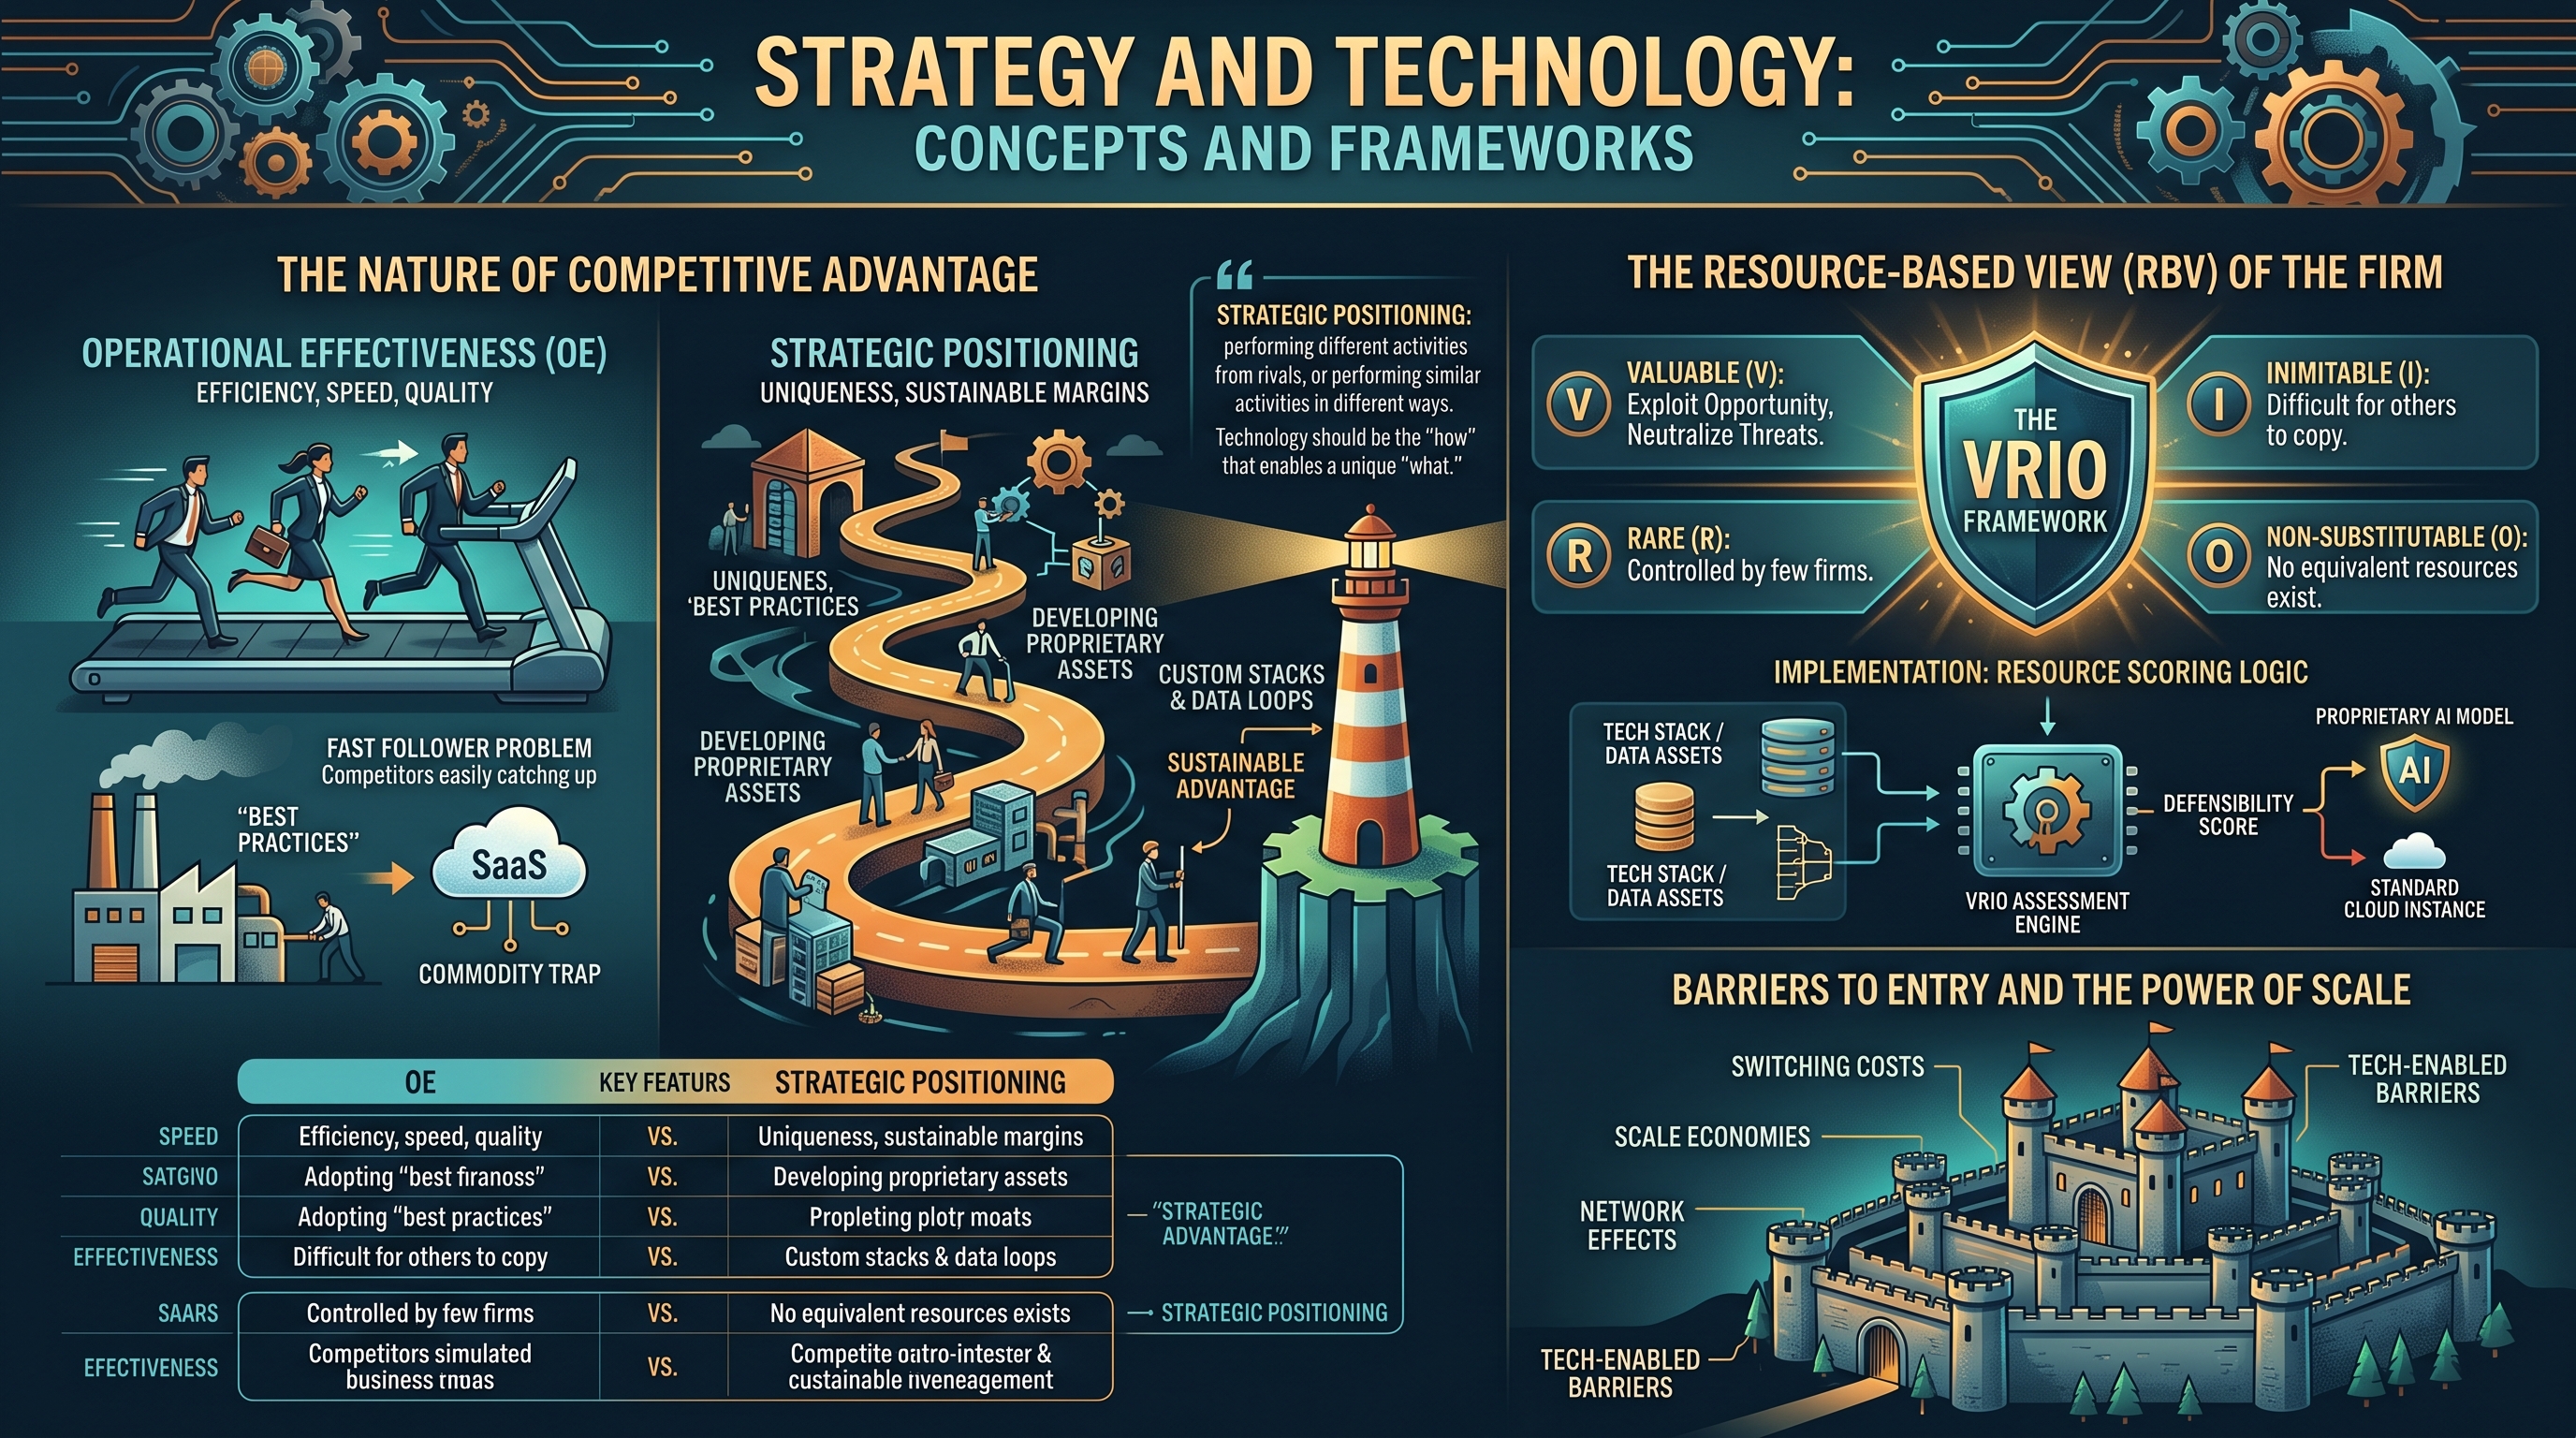
Most technological investments focus on Operational Effectiveness (OE)—performing similar activities better than rivals. While OE is necessary, it is rarely sufficient for long-term success because of Fast Follower problems. When a technology (like a new CRM or cloud infrastructure) is available to everyone, it becomes a commodity.
Definition: Strategic Positioning Strategic positioning refers to performing different activities from rivals, or performing similar activities in different ways. Technology should be the "how" that enables a unique "what."
| Feature | Operational Effectiveness (OE) | Strategic Positioning |
|---|---|---|
| Goal | Efficiency, speed, and quality. | Uniqueness and sustainable margins. |
| Mechanism | Adopting "Best Practices" and latest tools. | Developing proprietary processes/assets. |
| Risk | Commodity trap; price wars. | High initial R&D; market rejection. |
| Tech Role | Off-the-shelf software (SaaS). | Custom stacks, data loops, and integration. |
The Danger of the "Fast Follower"
When a firm relies solely on technology that can be purchased by competitors, it faces the Fast Follower Problem. Competitors can learn from the pioneer's mistakes, enter the market with newer versions of the same tech, and undercut prices because they didn't bear the initial R&D costs.
The Resource-Based View (RBV) of the Firm
To maintain a sustainable competitive advantage, a firm must possess resources that are not easily replicated. The Resource-Based View (RBV) provides a rigorous framework for evaluating whether an asset (technological, human, or physical) can serve as a foundation for long-term success.
The VRIO Framework
For a resource to provide a sustainable competitive advantage, it must meet four criteria:
- Valuable: Does the resource help the firm exploit an opportunity or neutralize a threat?
- Rare: Is the resource controlled by only a few firms?
- Imperfectly Imitable (Inimitable): Is it difficult for others to copy or buy?
- Non-substitutable: Are there no equivalent resources that can achieve the same result?
Implementation: Resource Scoring Logic
In a technical environment, we can model the "defensibility" of a tech stack or data asset by quantifying these VRIO dimensions.
# A simple VRIO Assessment Engine to evaluate strategic assets
class StrategicResource:
    def __init__(self, name, value, rarity, imitability, substitutability):
        self.name = name
        self.v = value  # 0 to 1
        self.r = rarity # 0 to 1
        self.i = imitability # 0 to 1 (high means hard to copy)
        self.o = substitutability # 0 to 1 (high means hard to substitute)

    def analyze_advantage(self):
        score = (self.v * self.r * self.i * self.o)

        if self.v < 0.5:
            return "Competitive Disadvantage"
        if self.r < 0.5:
            return "Competitive Parity"
        if self.i < 0.5 or self.o < 0.5:
            return "Temporary Competitive Advantage"

        return f"Sustainable Competitive Advantage (Score: {score:.2f})"

# Example: Proprietary AI Model vs. Standard Cloud Instance
ai_model = StrategicResource("Custom LLM", 0.9, 0.8, 0.9, 0.8)
cloud_vm = StrategicResource("AWS EC2", 0.9, 0.1, 0.1, 0.1)

print(f"{ai_model.name}: {ai_model.analyze_advantage()}")
print(f"{cloud_vm.name}: {cloud_vm.analyze_advantage()}")
Barriers to Entry and the Power of Scale
Technology is a double-edged sword: it can lower the Barriers to Entry for new competitors (e.g., cloud computing removing the need for server rooms), but it can also be used to build massive moats.
Key Tech-Enabled Barriers
- Switching Costs: The cost a consumer incurs when moving from one product to another. This isn't just money; it's time, data loss, and learning curves.
- Network Effects: Also known as Metcalfe's Law. The value of a product increases as the number of users grows.
- Data Assets: Using historical data to improve algorithms (the "virtuous cycle" of data).
- Scale Advantages: Large firms can spread the fixed costs of software development across a massive customer base.
Mathematical Foundation: Metcalfe's Law
The value ($V$) of a network is proportional to the square of the number of connected users ($n$). This creates a massive barrier for new entrants who start with $n=1$.
V \propto n(n-1) \approx n^2
| Barrier Type | Technical Mechanism | Example |
|---|---|---|
| Switching Costs | Proprietary file formats, API lock-in. | Adobe Creative Cloud, Apple iCloud. |
| Network Effects | Two-sided marketplaces, social graphs. | Uber, Airbnb, Facebook. |
| Scale | High fixed cost of R&D, low marginal cost. | Netflix (Content spend / Subscribers). |
| Brand | Search engine dominance, trust. | Google (as a verb). |
Porter’s Five Forces: The Industry View
While the RBV looks inside the firm, Michael Porter’s Five Forces framework looks outside at the industry structure. Technology has radically shifted the balance of power in each of these forces.
1. Intensity of Rivalry Among Existing Competitors
In tech-heavy industries, rivalry is often intense because products can be easily compared online. However, features like "Fast Fashion" systems (e.g., Zara) allow firms to compete on speed rather than just price.
2. Threat of New Entrants
Digital distribution lowers barriers, but "winner-take-all" dynamics in platform markets (like App Stores) make it harder for new players to gain traction.
3. Threat of Substitute Products or Services
This is where "Atoms to Bits" is most visible. The substitute for a physical DVD (atom) was a digital stream (bit). Managers must constantly scan for technological substitutes that perform the same job for the customer.
4. Bargaining Power of Buyers
The internet gives buyers more information, increasing their power. However, loyalty programs and ecosystem lock-in (Switching Costs) can mitigate this.
5. Bargaining Power of Suppliers
If a firm relies on a single proprietary technology supplier (e.g., a specific chip manufacturer), the supplier has immense power. Open-source software and multi-cloud strategies are common ways to reduce this power.
| Force | Impact of Technology | Strategic Counter-move |
|---|---|---|
| Buyer Power | Price transparency via web. | Differentiation and Switching Costs. |
| Supplier Power | Global sourcing via B2B hubs. | Multi-sourcing and Open Standards. |
| New Entrants | Lowered CapEx (Cloud). | Network Effects and Brand. |
| Substitutes | Digital disruption (Streaming). | Cannibalize your own business first. |
Case Study: SQL and Data Lock-in
A common way to increase switching costs and analyze buyer behavior is through deeply integrated data schemas. When a customer's entire business logic is written against a specific database schema, moving to a competitor is non-trivial.
-- Analyzing Customer "Stickiness" via Integration Depth
-- A high number of integrations suggests high switching costs.
SELECT
    c.customer_name,
    COUNT(api_keys.id) AS active_integrations,
    SUM(usage_logs.data_volume_gb) AS data_moat_size,
    CASE
        WHEN COUNT(api_keys.id) > 5 THEN 'High Lock-in'
        WHEN COUNT(api_keys.id) BETWEEN 2 AND 5 THEN 'Moderate'
        ELSE 'At Risk'
    END AS churn_risk_profile
FROM customers c
LEFT JOIN api_keys ON c.id = api_keys.customer_id
LEFT JOIN usage_logs ON c.id = usage_logs.customer_id
GROUP BY c.customer_name
ORDER BY active_integrations DESC;
Synthesis: The Strategic Feedback Loop
The frameworks discussed do not exist in isolation. A firm uses Porter's Five Forces to identify an attractive industry or a gap in the market. It then uses the Resource-Based View to develop the specific, inimitable assets (like a proprietary supply chain or data-driven design system) required to exploit that gap. These assets create Barriers to Entry that protect the firm's Competitive Advantage from rivals.
Common Pitfalls in Tech Strategy
- The "IT is a Commodity" Fallacy: Assuming that because you can buy a tool, it will give you an advantage. If your competitor can buy it too, your advantage is zero.
- Ignoring Switching Costs: Building a great product but making it too easy for customers to leave.
- Misjudging the Timing of "Atoms to Bits": Moving to digital too early (when infrastructure is lacking) or too late (when the market is gone).
- Confusing OE with Strategy: Being the most efficient player in a dying industry.
Key Insight: The Virtuous Cycle The most successful tech firms create a "flywheel" where more users lead to more data, which leads to better algorithms, which attracts more users, further increasing switching costs and scale advantages.
Summary of Frameworks
| Framework | Primary Question | Key Metric |
|---|---|---|
| RBV (VRIO) | Do we have the right "stuff" to win? | Rarity and Inimitability. |
| Five Forces | Is this a "good" neighborhood to do business in? | Industry Profitability. |
| Metcalfe's Law | Does our value grow as we scale? | $n^2$ (Network Value). |
| Switching Costs | How hard is it for our customers to fire us? | Churn Rate / Migration Effort. |
Zara: Fast Fashion from Savvy Systems
Key concepts: Fast Fashion · Vertical Integration · Data-Driven Decision Making · Supply Chain Management
A case study on how Zara leverages information systems and data-driven decision-making to revolutionize the fashion industry.
Zara: Fast Fashion from Savvy Systems
Zara, the flagship brand of the Spanish conglomerate Inditex, represents the definitive case study in how information systems (IS) can transform a legacy industry. While traditional fashion retailers operate on seasonal cycles planned months in advance, Zara has pioneered a model of Fast Fashion—a high-velocity, data-driven approach to design, production, and distribution. By treating clothing as a perishable commodity—much like fresh produce—Zara leverages Vertical Integration and real-time data to achieve industry-leading margins and minimal inventory risk.
The core of Zara’s success is not merely "better technology" in a vacuum, but the seamless integration of technology into a unique business process. This article explores the architectural underpinnings of the Zara model, from the handheld devices used by store managers to the automated logistics of "The Cube."
The Fast Fashion Paradigm: Speed as a Competitive Advantage
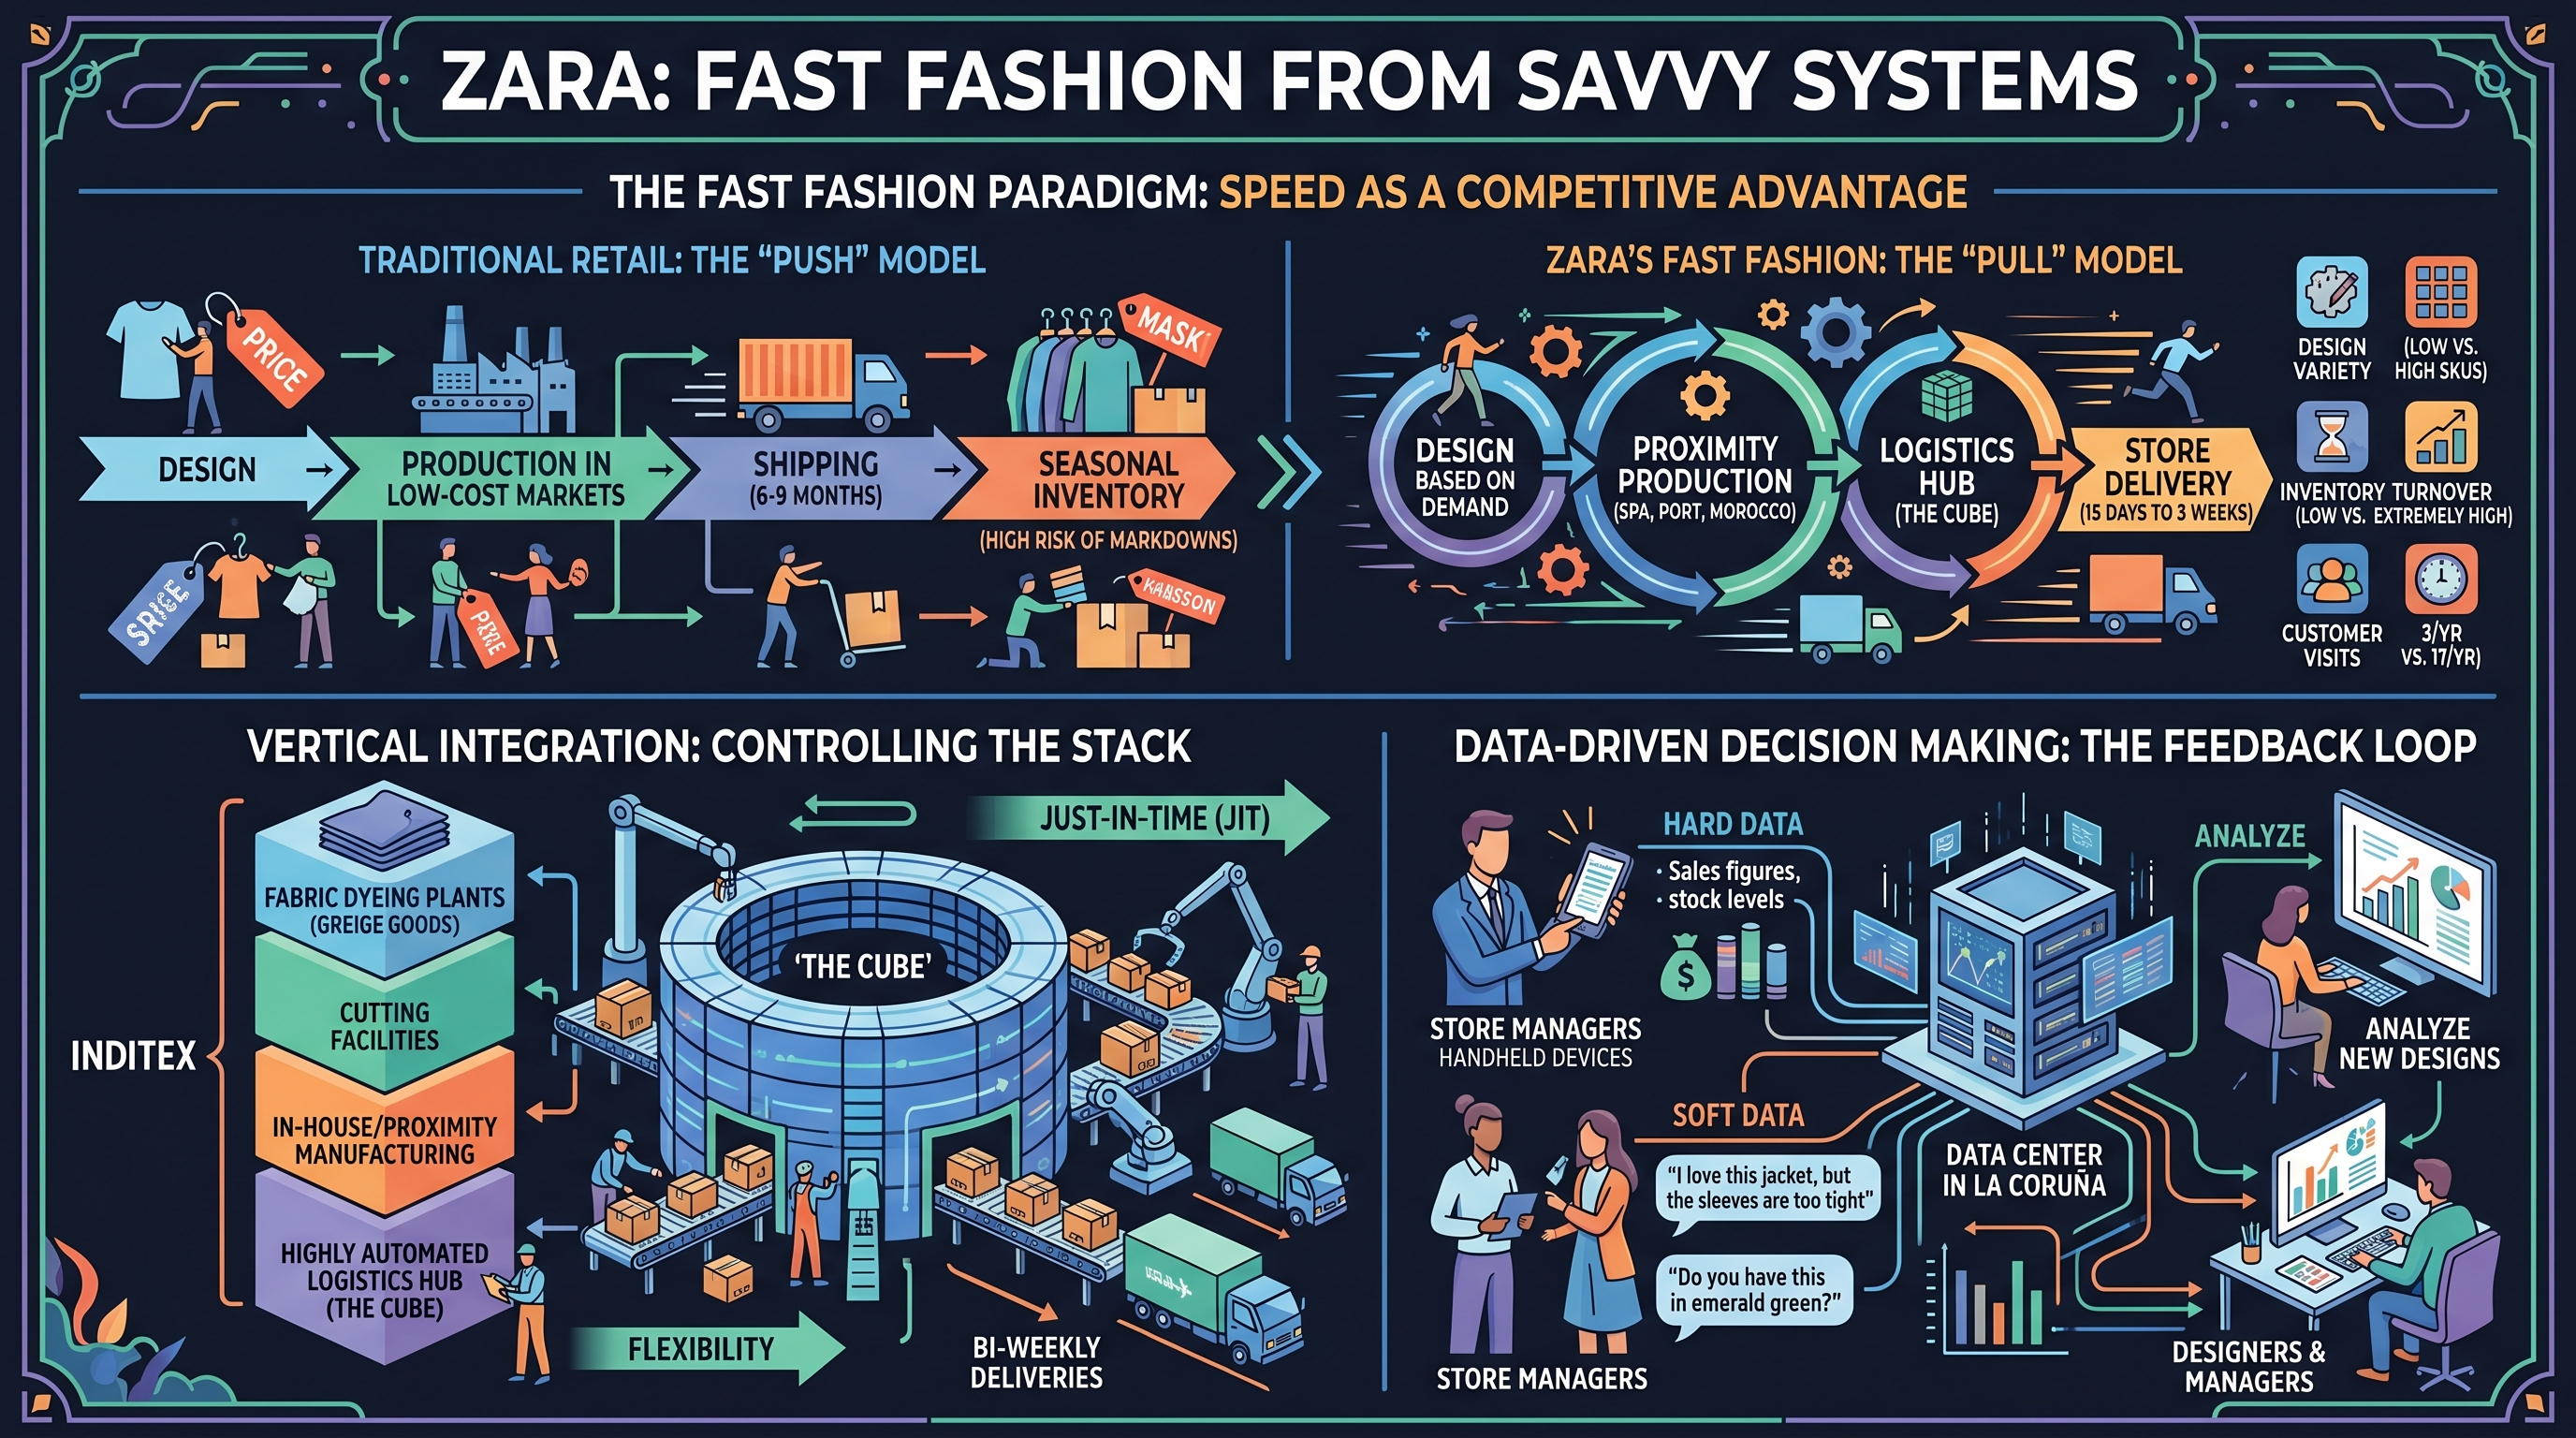
In the traditional retail model, designers predict trends nearly a year in advance. This "push" model relies on massive production runs in low-cost labor markets (e.g., Southeast Asia) to achieve economies of scale. However, this leads to significant Inventory Risk: if the trend fails to materialize, the retailer is forced to use deep markdowns to clear stock.
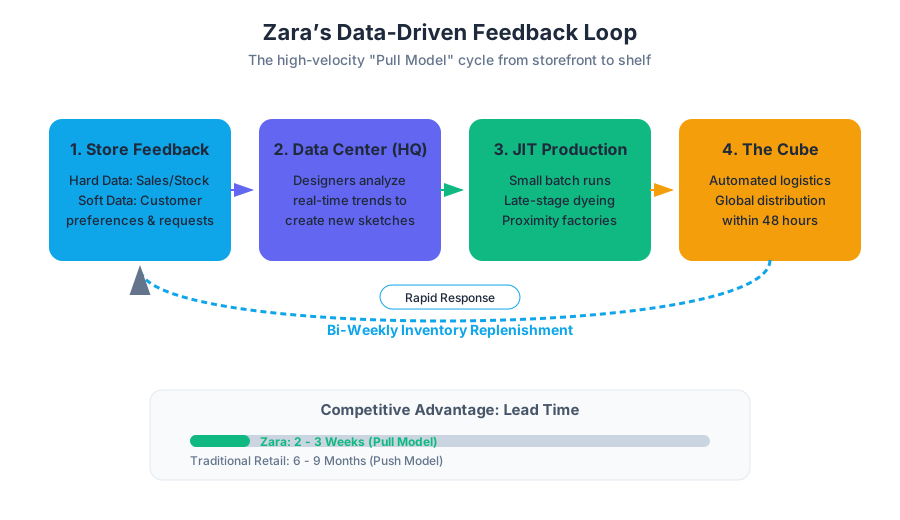
Zara utilizes a Pull Model, where production is driven by actual customer demand captured in real-time. This reduces the need for advertising and markdowns, as the products in-store are precisely what customers are asking for at that moment.
Comparison: Traditional Retail vs. Zara
| Metric | Traditional Retail | Zara (Fast Fashion) |
|---|---|---|
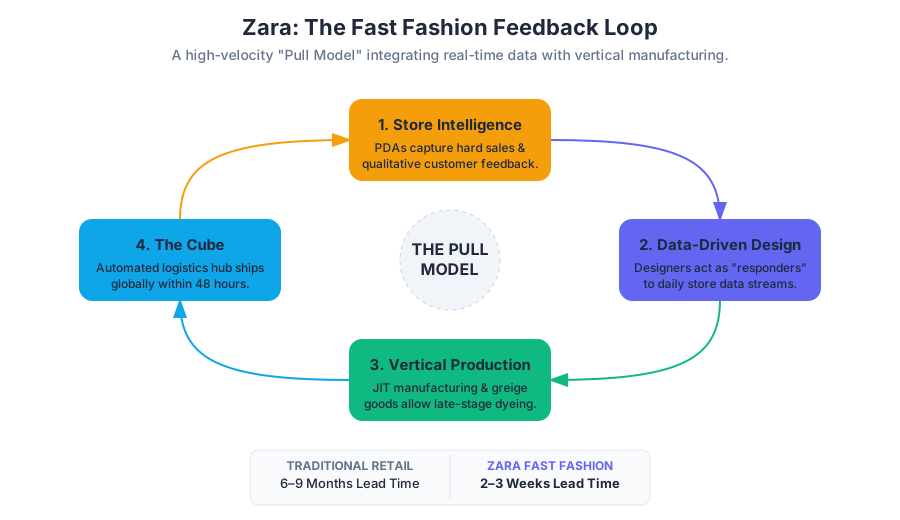
| Design-to-Shelf Lead Time | 6 to 9 months | 15 days to 3 weeks |
| Design Variety | 2,000 – 4,000 SKUs/year | 12,000 – 30,000 SKUs/year |
| Manufacturing Location | Outsourced (Low-cost/Far) | In-house/Proximity (Spain, Portugal, Morocco) |
| Inventory Turnover | Low (Seasonal batches) | Extremely High (Bi-weekly deliveries) |
| Markdown Rate | 50% – 70% of inventory | ~15% of inventory |
| Customer Store Visits | 3 times per year | 17 times per year |
Definition: Fast Fashion A retail strategy focused on the rapid transition of high-fashion trends from the catwalk to the consumer. It relies on compressed supply chains, small-batch production, and high-frequency inventory turnover.
Vertical Integration: Controlling the Stack
While most competitors outsource manufacturing to third parties to minimize capital expenditure, Zara is highly Vertically Integrated. Inditex owns its own fabric dyeing plants, cutting facilities, and logistics hubs.
The Strategic Logic of "Make" over "Buy"
In management theory, the "Make vs. Buy" decision usually favors "Buy" for non-core activities. Zara, however, views manufacturing speed as its core competency. By owning the production facilities, Zara avoids the friction of contract negotiations, shipping delays from overseas, and the lack of flexibility inherent in third-party agreements.
- Just-in-Time (JIT) Manufacturing: Zara produces roughly 60% of its merchandise in-house or in close proximity to its headquarters in La Coruña, Spain.
- Greige Goods: Zara purchases fabric in "greige" (undyed) form. This allows them to wait until the very last minute to dye the fabric based on which colors are trending in the current week.
- The "Cube": A massive, highly automated distribution center that serves as the central nervous system of the global operation.
Data-Driven Decision Making: The Feedback Loop
Zara’s "savvy systems" start on the shop floor. Store managers are equipped with custom handheld devices (originally PDAs, now specialized mobile apps) to capture two types of data:
- Hard Data: Real-time sales figures, inventory levels, and stockouts.
- Soft Data: Qualitative feedback from customers. (e.g., "I love this jacket, but the sleeves are too tight," or "Do you have this in emerald green?")
This information is beamed back to the Data Center in La Coruña, where designers and commercial managers analyze it daily. Unlike traditional firms where designers are "creative dictators," Zara designers are "data-driven responders."
Implementation: Inventory Velocity and Stockout Risk
To manage this high-speed flow, Zara uses algorithms to determine optimal replenishment. Below is a Python implementation demonstrating how a system might calculate the "Urgency Score" for a specific SKU based on sales velocity and current stock.
import math

def calculate_replenishment_urgency(sku_id, current_stock, daily_sales_velocity, lead_time_days):
    """
    Calculates an urgency score for SKU replenishment.
    A higher score indicates a higher priority for the next bi-weekly shipment.
    """
    # Safety stock calculation (simplified)
    z_score = 1.645  # 95% service level
    demand_std_dev = daily_sales_velocity * 0.2  # Assumption: 20% variance

    safety_stock = z_score * demand_std_dev * math.sqrt(lead_time_days)
    reorder_point = (daily_sales_velocity * lead_time_days) + safety_stock

    # Calculate Stockout Risk
    if current_stock <= 0:
        return 100.0  # Maximum urgency

    days_until_stockout = current_stock / daily_sales_velocity

    # Urgency increases exponentially as we approach the reorder point
    urgency_score = max(0, (reorder_point / current_stock) * 10)

    return round(min(urgency_score, 100), 2)

# Example: Store in Paris reporting on a 'Floral Summer Dress'
# Current Stock: 15 units, Selling 12 per day, Lead time: 2 days
print(f"Urgency Score: {calculate_replenishment_urgency('SKU-992', 15, 12, 2)}")
Supply Chain Management: The Logistics of 48 Hours
Zara’s logistics are designed for speed, not cost-minimization. While shipping by sea is cheaper, Zara frequently uses air freight to ensure that a design created in Spain can be on a rack in Tokyo or New York within 48 hours.
The Logistics Pipeline
- Automated Cutting: Computer-controlled machines cut fabric with millimeter precision to minimize waste.
- Local Sewing Clusters: Pieces are sent to local cooperatives for sewing. This keeps the "atoms" close to the "bits" (the data).
- The Underground Tunnel System: In La Coruña, a 124-mile labyrinth of underground tracks moves finished garments from factories to the central distribution center.
- Pre-Labeled/Pre-Hangered: Clothes arrive at stores already on hangers with security tags and price tags attached. This allows store staff to move items from the delivery truck to the sales floor in minutes.
Mathematical Modeling of Lead Time
The advantage of Zara's vertical integration can be expressed through the relationship between lead time ($L$) and the standard deviation of demand ($\sigma_D$). In traditional supply chain theory, the required safety stock ($SS$) is:
SS = Z \times \sqrt{L \times \sigma_D^2 + D^2 \times \sigma_L^2}
Where:
- $Z$ is the service level factor.
- $L$ is the lead time.
- $\sigma_D$ is the volatility of demand.
- $\sigma_L$ is the volatility of lead time.
By reducing $L$ from months to days and minimizing $\sigma_L$ through vertical ownership, Zara mathematically reduces the amount of capital tied up in safety stock, allowing for a leaner, more responsive inventory.
Strategic Technology Use: Less is More
Interestingly, Zara spends significantly less on Information Technology as a percentage of revenue than the industry average (~0.5% vs. 2.0%). This is a crucial lesson in Information Systems Management: the value of IT is not in the budget size, but in the Strategic Alignment of the technology with the business process.
Zara’s IT Principles
- Targeted Deployment: Technology is only used where it directly speeds up the "Design-to-Shelf" cycle.
- Simplicity: Store systems are designed to be used by fashion-focused employees, not IT specialists.
- Proprietary Software: Instead of using generic "Off-the-Shelf" ERP systems that would force Zara to follow industry-standard (slow) processes, they build custom software that mirrors their unique workflow.
Database Schema for Store Feedback
The following SQL schema illustrates how Zara captures the "Soft Data" that drives their design process, linking customer comments directly to SKU iterations.
-- Schema for capturing store-level qualitative feedback
CREATE TABLE StoreFeedback (
    feedback_id INT PRIMARY KEY AUTO_INCREMENT,
    store_id INT NOT NULL,
    sku_id INT NOT NULL,
    feedback_type ENUM('Fit', 'Color', 'Fabric', 'Style', 'Request'),
    customer_comment TEXT,
    urgency_level INT CHECK (urgency_level BETWEEN 1 AND 5),
    timestamp TIMESTAMP DEFAULT CURRENT_TIMESTAMP,
    FOREIGN KEY (store_id) REFERENCES Stores(id),
    FOREIGN KEY (sku_id) REFERENCES Inventory(sku)
);

-- Query to identify trending complaints or requests for designers
SELECT
    sku_id,
    feedback_type,
    COUNT(*) as mention_count,
    GROUP_CONCAT(customer_comment SEPARATOR ' | ') as comments
FROM StoreFeedback
WHERE timestamp > NOW() - INTERVAL 7 DAY
GROUP BY sku_id, feedback_type
HAVING mention_count > 10
ORDER BY mention_count DESC;
Challenges and the "Atoms to Bits" Transition
Despite its dominance, Zara faces emerging threats. The rise of Ultra-Fast Fashion (e.g., Shein) leverages even more aggressive data scraping and a purely digital storefront to undercut Zara’s lead times.
Common Pitfalls and Misconceptions
- The "Copycat" Risk: Zara’s model of responding to trends rather than setting them has led to numerous intellectual property lawsuits.
- Sustainability Concerns: The fast fashion model is inherently resource-intensive. Zara is currently investing in "Circular Fashion" and automated recycling to mitigate the environmental impact of its high-volume production.
- The Physical Footprint: While Zara’s stores act as showrooms and local distribution hubs, the shift to e-commerce (the transition from "Atoms to Bits") requires a re-evaluation of their expensive prime-real-estate strategy.
Summary of Strategic Frameworks
| Framework | Application to Zara |
|---|---|
| Porter’s Five Forces | Zara reduces the Bargaining Power of Buyers by creating "artificial scarcity" (if you don't buy it now, it's gone). |
| Resource-Based View (RBV) | Zara's supply chain is Valuable, Rare, Imperfectly Imitable, and Non-substitutable (VRIN), providing a sustainable advantage. |
| Value Chain Analysis | Zara optimizes the Inbound Logistics and Operations segments to a degree that competitors cannot match without radical restructuring. |
Artifacts Appendix
Flashcards
- Fast Fashion: A retail model based on rapid response to trends and high inventory turnover.
- Vertical Integration: When a firm owns multiple stages of its production/distribution chain.
- Just-In-Time (JIT): An inventory strategy that aligns raw-material orders from suppliers directly with production schedules.
- The Cube: Zara’s highly automated, centralized distribution hub in Spain.
- Inventory Risk: The financial risk that a retailer will be unable to sell its stock at the intended price.
- Greige Goods: Raw fabric that has not yet been bleached or dyed.
Quiz
- Why does Zara prefer to own its production facilities rather than outsource to low-cost regions?
- Answer: To maintain maximum flexibility and lead-time speed, which is more valuable than low labor costs in a fast-fashion model.
- How does Zara create "artificial scarcity"?
- Answer: By producing small batches and frequently changing inventory, encouraging customers to buy immediately.
- What is the primary role of a Zara store manager in the design process?
- Answer: To act as a data sensor, reporting both sales figures and qualitative customer feedback to designers.
- How does the "Greige Goods" strategy benefit Zara?
- Answer: It allows them to postpone the color-choice decision until the latest possible moment based on real-time trend data.
Study Guide: Zara and Information Systems
- Key Objective: Understand how technology enables a business process rather than just automating an old one.
- Core Concepts to Master:
- The difference between "Push" and "Pull" supply chains.
- The financial implications of high inventory turnover.
- The strategic trade-offs of vertical integration.
- The role of "Soft Data" in decision-making.
- Case Study Comparison: Compare Zara’s model to a traditional retailer like Gap or H&M. Note the differences in advertising spend and markdown frequency.
- Technical Focus: Review the impact of lead time on the safety stock formula and how automated logistics (RFID, automated sorting) reduce friction in the distribution phase.
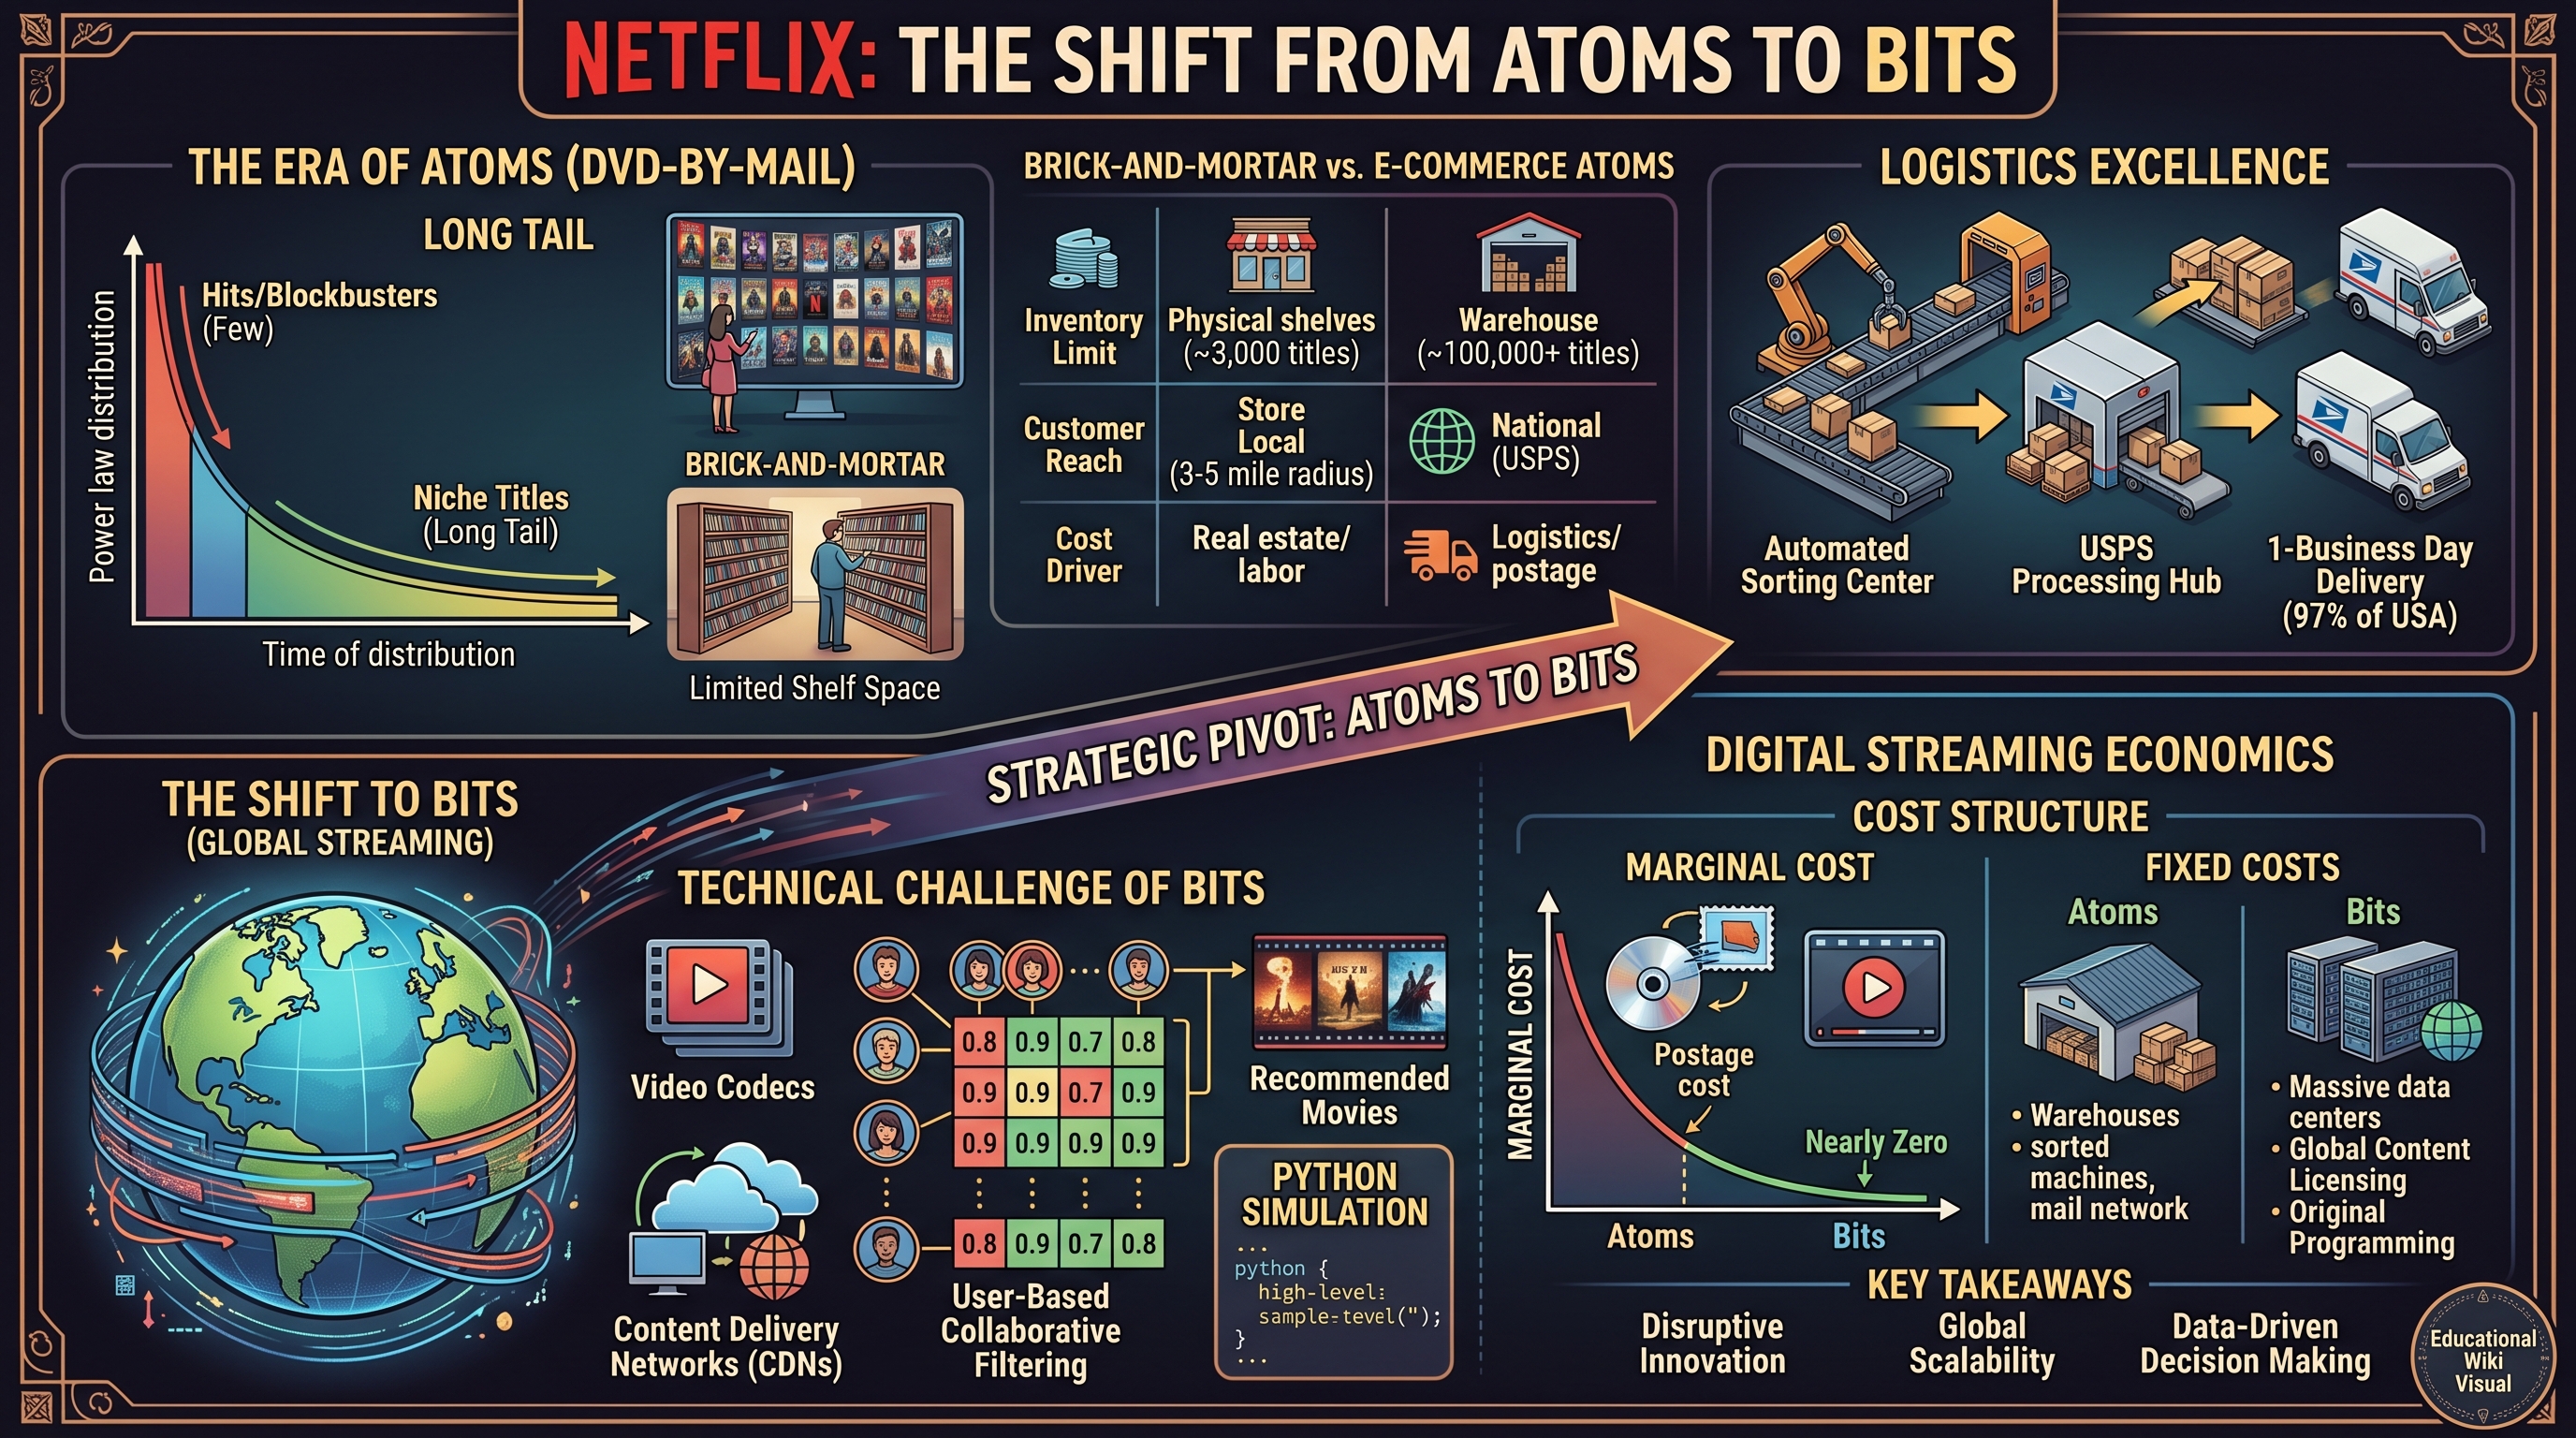
Netflix: The Shift from Atoms to Bits
Key concepts: Atoms to Bits · Disruptive Innovation · Digital Streaming Economics · E-commerce Strategy
An analysis of Netflix's evolution from a physical DVD-by-mail service to a global streaming giant, highlighting the economics of digital distribution.
Netflix: The Shift from Atoms to Bits
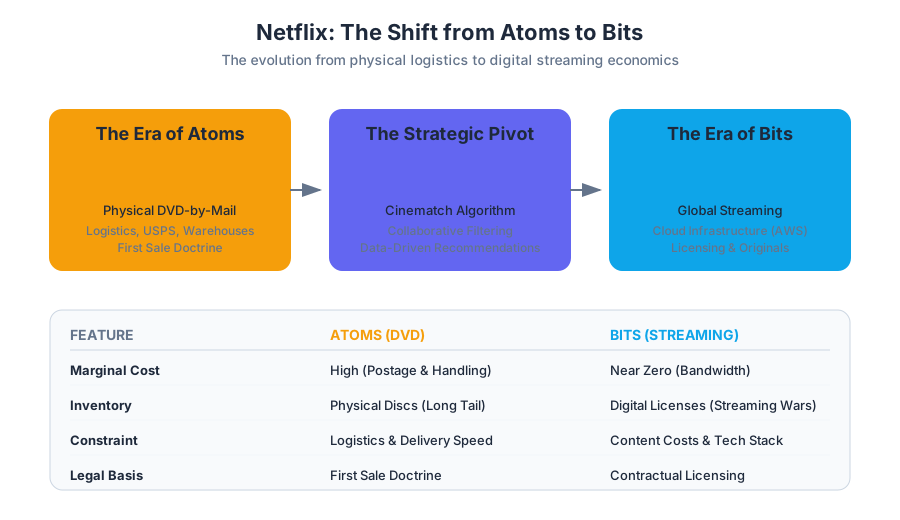
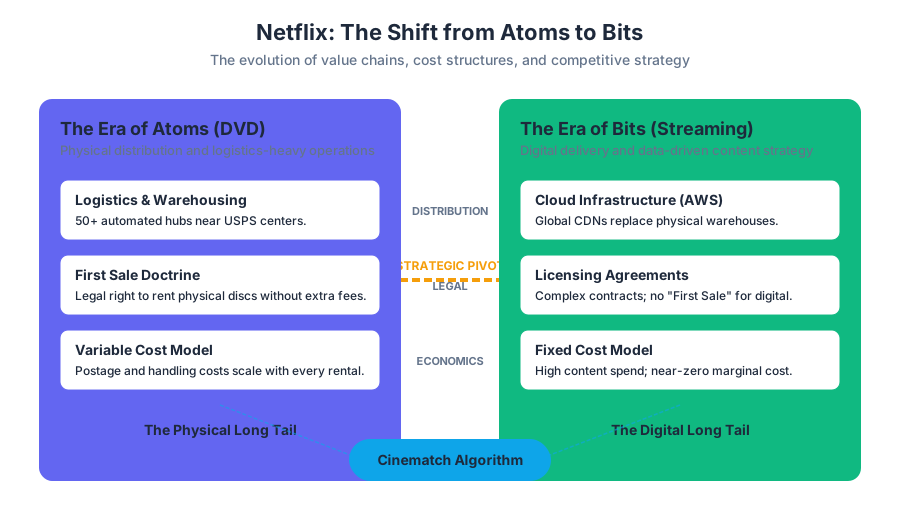
Netflix represents the quintessential case study in Digital Transformation and Disruptive Innovation. Its evolution from a niche DVD-by-mail service to a global streaming hegemon illustrates the profound economic and operational shifts that occur when a business moves from distributing physical goods (atoms) to digital information (bits). This transition is not merely a change in medium; it represents a fundamental re-architecting of the firm’s value chain, cost structure, and competitive strategy.
The Genesis: The Era of Atoms
In its initial phase, Netflix operated within the constraints of the physical world. While it was an e-commerce company, its product—the DVD—was a physical object that required warehouses, sorting machines, and the United States Postal Service (USPS) for delivery.
The Economics of the DVD-by-Mail Model
The DVD-by-mail model was built on the Long Tail, a concept popularized by Chris Anderson. Unlike traditional brick-and-mortar retailers like Blockbuster, which were limited by shelf space and geography, Netflix could offer a near-infinite catalog.
The Long Tail: A business strategy that allows companies to realize significant profits by selling low volumes of hard-to-find items to many customers, instead of only selling large volumes of a reduced number of popular items.
| Feature | Brick-and-Mortar (Blockbuster) | E-commerce Atoms (Netflix DVD) |
|---|---|---|
| Inventory Limit | Physical shelf space (~3,000 titles) | Warehouse capacity (~100,000+ titles) |
| Customer Reach | Local (3-5 mile radius) | National (anywhere with mail) |
| Selection Strategy | Hits/Blockbusters (80/20 rule) | The Long Tail (Niche + Hits) |
| Cost Driver | Real estate and local labor | Logistics and postage |
| Late Fees | Major revenue source (and pain point) | Eliminated (Subscription model) |
Operational Excellence in Logistics
To compete with the "instant gratification" of a local video store, Netflix built a sophisticated network of automated distribution centers. By 2009, Netflix had over 50 centers located near USPS processing hubs, ensuring that 97% of its customer base received DVDs within one business day. This was a Resource-Based View (RBV) advantage: the combination of scale, brand, and a proprietary logistics network created a barrier to entry that was difficult for competitors to replicate.
The Pivot: Transitioning from Atoms to Bits
The shift to streaming (bits) was not an overnight success but a calculated strategic pivot. Nicholas Negroponte’s concept of "Atoms to Bits" suggests that any media-based industry will eventually see its physical components replaced by digital ones. For Netflix, this meant moving from a logistics-heavy company to a software-and-data-heavy company.
The Technical Challenge of Bits
Streaming video over the internet in the mid-2000s was a daunting technical challenge. It required advances in video codecs, content delivery networks (CDNs), and consumer hardware.
Netflix’s recommendation engine, Cinematch, became the bridge between the two eras. By using Collaborative Filtering, Netflix could predict what users wanted to watch, regardless of the format.
import numpy as np
from sklearn.metrics.pairwise import cosine_similarity

def calculate_recommendations(user_item_matrix, target_user_index):
    """
    A low-level implementation of User-Based Collaborative Filtering.
    Calculates similarity between users to predict ratings for 'bits' content.
    """
    # Calculate Cosine Similarity between the target user and all others
    user_sim = cosine_similarity(user_item_matrix)
    similar_users = user_sim[target_user_index]

    # Weighted average of ratings from similar users
    # (Simplified: ignoring users with 0 similarity)
    weighted_ratings = np.dot(similar_users, user_item_matrix)
    sum_of_weights = np.array([np.abs(similar_users).sum()] * user_item_matrix.shape[1])

    # Avoid division by zero
    predictions = np.divide(weighted_ratings, sum_of_weights,
                            out=np.zeros_like(weighted_ratings),
                            where=sum_of_weights!=0)

    return predictions

# Example: 4 users, 5 movies (0 = unrated)
data = np.array([
    [5, 3, 0, 1, 4],
    [4, 0, 0, 1, 2],
    [1, 1, 0, 5, 0],
    [0, 0, 4, 0, 0]
])
print(f"Predicted ratings for User 0: {calculate_recommendations(data, 0)}")
Digital Streaming Economics
The move to bits fundamentally altered the financial profile of the company. In the "atoms" world, the Marginal Cost of sending one more DVD was the cost of postage and handling. In the "bits" world, the marginal cost of one more stream is nearly zero, but the Fixed Costs of content licensing and infrastructure are astronomical.
Content Licensing vs. The First Sale Doctrine
A critical legal distinction exists between physical and digital media. Under the First Sale Doctrine, Netflix could buy a physical DVD and rent it out as many times as it wanted without paying the studio again. However, this doctrine does not apply to digital streams.
First Sale Doctrine: A legal principle allowing the purchaser of a copyrighted work to sell, display, or otherwise dispose of that particular copy, notwithstanding the interests of the copyright owner.
For streaming, Netflix must negotiate licenses for every title. This led to the "Streaming Wars," as content owners (Disney, NBCUniversal) realized they could launch their own platforms and pull their content from Netflix.
The Cost Function of Distribution
The economic shift can be modeled by comparing the total cost ($TC$) of distribution for atoms ($A$) versus bits ($B$).
TC_A = F_A + v_A(n)
TC_B = F_B + v_B(n)
Where:
- $F_A$: Fixed costs of warehouses and sorting machines.
- $v_A$: Variable cost per DVD (postage, breakage, labor), which scales linearly with the number of shipments $n$.
- $F_B$: Fixed costs of content licensing and server infrastructure.
- $v_B$: Variable cost per stream (bandwidth), which is negligible ($v_B \ll v_A$).
As $n$ (the number of subscribers/views) increases, the Economies of Scale in the bits model become vastly superior, as the high fixed costs are spread across a larger base, while the marginal cost remains near zero.
Disruptive Innovation and the "Innovator's Dilemma"
Netflix’s victory over Blockbuster is the textbook example of Disruptive Innovation, a theory developed by Clayton Christensen.
- Lower Performance/Lower Price: Initially, Netflix’s DVD-by-mail was "worse" than Blockbuster because you had to wait a day for the movie. However, it was cheaper (no late fees) and more convenient for certain segments.
- Incumbent Blindness: Blockbuster was optimized for high-margin "new releases" and late fees. Adopting Netflix's model would have required "cannibalizing" their own profitable business—a classic Innovator's Dilemma.
- Straddling: Blockbuster eventually tried to do both (stores + mail), but they couldn't match Netflix's pure-play efficiency. This is known as Straddling, where a firm tries to occupy two markets but fails to excel in either.
| Strategy Phase | Netflix Action | Blockbuster Response | Result |
|---|---|---|---|
| Entry | Niche DVD-by-mail; focused on early adopters. | Ignored; focused on store foot traffic. | Netflix builds brand and scale. |
| Expansion | Eliminated late fees; introduced subscription. | Attempted "Total Access" (store + mail). | Blockbuster incurs massive losses (Straddling). |
| The Pivot | Launched "Watch Instantly" (Streaming). | Filed for bankruptcy (2010). | Netflix transitions to bits; Blockbuster collapses. |
| Dominance | Vertical Integration (Original Content). | N/A | Netflix becomes a global studio. |
Data as a Strategic Asset
In the bits era, every click, pause, and rewind is a data point. Netflix uses this data not just for recommendations, but for Content Acquisition and production.
Big Data in Production
When Netflix decided to spend $100 million on House of Cards, it wasn't a gamble. They knew:
- A large portion of their audience streamed David Fincher movies.
- Films starring Kevin Spacey performed well.
- The British version of House of Cards was a hit among their subscribers.
This data-driven approach reduces the risk of content failure, a major advantage over traditional Hollywood studios that rely on "gut feeling."
-- Example: Analyzing user behavior to justify content spend
-- This query identifies 'binge-ability' of a genre to guide licensing decisions.
SELECT
    m.genre,
    COUNT(DISTINCT v.user_id) AS total_viewers,
    AVG(v.completion_rate) AS avg_completion,
    SUM(v.duration_watched) / COUNT(DISTINCT v.session_id) AS avg_session_length
FROM
    content_metadata m
JOIN
    viewing_history v ON m.content_id = v.content_id
WHERE
    v.view_date > CURRENT_DATE - INTERVAL '90 days'
GROUP BY
    m.genre
HAVING
    AVG(v.completion_rate) > 0.8
ORDER BY
    avg_session_length DESC;
The Infrastructure of Bits: AWS and Open Connect
To handle the massive scale of global streaming, Netflix moved away from its own data centers to a Cloud-First architecture using Amazon Web Services (AWS). However, to solve the "last mile" delivery problem and avoid internet congestion, they built their own CDN called Open Connect.
Microservices Architecture
Netflix's backend is composed of thousands of Microservices. This allows for high availability; if the "recommendation" service fails, the "video playback" service can still function.
# Simplified Kubernetes Deployment for a Netflix-style Microservice
apiVersion: apps/v1
kind: Deployment
metadata:
  name: recommendation-engine
spec:
  replicas: 50
  selector:
    matchLabels:
      app: rec-engine
  template:
    metadata:
      labels:
        app: rec-engine
    spec:
      containers:
      - name: rec-engine-container
        image: netflix/rec-engine:v4.2.1
        ports:
        - containerPort: 8080
        resources:
          limits:
            cpu: "500m"
            memory: "1Gi"
          requests:
            cpu: "200m"
            memory: "512Mi"
Common Pitfalls and Strategic Risks
Despite its success, the shift to bits introduces new vulnerabilities:
- Content Costs: As mentioned, the loss of the First Sale Doctrine means content costs are a perpetual variable. Netflix's debt load has grown significantly as it finances original content to mitigate this.
- Bandwidth Caps and Net Neutrality: Internet Service Providers (ISPs) can act as gatekeepers. If ISPs charge Netflix more for "fast lanes," the economics of bits become less favorable.
- Global Licensing: Licensing content globally is a legal nightmare. A show available in the US might not be available in France due to local "windowing" laws (the time delay between theater release and streaming).
Conclusion
The story of Netflix is the story of a company that understood the inevitable shift from atoms to bits before its competitors did. By mastering the logistics of atoms, it built the brand and capital necessary to survive the expensive transition to bits. Today, Netflix is no longer just a "tech company" or a "distributor"—it is a vertically integrated media giant that uses data and scale to redefine how the world consumes entertainment.
Moore’s Law and Computing Economics
Key concepts: Moore's Law · Supercomputing · Grid Computing · E-waste
Understanding the business implications of the rapid increase in computing power and the corresponding decrease in costs.
Moore’s Law and Computing Economics
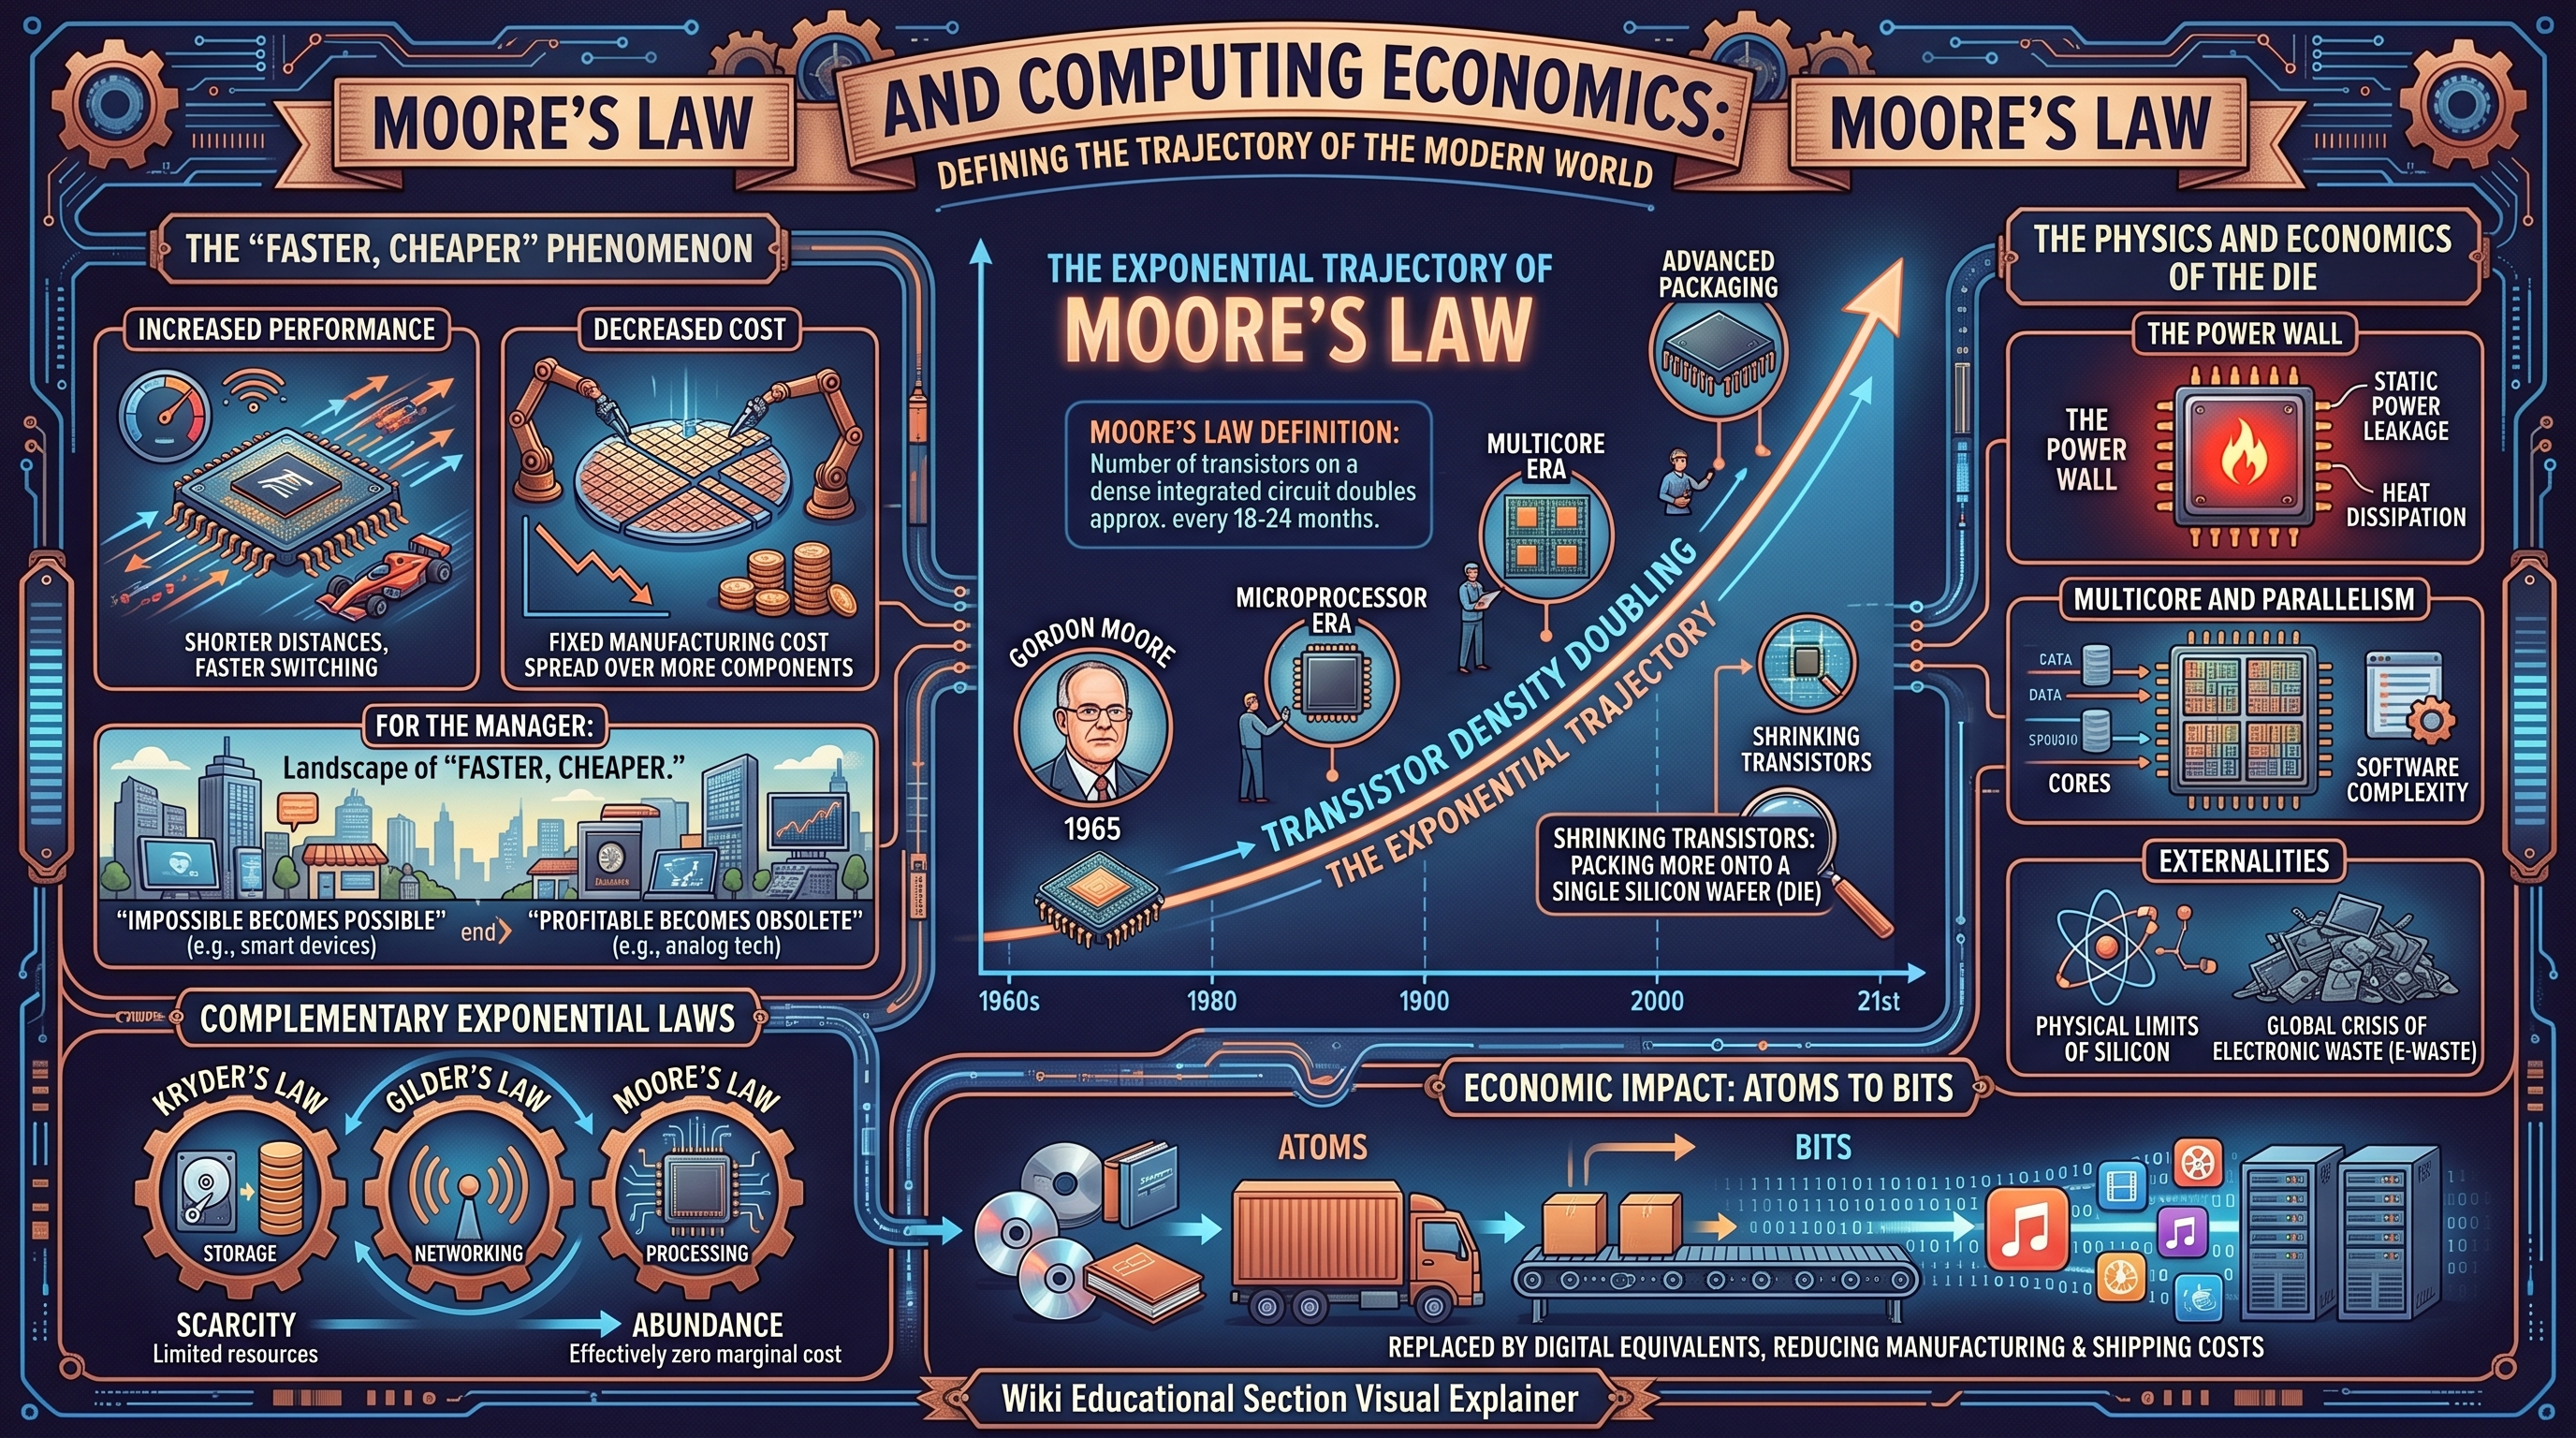
Moore’s Law is not a law of physics in the Newtonian sense, but rather an observation of industrial productivity and a self-fulfilling prophecy that has defined the trajectory of the modern world. Originally articulated by Gordon Moore, the co-founder of Intel, in a 1965 paper, the principle posits that the number of transistors that can be placed inexpensively on an integrated circuit doubles approximately every two years.
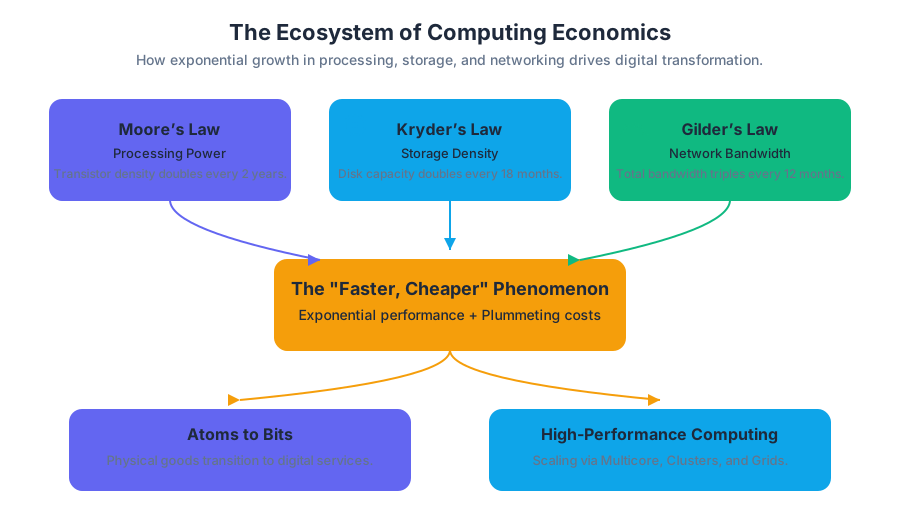
This exponential growth has resulted in a radical transformation of computing economics: as performance skyrockets, costs plummet. For the manager, this creates a landscape of "faster, cheaper" computing where the impossible becomes possible, and the profitable becomes obsolete with dizzying speed. However, this relentless march of progress brings significant externalities, ranging from the physical limits of silicon to the mounting global crisis of electronic waste (e-waste).
The Mechanics of Exponential Growth
At the heart of Moore’s Law is the Integrated Circuit (IC). By shrinking the size of a transistor—the fundamental "on/off" switch of digital logic—engineers can pack more components onto a single silicon wafer (the die).
The "Faster, Cheaper" Phenomenon
The doubling of transistor density yields two primary benefits:
- Increased Performance: Shorter distances between transistors allow for faster switching speeds and reduced latency.
- Decreased Cost: Since the cost of manufacturing a silicon wafer is relatively fixed, doubling the number of components on that wafer effectively halves the cost per component.
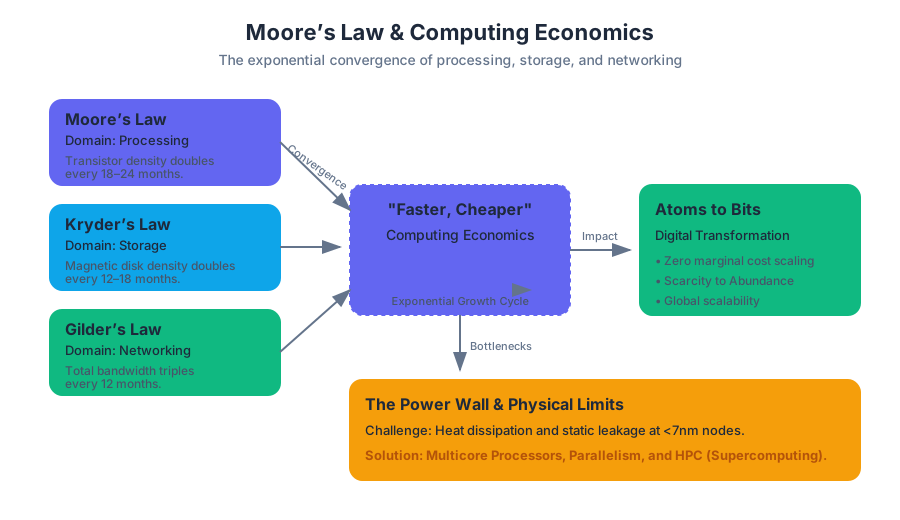
Moore’s Law Definition: The observation that the number of transistors in a dense integrated circuit doubles approximately every 18 to 24 months, leading to an exponential increase in processing power and a corresponding decrease in the cost of computing.
Beyond the CPU: Kryder’s and Gilder’s Laws
Moore's Law does not exist in a vacuum. It is complemented by similar exponential trends in storage and networking:
| Law | Domain | Observation |
|---|---|---|
| Moore’s Law | Processing | Transistor density doubles every 18–24 months. |
| Kryder’s Law | Storage | The density of data on magnetic disks doubles every 12–18 months. |
| Gilder’s Law | Networking | Total bandwidth of communication systems triples every 12 months. |
The convergence of these three laws has shifted the business landscape from a world of scarcity (where computing power was a precious resource) to a world of abundance (where the marginal cost of processing a bit is effectively zero).
The Physics and Economics of the Die
As transistors approach the size of a few atoms, the industry faces the Power Wall. Traditionally, as transistors shrank, they became more power-efficient (Dennard Scaling). However, below the 7nm and 5nm nodes, static power leakage and heat dissipation have become major bottlenecks.
Multicore and Parallelism
To circumvent the heat limits of single-core clock speeds, the industry shifted toward Multicore Processors. Instead of one "super-fast" brain, a chip now has multiple "brains" (cores) working in parallel. This shift requires a fundamental change in software engineering, moving from linear execution to concurrent programming.
/*
 * Low-level C example: Demonstrating the "Power Wall" constraint.
 * In modern systems, we often trade clock speed for core count.
 * This snippet simulates a basic workload distribution across cores.
 */

#include <stdio.h>
#include <pthread.h>

#define NUM_CORES 4
#define WORKLOAD 1000000

void* process_data(void* arg) {
    long core_id = (long)arg;
    double result = 0.0;
    // Simulate a heavy computational task restricted by thermal limits
    for (int i = 0; i < WORKLOAD; i++) {
        result += (i * 0.001);
    }
    printf("Core %ld finished computation.\n", core_id);
    return NULL;
}

int main() {
    pthread_t threads[NUM_CORES];
    for (long i = 0; i < NUM_CORES; i++) {
        pthread_create(&threads[i], NULL, process_data, (void*)i);
    }
    for (int i = 0; i < NUM_CORES; i++) {
        pthread_join(threads[i], NULL);
    }
    return 0;
}
The Economic Impact: Atoms to Bits
The "Faster, Cheaper" trend enables the transition from Atoms to Bits. Physical goods (atoms) like CDs, DVDs, and books are replaced by digital equivalents (bits). This transition eliminates costs associated with manufacturing, shipping, and inventory, allowing companies like Netflix and Spotify to scale globally with minimal physical infrastructure.
High-Performance Computing: Supercomputing and Grid Computing
When a single computer—even a powerful multicore server—is insufficient, organizations turn to High-Performance Computing (HPC). This involves aggregating the power of thousands of processors to solve "Grand Challenge" problems.
Supercomputing
A Supercomputer is a single, massive machine designed for maximum throughput. Modern supercomputers utilize Massively Parallel Processing (MPP), where thousands of processors work in tight coordination.
- Metric: Performance is measured in FLOPS (Floating Point Operations Per Second).
- Use Cases: Nuclear fusion simulation, climate modeling, and cryptographic analysis.
Grid and Cluster Computing
While supercomputers are expensive, proprietary assets, Grid Computing and Cluster Computing offer a more modular approach.
| Feature | Cluster Computing | Grid Computing |
|---|---|---|
| Connectivity | High-speed local interconnects (InfiniBand). | Standard Internet/WAN connections. |
| Geography | Centralized in one data center. | Geographically distributed. |
| Homogeneity | Usually identical hardware/OS. | Heterogeneous (different hardware/OS). |
| Ownership | Single organization. | Often collaborative (e.g., SETI@home). |
Key Insight: Grid computing allows organizations to harness "dark silicon"—the idle processing power of thousands of desktop PCs—to perform massive calculations at a fraction of the cost of a supercomputer.
\text{Performance Gain (Amdahl's Law)} \\
S_{latency}(s) = \frac{1}{(1 - p) + \frac{p}{s}} \\
\text{where: } \\
s = \text{speedup of the part of the task that benefits from resources} \\
p = \text{proportion of execution time that the part benefiting from resources originally occupied}
Real-World Implementation: MPI
To make these distributed systems work, developers use libraries like the Message Passing Interface (MPI) to coordinate tasks across a network.
# Real-world usage: A Python snippet using mpi4py to distribute
# a calculation across a cluster or grid environment.

from mpi4py import MPI
import numpy as np

comm = MPI.COMM_WORLD
rank = comm.Get_rank()
size = comm.Get_size()

# Data to be processed
data_size = 1000000
local_n = data_size // size

# Each node calculates its own portion of the data
data_segment = np.random.rand(local_n)
local_sum = np.sum(data_segment)

# Reduce all local sums to a single global sum on the master node (rank 0)
total_sum = comm.reduce(local_sum, op=MPI.SUM, root=0)

if rank == 0:
    print(f"Total calculated sum across {size} nodes: {total_sum}")
The Dark Side of Moore’s Law: E-Waste
The flip side of "faster and cheaper" is obsolescence. Because technology improves so rapidly, the useful life of a device has plummeted. This has created a massive environmental challenge known as E-waste (Electronic Waste).
The Toxicity of Tech
Electronic components are a "toxic cocktail" of heavy metals and hazardous chemicals. When disposed of improperly, these substances leach into the soil and groundwater.
| Material | Component Location | Health/Environmental Impact |
|---|---|---|
| Lead | Solder, CRT glass | Neurotoxin, kidney damage. |
| Mercury | Backlights, switches | Brain and liver damage. |
| Cadmium | Resistors, batteries | Carcinogenic, kidney failure. |
| BFRs | Plastic casings, PCBs | Endocrine disruption. |
The Global Path of Waste
Much of the world's e-waste is exported from developed nations to developing countries (like Ghana, China, and India), where "informal" recycling operations use primitive methods (like burning plastic off wires) to extract precious metals like gold and copper. This creates devastating health outcomes for local workers.
Managerial Responsibility and the Circular Economy
Managers must look beyond the initial purchase price of technology and consider the Total Cost of Ownership (TCO), including disposal.
- Design for Disassembly: Choosing hardware that is easy to repair and recycle.
- Take-back Programs: Partnering with vendors who guarantee responsible recycling.
- Cloud Computing: By shifting workloads to the cloud, firms can reduce their physical hardware footprint, pushing the responsibility of hardware lifecycle management to hyper-scale providers like AWS or Azure, who have higher incentives for efficiency.
Strategic Managerial Implications
The economic reality of Moore’s Law forces a shift in strategic thinking. If computing power is effectively free in the future, how does that change your business model today?
1. The "Wait" Strategy
In some cases, it is more cost-effective to delay a project. If a task requires a level of processing power that is currently expensive, waiting 18 months might make the project feasible at half the cost.
2. Disruptive Innovation
Moore’s Law is the engine of disruption. It allows new entrants to use "cheap" tech to undermine established players who are tied to "expensive" legacy systems.
- Example: Digital photography (Moore's Law applied to sensors) destroyed Kodak, a company built on the chemistry of film (atoms).
3. Data as the New Capital
As processing becomes a commodity, the value shifts from the ability to process to the data being processed. This is why modern giants (Google, Meta, Amazon) focus on data acquisition; the hardware to analyze it will always get cheaper, but the data itself is a unique, non-depreciating asset.
4. Software Complexity Inflation
Known as Wirth’s Law, software often slows down faster than hardware speeds up. Managers must ensure that gains from Moore’s Law are not squandered by inefficient, bloated software layers.
# Example: Infrastructure as Code (Terraform/YAML)
# Managers now treat hardware as disposable software-defined entities.
# This config defines a scalable cluster that grows as demand increases.

resource "aws_autoscaling_group" "compute_cluster" {
  name                 = "moores-law-scaling-group"
  max_size             = 100
  min_size             = 2
  desired_capacity     = 10
  launch_configuration = aws_launch_configuration.app_conf.name
  vpc_zone_identifier  = [aws_subnet.primary.id]

  tag {
    key                 = "Environment"
    value               = "Production"
    propagate_at_launch = true
  }
}
Common Pitfalls and Misconceptions
- The "Law" Fallacy: Moore’s Law is an observation of human ingenuity and market competition. It can end if the economic incentive to shrink transistors vanishes or if physical limits (like the size of an atom) become insurmountable.
- Ignoring Latency: While processing power doubles, the speed of light remains constant. This means that as chips get faster, the "distance" to memory or other servers becomes a massive bottleneck (the Memory Wall).
- Underestimating E-waste: Many firms treat hardware disposal as an afterthought, ignoring the legal and reputational risks associated with toxic waste dumping.
Understanding Network Effects
Key concepts: Network Effects · Metcalfe's Law · One-Sided Markets · Two-Sided Markets
An introduction to how the value of products and services scales with the size of their user base.
Understanding Network Effects
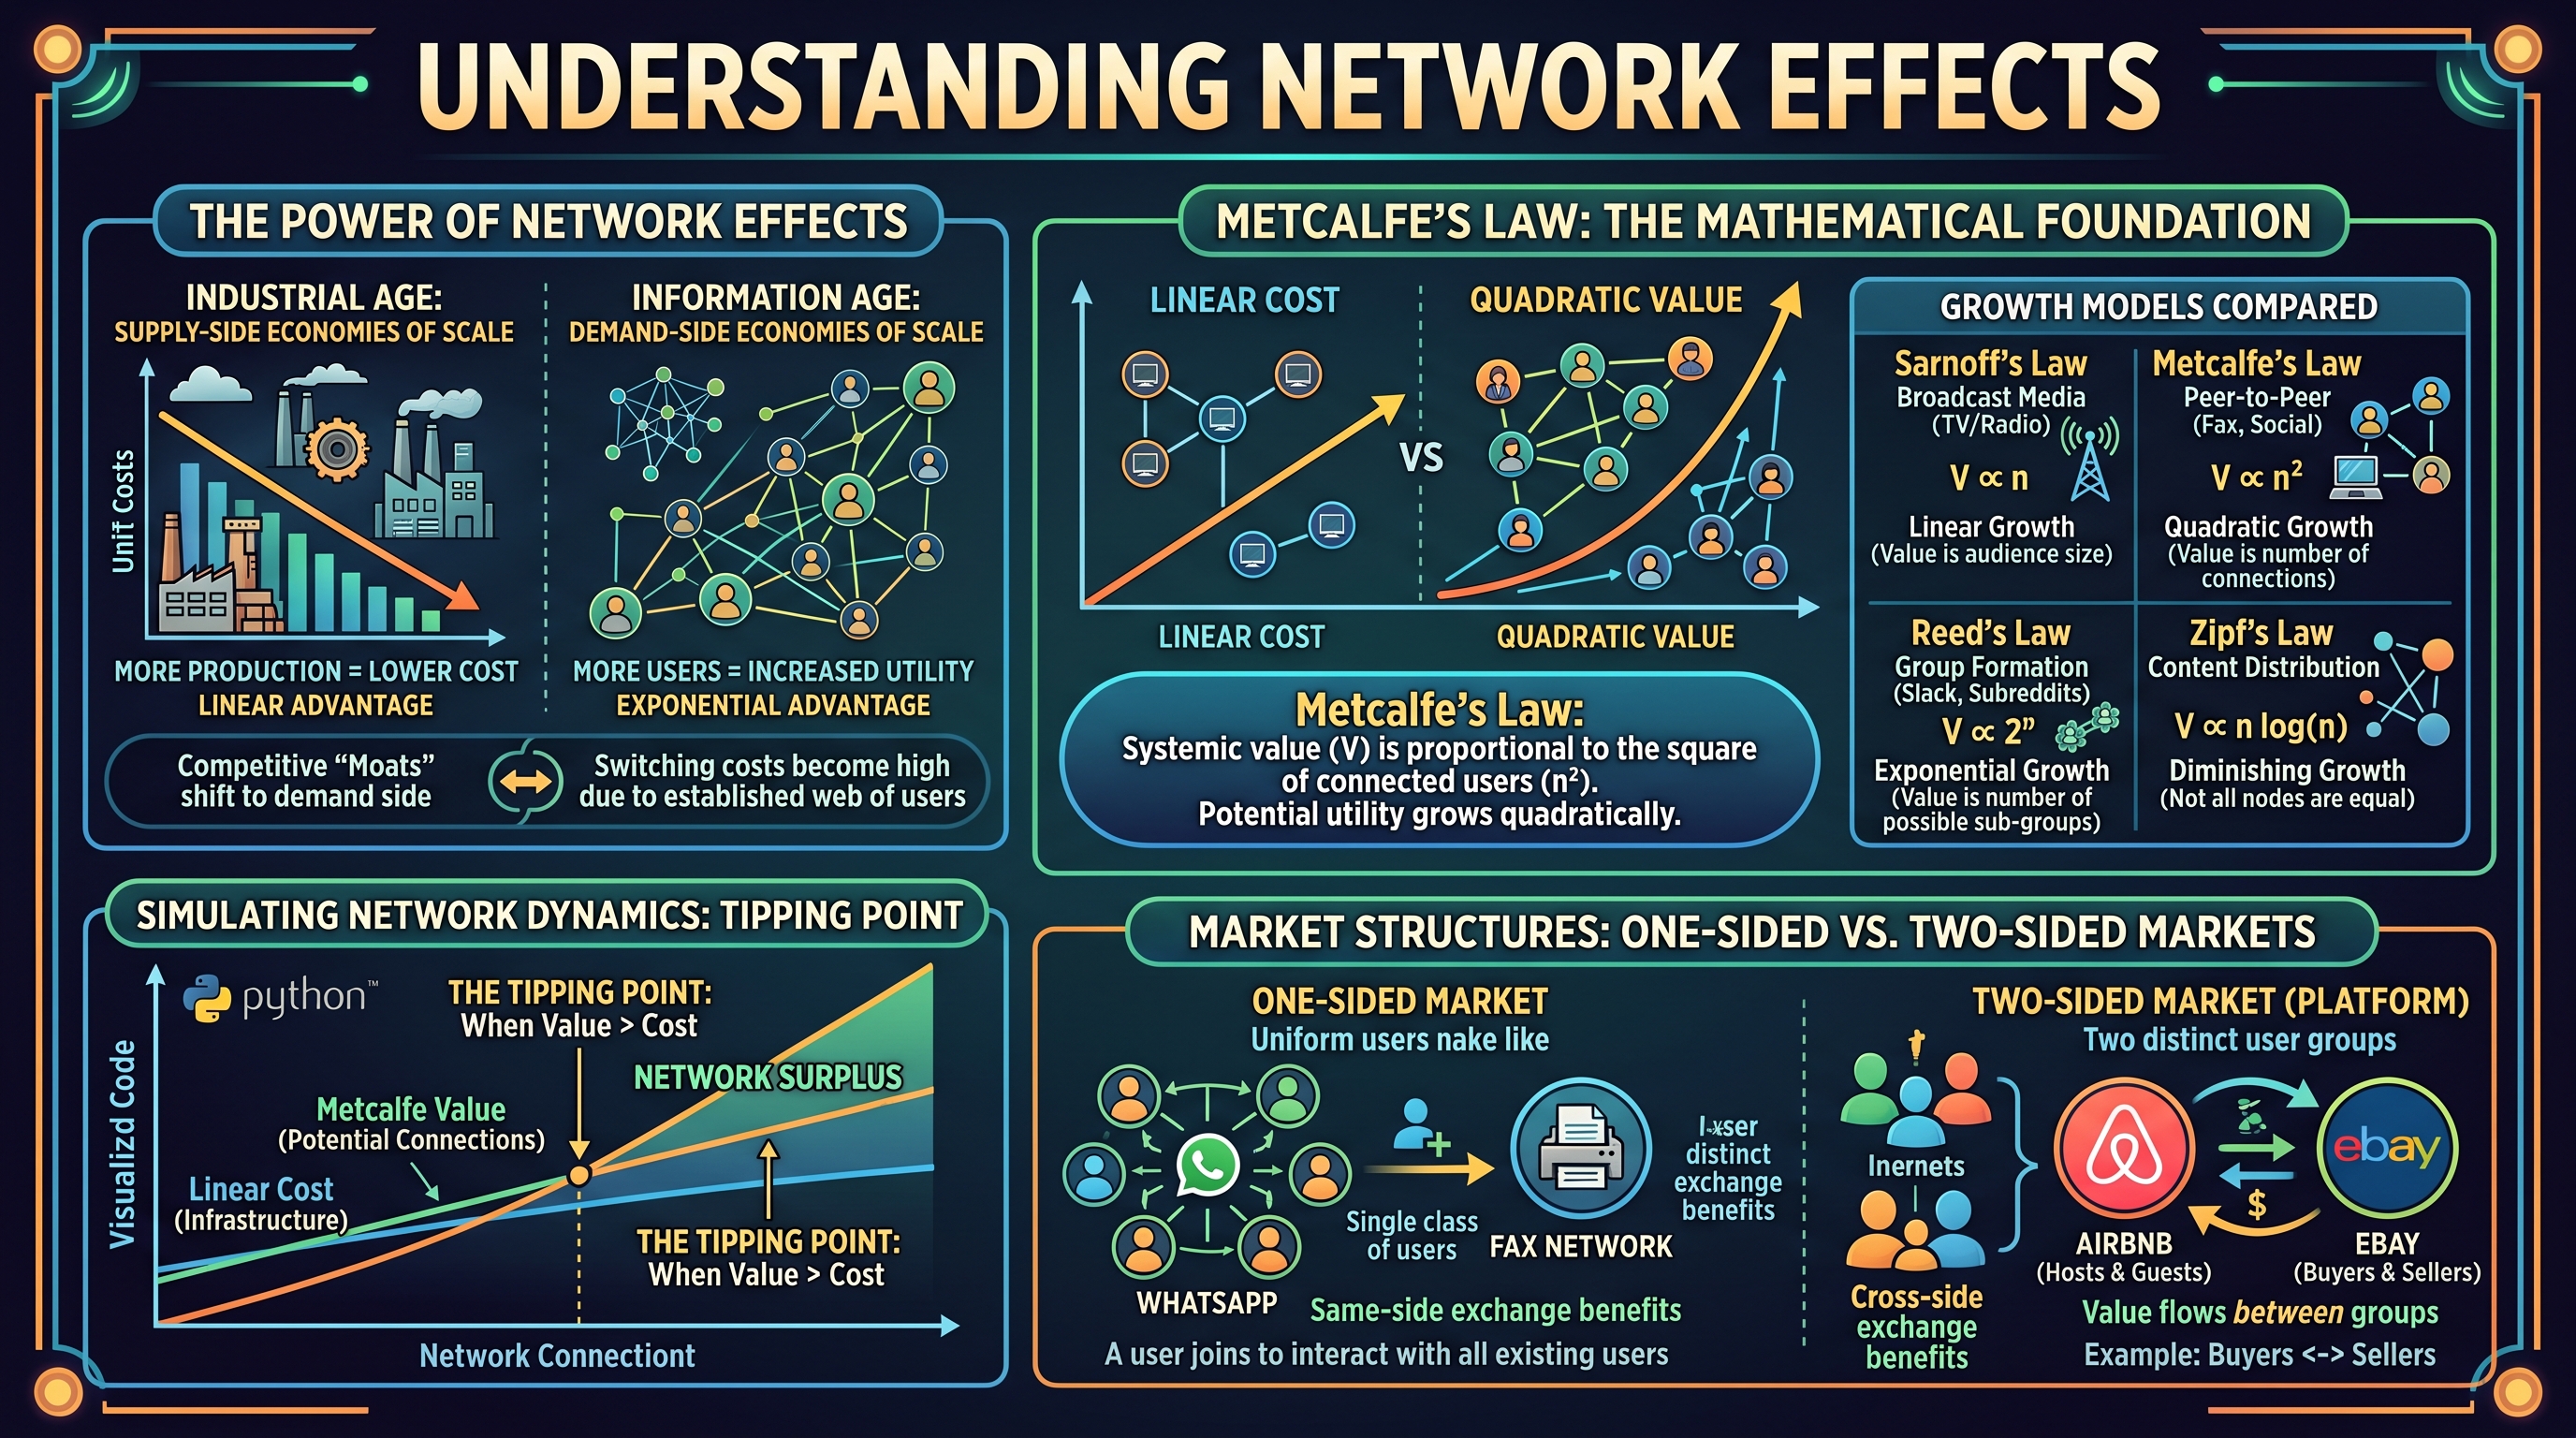
Network effects—often referred to as network externalities or demand-side economies of scale—represent a phenomenon where the value of a product or service increases as its user base grows. In the industrial age, competitive advantage was often driven by supply-side economies of scale: the more you produced, the lower your marginal costs. In the information age, the most powerful "moats" are built on the demand side. When a network is established, the cost for a user to switch to a competitor becomes prohibitively high, not because the competitor's software is bad, but because the competitor lacks the established web of users.
The Mathematical Foundation: Metcalfe’s Law
At the heart of network theory lies Metcalfe's Law, named after Robert Metcalfe, the co-inventor of Ethernet. The law provides a mathematical framework for understanding why networks scale in value so aggressively compared to linear businesses.
The Core Logic
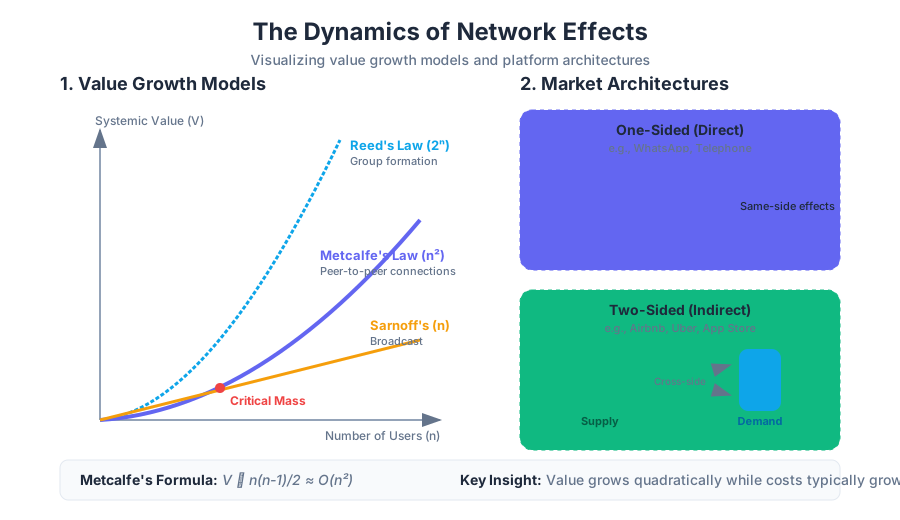
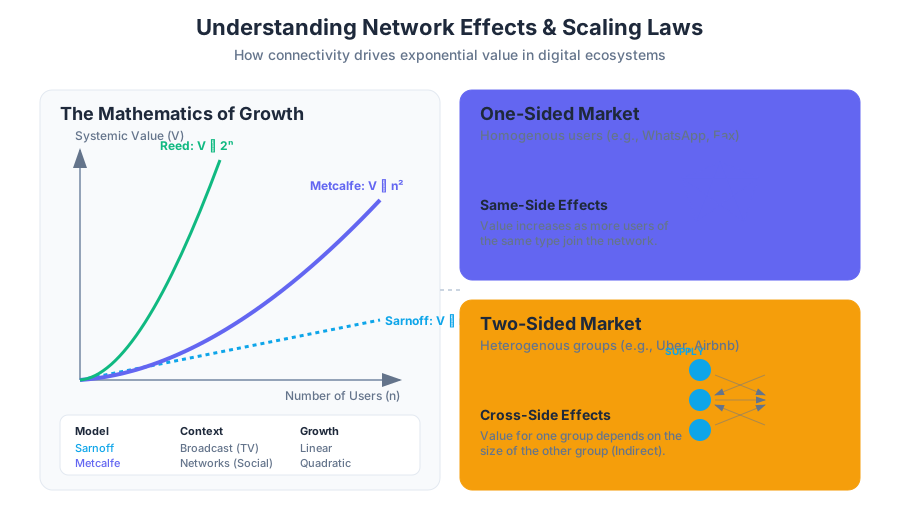
Metcalfe’s Law states that the value of a telecommunications network is proportional to the square of the number of connected users of the system ($n^2$). While $n$ users generate $n$ costs, they create $n(n-1)/2$ potential connections. As $n$ grows large, the $n^2$ term dominates.
Definition: Metcalfe's Law The systemic value of a network is mathematically represented as $V \propto n(n-1)/2$, which simplifies to $O(n^2)$ in asymptotic notation. This implies that while costs grow linearly with the number of users, the potential utility grows exponentially.
Comparison of Growth Models
To understand the power of Metcalfe's Law, we must compare it to other valuation models used in information theory and broadcasting.
| Model | Formula | Context | Growth Characteristic |
|---|---|---|---|
| Sarnoff’s Law | $V \propto n$ | Broadcast Media (TV/Radio) | Linear: Value is based on the size of the audience. |
| Metcalfe’s Law | $V \propto n^2$ | Peer-to-Peer (Fax, Phone, Social) | Quadratic: Value is based on the number of possible pairs. |
| Reed’s Law | $V \propto 2^n$ | Group Formation (Slack, Subreddits) | Exponential: Value is based on the number of possible sub-groups. |
| Zipf’s Law | $V \propto n \log(n)$ | Content/Usage Distribution | Diminishing: Accounts for the fact that not all nodes are equally valuable. |
Implementation: Simulating Network Value
The following Python implementation demonstrates the divergence between linear growth (costs) and quadratic growth (Metcalfe value) as a network scales.
import matplotlib.pyplot as plt
import numpy as np

def simulate_network_dynamics(max_users):
    """
    Simulates the growth of network value vs. cost.
    Assumes linear cost per user and quadratic value per Metcalfe's Law.
    """
    users = np.arange(1, max_users + 1)

    # Linear growth (e.g., Sarnoff's Law or basic infrastructure cost)
    linear_value = users

    # Quadratic growth (Metcalfe's Law: n*(n-1)/2)
    metcalfe_value = (users * (users - 1)) / 2

    # Exponential growth (Reed's Law: 2^n - n - 1)
    # We use log scale for visualization if we include Reed,
    # but here we focus on the Metcalfe Tipping Point.

    return users, linear_value, metcalfe_value

# Execution and Visualization
nodes, cost, value = simulate_network_dynamics(100)

plt.figure(figsize=(10, 6))
plt.plot(nodes, value, label="Metcalfe Value (Potential Connections)", color='blue', linewidth=2)
plt.plot(nodes, cost, label="Linear Cost/Sarnoff Value", color='red', linestyle='--')
plt.fill_between(nodes, cost, value, where=(value > cost), color='green', alpha=0.2, label="Network Surplus")
plt.title("The Economics of Network Effects")
plt.xlabel("Number of Users (n)")
plt.ylabel("Systemic Value")
plt.legend()
plt.grid(True, which='both', linestyle='--', alpha=0.5)
plt.show()
Market Structures: One-Sided vs. Two-Sided Markets
Not all networks are structured the same way. The strategic approach to building a network depends heavily on whether the participants are homogenous or heterogenous.
One-Sided Markets
In a One-Sided Market, the value of the network is derived from a single class of users. Every new user added to the network can interact with every other user.
- Example: WhatsApp. A new user joins to message existing users; there is no distinction between "types" of users in the core transaction.
- Primary Driver: Same-side exchange benefits. The utility comes from the ability to reach more people within the same category.
Two-Sided Markets
A Two-Sided Market (or platform) involves two distinct categories of participants: Supply-side and Demand-side. Both groups are necessary for the network to function, and they provide value to each other.
- Example: Airbnb (Hosts and Guests), eBay (Buyers and Sellers), PlayStation (Developers and Gamers).
- Primary Driver: Cross-side exchange benefits. An increase in the number of users on one side (e.g., more Uber drivers) increases the value for users on the other side (e.g., shorter wait times for riders).
Comparison Table: Market Dynamics
| Feature | One-Sided Market | Two-Sided Market |
|---|---|---|
| User Roles | Homogenous (Users = Users) | Heterogenous (e.g., Buyers vs. Sellers) |
| Primary Effect | Same-side (Direct) | Cross-side (Indirect) |
| Growth Catalyst | Viral loops, utility | Subsidies, "Chicken-and-Egg" resolution |
| Switching Costs | High (Loss of all contacts) | Variable (Depends on multi-homing) |
| Example | Telegram, Fax machines | Amazon Marketplace, iOS App Store |
The Mechanics of Cross-Side Effects
In two-sided markets, the relationship between the two sides is often asymmetrical. Managers must decide which side to subsidize and which side to monetize.
- The Subsidy Side: This group is highly price-sensitive and is critical for attracting the other side. (e.g., Adobe gives away the Acrobat Reader for free to ensure there is a massive audience for PDF creators).
- The Money Side: This group is willing to pay to access the subsidy side. (e.g., Businesses pay for Adobe Acrobat Pro to create the documents that the subsidy side consumes).
Mathematical Derivation of Cross-Side Value
If $n_b$ is the number of buyers and $n_s$ is the number of sellers, the total value $V$ of the platform can be modeled as a function of the interactions between the two:
V = \alpha(n_b \cdot n_s)
Where $\alpha$ represents the "interaction efficiency" or the probability of a successful match. This highlights why two-sided markets are so difficult to start: if either $n_b$ or $n_s$ is zero, the total value is zero. This is the Cold Start Problem.
Strategic Implications: Winners, Losers, and Tipping Points
Network markets have a natural tendency toward "Winner-Take-All" or "Winner-Take-Most" outcomes. When one firm gains a lead, the self-reinforcing nature of network effects makes that lead increasingly difficult to overcome.
The Tipping Point
The Tipping Point is the moment when the momentum of a growing network becomes unstoppable. Once a firm reaches a certain market share, the collective switching costs of the user base become a barrier that competitors cannot breach, even with superior technology.
Factors Affecting "Winner-Take-All" Potential
Not every market with network effects tips toward a single monopoly. Several factors influence the outcome:
| Factor | High Tipping Potential | Low Tipping Potential |
|---|---|---|
| Network Strength | Strong, direct connections | Weak, indirect connections |
| Multi-homing Costs | High (Hard to use two platforms) | Low (Easy to use two platforms) |
| Niche Specialization | Low (Generic needs) | High (Users have unique needs) |
| Negative Effects | Minimal (Congestion is managed) | High (Network gets worse as it grows) |
Key Insight: The "Best" Product Fallacy In network markets, the "best" technical product frequently loses to the "best" network. Consider the classic battle between BetaMax and VHS. BetaMax was technically superior in video quality, but VHS built a larger network of rental tapes and hardware manufacturers, leading to a total market tip.
Analyzing Network Density with SQL
For a platform engineer, measuring the "health" of network effects involves looking at the density of connections. A network with many isolated clusters is more vulnerable than a highly interconnected one.
-- Query to calculate the "Network Density" of a social platform
-- Density = Actual Connections / Potential Connections
WITH Potential_Connections AS (
    SELECT
        (COUNT(user_id) * (COUNT(user_id) - 1) / 2.0) as max_pairs
    FROM users
),
Actual_Connections AS (
    SELECT
        COUNT(*) as current_pairs
    FROM friendships
)
SELECT
    a.current_pairs,
    p.max_pairs,
    (a.current_pairs / p.max_pairs) * 100 as density_percentage
FROM Actual_Connections a, Potential_Connections p;
Common Pitfalls and Negative Network Effects
While positive network effects create value, they are not infinite. Managers must be wary of Negative Network Effects (or congestion), where the value of the network decreases as more users join.
1. Congestion and Latency
In physical networks (like roads or the early internet), too many users lead to traffic jams and slow speeds. In digital social networks, this manifests as "noise." If your LinkedIn feed is filled with 10,000 strangers posting irrelevant content, the value of the network to you decreases.
2. The "Groucho Marx" Effect
Named after the quote "I don't want to belong to any club that would have me as a member," this occurs when the "wrong" type of users join a network, driving away the "right" type. This is common in exclusive social clubs or dating apps where a gender imbalance can lead to a death spiral.
3. Security and Malware
As a network grows, it becomes a more attractive target for hackers. The "value" to a malicious actor also follows Metcalfe's Law. A platform with 1 billion users is a much more lucrative target for a virus than one with 1,000 users.
Case Study: The "Atoms to Bits" Transition
The shift from physical goods (Atoms) to digital goods (Bits) has accelerated network effects.
- Netflix: In its "Atoms" phase (DVD-by-mail), Netflix had limited network effects. The value was in the inventory. In its "Bits" phase (Streaming), it leverages data-driven network effects. Every user's viewing habits improve the recommendation engine for every other user, creating a virtuous cycle of engagement that competitors like Disney+ or HBO Max struggle to replicate despite having better legacy content.
- Zara: While primarily a physical retailer, Zara uses information systems to create a "feedback network" between store managers and designers. This internal network effect allows them to respond to fashion trends in weeks rather than months, effectively using bits to move atoms faster.
Summary of Strategic Frameworks
To successfully navigate a network-effect-driven market, a manager must execute on three fronts:
- Move Early: Since these markets tip, being the first to reach the critical mass is often more important than having a perfect feature set.
- Subsidize the "Hard" Side: Identify which side of the market is harder to get (usually the supply side in marketplaces) and offer incentives to join.
- Build Switching Costs: Use data, proprietary formats, or social capital to ensure that leaving the network is "expensive" for the user.
- Metcalfe's Law: The value of a network is proportional to the square of the number of users ($n^2$).
- One-Sided Market: A market deriving value from a single class of users (e.g., Instant Messaging).
- Two-Sided Market: A market requiring two distinct participant groups (e.g., Credit Cards - Merchants and Cardholders).
- Cross-Side Exchange Benefit: When an increase in one user group increases value for the other group in a two-sided market.
- Same-Side Exchange Benefit: When an increase in a user group increases value for that same group.
- Tipping Point: The critical mass at which network growth becomes self-sustaining and leads to market dominance.
- Multi-homing: When users participate in multiple competing networks simultaneously (e.g., using both Uber and Lyft).
- Switching Costs: The cost (time, money, psychological) a consumer incurs when moving from one product to a competitor.
-
Question: If a network grows from 10 users to 20 users, according to Metcalfe's Law, how has the potential value changed?
- A) It has doubled.
- B) It has tripled.
- C) It has quadrupled (roughly).
- D) It remains the same.
- Answer: C (Value goes from ~100 units to ~400 units).
-
Question: Which of the following is an example of a "Negative Network Effect"?
- A) A social network adding a "Dark Mode" feature.
- B) An eBay seller increasing their prices.
- C) A highway becoming so crowded that travel time increases.
- D) A developer writing an app for the iOS App Store.
- Answer: C.
-
Question: Why did the high-definition disc war end with Blu-ray winning over HD-DVD, despite both having similar technical specs?
- A) Blu-ray was cheaper to manufacture.
- B) Sony bundled Blu-ray players with the PlayStation 3, creating an instant "installed base" (network).
- C) HD-DVD had a lower storage capacity.
- D) Blu-ray discs were more scratch-resistant.
- Answer: B.
-
Question: In a two-sided market like Airbnb, which side is typically the "subsidy side"?
- A) The Guests (Demand)
- B) The Hosts (Supply)
- C) The Government regulators
- D) The Software Engineers
- Answer: B (Often, platforms must offer lower fees or tools to hosts to ensure there is enough inventory to attract guests).
Core Concepts to Master
- The $n^2$ Logic: Be able to explain why connections grow faster than nodes.
- Market Identification: Practice categorizing businesses (e.g., Is TikTok one-sided or two-sided? Hint: It's multi-sided involving creators, viewers, and advertisers.)
- The Cold Start Problem: Understand the strategies used to jumpstart a network (e.g., "Seeding" the market, leveraging "Atoms" before "Bits").
- Barriers to Entry: Analyze how network effects create high barriers to entry for startups, even if the startup has a "better" product.
- Convergence: Observe how different technologies (Mobile, Cloud, Social) converge to amplify network effects.
Recommended Reading & Analysis
- Compare the growth of the Telephone (Metcalfe's original context) with the growth of Facebook.
- Research the "Blue Ocean" strategy vs. "Network Tipping" strategy.
- Analyze the impact of Interoperability (e.g., can you send a text from Verizon to AT&T?) on the strength of network effects.
Peer Production, Social Media, and Web 2.0
Key concepts: Peer Production · Web 2.0 · Crowdsourcing · Prediction Markets
How collaborative digital platforms and social media are transforming business communication and organizational decision-making.
Peer Production, Social Media, and Web 2.0
The transition from the early World Wide Web to the modern digital ecosystem is often described as the shift from Web 1.0 to Web 2.0. While Web 1.0 was characterized by static, "read-only" pages—essentially a digital version of a brochure or a newspaper—Web 2.0 represents a fundamental change in how information is created, shared, and consumed. This era is defined by interactivity, user-generated content, and the emergence of Peer Production.
In the modern enterprise, technology is no longer just a tool for internal efficiency; it is a platform for harnessing the "wisdom of crowds." Managers who understand these tectonic shifts can leverage social media and collaborative frameworks to drive innovation, reduce costs, and engage with a global audience in ways that were previously impossible.
Web 2.0: The Web as a Platform
Web 2.0 is not a technical specification but rather a set of principles and practices that tie together a functional system. The core philosophy is that the value of a platform increases with the number of users and the amount of data they contribute—a phenomenon known as Network Effects.
Definition: Web 2.0 refers to internet services that foster collaboration and information sharing, characterized by user-generated content, usability, and interoperability. It treats the web as a platform where users contribute as much as they consume.
Key Characteristics of Web 2.0
| Feature | Web 1.0 (The "Read" Web) | Web 2.0 (The "Write" Web) |
|---|---|---|
| Content Origin | Institutional / Professional | User-Generated / Peer-Produced |
| Interaction | Passive consumption | Active participation and tagging |
| Architecture | Brittle, siloed, static | Flexible, API-driven, dynamic |
| Search/Discovery | Directories (e.g., early Yahoo!) | Algorithmic and Social (e.g., Google, Reddit) |
| Software Model | Packaged software (CD-ROMs) | Software as a Service (SaaS) |
Peer Production: The Economics of Collaboration
One of the most powerful manifestations of Web 2.0 is Peer Production. This is a socioeconomic system of production in which a large number of people work collaboratively, often without traditional financial compensation, to create products or services.
Why Peer Production Works
Traditional economic theory suggests that firms exist because the transaction costs of coordinating work through the open market are too high. However, the internet has lowered these costs to near zero. In peer production, individuals contribute small increments of effort (granular contributions) that are aggregated into a massive whole.
- Open Source Software (OSS): Projects like Linux, Apache, and MySQL power the majority of the web's infrastructure.
- Social Production: Wikipedia is the quintessential example, where a global volunteer force has created the world's largest encyclopedia, often with accuracy levels rivalling traditional sources like Britannica.
- Collaborative Filtering: Systems like Amazon's "Customers who bought this also bought..." or Netflix's recommendation engine leverage peer data to create value.
Implementing a Peer-Based Reputation System
In peer production environments, "trust" is the primary currency. Below is a Python implementation of a Reputation-Weighted Aggregation algorithm, used to determine the "truth" of a peer-produced data point based on the historical reliability of the contributors.
import numpy as np

def calculate_weighted_consensus(contributions, reputations):
    """
    Calculates a consensus value from peer contributions,
    weighted by the reputation score of each contributor.

    :param contributions: List of numerical values provided by peers
    :param reputations: List of reputation scores (0.0 to 1.0)
    :return: Weighted consensus value
    """
    contributions = np.array(contributions)
    reputations = np.array(reputations)

    # Normalize reputations to ensure they sum to 1
    if np.sum(reputations) == 0:
        return np.mean(contributions)

    weights = reputations / np.sum(reputations)

    # Calculate weighted average
    weighted_consensus = np.dot(contributions, weights)

    return weighted_consensus

# Example Usage:
# Peers are estimating the completion date of a project (days from now)
peer_estimates = [12, 15, 14, 45, 13]
peer_reputation = [0.9, 0.85, 0.95, 0.1, 0.88] # The '45' comes from a low-rep user

consensus = calculate_weighted_consensus(peer_estimates, peer_reputation)
print(f"The reputation-weighted consensus is: {consensus:.2f} days.")
Social Media Tools: The Manager’s Toolkit
Social media is a subset of Web 2.0 that focuses on the creation and exchange of user-generated content. For managers, these tools are not just for marketing; they are essential for internal knowledge management and external brand building.
Taxonomy of Social Media Tools
| Tool Category | Primary Purpose | Key Business Value | Examples |
|---|---|---|---|
| Blogs | Long-form publishing | Thought leadership, direct-to-consumer PR | WordPress, Medium |
| Wikis | Collaborative knowledge base | Internal documentation, project management | MediaWiki, Notion, Confluence |
| Social Networks | Relationship building | Recruitment, professional networking, CRM | LinkedIn, Facebook |
| Microblogging | Real-time updates | Customer service, crisis management, news | X (Twitter), Mastodon |
| Messaging | Synchronous communication | Rapid team coordination, internal agility | Slack, Microsoft Teams |
| Media Sharing | Visual/Audio distribution | Content marketing, training, viral reach | YouTube, TikTok, Instagram |
The Wiki: A Deep Dive into Collaboration
A Wiki is a website that can be edited by anyone with access. From a managerial perspective, wikis solve the "siloed information" problem. Unlike email, where information is buried in threads, a wiki provides a "single source of truth" that evolves over time.
- Rollback: The ability to revert a page to a previous version if an error or vandalism occurs.
- Versioning: A complete history of every change made, by whom, and when.
- Searchability: All content is indexed and easily retrieved.
Crowdsourcing: Outsourcing to the Undefined
Crowdsourcing is the act of taking a job traditionally performed by a designated agent (like an employee or a contractor) and outsourcing it to an undefined, generally large group of people in the form of an open call.
Models of Crowdsourcing
- Crowd-solving: Using the crowd to solve a specific problem (e.g., the Netflix Prize for improving recommendation algorithms).
- Crowdfunding: Raising capital from a large number of people (e.g., Kickstarter, Indiegogo).
- Crowd-innovation: Soliciting new product ideas from customers (e.g., LEGO Ideas, Starbucks "My Starbucks Idea").
- Micro-tasking: Breaking a large project into tiny tasks that humans can do better than AI (e.g., Amazon Mechanical Turk).
The Git Workflow: A Real-World Peer Production Example
In the world of software, git is the primary tool for managing peer production. It allows thousands of developers to work on the same codebase simultaneously without overwriting each other's work.
# 1. Clone the repository (get a local copy of the peer project)
git clone https://github.com/open-source/project-alpha.git

# 2. Create a feature branch (isolate your work)
git checkout -b feature/optimize-database

# 3. Commit changes (save your granular contribution)
git add .
git commit -m "Refactor SQL queries to reduce latency by 20%"

# 4. Push to the remote server
git push origin feature/optimize-database

# 5. Open a Pull Request (PR)
# This is the "Peer Review" stage where others inspect the code
# before it is merged into the main project.
Prediction Markets: Tapping Collective Intelligence
A Prediction Market is a diverse group of people "betting" on the outcome of an event. The market price reflects the crowd's collective estimate of the probability of that event occurring.
The Wisdom of Crowds: James Surowiecki argued that under the right conditions, a group's collective intelligence is superior to that of its smartest individual member.
Criteria for a "Wise" Crowd
To avoid "herd mentality" or "groupthink," a crowd must meet four criteria:
- Diversity of Opinion: Each person should have private information, even if it's just an eccentric interpretation of known facts.
- Independence: People's opinions should not be determined by those around them.
- Decentralization: People are able to specialize and draw on local knowledge.
- Aggregation: A mechanism exists for turning private judgments into a collective decision.
The Math of Prediction Markets
Prediction markets often use a Logarithmic Market Scoring Rule (LMSR) to provide liquidity. This ensures that even when there are few traders, there is always a price available.
C(q) = b \cdot \ln \left( \sum_{i=1}^{n} e^{q_i / b} \right)
Where:
- $C(q)$ is the cost function.
- $q_i$ is the number of shares held for outcome $i$.
- $b$ is the liquidity parameter (higher $b$ means the price moves more slowly).
- The price of a share for outcome $i$ is the partial derivative $\frac{\partial C}{\partial q_i}$.
Managerial Challenges and Pitfalls
While the benefits of Web 2.0 and peer production are vast, they introduce significant risks that managers must navigate.
1. The "Free Rider" Problem
In peer production, many people benefit from the resource (like Wikipedia or Open Source software) without contributing to it. If the ratio of consumers to contributors becomes too high, the project may stagnate.
2. Information Overload and Quality Control
The low barrier to entry in Web 2.0 means that the volume of content can be overwhelming. Managers must implement sophisticated filtering and curation mechanisms to ensure that high-quality information surfaces.
3. Reputation and Brand Risk
Social media gives every customer a megaphone. A single viral post can damage a brand's reputation overnight. Companies must move from a "command and control" communication style to one of "engagement and transparency."
4. The "Dark Side" of Crowds
Crowds are not always wise. They can be prone to:
- Griefers/Trolls: Individuals who intentionally disrupt collaborative efforts.
- Astroturfing: Creating fake "grassroots" support for a product or cause (e.g., fake reviews).
- Salami Slicing: Competitors using crowdsourced data to reverse-engineer proprietary strategies.
Summary of Strategic Frameworks
To effectively harness these technologies, managers should evaluate their strategy against the following matrix:
| Strategy | Goal | Key Metric | Risk |
|---|---|---|---|
| Peer Production | Lower R&D costs | Contribution rate / Code quality | IP ownership issues |
| Social Media | Customer engagement | Sentiment / Reach / Conversion | Public relations crises |
| Crowdsourcing | Problem solving | Solution diversity / Cost per unit | Quality inconsistency |
| Prediction Markets | Forecasting | Accuracy vs. Actual outcomes | Internal politics / Bias |
Conclusion: From Atoms to Bits
As the source material suggests, the transition from Atoms to Bits (physical to digital) is accelerated by Web 2.0. When products become digital, they can be peer-produced, crowdsourced, and shared at zero marginal cost. Managers who fail to adapt to this collaborative reality risk being disrupted by more agile, "crowd-powered" competitors.
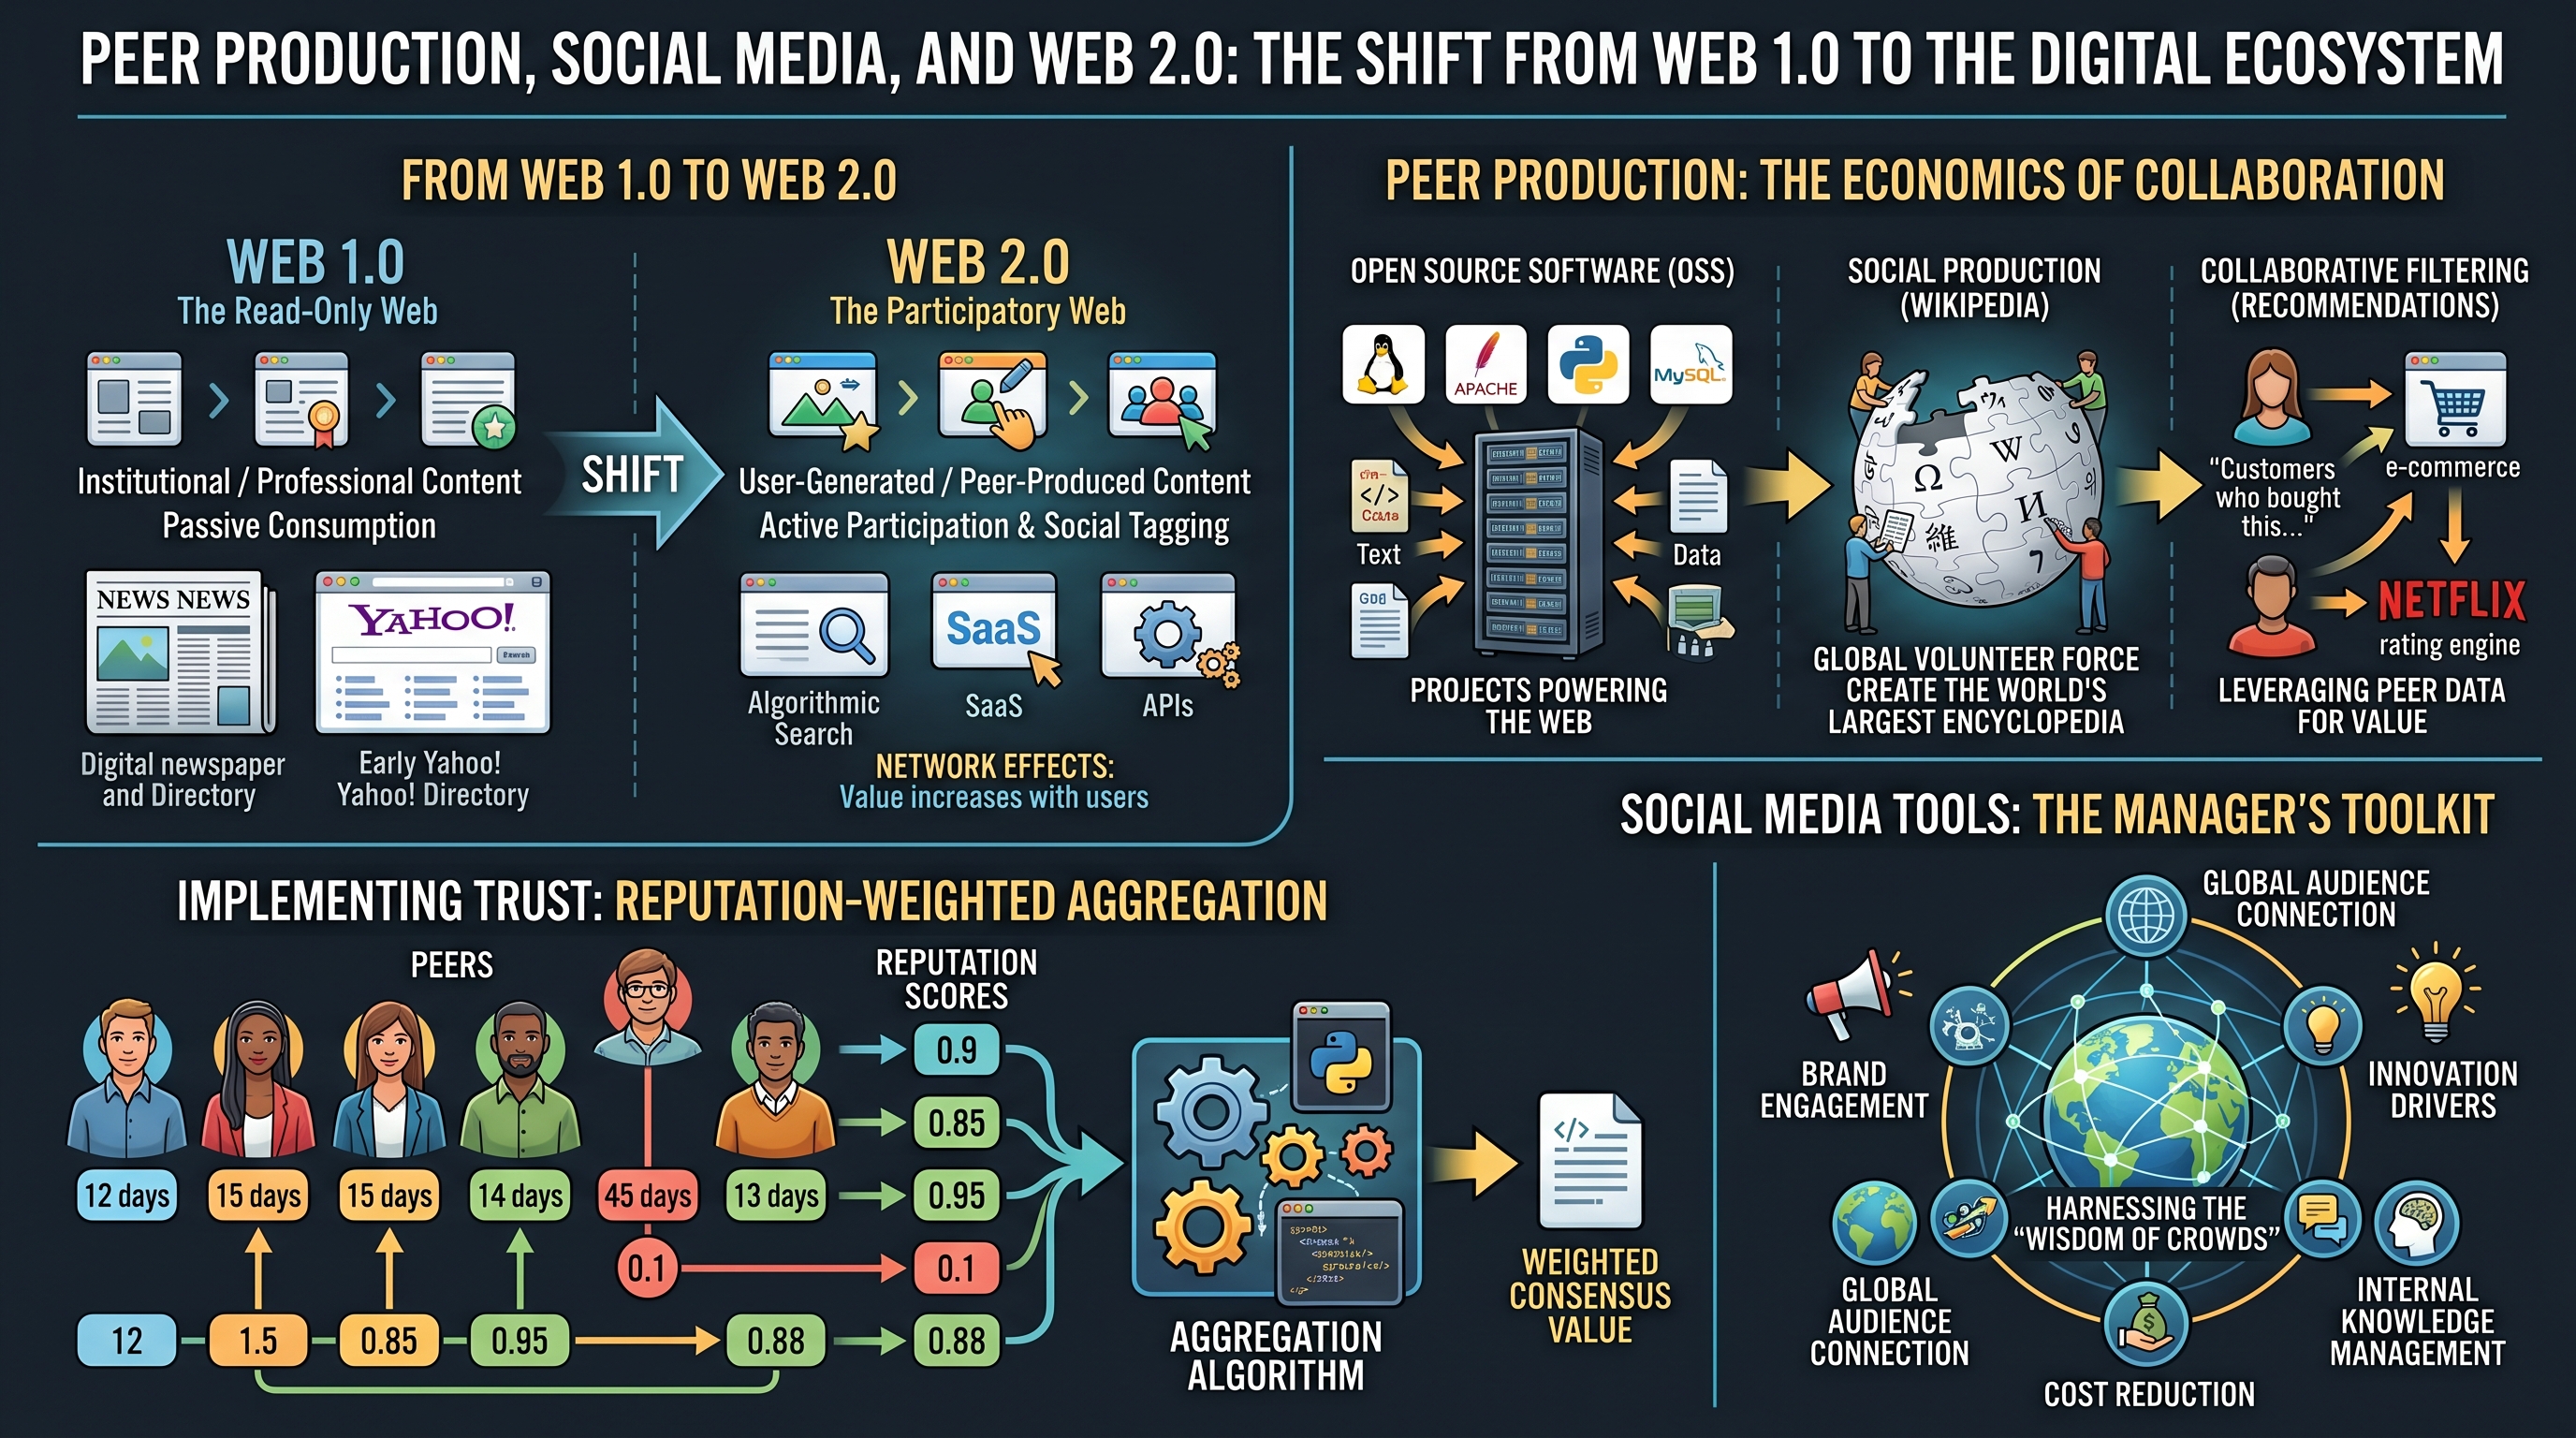
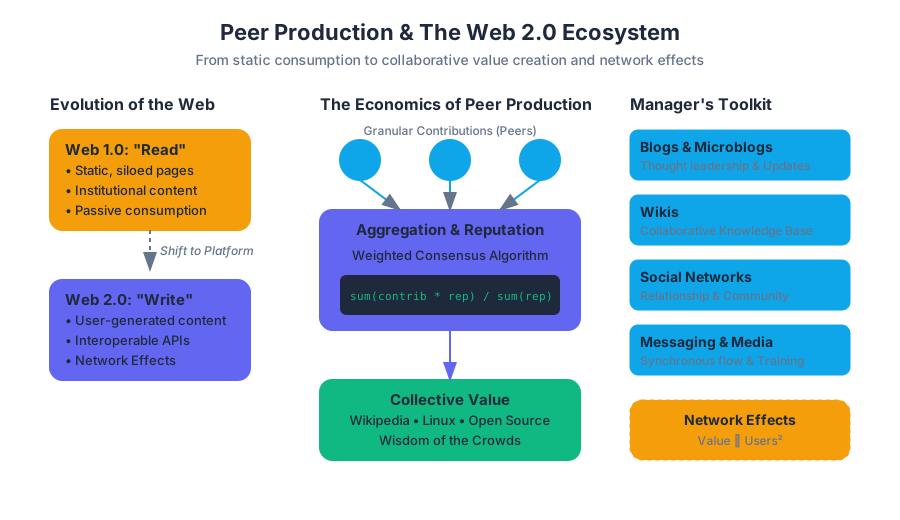
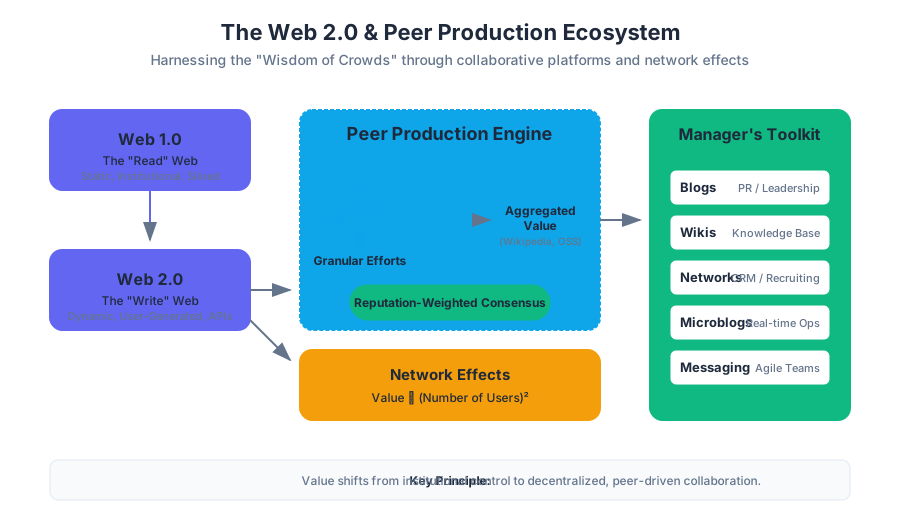
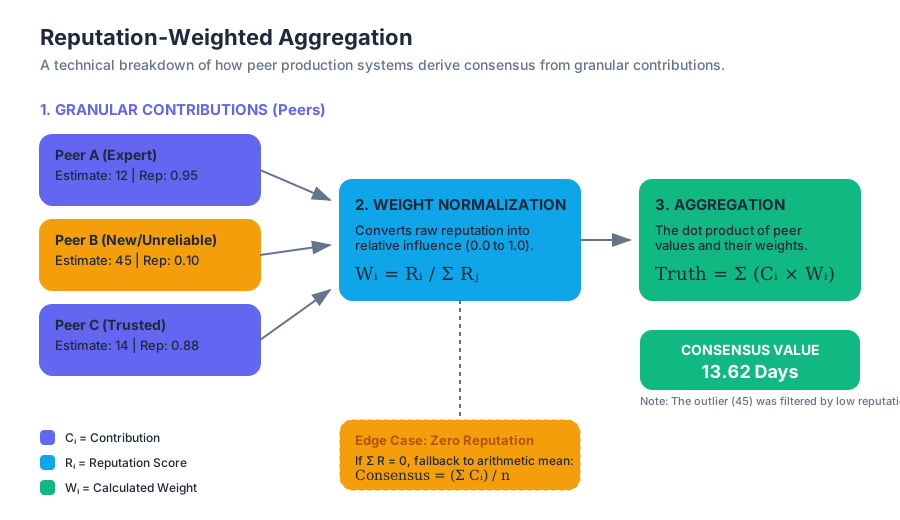
Facebook: Building a Business from the Social Graph
Key concepts: Social Graph · Platform Strategy · Social Advertising · Privacy and Ethics
A case study on how Facebook leverages social connectivity and platform strategy to build a massive business ecosystem.
Facebook: Building a Business from the Social Graph
Facebook represents the definitive case study in the transition from a discrete software product to a global infrastructure platform. While early internet successes like Yahoo! were built on content curation and Google was built on the indexation of information, Facebook’s value proposition is rooted in the Social Graph: a digital map of every person and how they are related. By codifying human relationships into a queryable data structure, Facebook transformed the "atoms" of social interaction into the "bits" of a high-margin, scalable advertising machine.
This article explores the architectural underpinnings of the social graph, the strategic pivot to a platform model, the mechanics of social advertising, and the systemic ethical challenges inherent in monetizing private identity.
The Social Graph: The Atomic Unit of Social Capital
At its core, the Social Graph is a mathematical representation of the interconnectedness of a service's users. In graph theory terms, users are nodes (or vertices) and their relationships—friendships, likes, tags, or shared locations—are edges (or links). Unlike the "link graph" of the World Wide Web, which connects anonymous documents, the social graph connects verified identities.
What It Is
The social graph is not merely a list of friends; it is a multi-dimensional map of human intent, affinity, and influence. It encompasses:
- Nodes: Individual entities (Users, Pages, Groups, Events).
- Edges: The relationships between nodes (Friendship, Following, Member-of).
- Metadata: The attributes of those edges (How long they have been friends, frequency of interaction, common interests).
Why It Matters
The social graph creates a powerful Network Effect. According to Metcalfe’s Law, the value of a network is proportional to the square of the number of connected users ($V \propto n^2$). However, Facebook’s graph is even more potent because it creates Switching Costs. If a user leaves Facebook, they do not just lose a tool; they lose the "digital connective tissue" to their entire social circle. This creates a "walled garden" where the cost of exit is the loss of social capital.
| Property | Description | Business Impact |
|---|---|---|
| Directionality | Whether a relationship is mutual (Friend) or one-way (Follow). | Determines the flow of information and influence. |
| Weight | The strength of a connection based on interaction frequency. | Used by algorithms to prioritize the News Feed. |
| Multiplexity | The existence of multiple types of edges between the same two nodes. | Increases the accuracy of user profiling and ad targeting. |
| Clustering Coefficient | The degree to which nodes in a graph tend to cluster together. | Identifies "echo chambers" and viral potential. |
How It Works: Graph Traversal
To provide features like "People You May Know" or to rank the News Feed, Facebook must perform complex graph traversals. This involves calculating the distance between nodes and the density of mutual connections.
import networkx as nx

# Low-level implementation of a social graph analysis using NetworkX
def analyze_social_influence(graph, user_id):
    """
    Calculates the 'influence' of a user within a local subgraph
    using Eigenvector Centrality - a measure of a node's influence
    based on the influence of its neighbors.
    """
    # Calculate centrality: nodes with high scores are connected to
    # many nodes who themselves have high scores.
    centrality = nx.eigenvector_centrality_numpy(graph)

    # Identify 'Triadic Closure' opportunities (Potential Friends)
    # Finding nodes at distance 2 that are not yet connected
    ego_graph = nx.ego_graph(graph, user_id, radius=2)
    potential_connections = []

    for node in ego_graph.nodes():
        if not graph.has_edge(user_id, node) and node != user_id:
            # Calculate Jaccard Coefficient for similarity
            preds = nx.jaccard_coefficient(graph, [(user_id, node)])
            for u, v, p in preds:
                potential_connections.append((v, p))

    return centrality[user_id], sorted(potential_connections, key=lambda x: x[1], reverse=True)

# Example usage:
# G = nx.read_edgelist("facebook_combined.txt")
# influence, recommendations = analyze_social_influence(G, 107)
Platform Strategy: From Website to Ecosystem
In 2007, Facebook launched the Facebook Platform, a strategic move that allowed third-party developers to build applications that sat directly on top of the social graph. This shifted Facebook from being a destination to being an operating system for social interaction.
The "Walled Garden" vs. The Open Web
By providing APIs (Application Programming Interfaces), Facebook allowed developers to access user data (with permission). This created a symbiotic relationship: developers got access to a massive, authenticated user base, and Facebook got a library of features (games like FarmVille, utility apps, etc.) that it didn't have to build itself.
Key Insight: The Platform Pivot A platform is successful when the value of the things built on it exceeds the value of the platform itself. By opening the graph, Facebook ensured that every new app made the core Facebook account more indispensable.
The Open Graph Protocol
Later, Facebook introduced the Open Graph, which extended the social graph beyond the borders of Facebook.com. The "Like" button on external websites allowed Facebook to track user behavior across the entire web, effectively turning the whole internet into a data-collection sensor for the social graph.
\text{Network Value (V)} = n(n-1) \approx n^2
\\
\text{Where } n = \text{number of nodes (users)}
\\
\text{Social Graph Utility (U)} = \sum_{i=1}^{n} \sum_{j=1}^{n} w_{ij} \cdot a_{ij}
\\
\text{Where } w = \text{weight of interaction, } a = \text{affinity score}
Platform Evolution Table
| Era | Focus | Key Technology | Strategic Goal |
|---|---|---|---|
| Desktop Era (2004-2007) | User Growth | LAMP Stack, PHP | Critical Mass of Identity |
| Platform Era (2007-2010) | Ecosystem | F8, FBML (Facebook Markup Language) | Lock-in via 3rd Party Apps |
| Open Graph Era (2010-2014) | Ubiquity | "Like" Button, Social Plugins | Tracking the "Off-Facebook" Web |
| Mobile/AI Era (2014-Present) | Monetization | React Native, PyTorch, GraphQL | Maximizing Attention & Ad Yield |
Social Advertising: Monetizing Identity
Facebook's business model is almost entirely dependent on Social Advertising. Unlike Google, which captures Intent (what you are looking for right now), Facebook captures Identity (who you are, what you like, and who you know).
Precise Targeting and Lookalike Audiences
Because Facebook knows a user's age, location, interests, and relationship status, it can offer advertisers "surgical" targeting. The most powerful tool in this arsenal is the Lookalike Audience. An advertiser can upload a list of their current customers, and Facebook’s machine learning models will scan the social graph to find other users with similar "graph signatures."
The Ad Auction and News Feed Algorithm
Ads are not sold at a fixed price but through a real-time auction. The winner isn't just the highest bidder, but the one with the highest Total Value, a combination of:
- Bid Price: What the advertiser is willing to pay.
- Estimated Action Rates: How likely the user is to click or convert.
- Ad Quality/Relevance: How much the user will actually enjoy seeing the ad.
-- Conceptual schema for an Ad Targeting Query
-- Finding users for a 'High-End Yoga Gear' campaign
SELECT
    u.user_id,
    u.location,
    COUNT(l.like_id) AS affinity_score
FROM
    Users u
JOIN
    User_Interests ui ON u.user_id = ui.user_id
JOIN
    Likes l ON u.user_id = l.user_id
WHERE
    ui.interest_category IN ('Yoga', 'Wellness', 'Lululemon')
    AND u.age BETWEEN 25 AND 45
    AND u.last_login > (CURRENT_DATE - INTERVAL '7 days')
GROUP BY
    u.user_id
HAVING
    affinity_score > 10
ORDER BY
    affinity_score DESC
LIMIT 1000;
Comparison of Advertising Models
| Feature | Google Search (AdWords) | Facebook (Social Ads) |
|---|---|---|
| Primary Signal | Keyword (Explicit Intent) | Profile/Behavior (Implicit Interest) |
| User State | Hunting/Problem Solving | Browsing/Socializing |
| Targeting Basis | Search Query | Demographic, Interest, Connections |
| Ad Format | Text-heavy, Utility-focused | Visual, Native, "Social Proof" (e.g., "Friend X likes this") |
| Best For | Direct Response / Conversion | Brand Awareness / Discovery |
Privacy and Ethics: The Cost of the Graph
The very features that make Facebook a powerful business—data persistence, cross-site tracking, and deep profiling—create significant ethical and regulatory risks.
The Privacy Paradox
Users often state they value privacy, yet their behavior (sharing photos, location tagging, using "Login with Facebook") suggests they are willing to trade that privacy for convenience or social connection. This is known as the Privacy Paradox.
Cambridge Analytica and the "Data Leak"
The Cambridge Analytica scandal highlighted a fundamental flaw in the early Platform Strategy. By allowing apps to access not just a user’s data, but also the data of their friends, Facebook allowed a massive "scraping" of the social graph. This data was then used for psychographic profiling and political micro-targeting without explicit consent from the "friends" involved.
Regulatory Response: GDPR and CCPA
In response to these lapses, governments have introduced strict data protection laws:
- GDPR (General Data Protection Regulation): Requires "Privacy by Design" and gives EU citizens the right to data portability and the "right to be forgotten."
- CCPA (California Consumer Privacy Act): Gives users the right to opt-out of the sale of their personal information.
Theorem: The Transparency-Utility Trade-off As the transparency of data usage increases, the perceived utility of personalized services often decreases for the user (due to "creepiness"), while the operational complexity for the platform increases.
Technical Implementation: Interacting with the Graph API
To understand how a business actually leverages this, we look at the Graph API, the primary way data is retrieved from or posted to Facebook's platform.
# Example: Fetching a user's profile and their 'likes' using cURL
# Requires a valid User Access Token with 'user_likes' permission

curl -X GET "https://graph.facebook.com/v18.0/me?fields=id,name,likes{name,category}&access_token=USER_ACCESS_TOKEN"

# Response (JSON):
# {
#   "id": "123456789",
#   "name": "Jane Doe",
#   "likes": {
#     "data": [
#       { "name": "The New York Times", "category": "Media/News Company", "id": "5281959998" },
#       { "name": "Patagonia", "category": "Outdoor & Sporting Goods Company", "id": "12345" }
#     ]
#   }
# }
Common Pitfalls in Social Graph Strategy
- Over-reliance on Organic Reach: Businesses often build huge followings on Facebook, only to find that Facebook's algorithm eventually requires them to "pay to play" (boost posts) to reach their own followers.
- Data Siloing: Failing to integrate social graph data with internal CRM data, leading to fragmented customer views.
- Ignoring Negative Network Effects: As a network grows, it can become "noisy" or "toxic," leading high-value users to migrate to smaller, more curated "niche" graphs (e.g., Discord, Slack).
- Privacy Debt: Building features that rely on aggressive data collection without considering future regulatory changes. This "debt" comes due when laws like GDPR force massive, expensive re-architecting.
Summary of Key Concepts
- The Social Graph is the foundational data structure of Facebook, mapping nodes (users) and edges (relationships).
- Platform Strategy turned Facebook into an infrastructure, leveraging third-party developers to increase switching costs and network effects.
- Social Advertising uses identity and "Lookalike" modeling to provide higher targeting precision than traditional keyword-based ads.
- Privacy and Ethics remain the primary existential threat to the model, as the tension between data monetization and user autonomy continues to escalate.
By mastering the social graph, Facebook didn't just build a website; it built a digital ledger of human association, creating a business model that is as controversial as it is profitable.
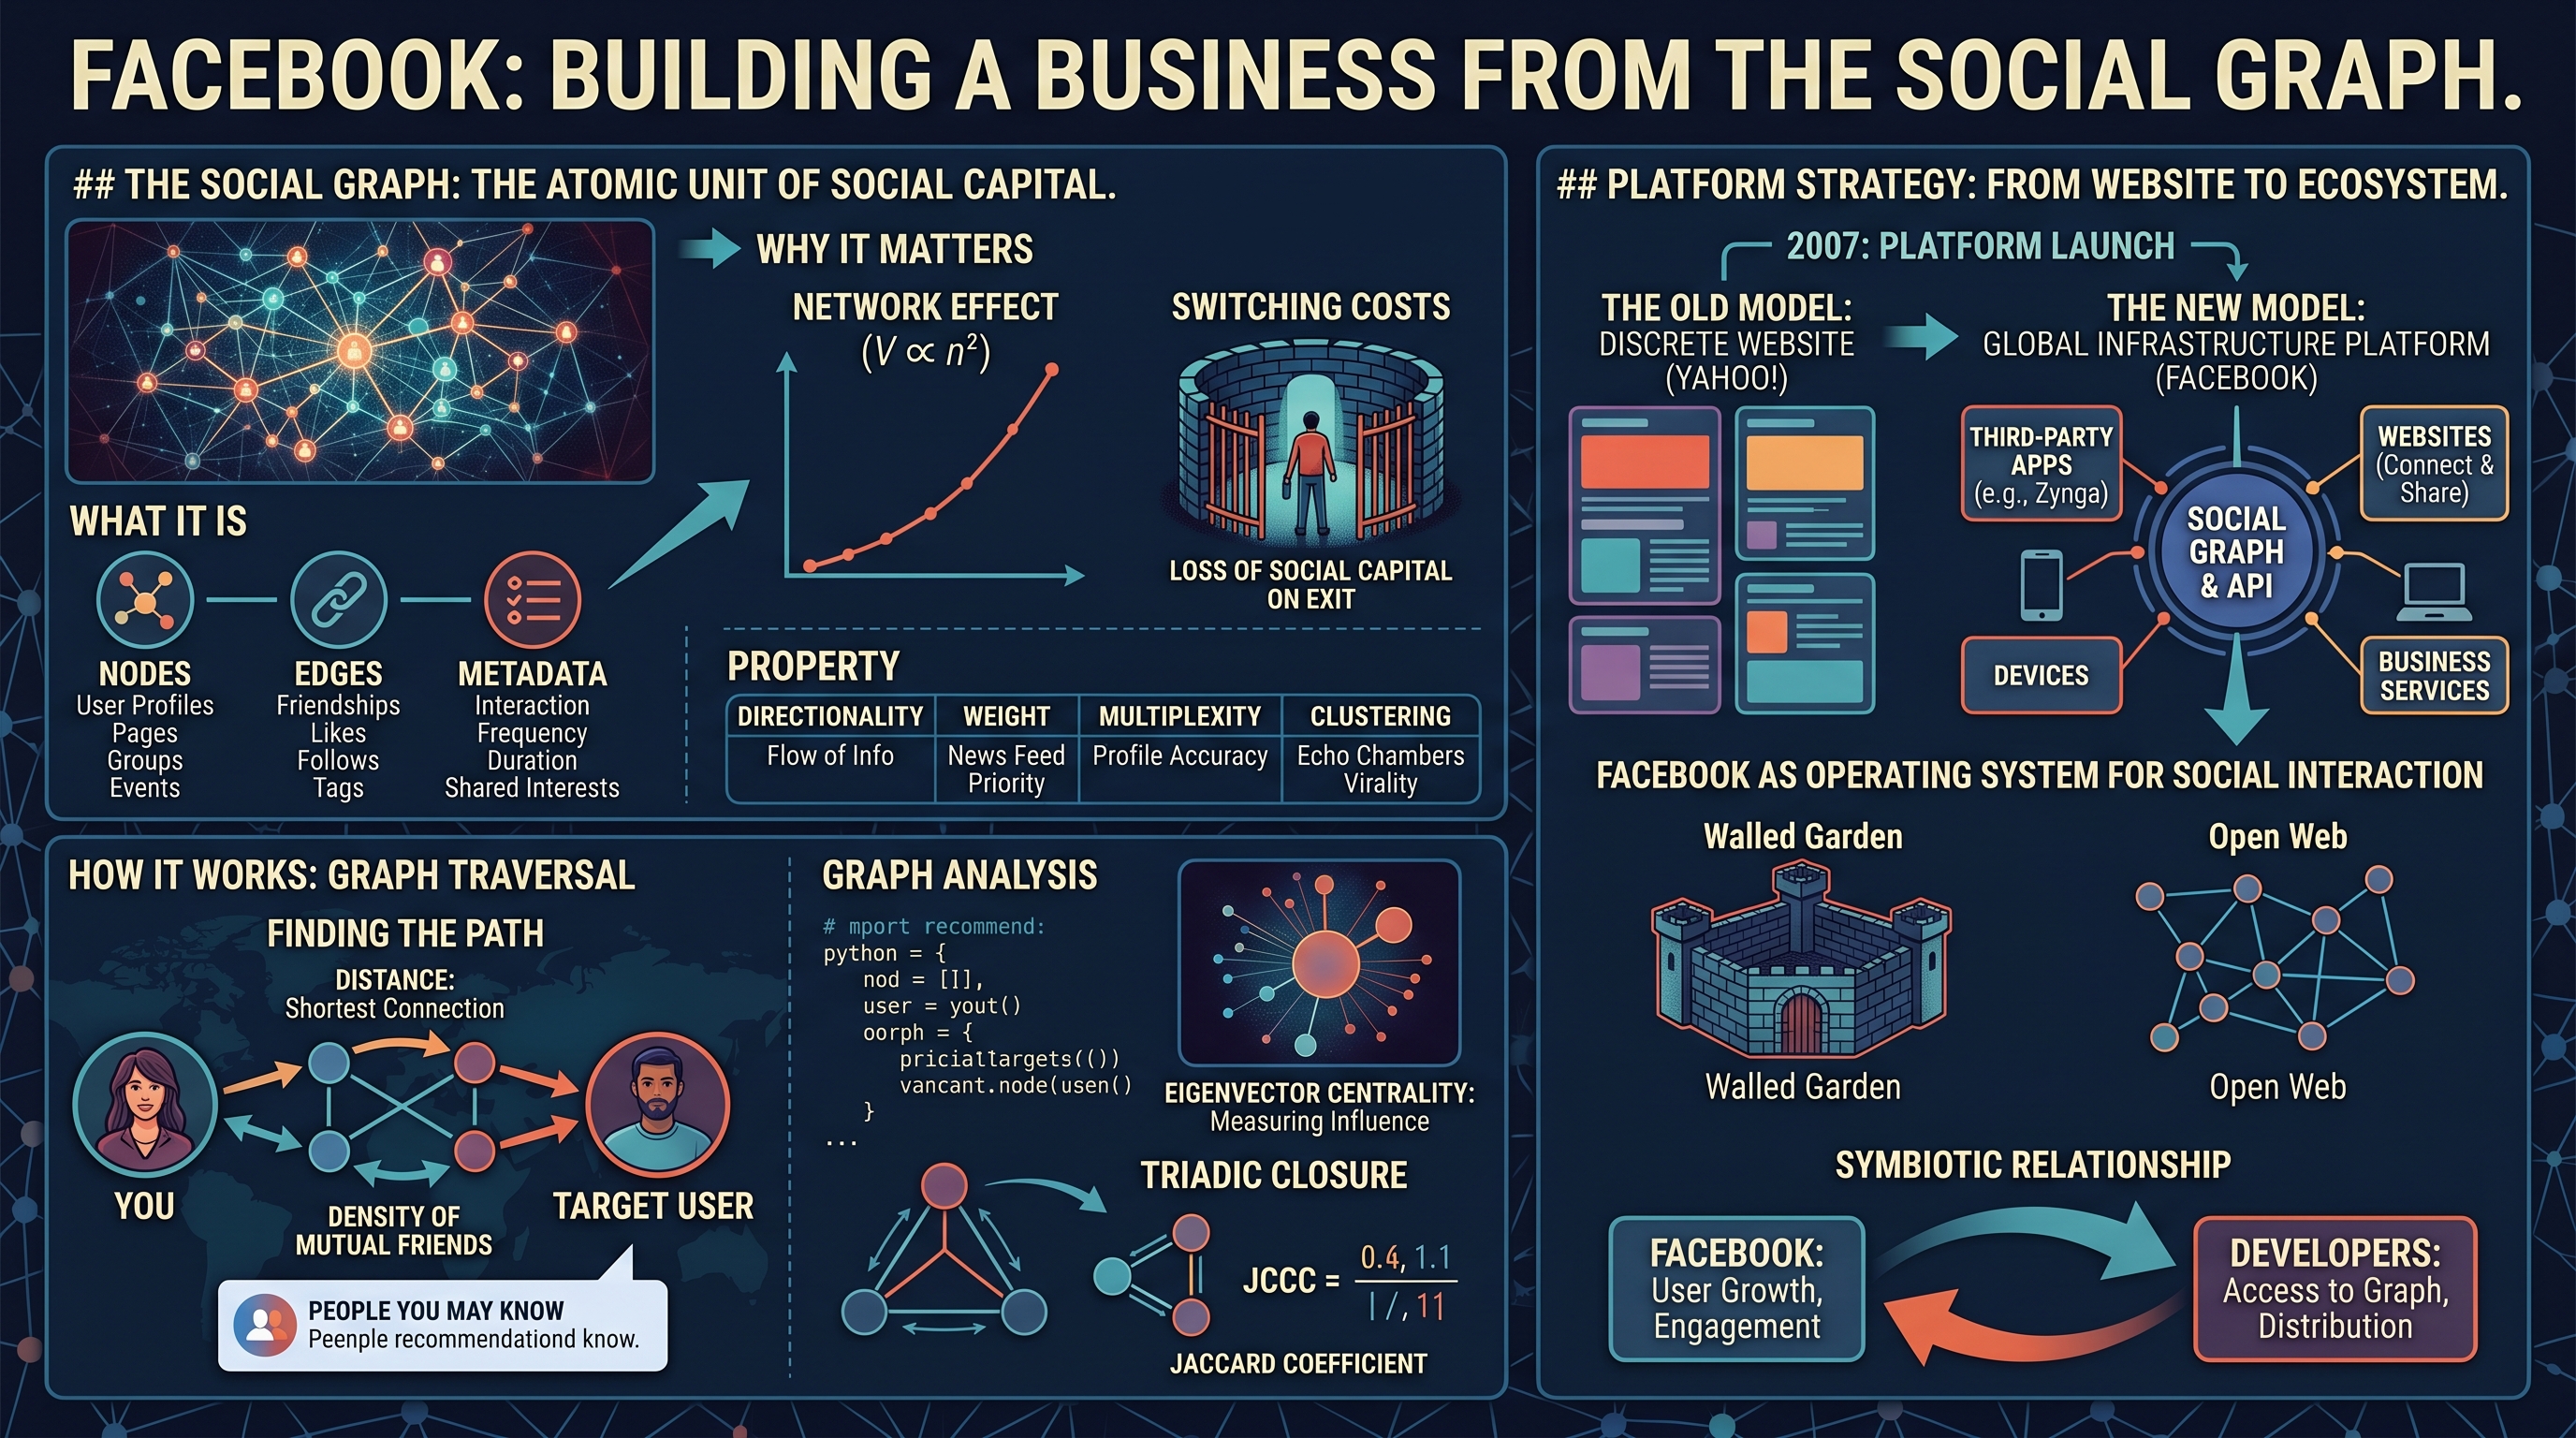
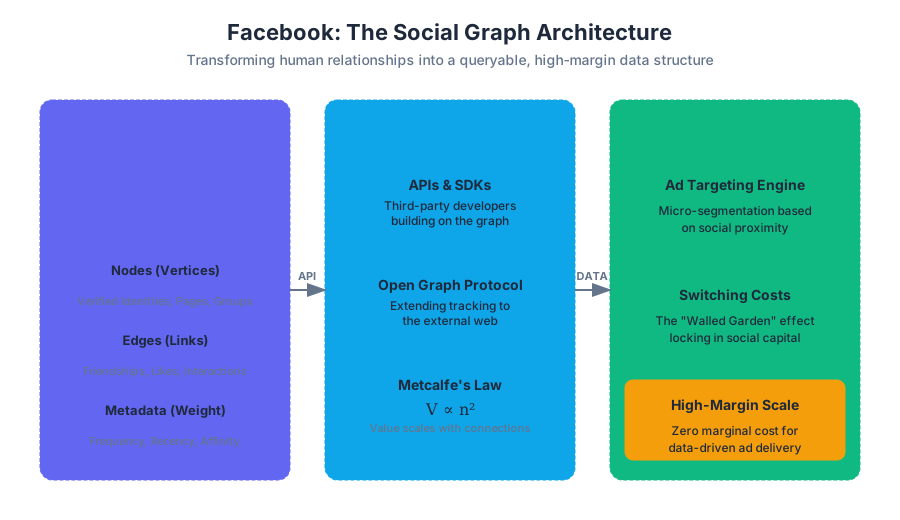
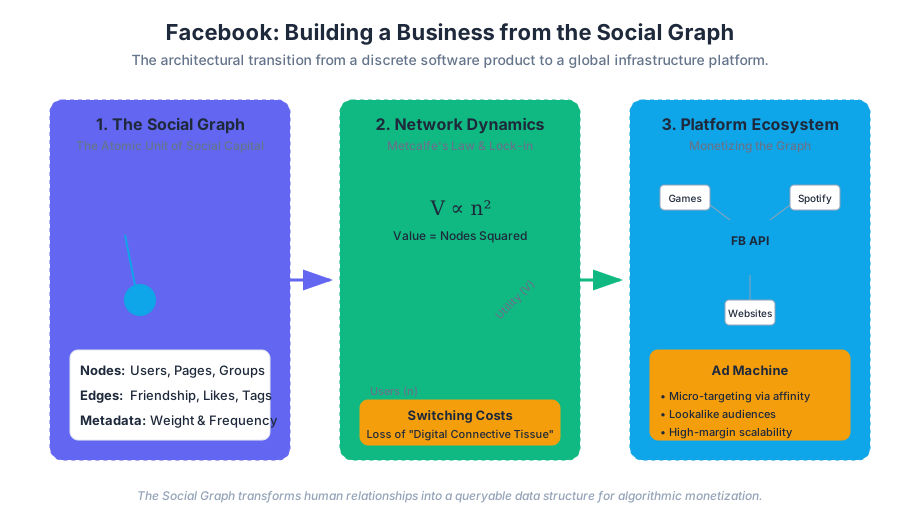
Understanding Software: A Primer for Managers
Key concepts: Operating Systems · Application Software · Distributed Computing · Total Cost of Ownership (TCO)
A foundational overview of software, from operating systems to applications, and the financial implications of technology ownership.
Understanding Software: A Primer for Managers
Software is the intangible logic that transforms inert hardware into a functional tool. For the modern manager, software is not merely a line item in a budget; it is the primary driver of operational efficiency, competitive advantage, and strategic flexibility. As the industry shifts from "atoms to bits"—a transition exemplified by Netflix’s pivot from physical DVDs to digital streaming—the ability to navigate the software ecosystem becomes a core competency for leadership.
This article explores the hierarchical nature of software, the mechanics of distributed systems, and the economic realities of maintaining digital assets over time.
The Software Hierarchy: From Silicon to User
Software is traditionally viewed as a layered stack. At the bottom lies the hardware, governed by the Operating System (OS). Above the OS sits Application Software, which performs specific tasks for the end-user. Understanding this hierarchy is crucial because each layer imposes constraints and provides opportunities for the layers above it.
1. Operating Systems (OS)
The Operating System is the foundational software that controls the computer hardware and establishes standards for developing and executing applications. It acts as an intermediary, managing the "four horsemen" of computing resources: the CPU (processing), RAM (memory), Storage (disk), and Network (I/O).
Definition: The Kernel The core of the operating system is the kernel, which has complete control over everything in the system. It facilitates the interaction between hardware and software components, ensuring that applications do not crash the system by overstepping their allocated memory or processing power.
For managers, the OS represents a Platform. Choosing an OS (Windows, macOS, Linux, iOS, Android) often dictates the "ecosystem" of available applications and the talent pool required to maintain them.
How it Works: The System Call Interface Applications do not talk to hardware directly. Instead, they make system calls to the OS. If an application wants to save a file, it asks the OS; the OS checks permissions, finds space on the disk, and executes the write command.
/*
 * Example: Low-level System Call in C (Linux/Unix)
 * This demonstrates how an application requests the OS to write to a file.
 * Managers should note that "Software" at this level is about resource management.
 */

#include <unistd.h>
#include <fcntl.h>
#include <stdio.h>

int main() {
    int fd;
    char buffer[] = "Strategic Data: Zara Supply Chain v2\n";

    // open() is a system call to the OS to request access to a file resource
    fd = open("business_strategy.txt", O_WRONLY | O_CREAT, 0644);

    if (fd == -1) {
        perror("OS denied file access");
        return 1;
    }

    // write() passes data from the application's memory to the OS kernel
    write(fd, buffer, sizeof(buffer) - 1);

    // close() releases the hardware resource back to the OS
    close(fd);
    return 0;
}
2. Application Software
Application Software (or "apps") refers to programs that perform work that users are directly interested in. In a business context, this is categorized into two main types:
- Desktop Software: Applications installed on a local computing device (e.g., Microsoft Excel, Adobe Photoshop).
- Enterprise Software: Large-scale systems that support multiple users across an entire organization (e.g., ERP, CRM, SCM).
| Category | Definition | Examples | Strategic Value |
|---|---|---|---|
| ERP | Enterprise Resource Planning | SAP, Oracle, Microsoft Dynamics | Integrates back-office functions (finance, HR, inventory). |
| CRM | Customer Relationship Management | Salesforce, HubSpot | Tracks lead generation and customer lifecycle. |
| SCM | Supply Chain Management | JDA Software, Oracle SCM | Optimizes the flow of goods from raw materials to customers. |
| BI | Business Intelligence | Tableau, Power BI | Visualizes data to support decision-making. |
The "Build vs. Buy" Dilemma Managers must decide whether to purchase Commercial Off-The-Shelf (COTS) software or build Bespoke (Custom) software. COTS is cheaper and faster to deploy but offers no competitive advantage since competitors can buy the same tool. Custom software, like Zara’s proprietary handheld POS systems, can create a "moat" by enabling unique business processes that others cannot replicate.
Distributed Computing: The Power of Connectivity
In the modern era, software rarely lives on a single machine. Distributed Computing is a model where systems in different locations communicate and collaborate to complete a task. This is the backbone of the "Cloud."
1. Service-Oriented Architecture (SOA) and Microservices
Modern enterprise software is often built using Microservices. Instead of one giant, monolithic program, the software is broken into small, independent services that communicate over a network.
- API (Application Programming Interface): The "contract" that defines how one piece of software talks to another.
- Web Services: APIs that are accessed over the internet using standard protocols like HTTP.
2. Protocols and Standards
For distributed systems to work, they must agree on a language. The most common modern standard is REST (Representational State Transfer), which typically uses JSON (JavaScript Object Notation) to exchange data.
/*
 * Example: JSON Data Representation
 * This is how a Distributed System (like a mobile app)
 * receives data from a Server (like a CRM database).
 */
{
  "order_id": "ZARA-99283",
  "status": "shipped",
  "items": [
    {"sku": "Linen-Shirt-Blue", "quantity": 2, "price": 45.00},
    {"sku": "Slim-Fit-Chino", "quantity": 1, "price": 60.00}
  ],
  "customer": {
    "id": "CUST-404",
    "loyalty_tier": "Gold"
  }
}
Concrete Example: The Netflix API When you click "Play" on Netflix, a distributed dance begins. Your TV app sends a request to a "Playback Service" API. That service checks your "Subscription Service" to see if you've paid, then asks the "Content Delivery Network (CDN)" for the closest server with the video file. All these are separate software entities working in concert.
# Real-world usage: Fetching data from a Distributed API
# This Python snippet simulates a manager's dashboard pulling
# real-time sales data from an enterprise API.

import requests

def get_inventory_status(store_id):
    api_url = f"https://api.enterprise-retail.com/v1/stores/{store_id}/inventory"
    headers = {"Authorization": "Bearer TOKEN_12345"}

    try:
        response = requests.get(api_url, headers=headers)
        response.raise_for_status() # Check for network/auth errors

        data = response.json()
        for item in data['items']:
            if item['stock_level'] < 10:
                print(f"ALERT: {item['name']} is low ({item['stock_level']} units)")

    except requests.exceptions.RequestException as e:
        print(f"Distributed System Error: {e}")

get_inventory_status("MADRID_01")
Total Cost of Ownership (TCO): The Manager’s Reality
The most dangerous misconception in software management is that the "price" of software is the "cost" of software. Total Cost of Ownership (TCO) is a financial estimate intended to help buyers and owners determine the direct and indirect costs of a product or system.
1. The Iceberg Analogy
The purchase price or development cost is just the tip of the iceberg. Below the waterline are the massive, ongoing costs that often account for 70% to 80% of the total lifecycle cost.
| Cost Phase | Components | Description |
|---|---|---|
| Acquisition | Licensing, Hardware, Design | The initial "sticker price" or development labor. |
| Deployment | Configuration, Integration, Testing | Making the software work with existing systems. |
| Training | User education, Documentation | Ensuring staff can actually use the new tool. |
| Maintenance | Bug fixes, Security patches, Updates | Keeping the software functional and safe over time. |
| Support | Help desk, Technical staff | Assisting users when things go wrong. |
| Opportunity Cost | Downtime, Lost productivity | The cost of the system being unavailable. |
2. Technical Debt
Technical Debt occurs when a team chooses an easy (but limited) solution now instead of a better approach that would take longer. Like financial debt, technical debt accrues "interest" in the form of increased maintenance costs and decreased agility. If a manager pushes a team to "just get it done" by Friday, they are likely taking on technical debt that will increase the TCO in the long run.
3. Calculating TCO
A simplified model for TCO over $n$ years can be expressed as:
$$TCO = I + \sum_{t=1}^{n} \frac{M_t + O_t + S_t}{(1+r)^t}$$
Where:
- $I$ = Initial Investment (License + Implementation)
- $M$ = Maintenance costs in year $t$
- $O$ = Operating costs (Hosting, Power, Admin)
- $S$ = Support and Training costs
- $r$ = Discount rate (to account for the time value of money)
# Pseudocode/Logic for a TCO Calculator
# Managers can use this logic to compare "Cloud" vs "On-Premise"

FUNCTION calculate_tco(years, initial_cost, annual_maint, annual_training, cloud_fees):
    total = initial_cost
    FOR year FROM 1 TO years:
        # Cloud usually has lower initial but higher annual 'rental' fees
        operating_expense = annual_maint + annual_training + cloud_fees

        # Adjust for inflation or discount rate (simplified here)
        total = total + operating_expense

    RETURN total

# Scenario A: On-Premise (High upfront, lower annual)
# Scenario B: SaaS/Cloud (Low upfront, higher annual)
Common Pitfalls in Software Management
- The "Sunk Cost" Fallacy: Continuing to pour money into a failing software project because "we've already spent $2 million on it." If the TCO of finishing the project exceeds the expected value, the rational choice is to pivot or cancel.
- Underestimating Integration: Managers often assume that two pieces of software can "just talk to each other." In reality, integration (making the CRM talk to the ERP) can cost more than the licenses for both systems combined.
- Ignoring the "Human Element": Software doesn't fail because the code is bad; it fails because users refuse to adopt it. Training and change management are essential components of TCO.
- Vendor Lock-in: Choosing a proprietary software platform (like Oracle or Microsoft) can make it prohibitively expensive to switch later. This gives the vendor "pricing power" over your firm.
Summary of Strategic Implications
Software is the lever that allows a firm to scale. Moore’s Law ensures that hardware becomes faster and cheaper, but software complexity tends to grow over time. A manager's job is not to understand every line of code, but to understand the interfaces (how systems connect), the platforms (the environment where value is created), and the TCO (the true economic impact).
- Operating Systems provide the platform and manage resources.
- Application Software provides the specific business value.
- Distributed Computing enables scale and connectivity via APIs.
- TCO provides the reality check for long-term sustainability.
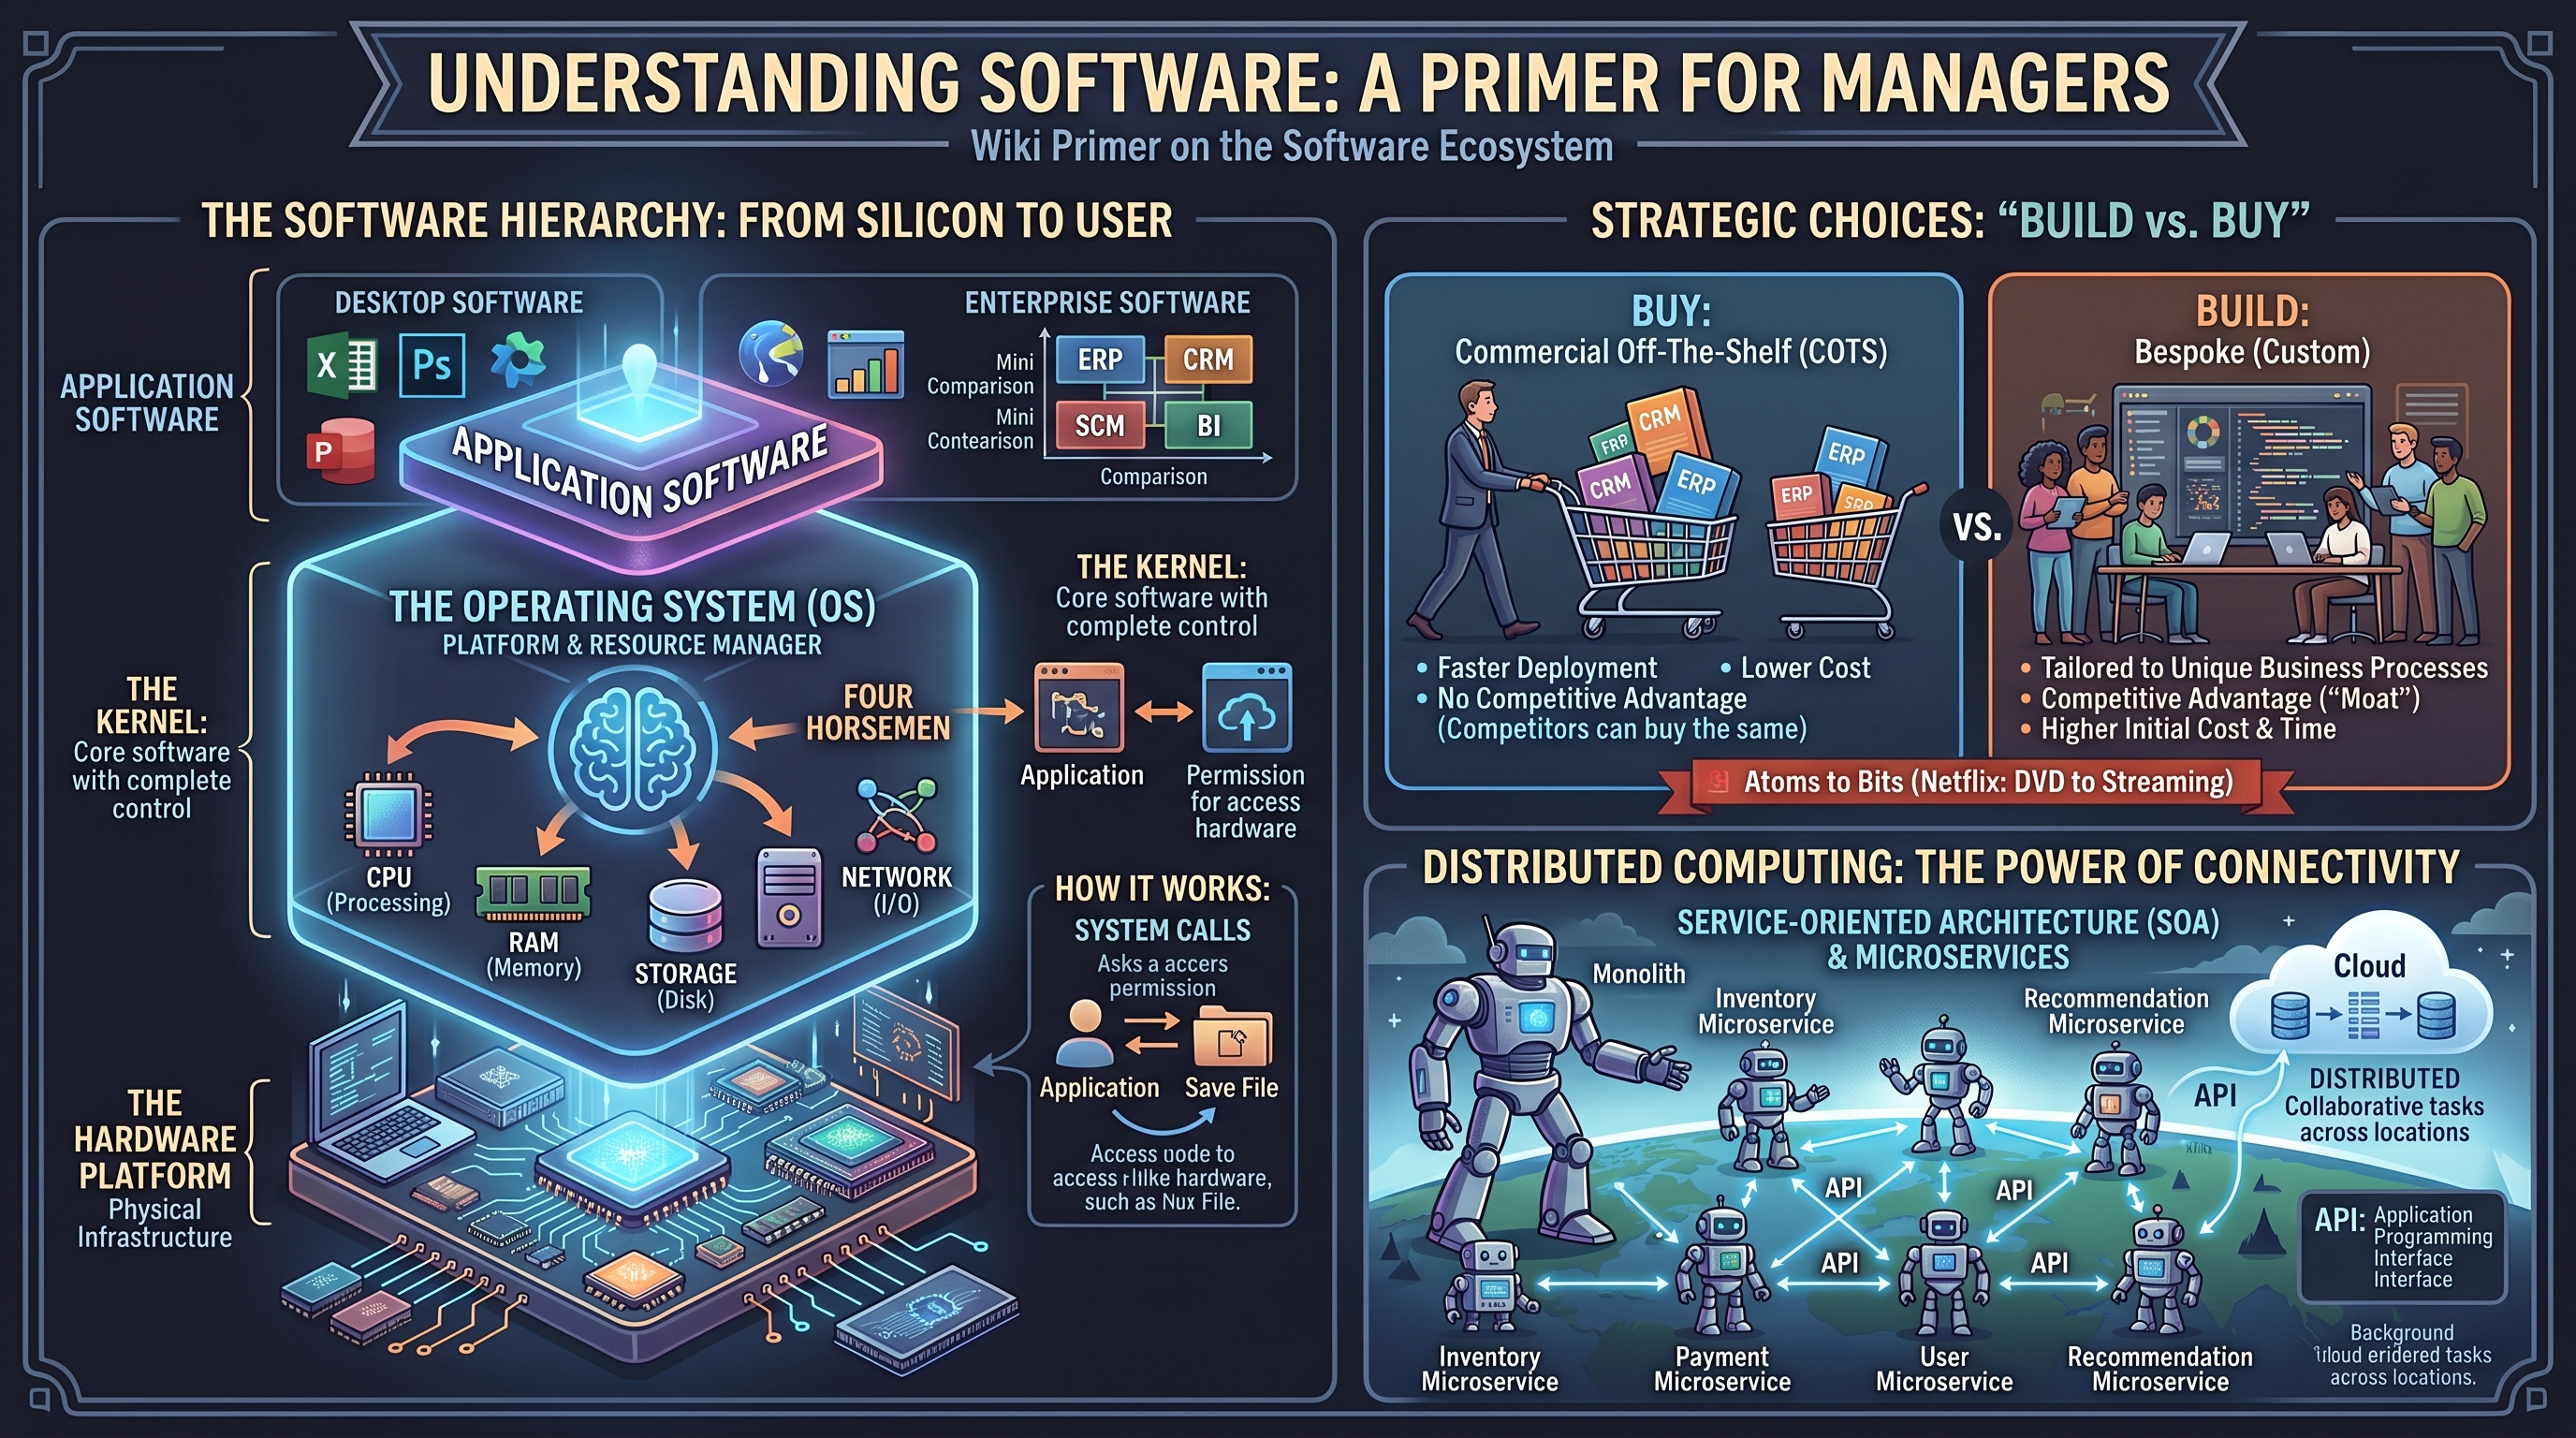
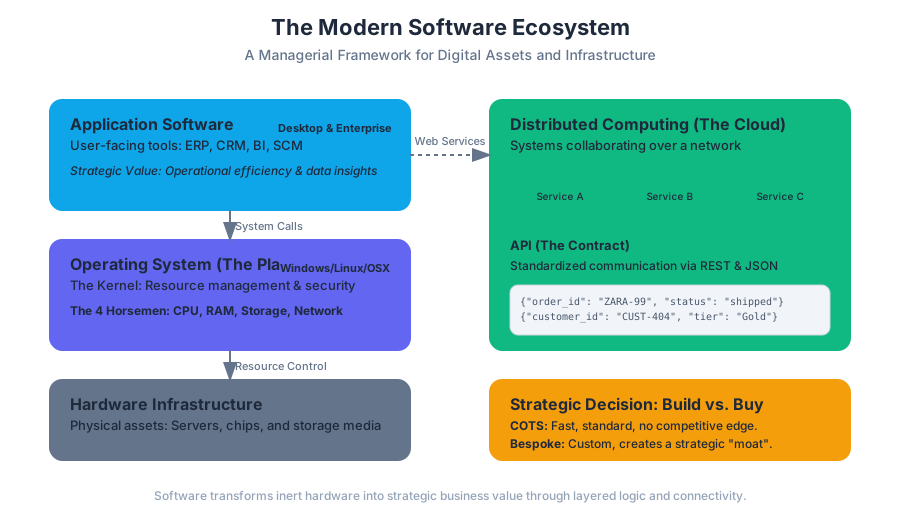
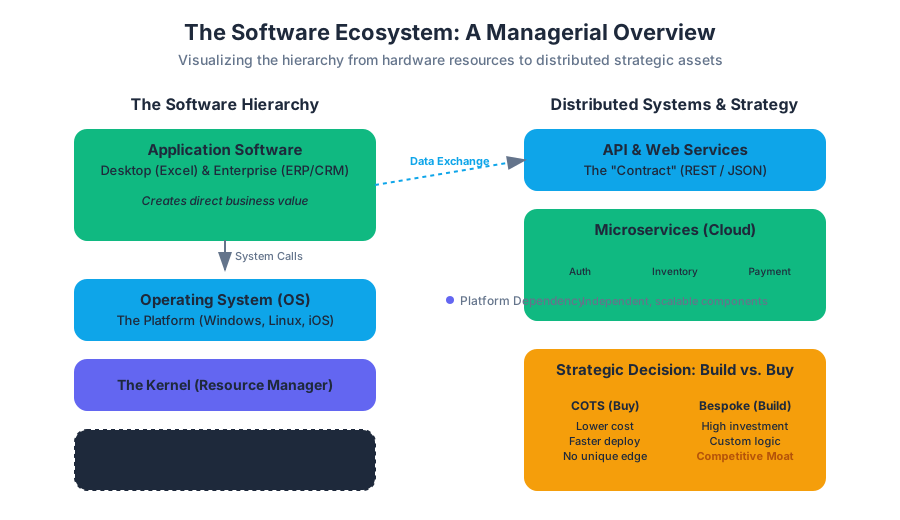
Software in Flux: Cloud and Open Source
Key concepts: Open Source Software (OSS) · Cloud Computing · Software as a Service (SaaS) · Virtualization
An examination of the shifting landscape of software delivery, focusing on open-source software, cloud computing, and virtualization.
Software in Flux: Cloud and Open Source
The traditional model of software production and distribution—characterized by proprietary code, high upfront licensing fees, and "shrink-wrapped" physical media—has undergone a radical transformation. This shift, often described as "Software in Flux," is driven by the convergence of Open Source Software (OSS), Cloud Computing, and Virtualization. Together, these technologies have decoupled software from hardware and ownership from utility, moving the industry toward a service-oriented architecture where marginal costs approach zero and scalability is virtually infinite.
Open Source Software (OSS)
Open Source Software (OSS) refers to software where the source code is made available to the public, allowing anyone to inspect, modify, and enhance it. Unlike proprietary software (e.g., Microsoft Windows or Adobe Photoshop), OSS is built on a foundation of collaboration and transparency.
The Philosophy of "Free"
In the context of OSS, "free" refers to liberty rather than price. Richard Stallman, a pioneer of the movement, famously distinguished between "free as in speech" (Libre) and "free as in beer" (Gratis).
Linus’s Law: "Given enough eyeballs, all bugs are shallow." This principle suggests that the massive, distributed peer-review process of OSS leads to more robust and secure code than the "security through obscurity" model of proprietary firms.
Business Models and Licensing
OSS is governed by various licenses that dictate how the code can be used and redistributed. These range from "copyleft" licenses, which require derivative works to also be open source, to "permissive" licenses, which allow the code to be integrated into proprietary products.
| License Type | Key Examples | Requirement for Derivative Works | Commercial Use |
|---|---|---|---|
| Copyleft (Strong) | GNU GPL v3 | Must be open source under the same license. | Allowed, but code must be shared. |
| Copyleft (Weak) | LGPL | Only modifications to the library itself must be shared. | Allowed; can link to proprietary apps. |
| Permissive | MIT, Apache 2.0 | No requirement to share modifications. | Fully allowed; very popular for startups. |
| Proprietary | EULA (Microsoft) | Modification and redistribution strictly forbidden. | Paid licensing/Subscription. |
Low-Level Implementation: Memory Management in OSS
To understand the transparency of OSS, consider how a core utility might handle memory allocation. In a proprietary system, this is a "black box." In an OSS system like Linux, we can inspect the malloc implementation or write our own memory-mapped allocator.
/*
 * A simplified low-level memory allocator snippet
 * demonstrating how OSS allows developers to interface
 * directly with system calls like mmap.
 */
#include <sys/mman.h>
#include <unistd.h>
#include <stdio.h>

void* oss_allocate(size_t size) {
    // Requesting memory directly from the kernel
    void* ptr = mmap(NULL, size, PROT_READ | PROT_WRITE,
                     MAP_PRIVATE | MAP_ANONYMOUS, -1, 0);

    if (ptr == MAP_FAILED) {
        perror("mmap failed");
        return NULL;
    }
    return ptr;
}

int main() {
    size_t request_size = 4096; // One page
    void* my_mem = oss_allocate(request_size);
    printf("Allocated %zu bytes at address %p\n", request_size, my_mem);
    munmap(my_mem, request_size);
    return 0;
}
Cloud Computing: The Utility Model
Cloud Computing is the delivery of computing services—including servers, storage, databases, networking, and software—over the internet ("the cloud"). It represents a shift from CapEx (Capital Expenditure, buying hardware) to OpEx (Operating Expenditure, paying for what you use).
The Service Hierarchy
Cloud computing is generally categorized into three distinct layers, often visualized as a pyramid.
- Software as a Service (SaaS): Delivering end-user applications over a browser (e.g., Salesforce, Google Workspace).
- Platform as a Service (PaaS): Providing a platform for developers to build, deploy, and manage applications without worrying about the underlying infrastructure (e.g., Heroku, Google App Engine).
- Infrastructure as a Service (IaaS): Providing raw computing resources like virtual machines, storage, and networks (e.g., AWS EC2, Microsoft Azure).
| Feature | SaaS | PaaS | IaaS |
|---|---|---|---|
| User | Business End-User | Software Developer | System Administrator |
| Management | Vendor manages everything | Vendor manages OS/Hardware | User manages OS/Apps |
| Flexibility | Lowest (Standardized) | Medium (Dev focus) | Highest (Full control) |
| Examples | Slack, Dropbox | AWS Lambda, Heroku | AWS EC2, Google Compute Engine |
The Economics of Availability
Cloud providers often guarantee "five nines" of availability (99.999%). This is calculated using the relationship between Mean Time Between Failures (MTBF) and Mean Time To Repair (MTTR).
\text{Availability} (A) = \frac{MTBF}{MTBF + MTTR}
To achieve high availability, cloud systems use Load Balancers and Auto-scaling Groups.
Cloud Infrastructure as Code (IaC)
Modern cloud management does not happen in a GUI; it happens in code. Below is a configuration for a load-balanced web server environment.
# Example Terraform-style configuration for IaaS deployment
resource "aws_instance" "web_server" {
  count         = 3
  ami           = "ami-0c55b159cbfafe1f0" # Amazon Linux 2
  instance_type = "t2.micro"

  tags = {
    Name = "DeepWiki-Web-Node-${count.index}"
    Environment = "Production"
  }

  user_data = <<-EOF
              #!/bin/bash
              yum update -y
              yum install -y httpd
              systemctl start httpd
              EOF
}

resource "aws_lb" "main_lb" {
  name               = "production-lb"
  internal           = false
  load_balancer_type = "application"
  security_groups    = [aws_security_group.lb_sg.id]
  subnets            = [aws_subnet.public_a.id, aws_subnet.public_b.id]
}
Virtualization: The Engine of the Flux
Virtualization is the fundamental technology that enables cloud computing. It allows a single physical machine to be partitioned into multiple Virtual Machines (VMs), each running its own operating system. This is achieved through a software layer called a Hypervisor.
Hypervisor Types
- Type 1 (Bare Metal): Runs directly on the host's hardware (e.g., VMware ESXi, Xen). It is highly efficient and used in data centers.
- Type 2 (Hosted): Runs as an application on top of an existing OS (e.g., VirtualBox, VMware Workstation). It is primarily used for development and testing.
Containers vs. Virtual Machines
While VMs virtualize the hardware, Containers virtualize the Operating System. Containers share the host's kernel but isolate the application processes.
| Attribute | Virtual Machines (VM) | Containers (e.g., Docker) |
|---|---|---|
| Isolation | Strong (Full OS isolation) | Process-level (Shared kernel) |
| Startup Time | Minutes (Booting OS) | Seconds (Starting process) |
| Size | Gigabytes (Includes OS) | Megabytes (App + Libs) |
| Efficiency | Lower (Hypervisor overhead) | Higher (Native execution) |
Real-World Usage: Container Orchestration
Managing thousands of containers requires orchestration tools like Kubernetes. A simple CLI interaction to deploy a service looks like this:
# 1. Build the container image from a Dockerfile
docker build -t deepwiki/app:v1 .

# 2. Push the image to a central registry
docker push deepwiki/app:v1

# 3. Deploy to a Kubernetes cluster with 5 replicas
kubectl create deployment web-app --image=deepwiki/app:v1
kubectl scale deployment/web-app --replicas=5

# 4. Expose the deployment to the internet via a LoadBalancer
kubectl expose deployment web-app --port=80 --target-port=8080 --type=LoadBalancer

# 5. Check status
kubectl get pods -o wide
Strategic Implications for Management
The shift to OSS and Cloud is not merely a technical decision; it is a strategic one. Managers must weigh the benefits of agility and cost against the risks of dependency.
Total Cost of Ownership (TCO)
While OSS has no "license fee," its TCO includes support, maintenance, training, and integration. Similarly, Cloud Computing can become more expensive than on-premises hardware if resource usage is not strictly monitored (a phenomenon known as "Cloud Sprawl").
The Risk of Vendor Lock-in
Proprietary cloud features (like AWS DynamoDB or Azure Cosmos DB) offer high performance but make it difficult to migrate to another provider. This creates Switching Costs, a key concept in strategic management. To mitigate this, many firms adopt a Multi-cloud or Hybrid Cloud strategy.
Security and Compliance
In the cloud, security is a Shared Responsibility Model. The provider is responsible for the security of the cloud (physical data centers, hardware), while the customer is responsible for security in the cloud (data encryption, identity management, firewall rules).
| Strategic Factor | Advantage of Cloud/OSS | Potential Pitfall |
|---|---|---|
| Scalability | Handle "Flash Crowds" effortlessly. | Unexpectedly high monthly bills. |
| Time-to-Market | Deploy in minutes, not months. | Technical debt from rapid iteration. |
| Cost Structure | Low entry barrier for startups. | Complex billing and "hidden" data egress fees. |
| Innovation | Access to AI/ML tools as services. | Loss of control over the underlying stack. |
Strategic Insight: The transition from "Atoms to Bits" (physical distribution to digital) is accelerated by the cloud. Companies like Netflix survived this transition by moving their entire infrastructure to AWS, allowing them to focus on content and recommendation algorithms rather than managing data centers.
Common Pitfalls and Misconceptions
- "OSS is less secure because the code is public." As noted by Linus's Law, public code often leads to faster patching. The danger lies in unmaintained OSS libraries that are integrated into enterprise software without oversight (e.g., the Heartbleed or Log4j vulnerabilities).
- "The Cloud is always cheaper." For steady-state workloads with predictable demand, owning hardware can be significantly cheaper over a 3-5 year horizon. The cloud's value is in elasticity and agility, not just raw cost.
- "Virtualization is the same as Cloud." Virtualization is a technology; Cloud is a service model built upon that technology. You can have virtualization without having a cloud (e.g., a single server running three VMs in a closet).
- OSS: Software with publicly accessible source code, often developed through community collaboration.
- SaaS: Software delivered as a subscription service over the internet, requiring no local installation.
- IaaS: Cloud model providing raw infrastructure (servers, storage) as a utility.
- Hypervisor: Software that creates and runs virtual machines by isolating them from the underlying hardware.
- Containerization: A lightweight virtualization method that shares the host OS kernel to run isolated applications.
- TCO (Total Cost of Ownership): The comprehensive financial estimate including direct and indirect costs of a product or system.
- Copyleft: A licensing practice that allows others to freely use and modify code, provided they keep the derivative works open.
- Multi-tenancy: A cloud architecture where multiple customers share the same physical resources while keeping their data isolated.
-
Which license requires that any software derived from it also be released as open source?
- A) MIT
- B) Apache
- C) GNU GPL
- D) BSD Correct: C
-
In the Shared Responsibility Model of Cloud Computing, who is typically responsible for patching the Guest Operating System in an IaaS model?
- A) The Cloud Provider (e.g., AWS)
- B) The Customer
- C) Both A and B
- D) The Hardware Manufacturer Correct: B
-
What is the primary technical difference between a Container and a Virtual Machine?
- A) Containers require a Type 1 Hypervisor.
- B) VMs share the host's Operating System kernel.
- C) Containers share the host's Operating System kernel; VMs do not.
- D) VMs are only used for SaaS applications. Correct: C
-
Which concept explains why a firm might stay with a cloud provider despite rising costs?
- A) Marginal Cost
- B) Switching Costs / Vendor Lock-in
- C) Moore's Law
- D) Open Source Philosophy Correct: B
Summary of Key Themes
- The End of Ownership: Software is moving from a product you buy to a service you rent.
- The Power of Community: OSS leverages global talent to create infrastructure that rivals (and often exceeds) proprietary alternatives.
- Elasticity as a Competitive Weapon: The ability to scale resources up or down instantly allows firms to take risks without massive capital investment.
- Abstraction Layers: Virtualization and Containers allow developers to focus on code rather than the "plumbing" of hardware.
Critical Thinking Questions
- How does the "Atoms to Bits" transition change the barriers to entry for a new competitor in the media industry?
- If you were a CTO, under what specific conditions would you choose an on-premises data center over a public cloud provider?
- How does the use of OSS impact a company's "Sustainable Competitive Advantage" if their competitors have access to the same code?
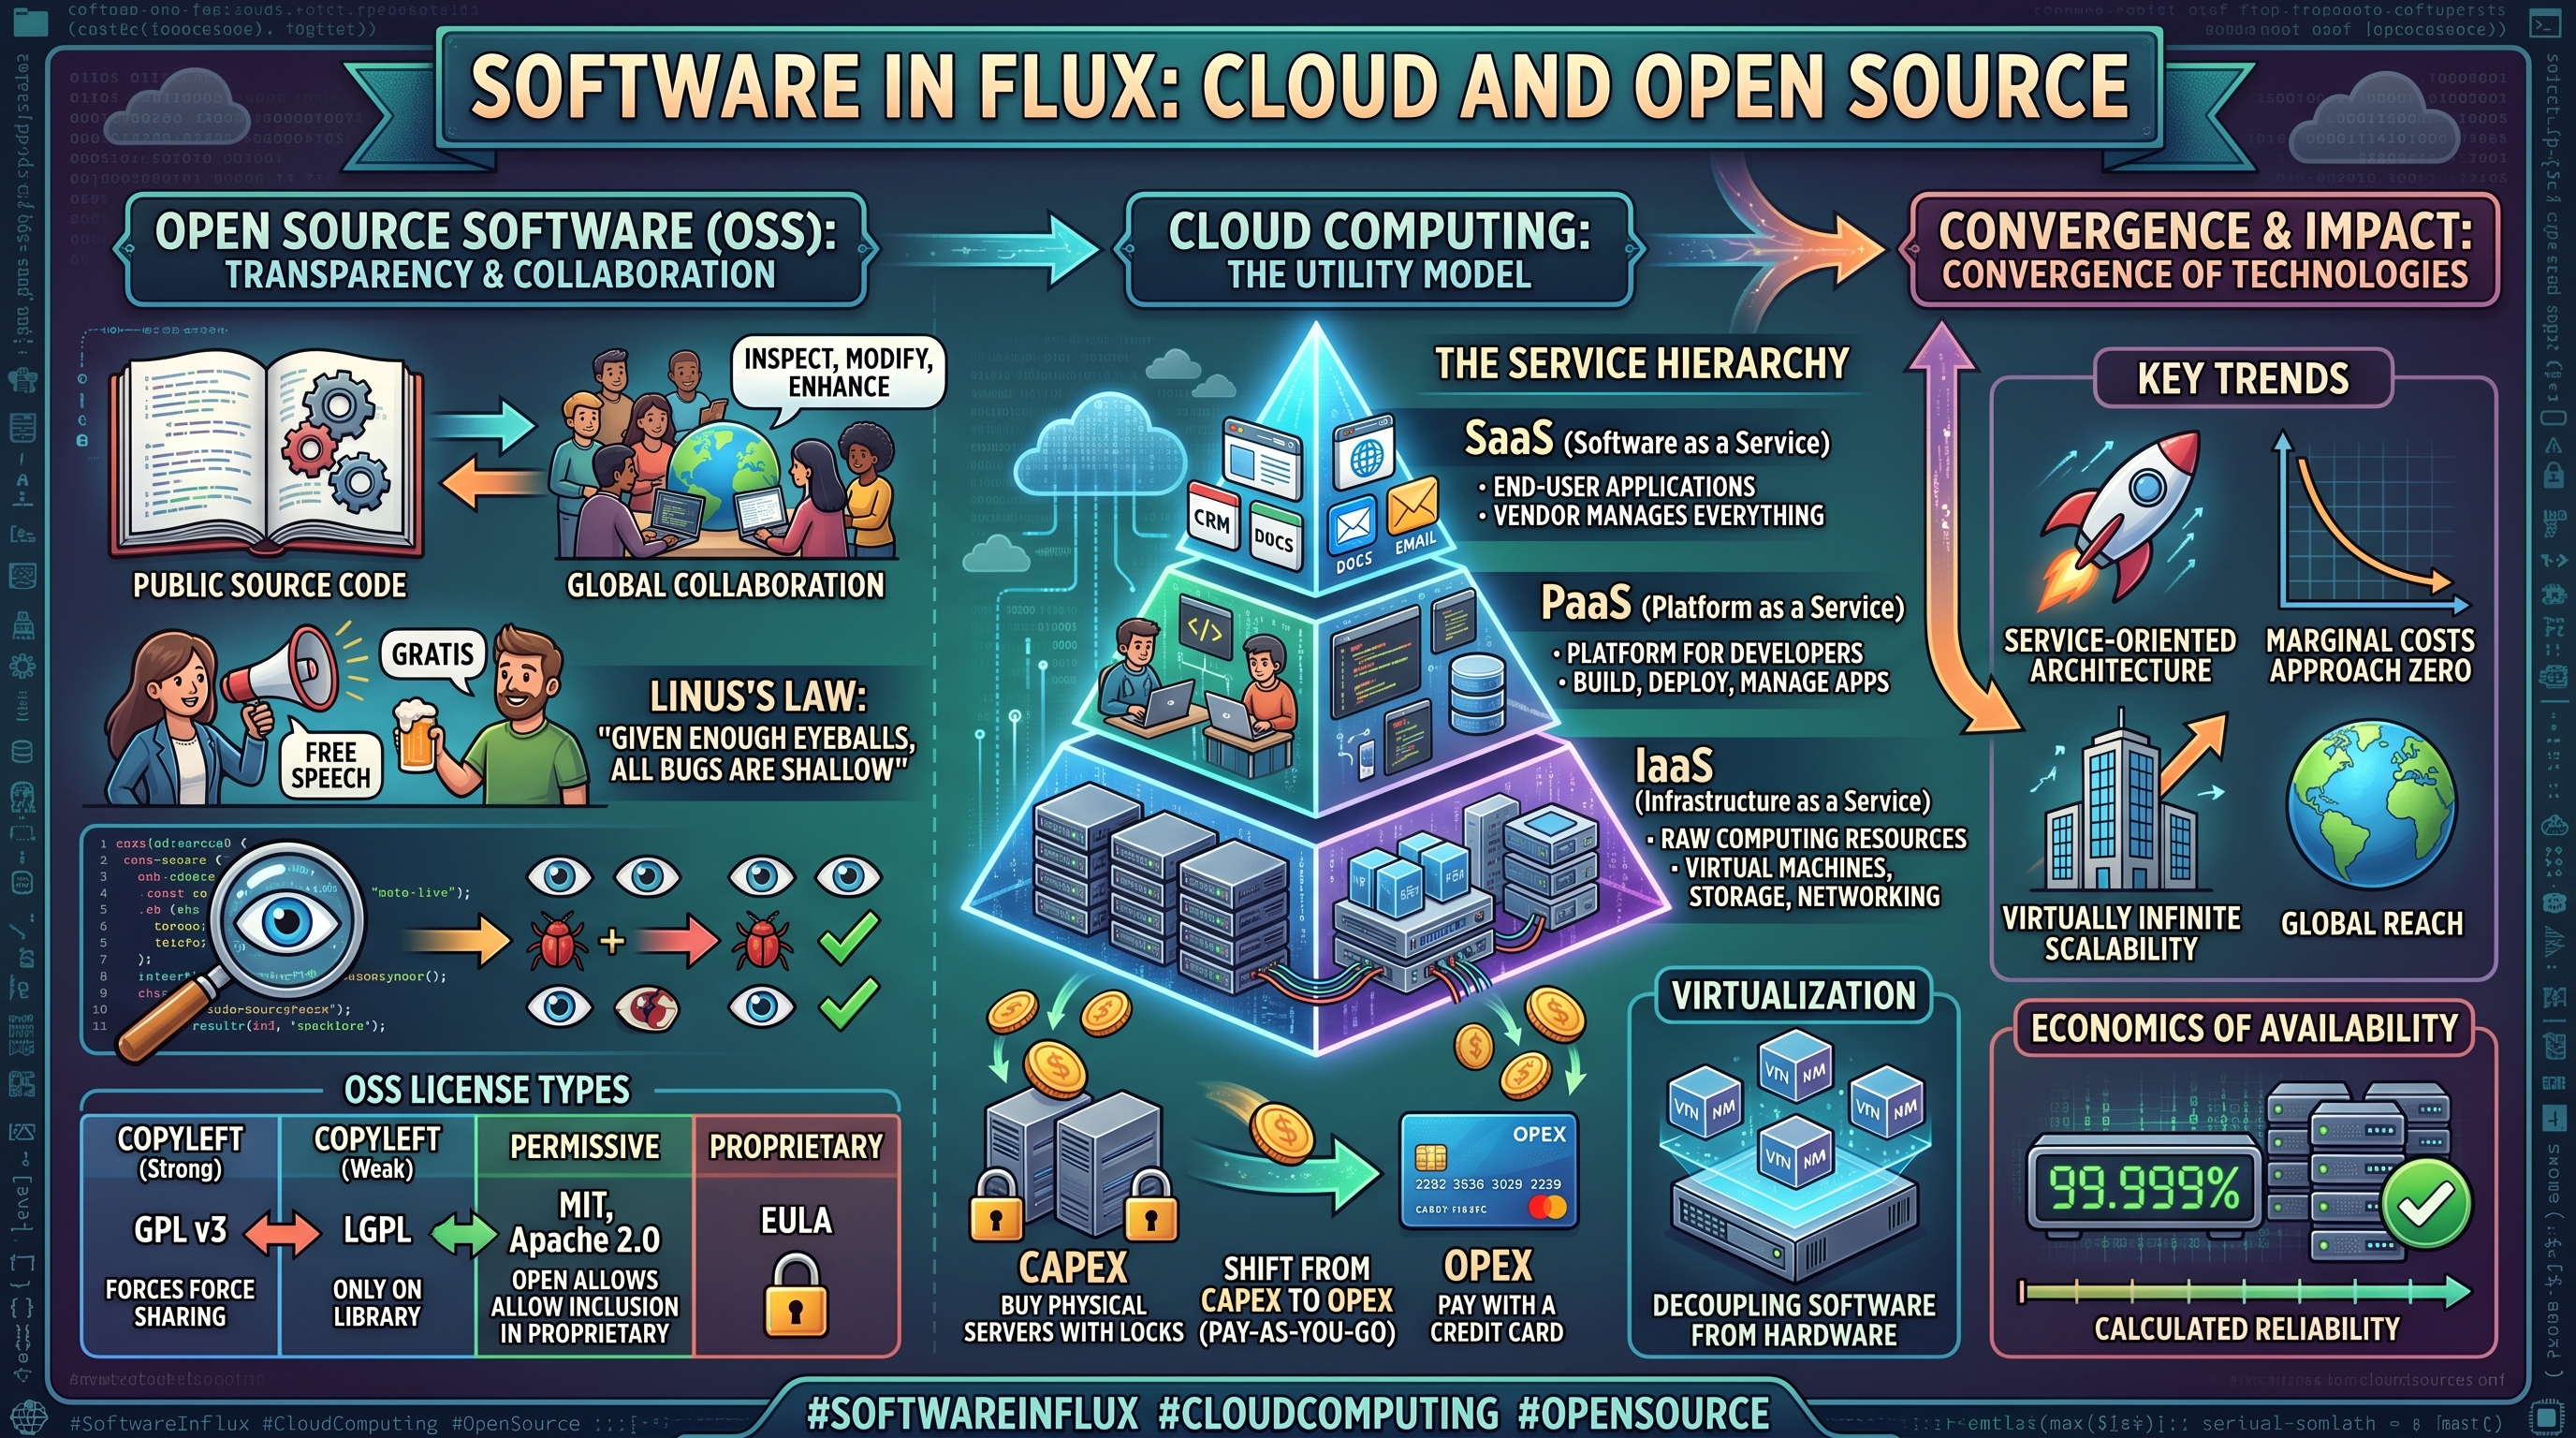
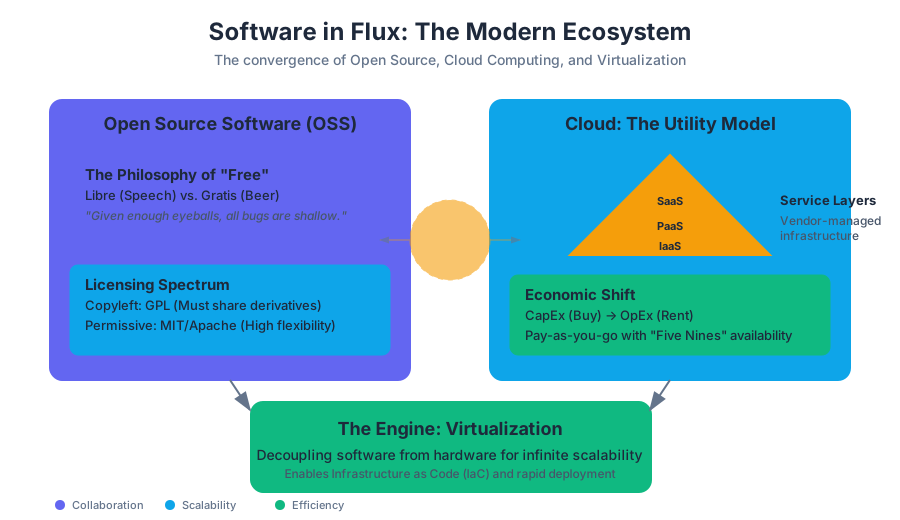
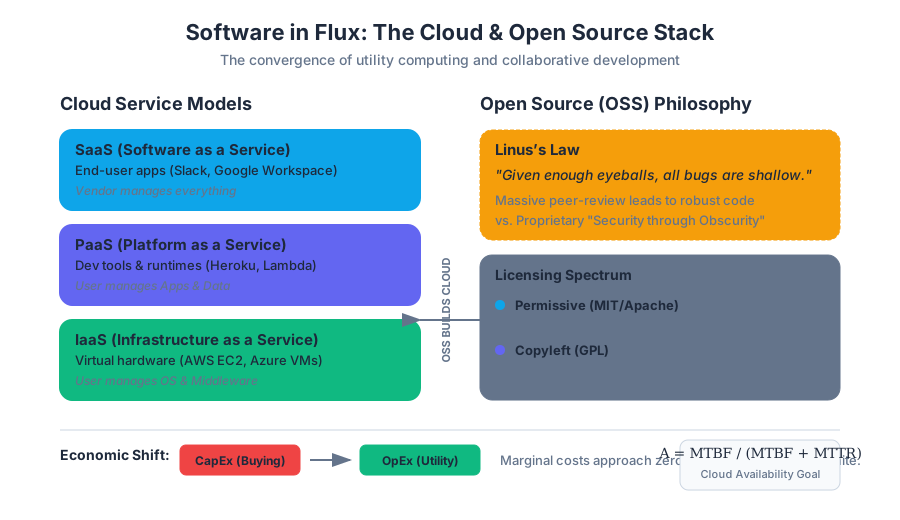
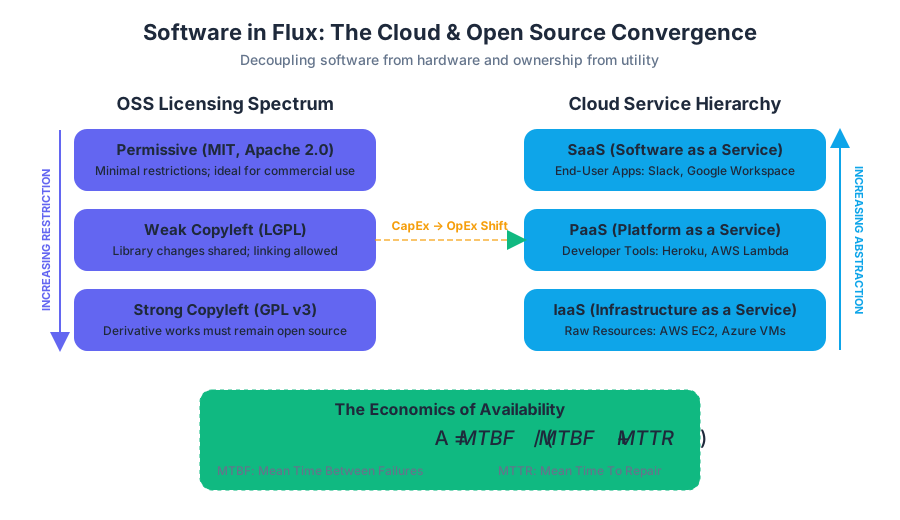
The Data Asset: Databases and Business Intelligence
Key concepts: Data vs. Information vs. Knowledge · Business Intelligence (BI) · Data Warehouses and Data Marts · Customer Relationship Management (CRM)
How organizations transform raw data into actionable business intelligence to gain a competitive advantage.
The Data Asset: Databases and Business Intelligence
In the modern enterprise, the transition from "atoms to bits" has fundamentally reconfigured the basis of competitive advantage. As physical infrastructure becomes increasingly commoditized—driven by the relentless trajectory of Moore’s Law—the strategic focus has shifted from the ownership of hardware to the mastery of the data that flows through it. Data is no longer a mere byproduct of business operations; it is a primary asset, often carrying a valuation that exceeds the physical holdings of the firm.
This section explores the technical and managerial frameworks required to transform raw data into strategic intelligence. We will examine the hierarchy of knowledge, the architectural underpinnings of databases, the structural nuances of data warehouses, and the analytical engines that drive Business Intelligence (BI) and Customer Relationship Management (CRM).
The Hierarchy of Insight: Data, Information, and Knowledge
To manage the data asset effectively, one must first distinguish between its various states of evolution. These terms are often used interchangeably in casual conversation, but in Information Systems (IS), they represent distinct stages of value.
1. Data
Data refers to raw facts and figures. In its primal state, data is devoid of context and utility. It represents a recorded signal—a transaction, a temperature reading, or a clickstream event. For a manager, data is the "ground truth" but provides no inherent direction.
2. Information
Information is data presented in a context that makes it useful for decision-making. By aggregating, calculating, or filtering data, we reveal patterns. If "100 units sold" is data, then "100 units sold represents a 20% increase over last Tuesday" is information.
3. Knowledge
Knowledge is the highest level of the hierarchy. It is the insight derived from experience, expertise, and the synthesis of information. Knowledge allows a firm to take action. It is the understanding that the 20% increase in sales was caused by a specific marketing campaign, leading to the decision to scale that campaign globally.
| Attribute | Data | Information | Knowledge |
|---|---|---|---|
| Nature | Raw, unorganized facts | Organized, structured facts | Applied, synthesized insights |
| Question | What? | Who, Where, When? | How, Why? |
| Value | Low (Potential) | Medium (Operational) | High (Strategic) |
| Example | "42" | "The temperature is 42°C" | "It is too hot for the server rack; activate cooling" |
The DIKW Principle: The goal of Business Intelligence is to facilitate the upward migration of assets through the Data-Information-Knowledge-Wisdom hierarchy, reducing the "latency" between a real-world event and a strategic response.
The Foundation: Database Management Systems (DBMS)
At the heart of the data asset lies the Database, a structured collection of related data. However, the data itself is inert without a Database Management System (DBMS)—the software layer used to create, maintain, and manipulate the data.
Relational vs. Non-Relational Models
For decades, the Relational Database Management System (RDBMS) has been the enterprise standard. In an RDBMS, data is organized into tables (relations) with fixed schemas, linked by unique identifiers called Primary Keys and Foreign Keys. This structure ensures ACID compliance (Atomicity, Consistency, Isolation, Durability), which is critical for transactional integrity.
However, the rise of "Big Data" has popularized NoSQL (Not Only SQL) databases. These systems trade strict consistency for massive scalability and the ability to handle unstructured data (like social media posts or sensor logs).
Implementation Example: The Relational Query
The primary language for interacting with an RDBMS is SQL (Structured Query Language). Below is a non-trivial example of a query designed to extract "Information" from "Data" by identifying high-value customers.
-- Identifying "Whale" customers: Those who spent > $5000 in the last 90 days
WITH CustomerSpending AS (
    SELECT
        c.customer_id,
        c.first_name || ' ' || c.last_name AS full_name,
        SUM(o.order_total) AS total_invested,
        COUNT(o.order_id) AS order_frequency
    FROM customers c
    JOIN orders o ON c.customer_id = o.customer_id
    WHERE o.order_date >= CURRENT_DATE - INTERVAL '90 days'
    GROUP BY c.customer_id, c.first_name, c.last_name
)
SELECT
    full_name,
    total_invested,
    order_frequency,
    ROUND(total_invested / order_frequency, 2) AS average_order_value
FROM CustomerSpending
WHERE total_invested > 5000
ORDER BY total_invested DESC;
Business Intelligence (BI) and Analytics
Business Intelligence (BI) is an umbrella term that includes the tools, infrastructure, and best practices that enable access to and analysis of information to improve and optimize decisions and performance.
The Mechanics of BI
BI systems typically operate on three levels:
- Reporting: Standardized views of "what happened."
- OLAP (Online Analytical Processing): A method of querying data that allows users to "slice and dice" information across multiple dimensions (e.g., viewing sales by region, then by product, then by time).
- Data Mining: Using statistical algorithms to discover hidden patterns and relationships in large datasets (e.g., market basket analysis).
Mathematical Foundation: RFM Analysis
A core technique in BI for customer segmentation is RFM Analysis (Recency, Frequency, Monetary). This provides a quantitative score for customer value.
\text{RFM Score} = (W_R \times R_{score}) + (W_F \times F_{score}) + (W_M \times M_{score})
Where:
- $R_{score}$: How recently a customer purchased (lower days = higher score).
- $F_{score}$: How often they purchase.
- $M_{score}$: How much they have spent in total.
- $W$: Weights assigned by the business based on industry importance.
| System Type | Primary Goal | Data Characteristics | User Base |
|---|---|---|---|
| OLTP (Transactional) | Record daily business events | High-volume, small transactions, normalized | Front-line staff, automated systems |
| OLAP (Analytical) | Support decision making | Aggregated, historical, denormalized | Managers, Data Scientists, Analysts |
Data Warehousing and Data Marts
As organizations grow, their data becomes fragmented across various functional "silos" (e.g., Marketing has one database, HR has another). To gain a holistic view, firms use Data Warehouses.
1. Data Warehouse
A Data Warehouse is a large, centralized repository that aggregates data from multiple sources across the entire organization. It is designed specifically for query and analysis rather than transaction processing.
2. Data Mart
A Data Mart is a subset of a data warehouse, usually oriented to a specific business line or team (e.g., a "Marketing Data Mart"). This allows for faster access and more relevant data structures for specific user groups.
The ETL Pipeline
The process of moving data into a warehouse is known as ETL (Extract, Transform, Load):
- Extract: Pulling data from source systems (CRMs, ERPs, flat files).
- Transform: Cleaning the data, resolving inconsistencies (e.g., "USA" vs "United States"), and applying business logic.
- Load: Writing the data into the warehouse schema.
Modern Infrastructure: Orchestrating the Pipeline
In modern "DataOps," these pipelines are managed as code. Below is a conceptual configuration for an ETL job using a YAML-based orchestrator like Airflow or a similar tool.
pipeline_id: daily_sales_sync
schedule: "0 2 * * *" # Run at 2 AM daily
tasks:
  - name: extract_from_pos
    type: postgres_operator
    source_db: production_pos
    query: "SELECT * FROM transactions WHERE created_at > NOW() - INTERVAL '1 day'"

  - name: transform_currency
    type: python_script
    script: "scripts/convert_to_usd.py"
    input: extract_from_pos.output

  - name: load_to_snowflake
    type: snowflake_load
    target_table: fact_sales
    schema: warehouse_prod
    on_failure: alert_data_eng_slack
Customer Relationship Management (CRM)
CRM systems are a specialized category of information systems designed to manage a firm's interactions with current and potential customers. While often viewed as a "sales tool," a true CRM is a strategic data asset that integrates touchpoints across sales, marketing, and customer support.
Why CRM Matters
The cost of acquiring a new customer is significantly higher than the cost of retaining an existing one. CRM systems enable Personalization at Scale. By tracking every interaction—from an email open to a support ticket—the firm can build a 360-degree view of the customer.
Concrete Example: Netflix and Zara
- Zara: Uses mobile devices in-store to feed customer feedback directly into their CRM and design systems. If customers ask for a specific hemline, that "data" becomes "information" for designers, who create "knowledge" about the next trend.
- Netflix: Their recommendation engine is essentially a massive, automated CRM/BI hybrid. By analyzing viewing habits (data), they predict what you want to watch next (information), and decide which original series to fund (knowledge).
Common Pitfalls in CRM Implementation
- Data Silos: If the CRM doesn't talk to the accounting system, sales reps might try to upsell a customer who hasn't paid their last three bills.
- Low Data Quality: "Garbage In, Garbage Out" (GIGO). If sales staff don't enter data accurately, the BI reports generated from the CRM are worthless.
- Focusing on Technology over Process: A CRM is a strategy, not just a software package. Buying Salesforce won't fix a broken sales culture.
The Rise of Big Data and Machine Learning
The "Data Asset" is currently undergoing a shift characterized by the 3 Vs:
- Volume: The sheer amount of data (Petabytes and Exabytes).
- Velocity: The speed at which data is generated and must be processed (Real-time streaming).
- Variety: The different forms of data (Social media, video, IoT sensors).
To handle this, firms are moving toward Data Lakes—repositories that store raw data in its native format until it is needed—and utilizing Machine Learning (ML) to automate the "Knowledge" layer of the DIKW pyramid.
Data Science Implementation
The following Python snippet demonstrates how a data scientist might use the data asset to perform a simple k-means clustering for customer segmentation.
import pandas as pd
from sklearn.cluster import KMeans
import matplotlib.pyplot as plt

# Load processed data from the Data Mart
df = pd.read_csv('customer_metrics.csv')

# Selecting features: Recency, Frequency, Monetary Value
X = df[['recency', 'frequency', 'monetary_value']]

# Initialize KMeans with 4 clusters (e.g., Champions, At-Risk, New, Hibernating)
kmeans = KMeans(n_clusters=4, init='k-means++', random_state=42)
df['segment_id'] = kmeans.fit_predict(X)

# Summary of segments for management
segment_summary = df.groupby('segment_id').agg({
    'recency': 'mean',
    'frequency': 'mean',
    'monetary_value': 'mean',
    'customer_id': 'count'
}).rename(columns={'customer_id': 'count'})

print("Strategic Customer Segments:")
print(segment_summary)
Summary of Strategic Implications
For a manager, the data asset represents the difference between "guessing" and "knowing." However, the transition from a traditional firm to a data-driven one requires more than just hardware. It requires a cultural shift toward evidence-based decision-making and a rigorous understanding of the underlying technical architectures.
| Concept | Strategic Value | Key Risk |
|---|---|---|
| Database | Operational efficiency and ACID integrity | Single point of failure; scaling bottlenecks |
| Data Warehouse | Holistic "Single Version of the Truth" | High implementation cost; data staleness |
| Business Intelligence | Improved decision speed and accuracy | Misinterpretation of correlations as causation |
| CRM | Increased Customer Lifetime Value (CLV) | Privacy concerns and regulatory (GDPR) risk |
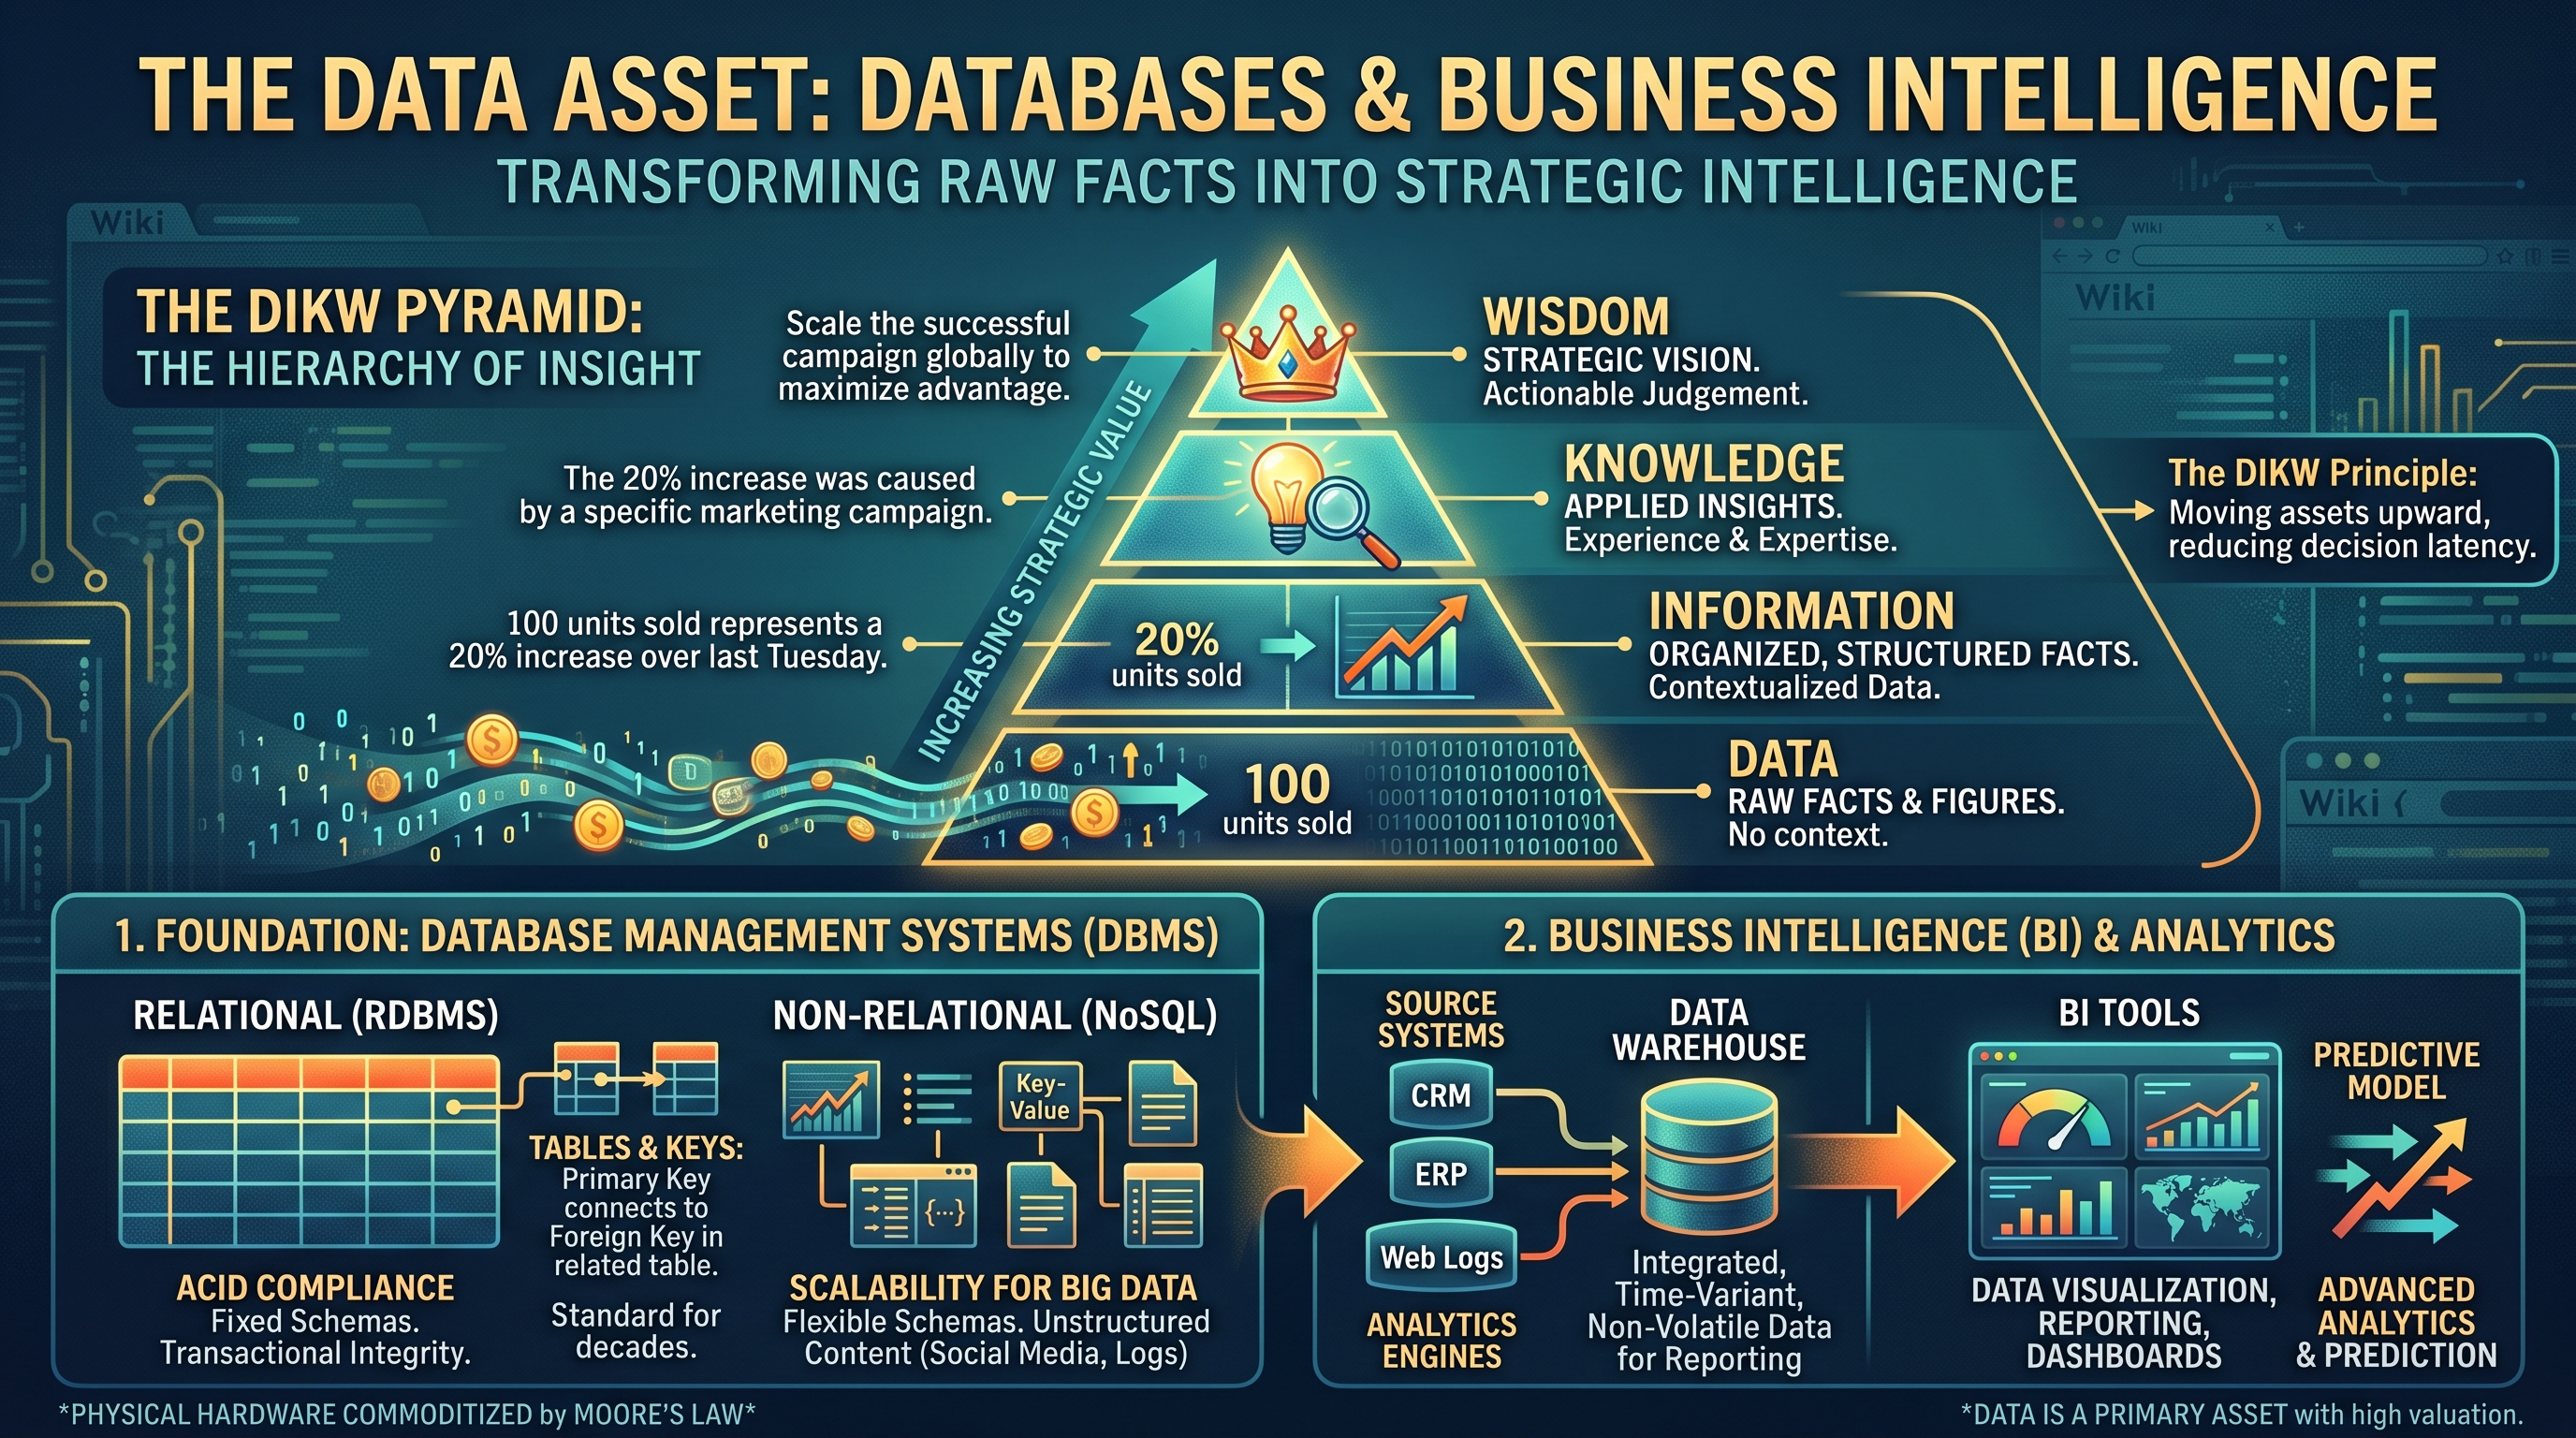
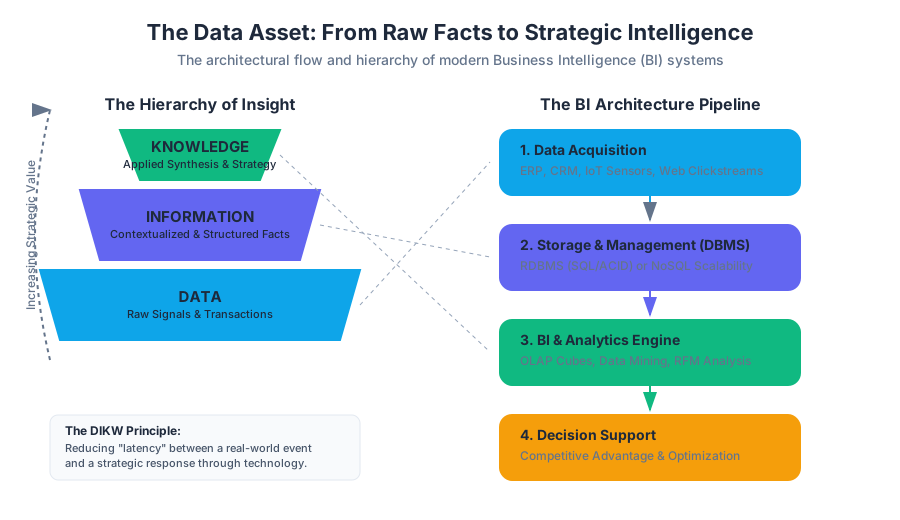
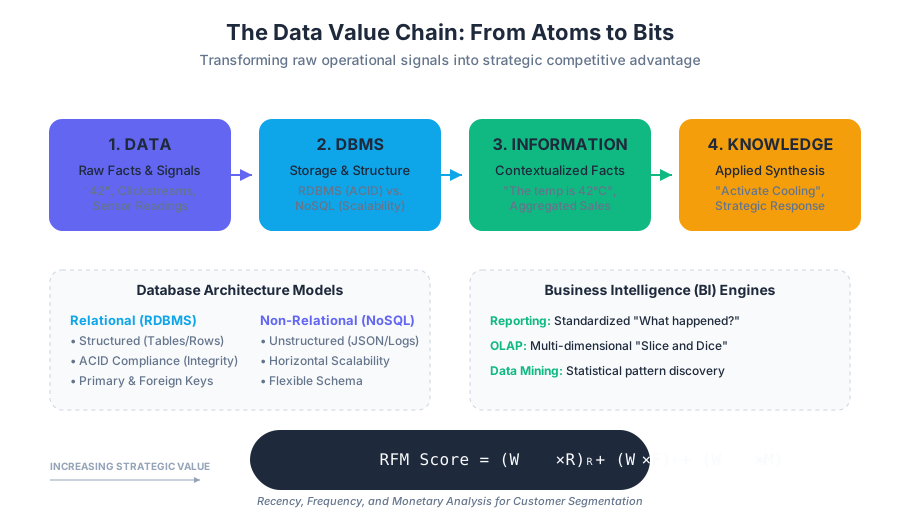
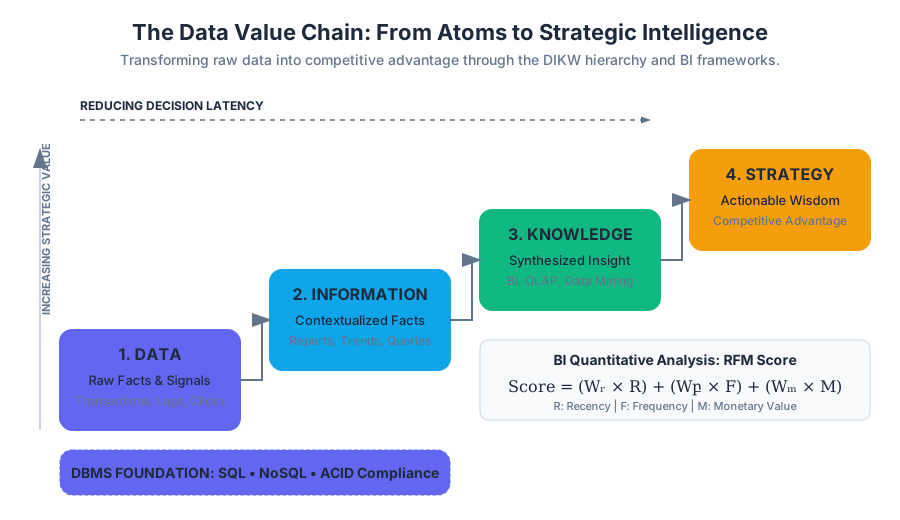
Internet and Telecommunications
Key concepts: Internet Infrastructure · Internet Protocols (TCP/IP) · Last Mile Connectivity · Data Transmission
A foundational guide to how the internet works, including infrastructure, protocols, and the challenges of connectivity.
Internet and Telecommunications: The Global Nervous System
The modern enterprise does not exist in a vacuum; it exists as a node within a global, distributed architecture. To the casual observer, the Internet is a seamless "cloud" of information. To the engineer and the informed manager, it is a complex, multi-layered hierarchy of physical hardware, logical protocols, and economic incentives. Understanding this "plumbing" is critical because every strategic move—from Zara’s real-time inventory updates to Netflix’s transition from "atoms to bits"—is constrained or enabled by the underlying telecommunications infrastructure.
Internet Infrastructure: The Physical Reality
The Internet is often described as a "network of networks." It is not a single entity owned by one organization but a collaborative federation of Internet Service Providers (ISPs), content providers, and backbone operators.
The Backbone and Peering
At the highest level, the Internet consists of Tier-1 ISPs (such as AT&T, Lumen, and Deutsche Telekom). These providers own the massive fiber-optic "highways" that span continents and oceans.
Definition: Peering Peering is a business relationship whereby two networks connect and exchange traffic directly without charging each other. This occurs at Internet Exchange Points (IXPs), which are physical locations where different ISPs connect their routers to facilitate data exchange.
When traffic moves between networks that do not have a peering agreement, they must pay a transit fee to a higher-tier provider. This economic reality dictates how data is routed across the globe; routers are programmed not just for the fastest path, but for the most cost-effective one.
Transmission Media
The speed and reliability of the infrastructure depend on the physical medium used to carry signals.
| Medium | Mechanism | Bandwidth Potential | Latency | Primary Use Case |
|---|---|---|---|---|
| Fiber Optic | Light pulses through glass | Extremely High (Tbps) | Very Low | Backbone, Long-haul, Modern Last Mile |
| Coaxial Cable | Electrical signals over copper | High (Gbps) | Moderate | Cable Internet (DOCSIS) |
| Twisted Pair | Electrical signals over copper | Moderate (Mbps-Gbps) | Moderate | DSL, Ethernet (LAN) |
| Satellite | Radio waves to orbit | Moderate (Mbps) | High (Geosynchronous) / Low (LEO) | Remote areas, Starlink |
| Cellular (5G) | High-frequency radio waves | High (Gbps) | Low | Mobile, IoT, Fixed Wireless |
Protocols: The Language of the Network (TCP/IP)
For disparate hardware to communicate, they must agree on a set of rules, or protocols. The Internet runs on the TCP/IP Protocol Suite, a four-layer model that abstracts the complexity of data transmission.
The TCP/IP Stack
- Application Layer: Where user-facing software lives (HTTP for web, SMTP for email).
- Transport Layer: Handles end-to-end communication, error checking, and flow control (TCP vs. UDP).
- Internet Layer: Handles the addressing and routing of packets (IP).
- Network Access Layer: The physical hardware and data link (Ethernet, Wi-Fi).
TCP vs. UDP: Reliability vs. Speed
The choice between Transmission Control Protocol (TCP) and User Datagram Protocol (UDP) is a fundamental engineering trade-off.
| Feature | TCP (Transmission Control Protocol) | UDP (User Datagram Protocol) |
|---|---|---|
| Connection | Connection-oriented (3-way handshake) | Connectionless (Fire and forget) |
| Reliability | Guaranteed delivery (Retransmission) | No guarantee (Best effort) |
| Ordering | Packets arrive in sequence | Packets may arrive out of order |
| Overhead | High (Header size, acknowledgments) | Low (Minimal header) |
| Use Case | Web browsing, Email, File transfer | Streaming video, Gaming, VoIP |
Low-Level Implementation: The TCP Header
To understand the "cost" of reliability, we look at the structure of a TCP segment in C.
/* Simplified TCP Header Structure */
struct tcp_header {
    uint16_t source_port;       // Source port number
    uint16_t dest_port;         // Destination port number
    uint32_t seq_number;        // Sequence number for reassembly
    uint32_t ack_number;        // Acknowledgment number
    uint8_t  data_offset;       // Size of header
    uint8_t  flags;             // SYN, ACK, FIN, RST, PSH, URG
    uint16_t window_size;       // Flow control: how much data receiver can accept
    uint16_t checksum;          // Error checking
    uint16_t urgent_pointer;    // Urgent data offset
};
IP Addressing and Routing
If TCP is the "envelope" and the "clerk" ensuring delivery, the Internet Protocol (IP) is the "addressing system."
IPv4 vs. IPv6
The world has largely exhausted the 4.3 billion addresses provided by IPv4 (32-bit). This led to the development of IPv6 (128-bit), which provides $2^{128}$ addresses—enough to assign an IP to every atom on the surface of the Earth.
The Routing Algorithm
Routers use the Border Gateway Protocol (BGP) to determine the path a packet should take. This is not a static path; it is dynamic. If a fiber line is cut in the Atlantic, BGP automatically reroutes traffic through the Pacific or across Europe.
Mathematical Foundation: Throughput and Latency
The performance of a network is defined by the relationship between Bandwidth (width of the pipe) and Latency (length of the pipe).
The Bandwidth-Delay Product (BDP) The BDP determines the maximum amount of data that can be "in flight" on the network at any given time. $$BDP = \text{Bandwidth (bits/sec)} \times \text{Round Trip Time (sec)}$$
If a manager upgrades bandwidth but ignores latency (e.g., switching to a high-bandwidth but high-latency satellite link), the perceived performance for interactive applications will not improve.
TCP Congestion Control (AIMD Algorithm)
---------------------------------------
1. Start: cwnd (congestion window) = 1 MSS (Maximum Segment Size)
2. Slow Start: For every ACK received, cwnd = cwnd * 2
3. Congestion Avoidance: If cwnd > ssthresh, cwnd = cwnd + 1 per RTT
4. On Packet Loss:
   - ssthresh = cwnd / 2
   - cwnd = 1 (for Timeout) OR cwnd / 2 (for Triple Duplicate ACK)
The Domain Name System (DNS): The Internet's Phonebook
Humans are poor at remembering IP addresses like 172.217.16.142, but excellent at remembering google.com. DNS is a distributed, hierarchical database that maps human-readable names to IP addresses.
The DNS Hierarchy
- Root Servers: The top of the tree (13 logical sets globally).
- Top-Level Domain (TLD) Servers: Manage
.com,.org,.edu, etc. - Authoritative Name Servers: The final authority for a specific domain (e.g., Zara's own DNS servers).
Real-World Usage: Querying the System
Using the dig command, we can trace the "recursive" nature of a DNS lookup.
# Perform a trace of a DNS lookup to see the hierarchy in action
dig +trace www.netflix.com

# Output Analysis:
# 1. Query sent to Root Servers (.)
# 2. Root refers us to .com TLD servers
# 3. .com TLD refers us to Netflix's authoritative name servers (e.g., ns-123.awsdns.com)
# 4. Authoritative server returns the A record (IP address) or CNAME (Alias)
Last Mile Connectivity: The Bottleneck
The Last Mile refers to the final leg of the network that connects the ISP to the end-user. This is historically the most expensive and slowest part of the Internet infrastructure because it requires physical "trenching" or wiring to individual homes and businesses.
The Technologies of the Last Mile
- DSL (Digital Subscriber Line): Uses existing copper telephone lines. Performance degrades rapidly with distance from the central office.
- Cable (DOCSIS): Uses coaxial cable. Bandwidth is shared among neighbors, leading to slowdowns during "peak hours."
- FTTH (Fiber to the Home): The gold standard. Provides symmetrical speeds (same upload as download) and massive scalability.
- Fixed Wireless / 5G: Bypasses the need for physical wires by using high-frequency radio. Sensitive to "line of sight" obstructions.
| Technology | Typical Download | Typical Upload | Key Constraint |
|---|---|---|---|
| DSL | 5 - 100 Mbps | 1 - 20 Mbps | Distance to CO |
| Cable | 100 - 1000 Mbps | 10 - 50 Mbps | Neighborhood Congestion |
| Fiber | 1000 - 5000 Mbps | 1000 - 5000 Mbps | Infrastructure Cost |
| Starlink | 50 - 200 Mbps | 10 - 30 Mbps | Weather/Obstructions |
Data Transmission Mechanics: How "Bits" Move
Data does not travel as a continuous stream but as discrete packets.
Packet Switching vs. Circuit Switching
- Circuit Switching (Old Phone System): A dedicated physical path is opened between two points for the duration of the call. It is inefficient because if no one speaks, the capacity is wasted.
- Packet Switching (The Internet): Data is chopped into small packets, each containing the destination address. Packets from different users can share the same wire simultaneously (Multiplexing).
The Anatomy of a Request
When a user clicks a link on Netflix, a complex sequence occurs:
- DNS Lookup: Find the IP of the server.
- TCP Handshake: Establish a reliable connection.
- TLS Handshake: Encrypt the connection for security.
- HTTP Request: "GET /movie/12345".
- Packetization: The server breaks the movie file into thousands of packets.
- Routing: Packets travel different paths across the backbone.
- Reassembly: The user's device puts the packets back in order using TCP sequence numbers.
Managerial Implications: Strategic Connectivity
For a manager, these technical details translate into strategic risks and opportunities.
1. The "Atoms to Bits" Transition
Netflix’s success was predicated on the timing of Moore’s Law and the rollout of high-speed Last Mile connectivity. If they had launched streaming in 1998, the infrastructure would have failed them. Managers must assess if the current "plumbing" can support their digital ambitions.
2. Net Neutrality
The principle that all Internet traffic should be treated equally. If ISPs are allowed to create "fast lanes," companies like Netflix or Zara might have to pay extra to ensure their sites load quickly, creating a barrier to entry for smaller competitors.
3. Content Delivery Networks (CDNs)
To bypass the congestion of the public Internet, large firms use CDNs (like Akamai or Cloudflare). By placing servers in IXPs or even inside the ISP’s own data centers, they "shorten" the distance data travels, reducing latency and improving the user experience.
4. The "Death of Distance" Myth
While the Internet makes global communication possible, physical distance still matters. Latency is limited by the speed of light. A financial trading firm in New York will always have an advantage over one in London when trading on the NYSE, simply because the light pulses take ~30ms to cross the Atlantic.
Key Insight: The Fallacy of Infinite Bandwidth Managers often assume that buying more bandwidth solves all problems. However, for real-time applications (Video conferencing, Remote surgery, Cloud gaming), Latency and Jitter (variation in latency) are more critical than raw throughput.
Common Pitfalls and Misconceptions
- Confusing the Internet with the World Wide Web: The Internet is the infrastructure (the tracks); the Web is one application that runs on top of it (the train). Other applications include email, VoIP, and file sharing.
- Ignoring Upload Speeds: Many business processes (Cloud backups, Video broadcasting) require high upload speeds. Most residential "Last Mile" connections are asymmetric, offering 1000Mbps down but only 20Mbps up.
- Overestimating 5G: While 5G offers high speeds, its high-frequency signals (mmWave) cannot penetrate walls or even heavy rain effectively, making it a complement to, rather than a replacement for, fiber.
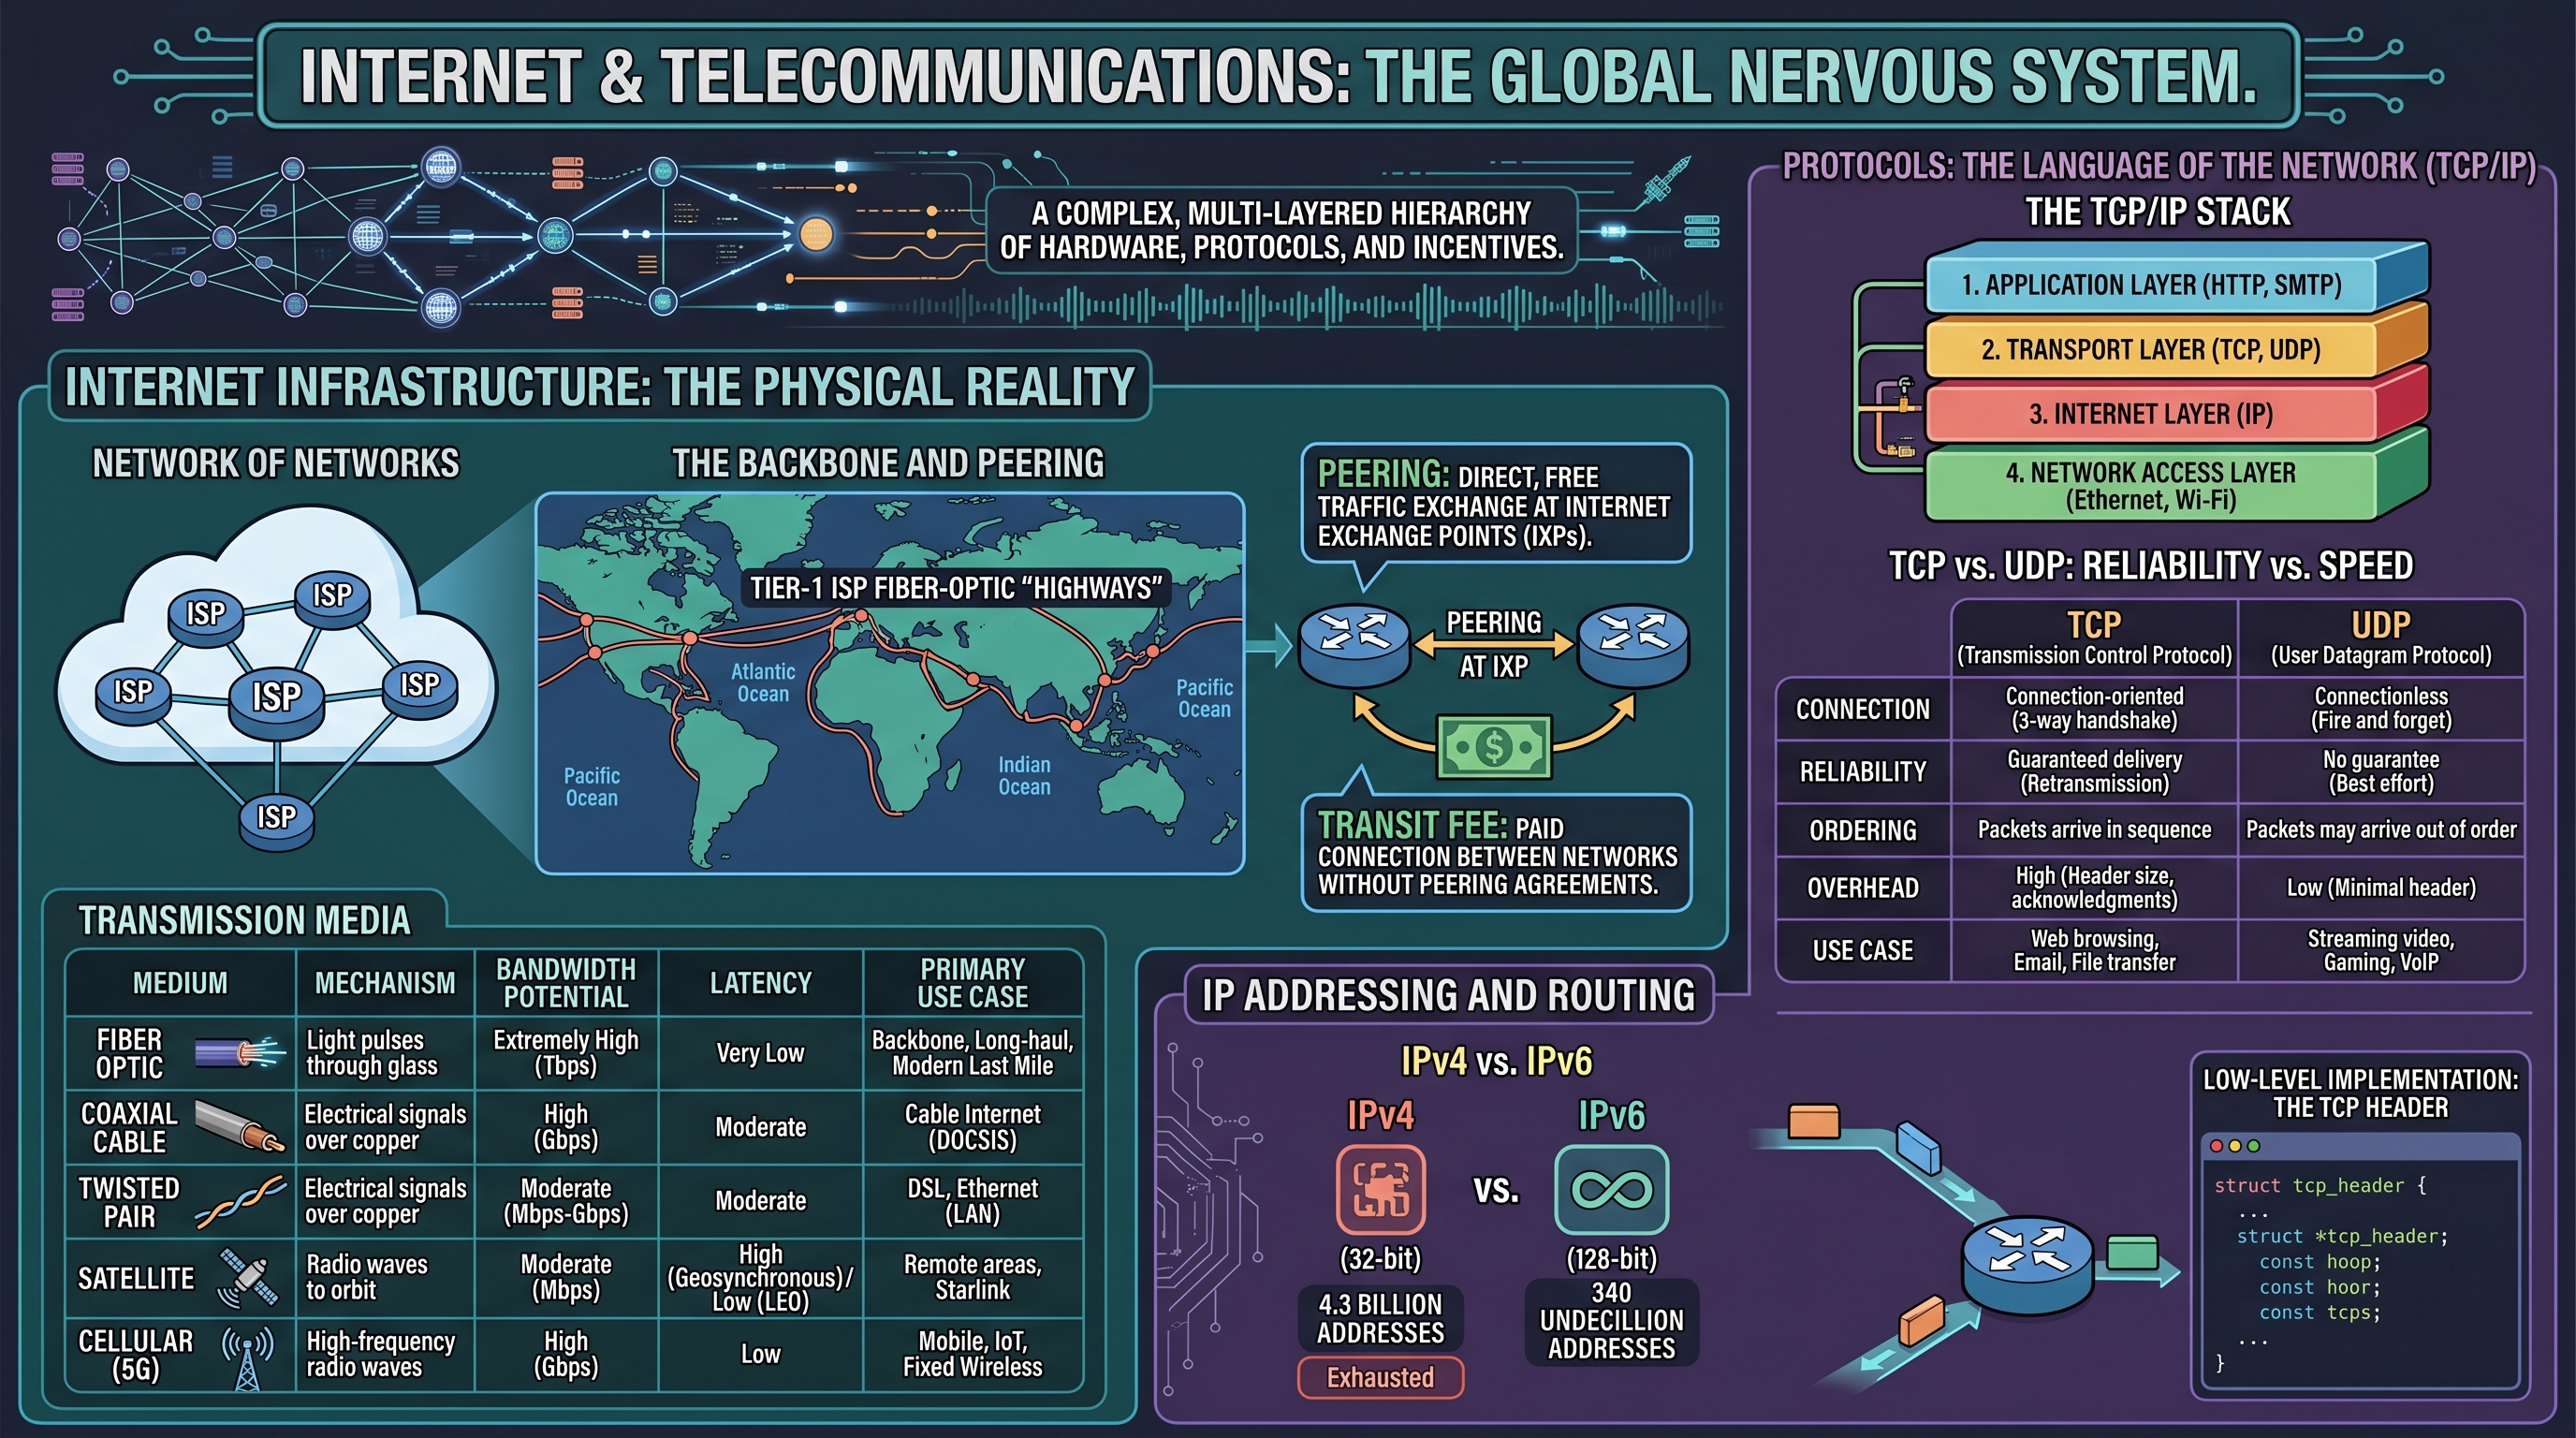
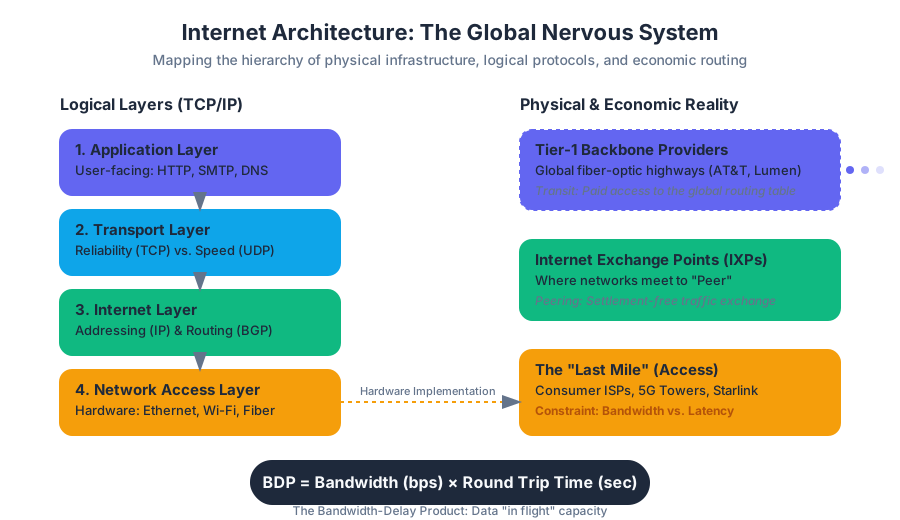
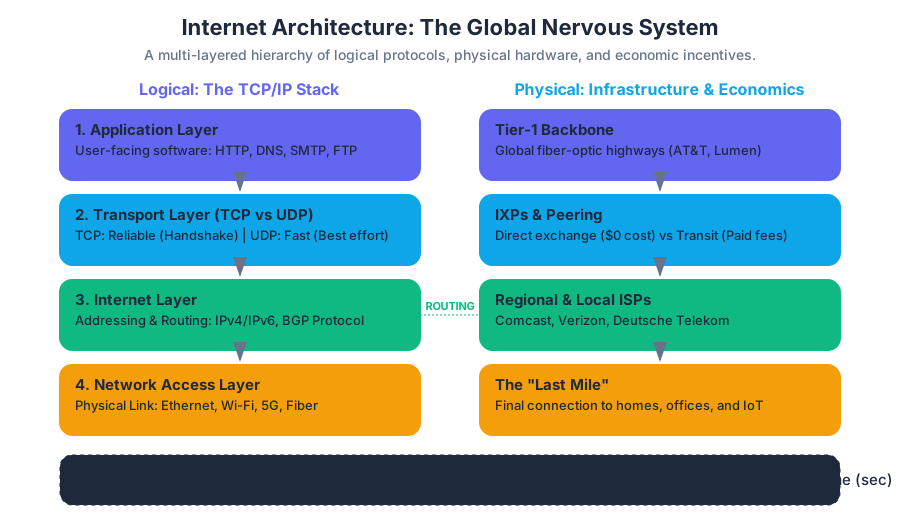
Information Security: Protecting Digital Assets
Key concepts: Cyberattack Motivations · System Vulnerabilities · Risk Management · Security Actors
An exploration of the threat landscape, system vulnerabilities, and strategic frameworks for protecting organizational data.
Information Security: Protecting Digital Assets
Information security (InfoSec) is the practice of protecting information by mitigating information risks. It is a multi-disciplinary field that bridges the gap between low-level technical implementation and high-level strategic management. In the modern enterprise, security is no longer a "siloed" IT function; it is a fundamental business requirement. As organizations transition from "atoms to bits"—shifting physical assets into digital formats—the surface area for potential attacks expands exponentially.
The CIA Triad: The foundational model of information security is built upon three pillars: Confidentiality (ensuring only authorized users access data), Integrity (ensuring data is not altered by unauthorized parties), and Availability (ensuring systems are accessible when needed).
Security Actors: The Human Element of Risk
To defend a system, one must understand the adversary. Security actors are categorized not just by their technical skill, but by their intent, resources, and relationship to the target organization.
Categorizing Threat Actors
The term hacker is often used colloquially to describe anyone who gains unauthorized access to a system. However, within the industry, more precise definitions are used to distinguish between ethical researchers and malicious actors.
| Actor Type | Motivation | Skill Level | Typical Targets |
|---|---|---|---|
| White Hat | Security improvement, bug bounties | High | Systems they are authorized to test |
| Black Hat | Financial gain, malice, personal fame | High | High-value data, financial institutions |
| Grey Hat | Curiosity, "vigilante" justice | Medium to High | Randomly discovered vulnerabilities |
| Script Kiddies | Thrill-seeking, low-level disruption | Low | Unpatched, low-hanging fruit |
| Insiders | Revenge, financial desperation, coercion | Variable | Their own employer's intellectual property |
| State-Sponsored | Geopolitical advantage, espionage | Very High | Critical infrastructure, government secrets |
The Insider Threat
The most dangerous actor is often the Insider. Because they have legitimate access to the network, their malicious activities are harder to detect than external intrusions. Insiders may be disgruntled employees, but they can also be "unintentional" threats—employees who fall victim to Social Engineering or practice poor security hygiene.
Cyberattack Motivations: The "Why" Behind the Breach
Understanding why an attack occurs is critical for risk assessment. If a company knows it holds high-value intellectual property (IP), it can anticipate state-sponsored espionage. If it handles high volumes of credit card data, it should prepare for organized crime.
Primary Drivers of Attacks
- Financial Gain: The most common motivation. This includes direct theft, credit card fraud, and Ransomware—where data is encrypted and held for payment.
- Intellectual Property Theft: Corporate espionage aimed at stealing trade secrets, research, or proprietary algorithms to gain a competitive advantage without the R&D costs.
- Hacktivism: Attacks carried out for political or social reasons. Groups like Anonymous target organizations to protest policies or actions they deem unethical.
- Cyberwarfare: State-sanctioned attacks designed to disrupt the infrastructure of a rival nation, such as power grids, communication networks, or electoral systems.
- Revenge: Often the domain of the disgruntled former employee who seeks to delete data or leak sensitive information to damage the company's reputation.
System Vulnerabilities: Identifying the Weak Links
A vulnerability is a weakness in an information system, system security procedures, internal controls, or implementation that could be exploited by a threat source.
Technical Vulnerabilities
Technical flaws often stem from poor coding practices or architectural oversights. One of the most persistent vulnerabilities is the Buffer Overflow, where a program writes data beyond the boundaries of pre-allocated memory, potentially allowing the execution of malicious code.
/*
 * Example: A classic Buffer Overflow vulnerability in C.
 * This demonstrates how unchecked user input can overwrite the stack.
 */

#include <stdio.h>
#include <string.h>

void vulnerable_function(char *str) {
    char buffer[16]; // A fixed-size buffer

    // DANGER: strcpy does not check the length of the source string.
    // If str is longer than 16 bytes, it will overwrite adjacent memory.
    strcpy(buffer, str);

    printf("Buffer content: %s\n", buffer);
}

int main(int argc, char *argv[]) {
    if (argc > 1) {
        vulnerable_function(argv[1]);
    }
    return 0;
}
The Zero-Day Exploit
A Zero-Day vulnerability is a hole in software that is unknown to the vendor. This is the most "prized" asset for a hacker because no patch exists. The term "zero-day" refers to the fact that the developer has had zero days to fix the problem once the exploit becomes public.
Social Engineering: Hacking the Human
Technology can be patched; humans cannot. Social Engineering involves manipulating individuals into divulging confidential information. Common tactics include:
- Phishing: Sending fraudulent emails that appear to be from a reputable source.
- Spear Phishing: Highly targeted phishing aimed at a specific individual or department.
- Pretexting: Creating a fabricated scenario to steal information (e.g., pretending to be an IT auditor).
- Tailgating: Physically following an authorized person into a secure area.
Risk Management: The Managerial Framework
Security is not about achieving 100% safety—which is impossible—but about managing risk to an acceptable level. This involves a cycle of identification, assessment, and mitigation.
Quantitative Risk Assessment
Managers use formulas to determine where to allocate security budgets. The goal is to ensure the cost of a safeguard does not exceed the value of the asset it protects.
The ALE Formula: $$ALE = SLE \times ARO$$ Where:
- SLE (Single Loss Expectancy): The total loss expected from a single incident (Asset Value $\times$ Exposure Factor).
- ARO (Annualized Rate of Occurrence): How often the incident is expected to happen per year.
- ALE (Annualized Loss Expectancy): The yearly cost of this specific risk.
| Risk Component | Definition | Example |
|---|---|---|
| Asset | What we are protecting | Customer Database |
| Threat | What we are protecting against | SQL Injection Attack |
| Vulnerability | The weakness | Unsanitized input fields |
| Impact | The result of an exploit | Data breach, $5M fine |
| Likelihood | Probability of occurrence | 10% annually |
Risk Response Strategies
Once risks are identified, management must choose a response:
- Mitigation: Implementing controls to reduce the risk (e.g., installing a firewall).
- Transfer: Shifting the risk to a third party (e.g., purchasing cyber insurance).
- Acceptance: Acknowledging the risk but taking no action because the cost of mitigation is too high.
- Avoidance: Changing business practices to eliminate the risk entirely (e.g., not collecting certain types of sensitive data).
Defense in Depth: A Layered Approach
Modern security relies on Defense in Depth, the practice of layering multiple security controls throughout an information system. If one layer fails, others are in place to stop the threat.
The Layers of Defense
- Physical Security: Locks, guards, biometric scanners.
- Network Security: Firewalls, Intrusion Detection Systems (IDS), Virtual Private Networks (VPNs).
- Host Security: Antivirus software, endpoint detection, OS hardening.
- Application Security: Secure coding practices, input validation.
- Data Security: Encryption at rest and in transit.
Access Control and Authentication
Authentication is the process of verifying who a user is. Modern systems use Multi-Factor Authentication (MFA), requiring two or more of the following:
- Something you know: Password, PIN.
- Something you have: Smart card, physical token, smartphone.
- Something you are: Fingerprint, retina scan, facial recognition.
# Example: A Kubernetes Network Policy (Infrastructure as Code)
# This implements "Defense in Depth" by restricting network traffic
# between microservices at the orchestration layer.

apiVersion: networking.k8s.io/v1
kind: NetworkPolicy
metadata:
  name: api-allow-db
  namespace: production
spec:
  podSelector:
    matchLabels:
      app: database
  policyTypes:
  - Ingress
  ingress:
  - from:
    - podSelector:
        matchLabels:
          app: api-server
    ports:
    - protocol: TCP
      port: 5432
# Logic: Only pods labeled 'api-server' can talk to 'database' on port 5432.
# All other traffic to the database is denied by default.
Cryptography: The Mathematical Shield
Cryptography is the science of transforming information to make it unreadable to unauthorized users. It is the core technology behind data privacy.
Symmetric vs. Asymmetric Encryption
- Symmetric Encryption: Uses the same key for both encryption and decryption (e.g., AES). It is fast but requires a secure way to share the key.
- Asymmetric Encryption: Uses a pair of keys—a Public Key for encryption and a Private Key for decryption (e.g., RSA). This solves the key distribution problem.
Hashing
A Hash Function takes an input and produces a fixed-size string of characters, which is typically a "fingerprint" of the data. Hashing is one-way; you cannot derive the original data from the hash. It is used to ensure Integrity.
# Real-world usage: Verifying file integrity and generating keys

# 1. Generate a SHA-256 hash of a sensitive document to ensure integrity
echo "Sensitive Data" > doc.txt
sha256sum doc.txt > doc.txt.sha256

# 2. Generate a 2048-bit RSA Private Key for Asymmetric Encryption
openssl genrsa -out private_key.pem 2048

# 3. Extract the Public Key to share with others
openssl rsa -in private_key.pem -pubout -out public_key.pem

# 4. Encrypt a file using the Public Key
openssl rsautl -encrypt -inkey public_key.pem -pubin -in doc.txt -out doc.txt.enc
Common Pitfalls in Information Security
Even sophisticated organizations fall into common traps that lead to breaches:
- Compliance $\neq$ Security: Just because an organization passes a regulatory audit (like PCI-DSS or HIPAA) does not mean it is secure. Compliance is a baseline, not a ceiling.
- Security by Obscurity: Relying on the secrecy of a system's design as its primary security. If the "secret" is discovered, the system is completely exposed.
- The "Patch Gap": The delay between a vendor releasing a security patch and the organization applying it. Attackers often reverse-engineer patches to find the vulnerability they fix, then attack unpatched systems.
- Over-reliance on Technology: Buying expensive firewalls while neglecting employee training. A $10,000 firewall cannot stop an employee from giving their password to a "help desk" caller.
Conclusion: The Security Mindset
Information security is a continuous process of adaptation. As Moore's Law drives computing power higher, the ability of attackers to crack encryption or brute-force passwords increases. Managers must foster a culture where security is everyone's responsibility. This includes regular training, rigorous policy enforcement, and a "Zero Trust" architecture—where no user or system is trusted by default, even if they are inside the corporate network.
- CIA Triad: Confidentiality, Integrity, Availability.
- Social Engineering: Manipulating people to give up secrets.
- Zero-Day: A vulnerability unknown to the software vendor.
- ALE (Annualized Loss Expectancy): The expected yearly cost of a risk.
- Defense in Depth: Using multiple layers of security controls.
- MFA (Multi-Factor Authentication): Using two or more types of evidence to prove identity.
- Asymmetric Encryption: Using public and private key pairs.
- Insider Threat: A threat originating from within the organization.
- Scenario: An attacker calls a receptionist pretending to be from the IT department and asks for a password reset. What type of attack is this?
- A) SQL Injection
- B) Pretexting (Social Engineering)
- C) Buffer Overflow
- D) Zero-Day Exploit
- Calculation: An asset is worth $100,000. An exploit has an Exposure Factor of 50%. The likelihood of the exploit (ARO) is 0.2 (once every 5 years). What is the ALE?
- A) $10,000
- B) $50,000
- C) $20,000
- D) $5,000
- Concept: Which pillar of the CIA triad is compromised if a website is taken offline by a DDoS attack?
- A) Confidentiality
- B) Integrity
- C) Availability
- Technical: Why is asymmetric encryption preferred over symmetric encryption for communicating with strangers on the internet?
- A) It is much faster.
- B) It doesn't require a pre-shared secret key.
- C) It uses shorter keys.
- D) It is immune to brute-force attacks.
Answers: 1-B, 2-A ($100k \times 0.5 \times 0.2$), 3-C, 4-B.
Study Guide: Information Security Essentials
I. The Threat Landscape
- Distinguish between White, Black, and Grey Hat hackers.
- Understand the unique danger of the Insider Threat.
- Identify the five primary motivations for cyberattacks (Financial, IP Theft, Hacktivism, Warfare, Revenge).
II. Vulnerabilities and Exploits
- Define Vulnerability vs. Threat vs. Risk.
- Explain the lifecycle of a Zero-Day Exploit.
- List common social engineering tactics (Phishing, Tailgating, Pretexting).
III. Risk Management for Managers
- Memorize the ALE = SLE x ARO formula.
- Compare the four risk response strategies: Mitigate, Transfer, Accept, Avoid.
- Understand why Compliance is not the same as Security.
IV. Defensive Architecture
- Explain the concept of Defense in Depth.
- Identify the three factors of Authentication (Knowledge, Possession, Inherence).
- Differentiate between Symmetric and Asymmetric encryption.
V. Strategic Integration
- How does the transition from Atoms to Bits change a firm's risk profile?
- Why is security considered a "management problem" rather than just a "technical problem"?
Google: Search, Online Advertising, and Beyond
Key concepts: Search Engine Mechanics · Online Advertising Growth · Behavioral Targeting · Data Privacy
A deep dive into Google's business model, search engine mechanics, and the complex world of digital advertising.
Google: Search, Online Advertising, and Beyond
Google is not merely a search engine; it is a global information utility that has successfully executed the "Atoms to Bits" transition at a scale previously unimaginable. By transforming the world's information into a searchable, indexed, and monetizable digital format, Google has created a flywheel effect where superior search leads to more data, which leads to better targeting, which ultimately generates the revenue required to subsidize further technological expansion.
Search Engine Mechanics: The Architecture of Discovery
At its core, Google’s search engine is a distributed system designed to solve the problem of information retrieval across a non-homogeneous, rapidly changing web. The process is divided into three distinct phases: Crawling, Indexing, and Ranking.
Crawling and the Inverted Index
Crawling is the process by which automated programs, known as spiders or bots, systematically browse the web to discover new and updated content. These bots follow links from one page to another, fetching the HTML content and sending it back to Google's servers.
Once the data is fetched, it is processed into an Inverted Index. Instead of a list of pages and the words they contain, an inverted index is a mapping of words (tokens) to the locations where they appear.
| Component | Function | Primary Metric |
|---|---|---|
| Googlebot | The crawler that discovers and fetches web pages. | Throughput (pages/sec) |
| Inverted Index | A database mapping terms to their document IDs. | Query Latency |
| Knowledge Graph | A semantic network of entities (people, places, things). | Precision/Recall |
| Caffeine | The continuous indexing system that updates the index in real-time. | Freshness |
The PageRank Algorithm
While Google uses over 200 signals to rank pages, the foundational breakthrough was PageRank. Developed by Larry Page and Sergey Brin, PageRank treats a link from Page A to Page B as a "vote" of confidence. However, not all votes are equal; a link from a highly authoritative site (like the New York Times) carries more weight than a link from an obscure blog.
The mathematical intuition behind PageRank is based on a "random surfer" model. If a user clicks links at random, the PageRank of a page is the probability that the user will end up on that page.
Definition: PageRank Formula The PageRank $PR(u)$ of a page $u$ is given by: $$PR(u) = \frac{1-d}{N} + d \sum_{v \in B_u} \frac{PR(v)}{L(v)}$$ Where $d$ is the damping factor (usually 0.85), $N$ is the total number of pages, $B_u$ is the set of pages linking to $u$, and $L(v)$ is the number of outbound links on page $v$.
import numpy as np

def calculate_pagerank(adjacency_matrix, damping=0.85, epsilon=1e-8):
    """
    A low-level implementation of the PageRank algorithm using NumPy.
    adjacency_matrix: A square matrix where M[i,j] = 1 if page j links to page i.
    """
    n = adjacency_matrix.shape[0]

    # Normalize columns to handle out-degree
    deg_out = np.sum(adjacency_matrix, axis=0)
    # Handle 'sink' nodes (pages with no outbound links)
    adjacency_matrix[:, deg_out == 0] = 1.0 / n
    # Re-normalize
    transition_matrix = adjacency_matrix / np.sum(adjacency_matrix, axis=0)

    # Initial rank vector (uniform distribution)
    rank = np.ones(n) / n

    # Iterative Power Method
    while True:
        new_rank = (1 - damping) / n + damping * np.dot(transition_matrix, rank)
        if np.linalg.norm(new_rank - rank, ord=1) < epsilon:
            return new_rank
        rank = new_rank

# Example: 3 pages where 0->1, 1->2, 2->0, 2->1
adj = np.array([[0, 0, 1], [1, 0, 1], [0, 1, 0]], dtype=float)
print(f"Page Ranks: {calculate_pagerank(adj)}")
Online Advertising: The Economic Engine
Google’s primary revenue source is its sophisticated advertising ecosystem, which bridges the gap between user intent (Search) and commercial offerings. This is managed primarily through two platforms: Google Ads (formerly AdWords) and Google AdSense.
The Generalized Second-Price (GSP) Auction
Unlike traditional advertising where prices are negotiated, Google uses a real-time auction. Specifically, it employs a Generalized Second-Price (GSP) auction. In this model, the winner pays the minimum amount necessary to maintain their position, which is typically the bid of the advertiser immediately below them plus one cent.
However, Google does not rank ads by bid alone. They use a metric called Ad Rank, which incorporates the Quality Score.
Ad Rank = Maximum Bid × Quality Score
The Quality Score is a complex metric influenced by:
- Click-Through Rate (CTR): The historical percentage of users who clicked the ad.
- Relevance: How well the ad matches the user's search query.
- Landing Page Experience: The quality, speed, and safety of the destination website.
ALGORITHM: Ad_Auction_Resolution
INPUT: Set of Advertisers {A1, A2, ... An} with Bids {B1, B2, ... Bn}
       and Quality Scores {Q1, Q2, ... Qn}

1. FOR each Advertiser Ai:
     Calculate AdRank_i = Bi * Qi
2. SORT Advertisers by AdRank descending
3. FOR each Advertiser Ai at Rank Position p:
     IF p is the last position:
       Price_i = Minimum_Reserve_Price
     ELSE:
       # Price is the minimum bid needed to beat the next AdRank
       Price_i = (AdRank_{p+1} / Qi) + 0.01
4. RETURN Sorted_List, Prices
Ad Networks and the Long Tail
While Search ads capture "intent," Google AdSense captures "context." AdSense allows third-party website owners to host Google ads. This creates a massive Ad Network that monetizes the "Long Tail" of the internet—millions of niche websites that would otherwise struggle to find advertisers.
| Feature | Google Ads (Search) | Google AdSense (Display) |
|---|---|---|
| Primary Trigger | User Keywords (Pull) | Page Content (Push) |
| User State | High Intent / Searching | Passive Consumption / Browsing |
| Pricing Model | Primarily CPC (Cost-Per-Click) | CPC or CPM (Cost-Per-Mille) |
| Placement | Google Search Result Pages | Third-party Blogs, News, Apps |
Behavioral Targeting and Data Profiling
To increase the value of its ads, Google employs Behavioral Targeting. This involves tracking user behavior across the web to build a profile of interests, demographics, and purchase intent.
Tracking Mechanisms
- Cookies: Small text files stored in the browser that identify a user across different sessions.
- Tracking Pixels: 1x1 transparent images that notify a server when a page or email is viewed.
- Device Fingerprinting: Collecting browser version, OS, screen resolution, and installed fonts to create a unique ID without relying on cookies.
- Account Linkage: For users logged into a Google account (Gmail, YouTube, Maps), data is unified across devices and services.
The Privacy Sandbox and the Death of Third-Party Cookies
Due to increasing regulatory pressure (GDPR, CCPA) and consumer demand for privacy, Google is transitioning toward the Privacy Sandbox. This initiative aims to replace individual tracking with interest-based cohorts (formerly FLoC, now Topics API), where the browser itself tracks interests and shares them with advertisers without revealing the user's specific identity.
# Example: Inspecting a tracking request via cURL
# This simulates a browser requesting a tracking pixel with a cookie
curl -v -H "Cookie: __utma=12345.67890.1620000000; IDE=AHWqTUm..." \
     -H "User-Agent: Mozilla/5.0 (Windows NT 10.0; Win64; x64)..." \
     "https://googleads.g.doubleclick.net/pagead/viewthroughconversion/123456/"

# Note the 'IDE' cookie, which is often used by DoubleClick (Google)
# for cross-site tracking and ad personalization.
Challenges: Fraud, Ethics, and Competition
The scale of Google's advertising empire makes it a target for various forms of exploitation and scrutiny.
Click Fraud and Impression Fraud
Click Fraud occurs when a person or automated script (bot) clicks on an ad with the intent of depleting an advertiser's budget or generating revenue for the site hosting the ad.
- Enrichment Fraud: Website owners clicking their own ads to increase AdSense payouts.
- Depletion Fraud: Competitors clicking ads to exhaust a rival's daily budget.
Google employs massive machine learning models to detect "invalid traffic" by analyzing IP addresses, click patterns, and mouse movements.
Strategic Challenges and Antitrust
Google faces a classic "Innovator's Dilemma" with the rise of Generative AI. While traditional search provides a list of links (maximizing ad impressions), AI-driven search (like Google's SGE) provides a direct answer, potentially reducing the number of clicks to advertiser sites.
| Risk Category | Description | Mitigation Strategy |
|---|---|---|
| Antitrust | Accusations of monopolistic behavior in search and ad tech. | Regulatory compliance, divestiture of certain units. |
| Ad Blocking | Users installing software to hide ads. | Native advertising, YouTube Premium subscriptions. |
| AI Disruption | LLMs providing answers directly, bypassing the ad-heavy SERP. | Integrating ads into AI responses (SGE). |
| Data Privacy | Stricter laws (GDPR) limiting data collection. | Privacy Sandbox, First-party data focus. |
-- Example: A simplified schema for an Ad Performance Database
CREATE TABLE ad_performance (
    ad_id UUID PRIMARY KEY,
    campaign_id UUID,
    timestamp TIMESTAMP DEFAULT CURRENT_TIMESTAMP,
    impressions INT DEFAULT 0,
    clicks INT DEFAULT 0,
    cost_spent DECIMAL(10, 4),
    conversion_rate FLOAT,
    -- Quality Score components
    ctr_historical FLOAT,
    landing_page_score INT CHECK (landing_page_score BETWEEN 1 AND 10)
);

-- Query to find underperforming ads with high costs
SELECT ad_id, (cost_spent / clicks) AS actual_cpc
FROM ad_performance
WHERE clicks > 100 AND conversion_rate < 0.01
ORDER BY actual_cpc DESC;
Beyond Search: The Ecosystem Strategy
Google’s "Beyond" includes Android, YouTube, Cloud, and Waymo. These are not disparate businesses; they are data and distribution channels for the core advertising engine.
- Android: Ensures Google remains the default search engine on mobile.
- YouTube: The world's second-largest search engine, capturing video-based intent and high-engagement brand advertising.
- Google Cloud: Leverages the massive infrastructure built for Search to compete in the enterprise market.
The transition from "Atoms to Bits" is complete, but the new challenge is the transition from "Search to Synthesis"—moving from a directory of the web to an intelligent agent that acts on the user's behalf.
Source Materials
- 1: Setting the Stage- Technology and the Modern Enterprise
- 11: The Data Asset- Databases, Business Intelligence, and Competitive Advantage
- 1.1: Tech’s Tectonic Shift- Radically Changing Business Landscapes
- 8: Facebook- Building a Business from the Social Graph
- 2: Strategy and Technology- Concepts and Frameworks for Understanding What Separates Winners from Losers
- 4: Netflix- The Making of an E-commerce Giant and the Uncertain Future of Atoms to Bits
- 5: Moore’s Law- Fast, Cheap Computing and What It Means for the Manager
- 7: Peer Production, Social Media, and Web 2.0
- 2.3: Barriers to Entry, Technology, and Timing
- 2.4: Key Framework- The Five Forces of Industry Competitive Advantage
- 6: Understanding Network Effects
- 3: Zara- Fast Fashion from Savvy Systems
Study Information Systems - A Manager's Guide to Harnessing Technology with AI — Free on Lykke
Sign up for free to generate personalized flashcards, quizzes, and study guides from this course. Chat with an AI tutor that knows the material.
Get Started FreeView this course wiki on Lykke · Browse all public course wikis