Computer Applications and Information Technology
Institution: MIT
80 study materials · 12 sections
This course provides a comprehensive exploration of Information Technology (IT) and Computer Applications, focusing on their role in modern business operations. Students will develop practical skills in workplace software like Microsoft Office and Google Suite while gaining a deep understanding of IT hardware, networking, and information systems. The curriculum also addresses critical contemporary issues, including cybersecurity, web accessibility, IT ethics, and the strategic management of data in a globalized society.
Course Sections
Foundations of Information Technology and Systems
Key concepts: Information Technology · Information Systems · Data Manipulation · Digital Literacy · Business Operations
An introduction to the core definitions of IT and Information Systems, exploring how hardware, software, and data integrate to support business operations.
Foundations of Information Technology and Systems
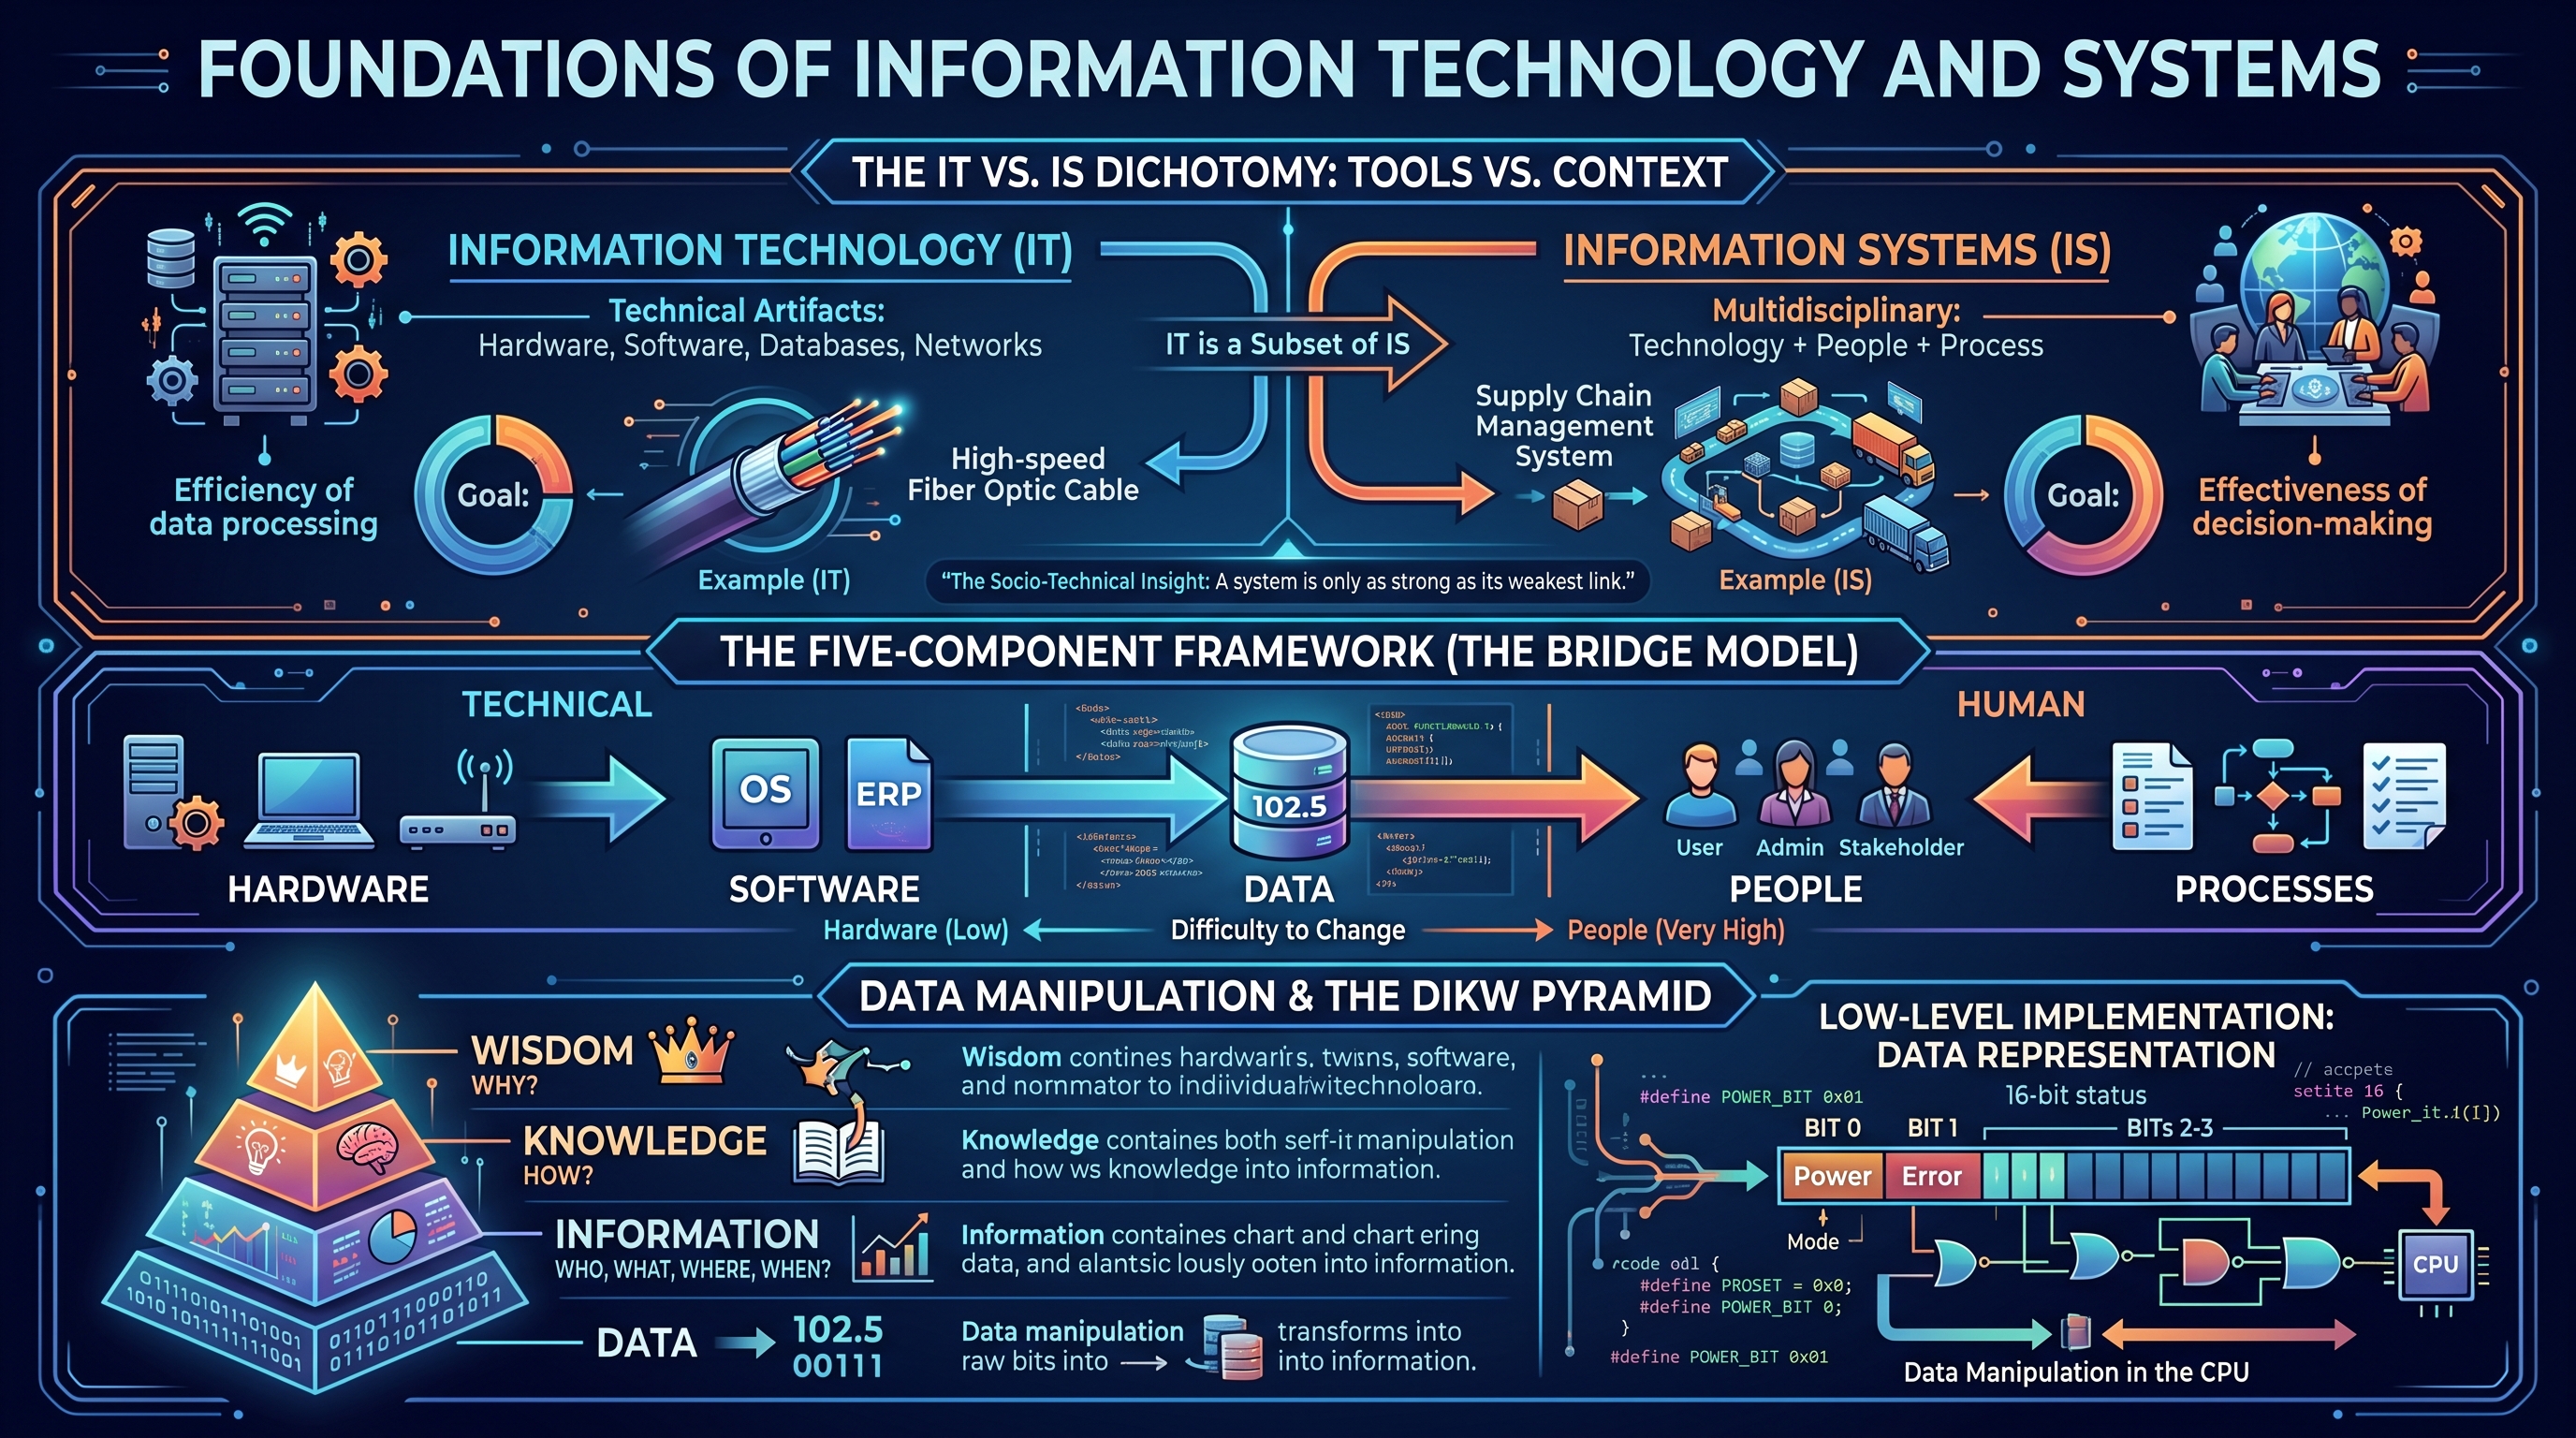
Information Technology (IT) and Information Systems (IS) are the twin engines of the modern global economy. While often used interchangeably in casual conversation, they represent distinct layers of the socio-technical stack. IT refers to the physical and logical tools—the "bricks and mortar" of the digital world—while IS encompasses the broader integration of those tools with people, processes, and data to achieve organizational objectives. Understanding these foundations is not merely an academic exercise; it is a prerequisite for navigating the complexities of digital transformation, cybersecurity, and strategic business management.
The IT vs. IS Dichotomy: Tools vs. Context
To understand the foundations, one must first deconstruct the relationship between Information Technology and Information Systems.
Information Technology (IT) is a subset of Information Systems. it focuses on the technical artifacts: the hardware, software, databases, and networking components that facilitate the storage, retrieval, transmission, and manipulation of data.
Information Systems (IS), conversely, is a multidisciplinary field. It views technology as one component of a larger system that includes human actors and organizational workflows. An information system exists to solve a problem or realize an opportunity within a specific context.
| Feature | Information Technology (IT) | Information Systems (IS) |
|---|---|---|
| Primary Focus | Hardware, software, and networking. | Integration of technology, people, and process. |
| Goal | Efficiency of data processing and transmission. | Effectiveness of organizational decision-making. |
| Components | CPU, RAM, OS, SQL, TCP/IP. | Hardware, Software, Data, People, Processes. |
| Perspective | Technical and engineering-centric. | Strategic and managerial-centric. |
| Example | A high-speed fiber optic cable. | A supply chain management system using that cable. |
The Socio-Technical Insight: An information system is only as strong as its weakest link. A multi-million dollar software suite (IT) will fail to deliver value if the organizational processes are broken or if the people using it lack the necessary digital literacy.
The Five-Component Framework of Information Systems
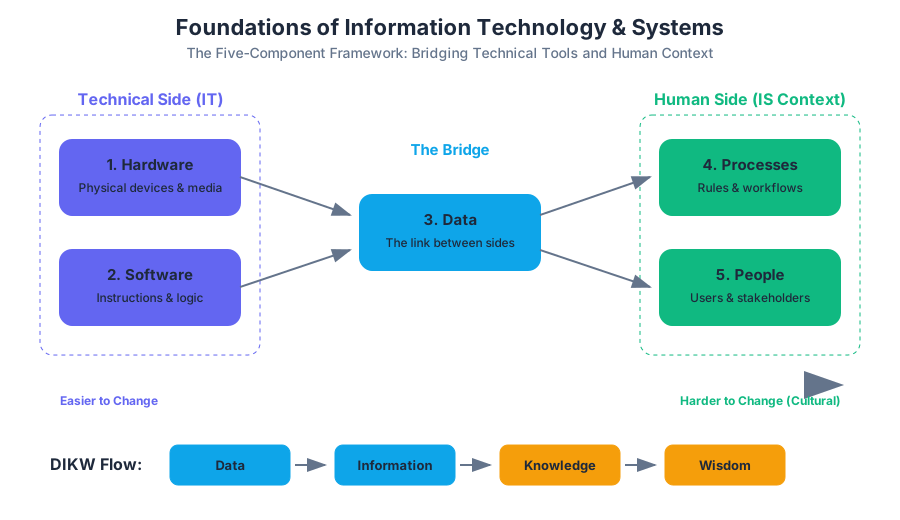
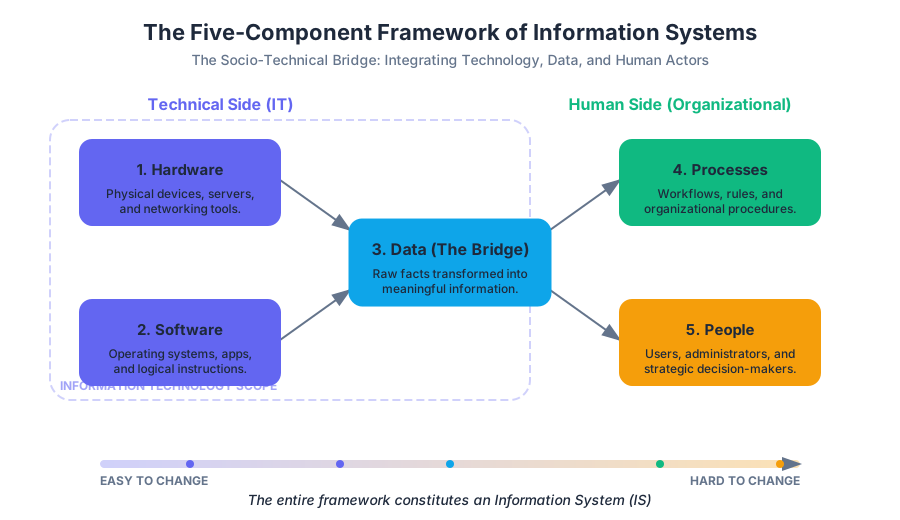
A robust Information System is composed of five interacting components. These components are often categorized into the "Bridge" model, where data serves as the link between the technical side (Hardware/Software) and the human side (People/Processes).
- Hardware: The physical devices (e.g., servers, workstations, mobile devices, routers).
- Software: The instructions that tell the hardware what to do (e.g., Operating Systems, Enterprise Resource Planning (ERP) suites).
- Data: The raw facts and figures that are processed into information.
- People: The most critical component, including users, administrators, and stakeholders.
- Processes: The steps or rules followed to achieve a specific task or outcome.
The Hierarchy of Complexity in IS Components
| Component | Difficulty to Change | Role in the System |
|---|---|---|
| Hardware | Low | Provides the physical substrate for computation. |
| Software | Medium | Defines the logic and capabilities of the system. |
| Data | Medium-High | The "fuel" that provides value and context. |
| Processes | High | The "how" of the organization; requires cultural shifts. |
| People | Very High | The "who"; requires training, buy-in, and literacy. |
Data Manipulation and the DIKW Pyramid
At the heart of IT is Data Manipulation: the process of transforming raw inputs into meaningful outputs. This is best understood through the DIKW Pyramid (Data, Information, Knowledge, Wisdom).
- Data: Discrete, objective facts (e.g., "102.5").
- Information: Data that has been processed to be useful; it answers "who, what, where, when" (e.g., "The patient's temperature is 102.5°F").
- Knowledge: The application of data and information to answer "how" (e.g., "A temperature of 102.5°F indicates a high fever").
- Wisdom: The evaluated understanding of knowledge to answer "why" (e.g., "We should administer antipyretics and monitor for infection").
Low-Level Implementation: Data Representation
At the lowest level, data manipulation occurs in the CPU through bitwise operations. The following C code demonstrates a low-level manipulation of a 16-bit status register, a common task in system-level IT.
#include <stdio.h>
#include <stdint.h>

/**
 * Low-level bit manipulation of a System Status Register.
 * BIT 0: Power (1 = On, 0 = Off)
 * BIT 1: Error (1 = Error present, 0 = OK)
 * BIT 2-3: Mode (00 = Standby, 01 = Active, 10 = Maintenance)
 */

#define POWER_BIT 0x01
#define ERROR_BIT 0x02
#define MODE_MASK 0x0C

void analyze_system_state(uint8_t register_val) {
    // Check Power Status
    if (register_val & POWER_BIT) {
        printf("System Power: ON\n");
    } else {
        printf("System Power: OFF\n");
    }

    // Check Error Flag
    if (register_val & ERROR_BIT) {
        printf("Alert: System Error Detected!\n");
    }

    // Extract Mode using Bit Shifting
    uint8_t mode = (register_val & MODE_MASK) >> 2;
    switch(mode) {
        case 0: printf("Mode: Standby\n"); break;
        case 1: printf("Mode: Active\n"); break;
        case 2: printf("Mode: Maintenance\n"); break;
        default: printf("Mode: Unknown\n");
    }
}

int main() {
    uint8_t status_reg = 0x05; // Binary: 00000101 (Power ON, Mode Standby)
    analyze_system_state(status_reg);
    return 0;
}
Computer Hardware: Architecture vs. Organization
The study of hardware is divided into two distinct but related perspectives: Computer Architecture and Computer Organization.
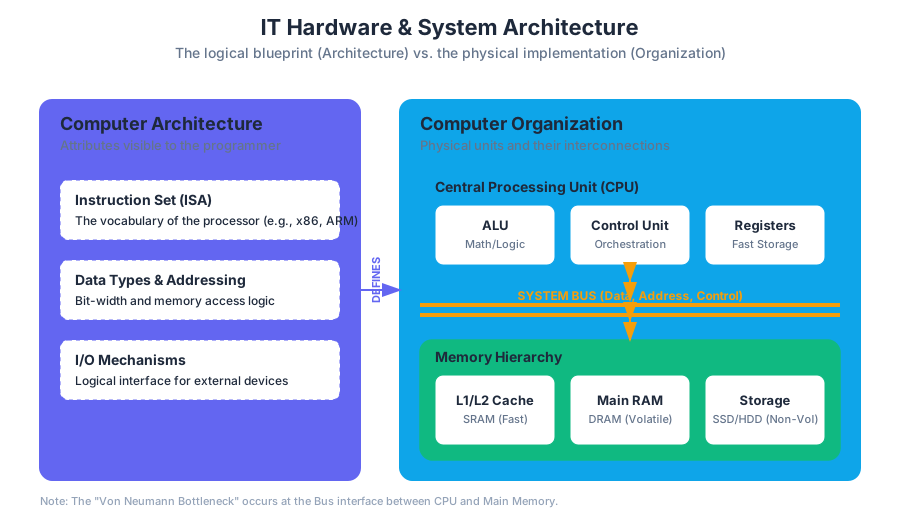
- Computer Architecture refers to the attributes of a system as seen by the programmer. It includes the instruction set, the number of bits used to represent data types, and I/O mechanisms.
- Computer Organization refers to the operational units and their interconnections that realize the architectural specifications. This includes hardware details transparent to the programmer, such as control signals and memory technology.
Internal vs. External Components
Internal components (CPU, RAM, Motherboard) handle the core processing, while external components (peripherals) handle input, output, and long-term storage.
| Component | Type | Function | Key Metric |
|---|---|---|---|
| CPU | Internal | Executes instructions via the Fetch-Decode-Execute cycle. | Clock Speed (GHz), Cores |
| RAM | Internal | Volatile, high-speed temporary storage for active data. | Capacity (GB), Throughput |
| SSD/HDD | Internal/Ext | Non-volatile storage for persistent data. | IOPS, Read/Write Speed |
| GPU | Internal | Specialized processor for parallel tasks (graphics/ML). | CUDA Cores, VRAM |
| NIC | Internal | Network Interface Card for data transmission. | Bandwidth (Gbps) |
Software Ecosystems and System Logic
Software acts as the intermediary between the user and the hardware. It is generally categorized into System Software and Application Software.
- System Software: Includes the Operating System (OS) and utility programs. It manages hardware resources and provides a platform for application software.
- Application Software: Programs designed to perform specific tasks for users (e.g., Microsoft Excel for data analysis, Adobe Photoshop for image editing).
Database Management Systems (DBMS)
A critical subset of software in the IS world is the DBMS. It allows for the structured storage and manipulation of data, ensuring integrity and security.
The following SQL snippet represents a typical schema for an Information System managing employee records and their associated IT assets.
-- Schema for IT Asset Management System
CREATE TABLE Employees (
    EmployeeID INT PRIMARY KEY,
    FullName VARCHAR(100) NOT NULL,
    Department VARCHAR(50),
    AccessLevel INT DEFAULT 1
);

CREATE TABLE HardwareAssets (
    AssetID VARCHAR(20) PRIMARY KEY,
    AssetType ENUM('Laptop', 'Mobile', 'Server', 'Workstation'),
    PurchaseDate DATE,
    AssignedTo INT,
    FOREIGN KEY (AssignedTo) REFERENCES Employees(EmployeeID)
);

-- Query to find all Laptops assigned to the 'Engineering' department
SELECT e.FullName, h.AssetID, h.PurchaseDate
FROM Employees e
JOIN HardwareAssets h ON e.EmployeeID = h.AssignedTo
WHERE e.Department = 'Engineering' AND h.AssetType = 'Laptop';
Digital Literacy and Information Ethics
In the foundational layer of IS, Digital Literacy is the "soft" infrastructure. It is defined as the ability to find, evaluate, and communicate information through various digital platforms. However, modern digital literacy also encompasses Information Literacy—the ability to recognize when information is needed and have the ability to locate, evaluate, and use effectively the needed information.
The Ethical Dimensions of IT
As technology becomes more pervasive, ethical considerations become paramount. Organizations must navigate:
- Privacy: How data is collected and who has access to it.
- Accuracy: Ensuring data integrity and preventing misinformation.
- Property: Intellectual property rights in a digital-copy world.
- Accessibility: Ensuring systems are usable by people with disabilities (Web Accessibility).
The Governance Mandate: IT Governance is the formal framework that provides a structure for organizations to ensure that IT investments support business objectives. It involves the strategic alignment of IT with the business, risk management, and resource management.
Business Operations and Strategic Advantage
The ultimate goal of any Information System in a professional context is to provide a Strategic Advantage. Michael Porter’s Value Chain model illustrates how IS can be applied to primary and support activities to increase margin.
- Inbound Logistics: Using IS for real-time inventory tracking.
- Operations: Automating manufacturing processes via Computer-Integrated Manufacturing (CIM).
- Outbound Logistics: Optimizing delivery routes using GPS and GIS data.
- Marketing and Sales: Utilizing Customer Relationship Management (CRM) software to target specific demographics.
High-Level Data Analysis for Business
Modern business operations rely on Data Analytics to drive decision-making. The following Python example uses the pandas library to perform a typical data manipulation task: analyzing sales data to identify trends.
import pandas as pd

# Load raw sales data (Data component of IS)
data = {
    'Date': ['2023-01-01', '2023-01-01', '2023-01-02', '2023-01-02'],
    'Product': ['Laptop', 'Mouse', 'Laptop', 'Monitor'],
    'Units': [5, 20, 3, 10],
    'Price': [1200, 25, 1200, 300]
}

df = pd.DataFrame(data)

# Data Manipulation: Calculate Total Revenue per row
df['Revenue'] = df['Units'] * df['Price']

# Information Generation: Aggregate revenue by Product
product_performance = df.groupby('Product')['Revenue'].sum().sort_values(ascending=False)

print("Product Performance Report:")
print(product_performance)

# Strategic Insight (Knowledge):
# "Laptops generate 80% of revenue despite lower unit volume than peripherals."
Common Pitfalls in IT and IS Foundations
- The "Silver Bullet" Fallacy: Believing that buying the latest technology (IT) will automatically fix organizational problems (IS).
- Ignoring the Human Factor: Implementing systems without proper training or considering user experience (UX), leading to "shadow IT" where employees use unauthorized tools to get work done.
- Data Silos: Creating systems that don't communicate with each other, leading to inconsistent data and fragmented business operations.
- Underestimating Maintenance: Failing to account for the Total Cost of Ownership (TCO), which includes updates, security patches, and hardware depreciation.
IT Hardware and System Architecture
Key concepts: Computer Hardware · Network Hardware · Computer Architecture · Computer Organization · Internal vs. External Components
A technical look at the physical components of computer systems, including internal architecture and networking hardware.
IT Hardware and System Architecture
The physical substrate of the digital age is not a monolithic entity but a complex, hierarchical arrangement of components designed to transform electrical signals into logic, and logic into information. In the study of Information Technology, Hardware refers to the tangible, physical elements of a computer system, while System Architecture provides the conceptual blueprint that governs how these elements interact. To understand modern computing, one must distinguish between the "what" (Architecture) and the "how" (Organization), while navigating the intricate landscape of internal processing, external interfacing, and network communication.
The Fundamental Dichotomy: Architecture vs. Organization
In professional discourse, the terms "Computer Architecture" and "Computer Organization" are often used interchangeably, yet they represent distinct layers of system design.
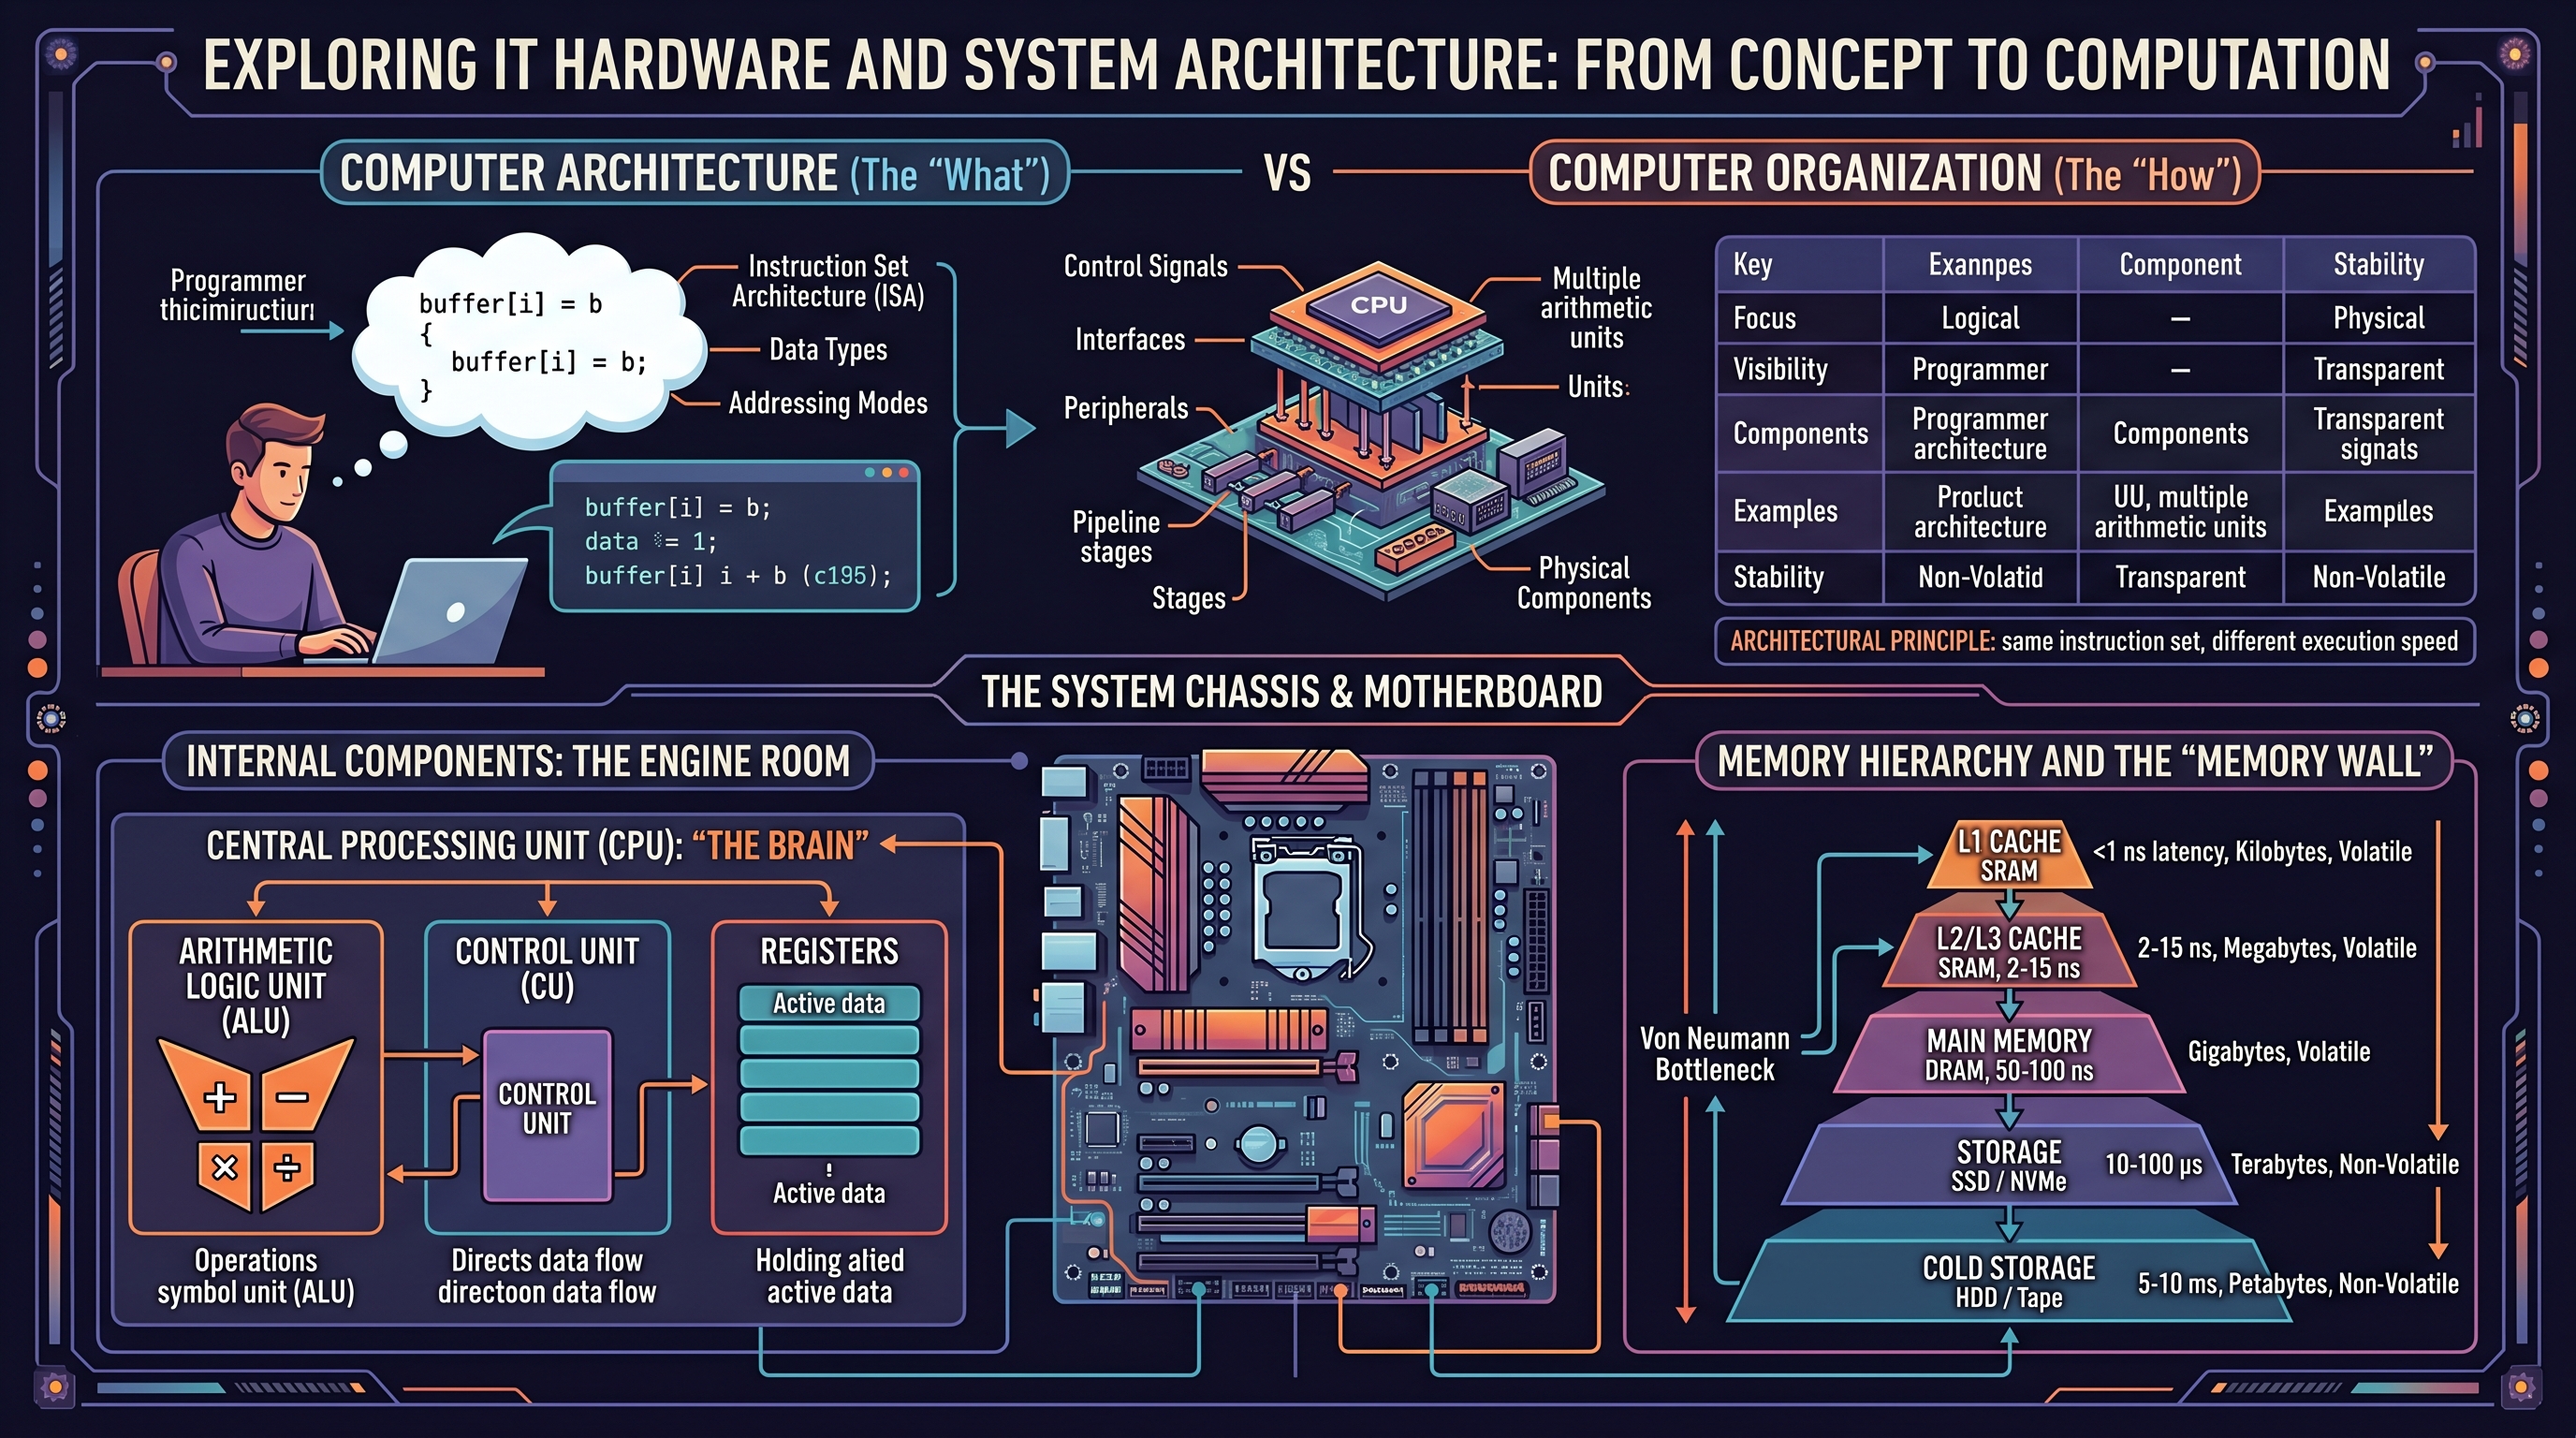
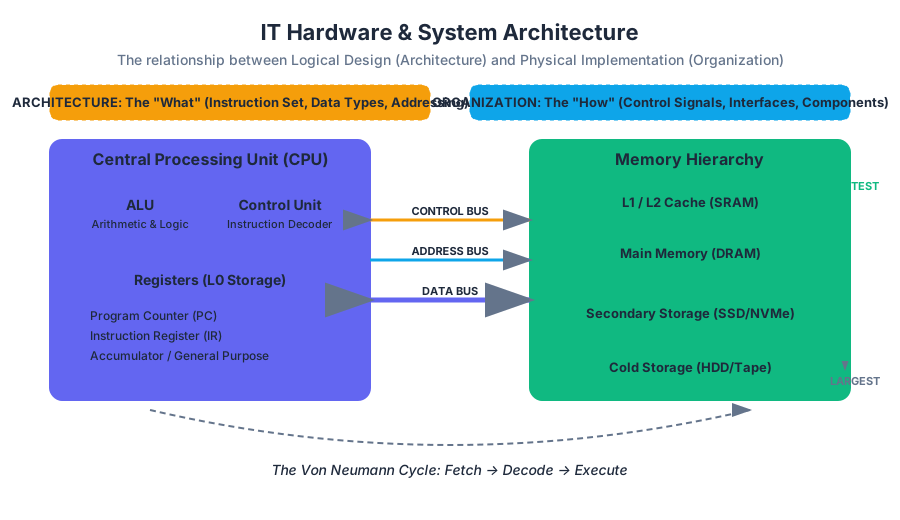
- Computer Architecture refers to those attributes of a system visible to a programmer—or, more specifically, those attributes that have a direct impact on the logical execution of a program. This includes the Instruction Set Architecture (ISA), the number of bits used to represent various data types (e.g., integers, floating points), I/O mechanisms, and techniques for addressing memory.
- Computer Organization refers to the operational units and their interconnections that realize the architectural specifications. It involves hardware details transparent to the programmer, such as control signals, interfaces between the computer and peripherals, and the memory technology used.
The Architectural Principle: If two different computers execute the same instruction set (e.g., x86_64), they share the same architecture, even if one uses a high-speed pipeline and the other uses a simpler, slower organizational structure.
Comparison of Architecture and Organization
| Feature | Computer Architecture (The "What") | Computer Organization (The "How") |
|---|---|---|
| Focus | Logical design and Instruction Set | Physical implementation and hardware |
| Visibility | Visible to the software/programmer | Transparent to the software |
| Components | Data types, Addressing modes, ISA | Control signals, Interfaces, Peripherals |
| Example | Whether a "Multiply" instruction exists | Whether that instruction is implemented by a dedicated multiply unit or by repeated addition |
| Stability | Changes slowly (to maintain compatibility) | Changes rapidly with technology (Moore's Law) |
Internal Components: The Engine Room
The internal components of a computer system are those housed within the main chassis, primarily attached to or integrated with the Motherboard (the system's main printed circuit board). These components facilitate the core "Fetch-Decode-Execute" cycle.
The Central Processing Unit (CPU)
The CPU is the "brain" of the system. It consists of three primary sub-elements:
- Arithmetic Logic Unit (ALU): Performs mathematical (addition, subtraction) and logical (AND, OR, NOT) operations.
- Control Unit (CU): Directs the operation of the processor. It tells the memory, ALU, and I/O devices how to respond to the instructions that have been sent to the processor.
- Registers: High-speed storage locations directly inside the CPU used to hold data currently being processed.
Memory Hierarchy and the "Memory Wall"
Modern systems use a hierarchical approach to memory to balance speed, capacity, and cost. This is necessitated by the Von Neumann Bottleneck, where the CPU's processing speed far outstrips the rate at which data can be fetched from main memory.
| Layer | Type | Speed (Latency) | Capacity | Volatility |
|---|---|---|---|---|
| L1 Cache | SRAM | < 1 ns | Kilobytes | Volatile |
| L2/L3 Cache | SRAM | 2 - 15 ns | Megabytes | Volatile |
| Main Memory | DRAM (RAM) | 50 - 100 ns | Gigabytes | Volatile |
| Storage | SSD / NVMe | 10 - 100 μs | Terabytes | Non-Volatile |
| Cold Storage | HDD / Tape | 5 - 10 ms | Petabytes | Non-Volatile |
Low-Level Hardware Interaction
To see how these internal components interact, consider a C snippet that performs a memory-intensive operation. At the hardware level, this involves moving data from RAM into registers, performing an ALU operation, and writing it back.
/*
 * A low-level look at memory access and pointer arithmetic.
 * This demonstrates how the CPU interacts with specific memory addresses.
 */
#include <stdio.h>
#include <stdint.h>

void process_data(uint32_t *buffer, size_t size) {
    for (size_t i = 0; i < size; i++) {
        // At the hardware level:
        // 1. Load address of buffer[i] into a register
        // 2. Fetch value from RAM/Cache into another register
        // 3. ALU performs the addition
        // 4. Store the result back to the memory address
        buffer[i] = buffer[i] + 0xDEADBEEF;
    }
}

int main() {
    uint32_t data[4] = {1, 2, 3, 4};
    process_data(data, 4);
    return 0;
}
Computer Organization: The Bus and Interconnects
The "glue" that holds the internal components together is the System Bus. A bus is a communication system that transfers data between components inside a computer, or between computers.
- Data Bus: Carries the actual data being processed.
- Address Bus: Carries the information about where the data needs to go (the memory address).
- Control Bus: Carries control signals (read/write commands, clock signals) from the Control Unit.
The Fetch-Execute Cycle Logic
The operation of these buses and the CPU can be represented through the following pseudocode, which simulates the fundamental loop of a computer system:
ALGORITHM FetchExecuteCycle:
    WHILE system_power == ON:
        // 1. FETCH
        MAR <- ProgramCounter              // Move PC to Memory Address Register
        InstructionRegister <- Memory[MAR] // Fetch instruction from memory
        ProgramCounter <- ProgramCounter + 1 // Increment PC for next cycle

        // 2. DECODE
        OpCode, Operands <- Decode(InstructionRegister)

        // 3. EXECUTE
        IF OpCode == ADD:
            Register[A] <- Register[A] + Register[B]
        ELSE IF OpCode == LOAD:
            Register[A] <- Memory[Operands]
        ELSE IF OpCode == STORE:
            Memory[Operands] <- Register[A]

        // 4. CHECK INTERRUPTS
        IF InterruptPending():
            HandleInterrupt()
External Components: Peripherals and I/O
External hardware, or Peripherals, allows the computer to interact with the outside world. These are categorized into Input, Output, and Storage devices.
- Input Devices: Keyboards, mice, scanners, and microphones. They convert physical actions or analog signals into digital data.
- Output Devices: Monitors, printers, and speakers. They convert digital data into human-readable or audible formats.
- External Storage: USB flash drives, external hard drives, and cloud-connected NAS (Network Attached Storage).
Interfacing Standards
The connection between internal and external components is governed by interface standards. These standards ensure that hardware from different manufacturers can communicate.
| Standard | Primary Use | Max Data Rate (Approx) | Key Feature |
|---|---|---|---|
| PCIe 5.0 | Internal GPUs, NVMe | 64 GB/s (x16) | Low latency, point-to-point |
| USB4 | External Peripherals | 40 - 80 Gbps | Universal, power delivery |
| Thunderbolt 4 | High-end Docking/Video | 40 Gbps | Daisy-chaining, PCIe tunneling |
| SATA III | Legacy HDDs/SSDs | 6 Gbps | Mature, widely compatible |
Network Hardware: The Connective Tissue
In the modern IT landscape, a computer is rarely an island. Network Hardware facilitates communication between discrete systems, forming the backbone of the internet and corporate intranets.
Key Networking Devices
- Network Interface Card (NIC): The hardware component (often integrated into the motherboard) that connects a computer to a computer network.
- Switch: A Layer 2 (Data Link) device that connects devices within a Local Area Network (LAN) and uses MAC addresses to forward data to the correct destination.
- Router: A Layer 3 (Network) device that forwards data packets between computer networks, typically connecting a LAN to the Wide Area Network (WAN) or the Internet using IP addresses.
- Access Point (AP): A device that allows wireless devices to connect to a wired network using Wi-Fi.
Real-World Networking Configuration
To manage these hardware components, administrators often use Command Line Interfaces (CLI) to inspect the physical and logical state of the network hardware.
# Inspecting the Network Interface Card (NIC) status on Linux
ip link show

# Viewing the routing table (how the hardware decides where to send packets)
ip route show

# Checking the ARP cache (mapping hardware MAC addresses to IP addresses)
arp -a

# Using ethtool to check physical link speed and duplex mode
sudo ethtool eth0
System Performance and Amdahl's Law
When designing or upgrading IT hardware, engineers must consider the theoretical limits of performance. One of the most critical "laws" in system architecture is Amdahl's Law, which predicts the maximum improvement to an overall system when only a part of the system is improved.
Amdahl's Law: The speedup of a program using multiple processors in parallel computing is limited by the time needed for the sequential fraction of the program.
The formula is expressed as: $$S_{latency}(s) = \frac{1}{(1 - p) + \frac{p}{s}}$$
Where:
- $S_{latency}$ is the theoretical speedup of the whole task.
- $s$ is the speedup of the part of the task that benefits from improved system resources.
- $p$ is the proportion of execution time that the part benefiting from improved resources originally occupied.
Worked Example: If you upgrade a server's CPU to be 10x faster ($s = 10$), but the software spends 40% of its time waiting for the hard drive (a part that wasn't upgraded), then $p = 0.60$ (the 60% of the time spent on the CPU). $$S = \frac{1}{(1 - 0.6) + \frac{0.6}{10}} = \frac{1}{0.4 + 0.06} = \frac{1}{0.46} \approx 2.17$$ Despite a 1000% increase in CPU speed, the total system performance only improves by ~117% because of the hardware bottleneck in the storage system.
Common Pitfalls in Hardware Selection
- Over-provisioning: Buying high-end CPUs for tasks that are I/O bound (e.g., a database server with slow disks).
- Ignoring Thermal Throttling: High-performance internal components generate significant heat. Without adequate cooling, the hardware will intentionally slow down (throttle) to prevent physical damage, nullifying the performance gains of expensive parts.
- Bottleneck Misalignment: Pairing a top-tier GPU with a budget CPU, or a 10Gbps NIC with a Cat5 cable that only supports 100Mbps.
- Volatility Misconceptions: Assuming that data in RAM is safe during a power outage. Only non-volatile storage (SSD/HDD) retains data without power.
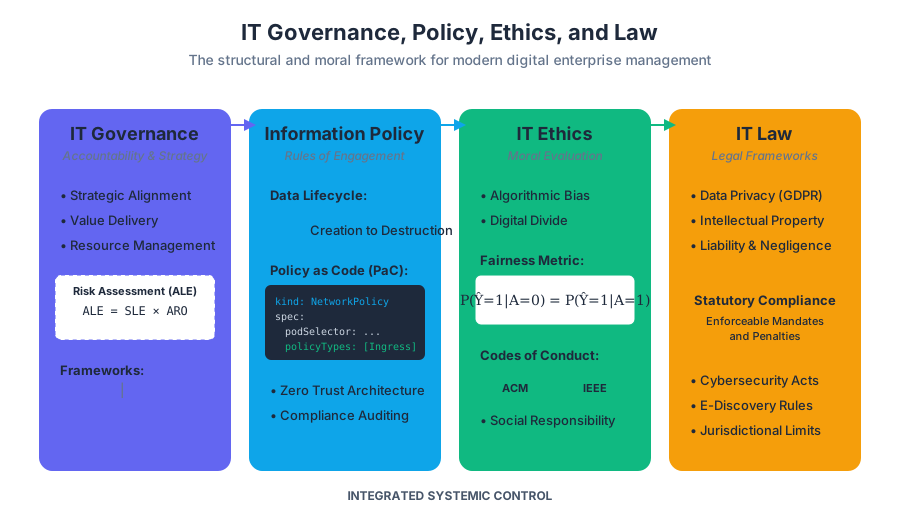
IT Governance, Policy, Ethics, and Law
Key concepts: IT Governance · Information Policy · Ethics in IT · IT Law · Social Implications of IT
An examination of the ethical, legal, and social implications of information technology, focusing on governance and best practices.
IT Governance, Policy, Ethics, and Law
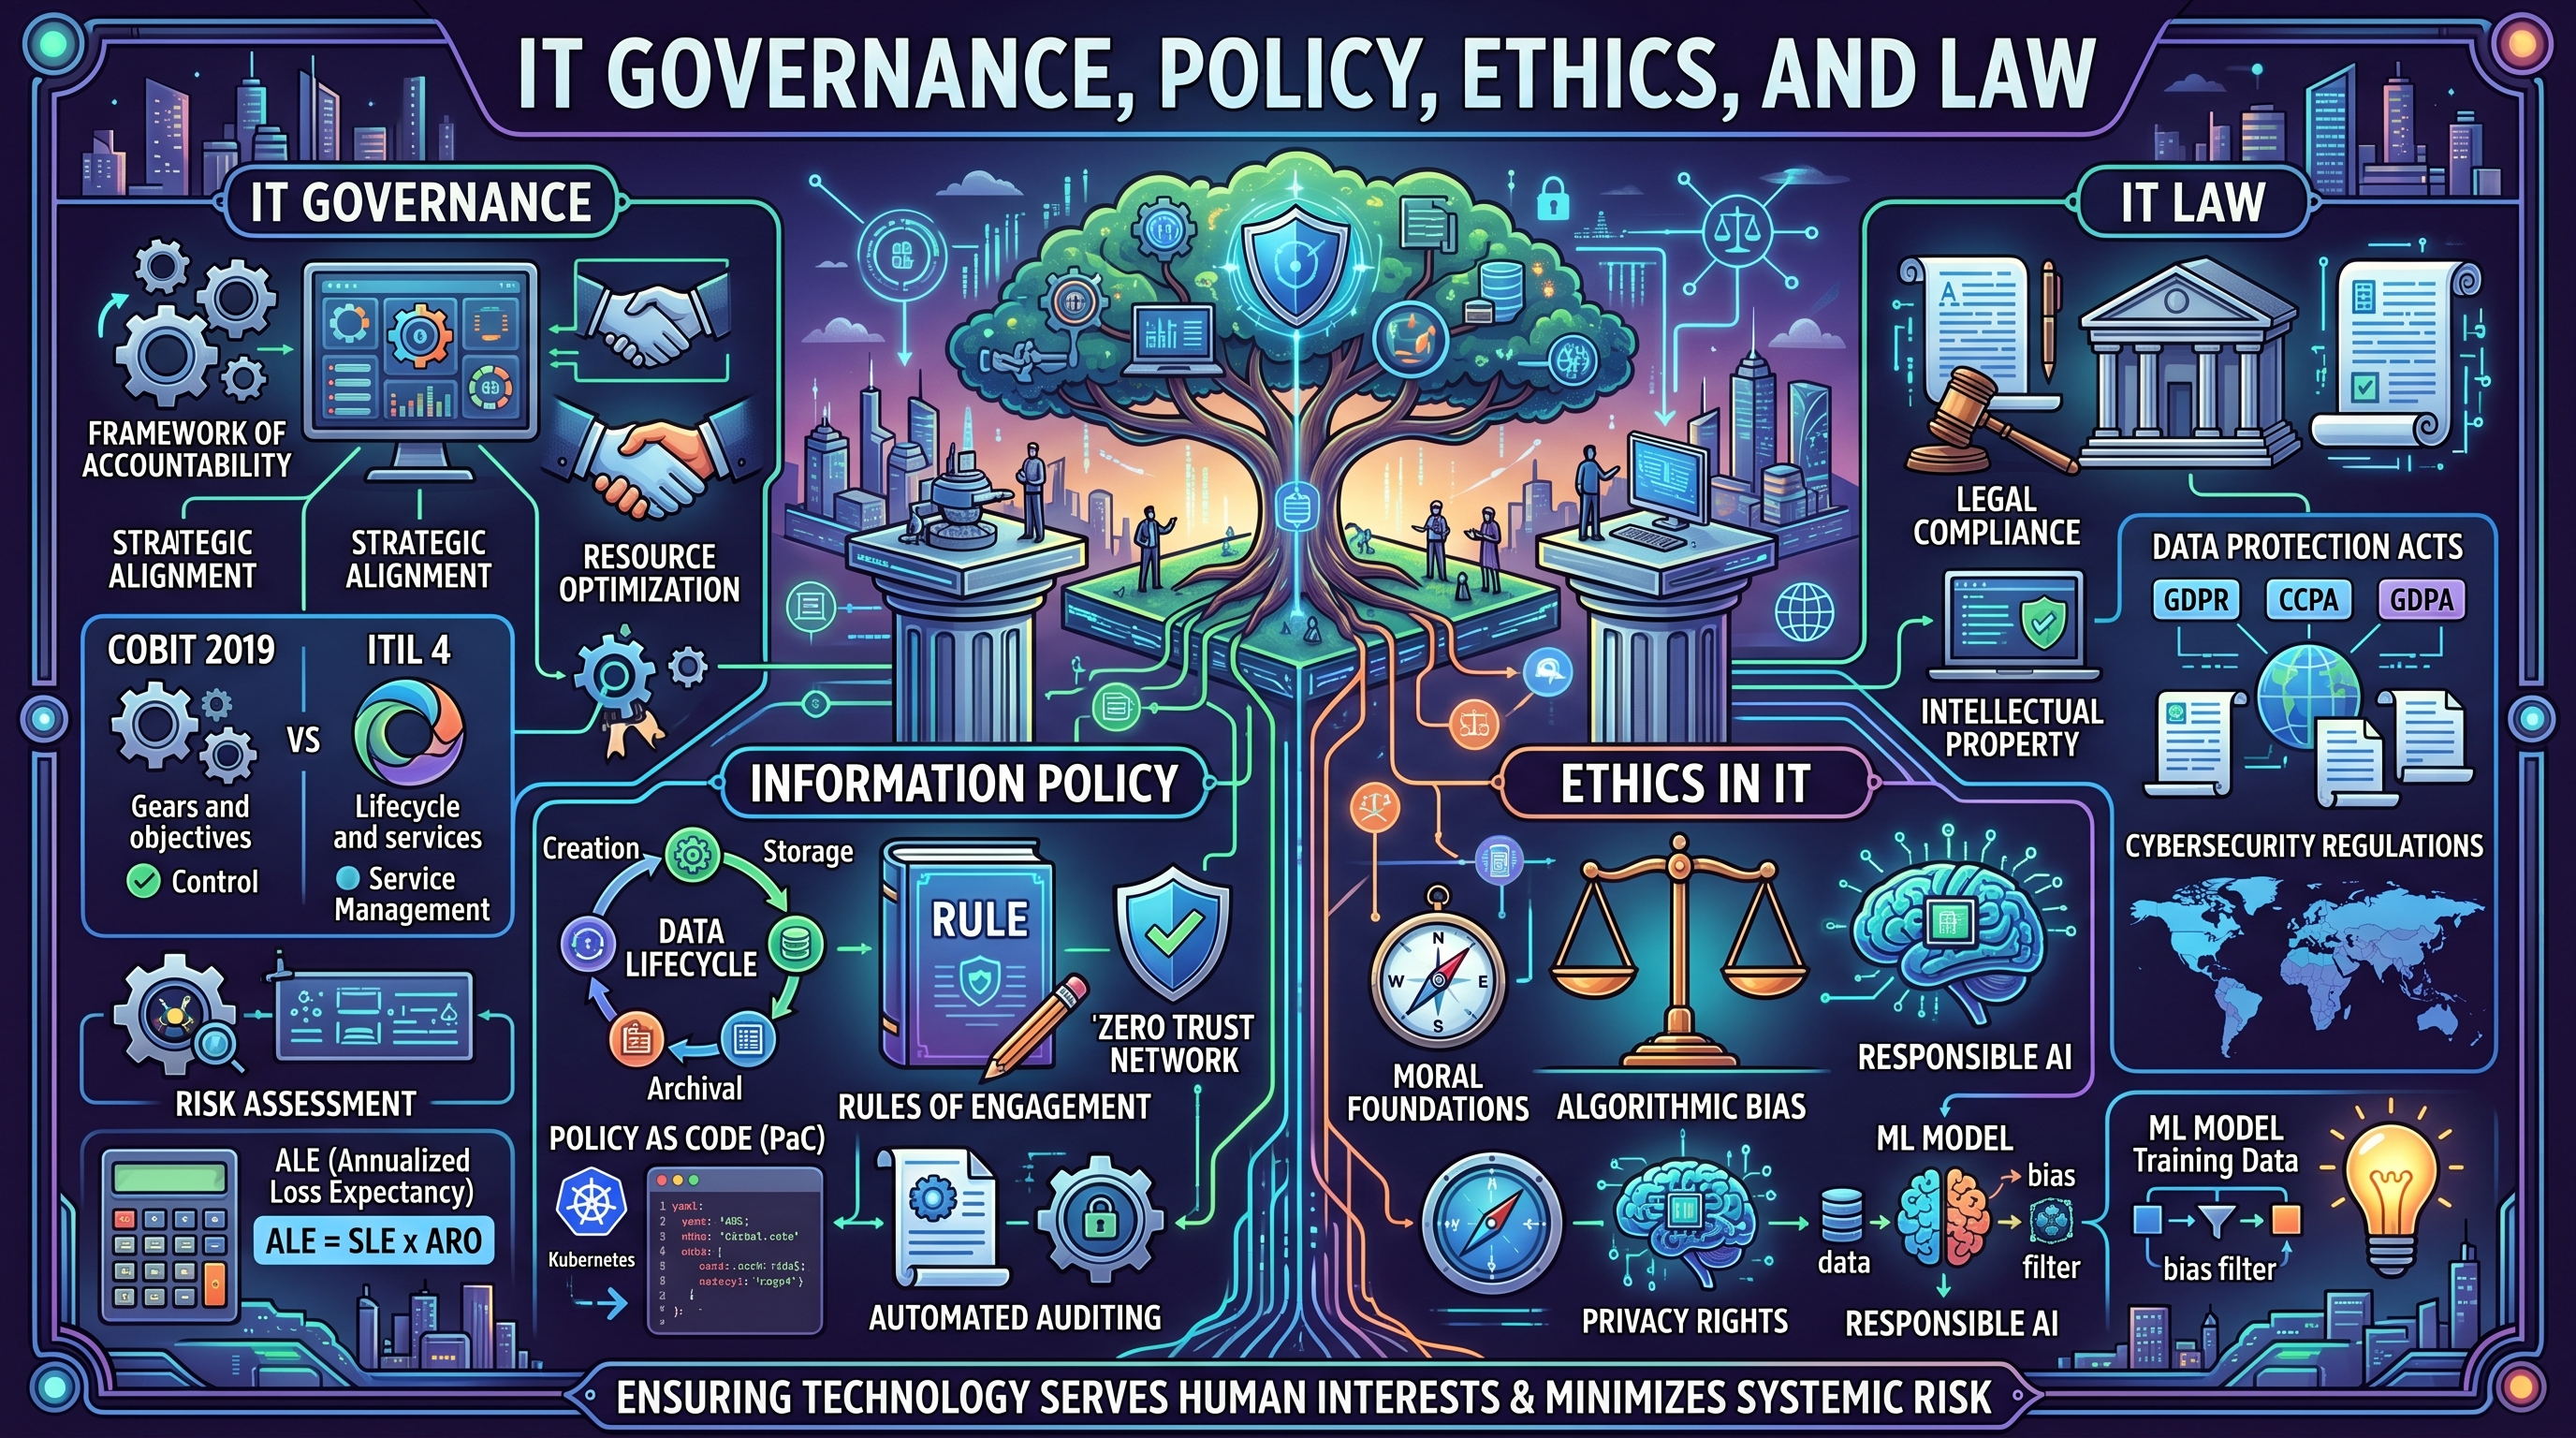
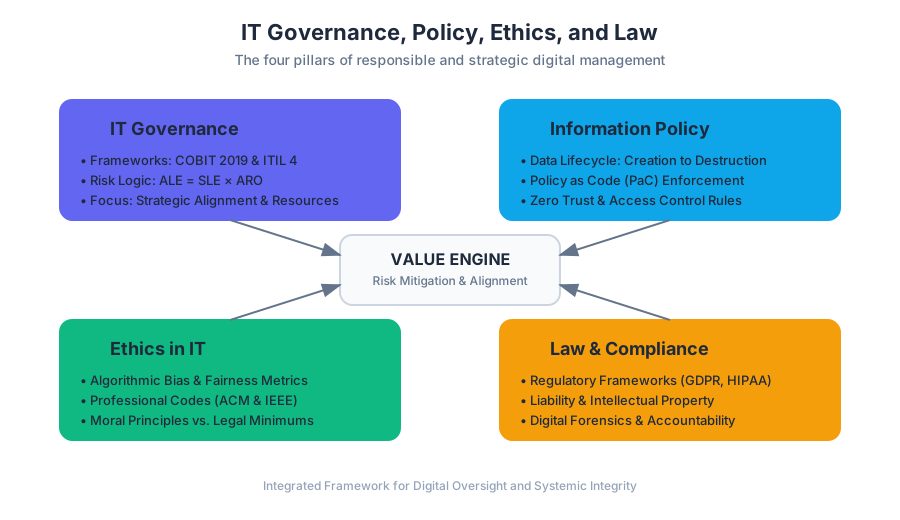
The rapid evolution of Information Technology (IT) has outpaced the development of traditional social and legal frameworks. In the modern enterprise, IT is no longer a support function but the primary engine of value creation. This shift necessitates a robust structure of IT Governance, Information Policy, Ethics, and Law to ensure that technology serves human interests while minimizing systemic risk. This article explores the intersection of these four pillars, providing a technical and philosophical deep-dive into how digital systems are controlled, regulated, and ethically evaluated.
IT Governance: The Framework of Accountability
IT Governance is the formal framework that provides a structure for organizations to ensure that IT investments support business objectives. It is a subset of corporate governance, focused specifically on the performance and risk management of IT systems.
Why It Matters
Without formal governance, organizations suffer from "Shadow IT," misaligned priorities, and catastrophic security failures. Governance ensures Strategic Alignment, Value Delivery, Resource Management, and Risk Mitigation.
Core Frameworks: COBIT vs. ITIL
Two primary frameworks dominate the landscape: COBIT (Control Objectives for Information and Related Technologies) and ITIL (Information Technology Infrastructure Library).
| Feature | COBIT 2019 | ITIL 4 |
|---|---|---|
| Primary Focus | Governance and Management Objectives | Service Management and Lifecycle |
| Orientation | Top-down, business-centric | Bottom-up, process-centric |
| Key Metric | Compliance and Risk Control | Service Value System (SVS) |
| Scope | Enterprise-wide IT control | IT Service delivery and support |
| Audience | Board of Directors, Auditors | IT Managers, Service Desk |
Implementing Governance: Risk Assessment Logic
A core component of governance is the quantitative assessment of risk. This involves calculating the Annualized Loss Expectancy (ALE) to justify security spending.
# Low-level implementation of a Quantitative Risk Assessment Engine
# This script calculates the financial impact of potential IT threats.

class RiskAssessment:
    def __init__(self, asset_value, exposure_factor, annualized_rate_of_occurrence):
        self.av = asset_value  # Total value of the IT asset
        self.ef = exposure_factor  # Percentage of loss if threat occurs (0.0 to 1.0)
        self.aro = annualized_rate_of_occurrence  # How many times per year

    def calculate_sle(self):
        """Single Loss Expectancy (SLE) = AV * EF"""
        return self.av * self.ef

    def calculate_ale(self):
        """Annualized Loss Expectancy (ALE) = SLE * ARO"""
        return self.calculate_sle() * self.aro

# Example: A database server worth $500,000.
# A data breach (EF=0.20) happens once every 2 years (ARO=0.5).
db_risk = RiskAssessment(asset_value=500000, exposure_factor=0.20, annualized_rate_of_occurrence=0.5)

print(f"Single Loss Expectancy: ${db_risk.calculate_sle():,.2f}")
print(f"Annualized Loss Expectancy: ${db_risk.calculate_ale():,.2f}")
# If the cost of a firewall is < $50,000/year, it is a sound governance investment.
Information Policy: The Rules of Engagement
Information Policy consists of the formal set of rules governing the lifecycle of information—from creation and storage to dissemination and destruction. It translates high-level governance goals into actionable requirements.
The Data Lifecycle and Policy Mapping
Policies must address every stage of the data lifecycle to ensure integrity and availability.
- Creation/Capture: Who is authorized to generate data?
- Storage: What encryption standards (e.g., AES-256) are required?
- Usage: Can data be used for secondary purposes (e.g., training ML models)?
- Archival: How long must data be kept for legal compliance?
- Destruction: How is data cryptographically erased?
Policy as Code (PaC)
In modern DevOps environments, policies are no longer just PDFs; they are enforced via configuration files.
# Example: Kubernetes Network Policy (Policy as Code)
# This enforces a "Zero Trust" architecture by denying all ingress
# except from specific authorized microservices.

apiVersion: networking.k8s.io/v1
kind: NetworkPolicy
metadata:
  name: restrict-database-access
  namespace: production
spec:
  podSelector:
    matchLabels:
      app: postgres-db
  policyTypes:
  - Ingress
  ingress:
  - from:
    - podSelector:
        matchLabels:
          role: api-backend
    ports:
    - protocol: TCP
      port: 5432
Key Insight: A policy is only as effective as its enforcement mechanism. Without automated auditing, policies suffer from "compliance drift."
Ethics in IT: Navigating Moral Complexity
Ethics in IT involves the application of moral principles to the design and use of technology. Unlike law, which defines what is legal, ethics defines what is right.
The Digital Divide and Algorithmic Bias
Two major ethical concerns in the 21st century are the Digital Divide (inequity in access to technology) and Algorithmic Bias (systemic unfairness in automated decision-making).
Mathematical Formalization of Fairness
In Machine Learning, ethics can be quantified through metrics like Demographic Parity or Equalized Odds.
$$ P(\hat{Y}=1 | A=0) = P(\hat{Y}=1 | A=1) $$
Where:
- $\hat{Y}=1$ is the positive outcome (e.g., getting a loan).
- $A$ is a protected attribute (e.g., race or gender).
- The equation represents the goal where the probability of a positive outcome is equal across different groups.
Professional Codes of Conduct
Organizations like the ACM (Association for Computing Machinery) and IEEE provide ethical guidelines for engineers. These codes emphasize:
- Public Interest: The well-being of the public is the primary consideration.
- Integrity: Avoiding conflicts of interest and being honest about system limitations.
- Privacy: Respecting the autonomy of individuals regarding their data.
IT Law: The Legal Landscape
IT Law (or Cyberlaw) is the collection of statutes and precedents that govern digital activities. It is inherently complex because the internet is borderless, while laws are jurisdictional.
Major Regulatory Frameworks
The legal burden on IT departments has increased significantly with the rise of data protection acts.
| Regulation | Jurisdiction | Focus | Key Requirement |
|---|---|---|---|
| GDPR | European Union | Data Privacy | "Right to be Forgotten," Consent, Data Portability |
| HIPAA | United States | Healthcare | Protection of PHI (Protected Health Information) |
| CCPA | California, USA | Consumer Privacy | Opt-out of data sales, transparency |
| DMCA | United States | Intellectual Property | Takedown notices for copyrighted content |
| PCI-DSS | Global (Industry) | Credit Cards | Security standards for payment processing |
Implementing Compliance: The "Right to be Forgotten"
Under GDPR Article 17, users have the right to request the erasure of their personal data. Implementing this requires precise database operations to ensure data is removed from all relational tables and backups.
-- Real-world example: GDPR Data Deletion Procedure
-- This script ensures a user's PII is removed while maintaining
-- referential integrity for non-identifiable transaction records.

BEGIN;

-- 1. Identify the user
SET @target_user_id = 98765;

-- 2. Anonymize transaction history (keep for financial auditing)
UPDATE transactions
SET user_email = 'ANONYMIZED',
    billing_address = NULL
WHERE user_id = @target_user_id;

-- 3. Delete sensitive profile data
DELETE FROM user_profiles WHERE user_id = @target_user_id;

-- 4. Remove from marketing lists
DELETE FROM newsletter_subs WHERE email = (SELECT email FROM users WHERE id = @target_user_id);

-- 5. Finally, remove the core user record
DELETE FROM users WHERE id = @target_user_id;

COMMIT;
Social Implications of IT
The deployment of IT systems has profound effects on the structure of society.
1. Automation and the Future of Work
As AI and robotics advance, the "Social Implications" include the displacement of routine labor. However, history suggests technology creates new categories of work (e.g., Prompt Engineers, Data Labelers).
2. Surveillance Capitalism
The business model of "free" services in exchange for behavioral data has created a society of constant surveillance. This raises questions about Informed Consent—do users truly understand the value of the data they are trading?
3. Globalization and Regulatory Arbitrage
Companies often move data or operations to "data havens"—countries with weak privacy or labor laws. This creates a "race to the bottom" that IT Governance must address through ethical sourcing and vendor management.
Common Pitfalls in IT Governance and Ethics
- The "Check-Box" Compliance Trap: Thinking that being legal means being ethical. An action can be 100% compliant with the law but still cause significant social harm.
- Technological Determinism: The belief that technology's path is inevitable. Governance exists precisely to steer technology toward desired social outcomes.
- Ignoring Technical Debt: Poor governance often leads to "quick fixes" that accumulate technical debt, eventually leading to system failure or security breaches.
- Vague Policies: Policies that use non-specific language (e.g., "users should be careful") are unenforceable. Policies must be specific, measurable, and achievable.
Workplace Software and Digital Literacy
Key concepts: Microsoft Office Suite · Google Suite · Windows Desktop Management · File Hierarchy · Internet Security
Developing proficiency in essential workplace tools, including Microsoft Office, Google Suite, and operating system management.
Workplace Software and Digital Literacy
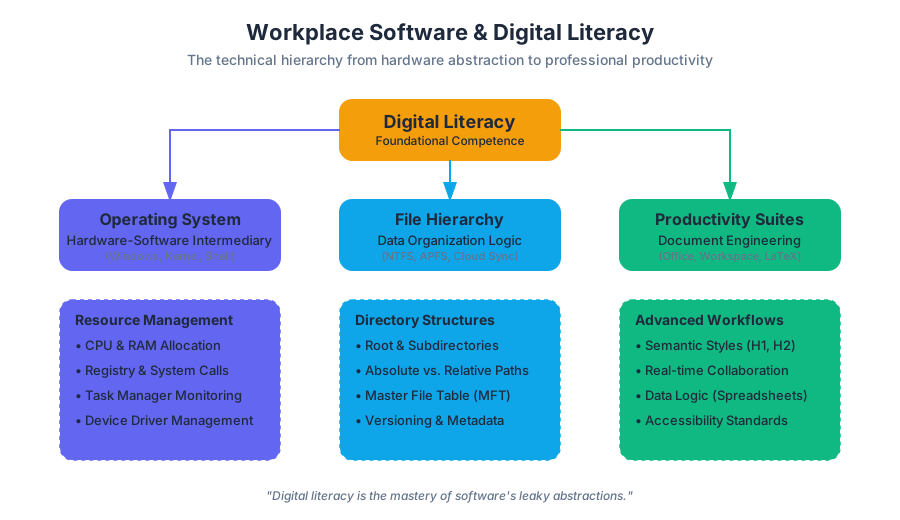
Digital literacy is the foundational competence required to navigate, evaluate, and create information using a wide range of digital technologies. In the modern professional landscape, this transcends the mere ability to "use a computer." It involves a deep understanding of the abstraction layers between hardware and software, the cognitive logic of data organization, and the ethical implications of digital communication. This article explores the technical and theoretical underpinnings of workplace software, ranging from operating system management to the sophisticated logic of productivity suites and the imperatives of cybersecurity.
The Operating System: Windows Desktop and Resource Management
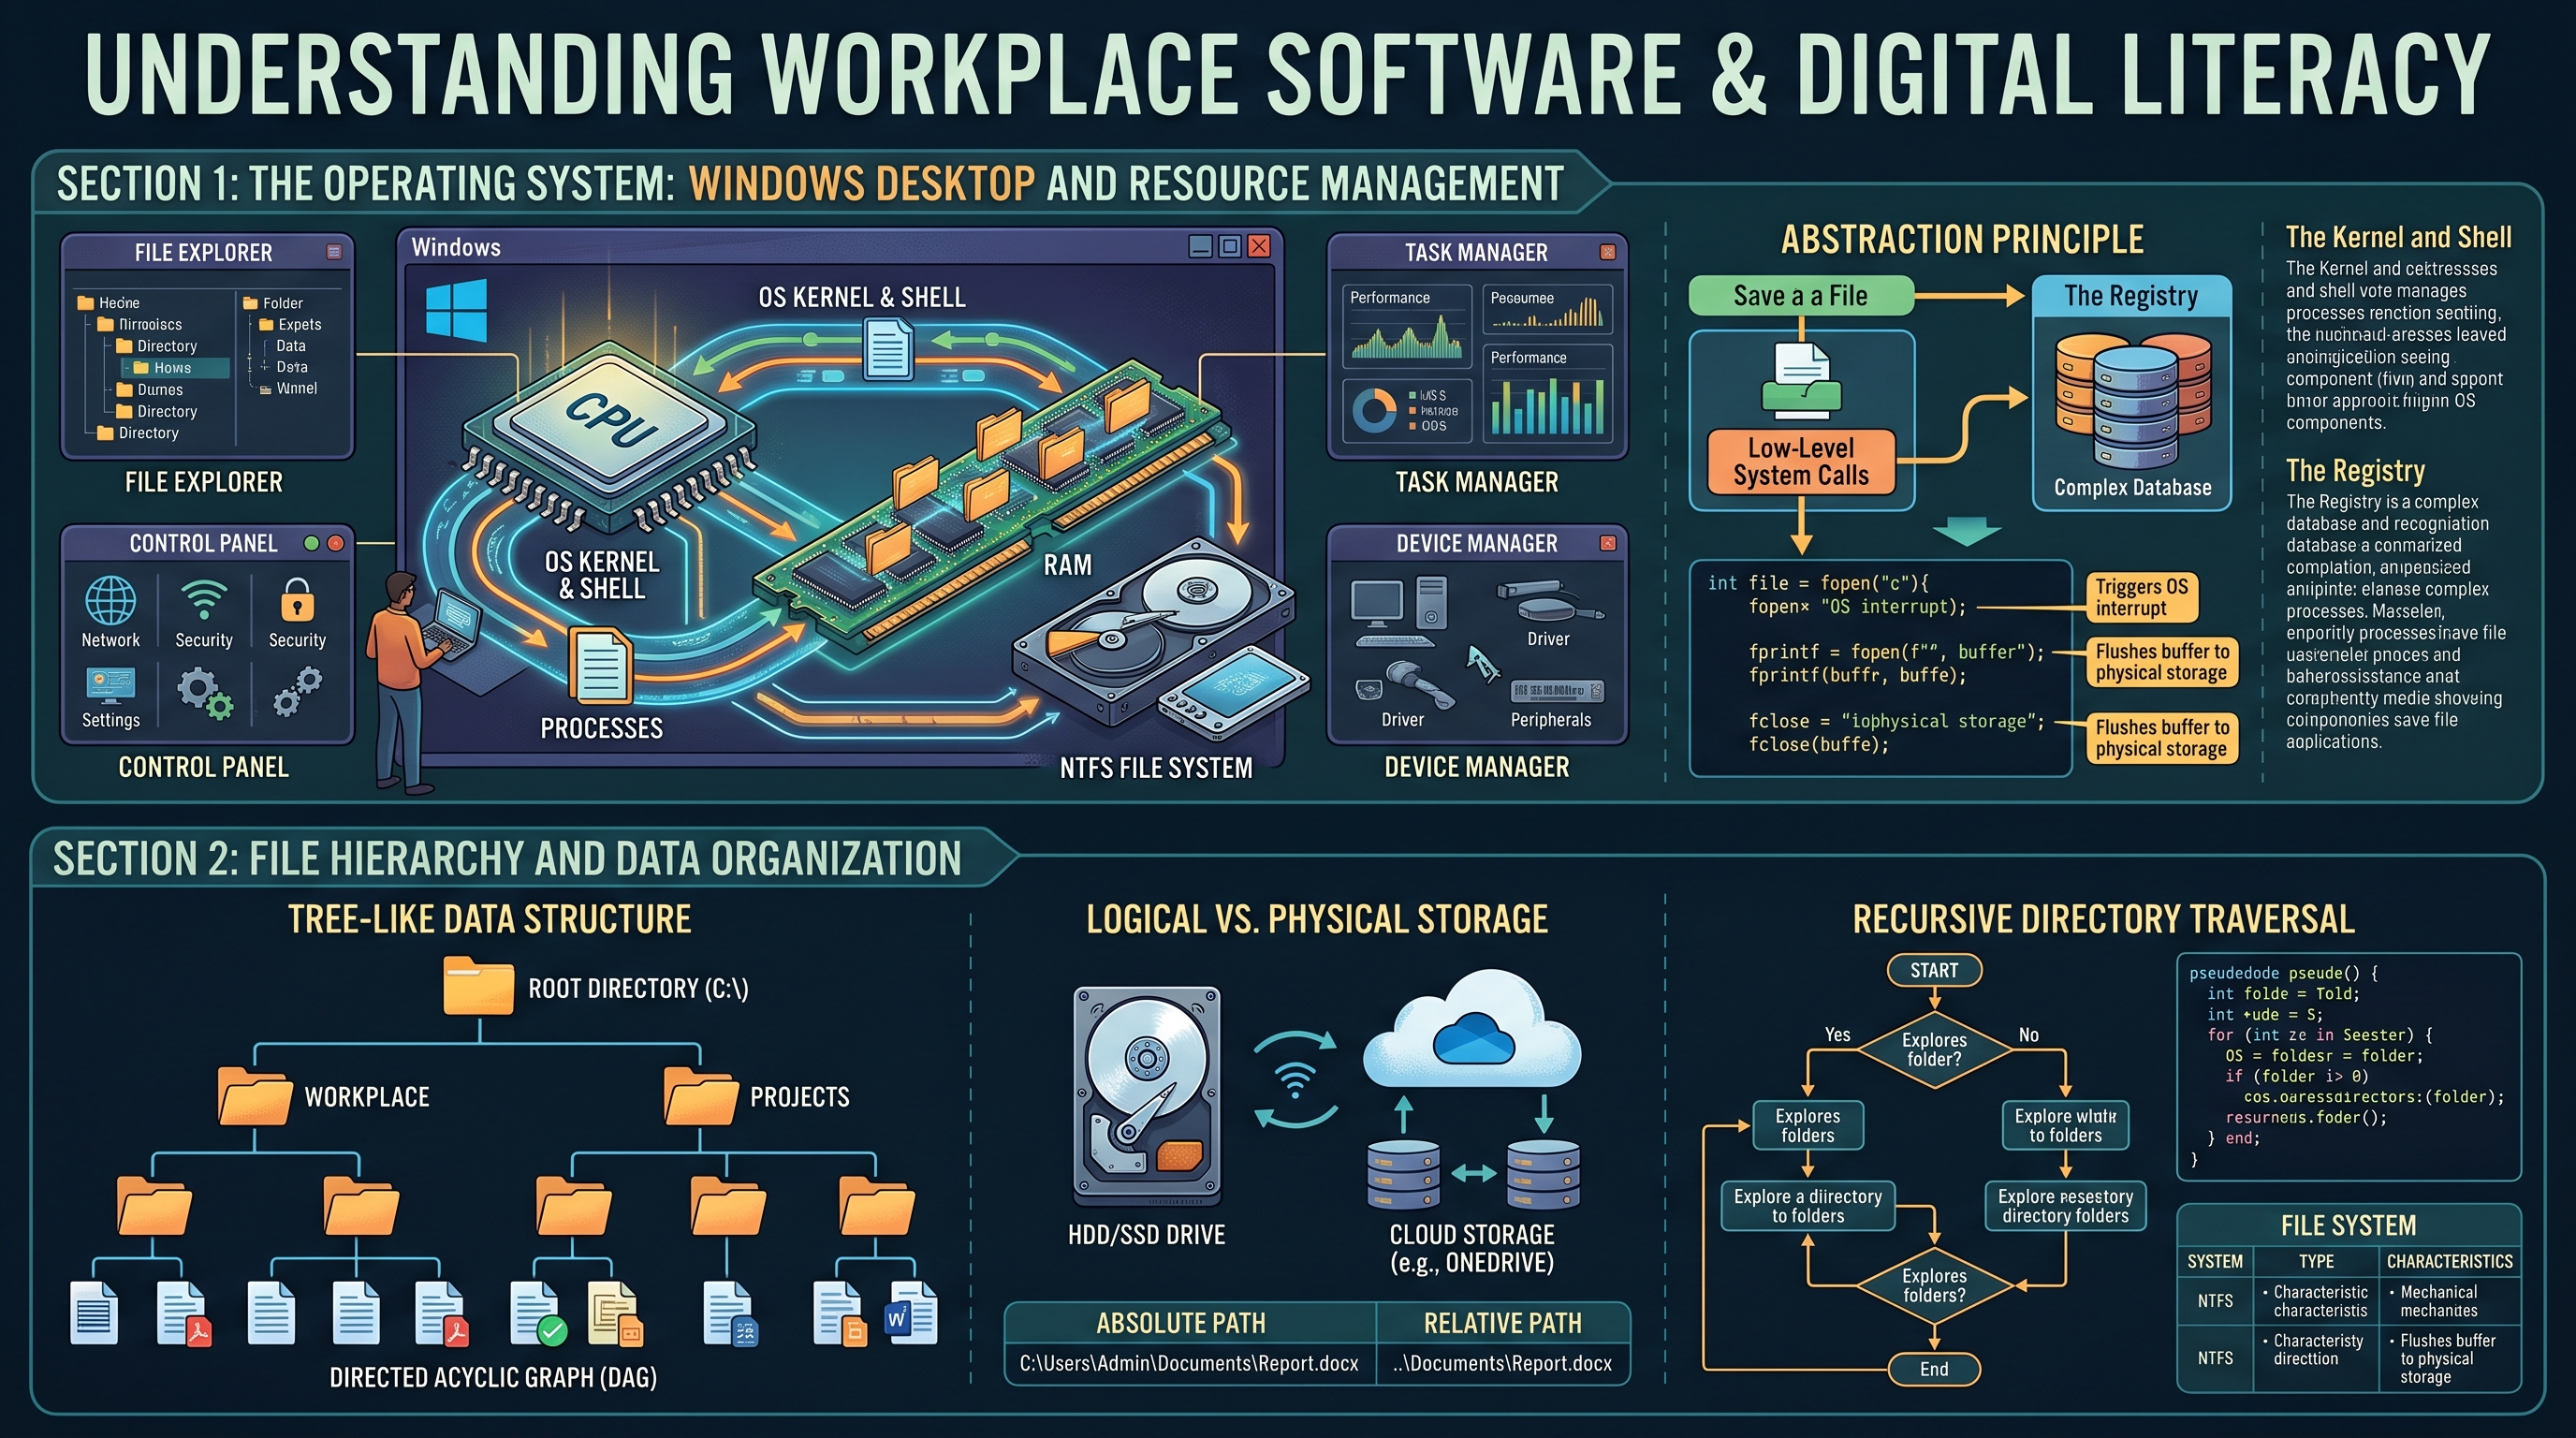
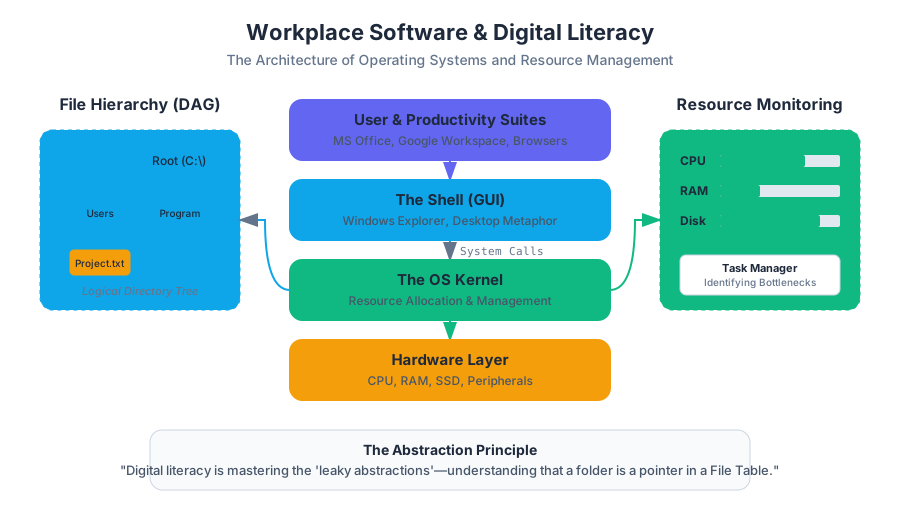
The Operating System (OS) serves as the intermediary between computer hardware and the user. In a workplace context, Windows remains the dominant environment, providing a Graphical User Interface (GUI) that abstracts complex system calls into manageable visual metaphors.
The Architecture of Windows Management
At its core, Windows manages four primary resources: Processors (CPU), Memory (RAM), Storage, and I/O Devices. A digitally literate professional understands that the "Desktop" is not just a visual space but a high-level directory within a complex file system.
- The Kernel and Shell: The Kernel is the core of the OS that handles hardware operations, while the Shell (Windows Explorer) is the interface users interact with.
- The Registry: A hierarchical database that stores low-level settings for the OS and applications.
- Task Management: The ability to monitor resource allocation through the Task Manager, identifying "bottlenecks" where CPU or RAM usage exceeds capacity.
The Abstraction Principle: Digital literacy is the process of mastering the "leaky abstractions" of software—understanding that while a folder looks like a physical object, it is actually a pointer in a File Allocation Table or Master File Table (MFT).
| Component | Function | Professional Use Case |
|---|---|---|
| File Explorer | Navigation of the directory tree | Managing project assets and versioning |
| Control Panel / Settings | Configuration of system parameters | Network setup and peripheral management |
| Task Manager | Process and performance monitoring | Troubleshooting unresponsive applications |
| Device Manager | Hardware driver management | Resolving hardware conflicts (e.g., printers, displays) |
Low-Level System Interaction
To understand how an OS handles a simple task like saving a document, one must look at the system calls involved. The following C code demonstrates the low-level logic of file creation, which is what happens "under the hood" when you click "Save" in Word.
#include <stdio.h>
#include <stdlib.h>

/*
   A low-level demonstration of file I/O in a Windows/POSIX environment.
   This simulates the 'Save' function of workplace software.
*/

int main() {
    FILE *fptr;
    char content[] = "Digital Literacy: Understanding System Calls";

    // Open file for writing (wb = write binary/text)
    // This triggers an OS interrupt to allocate disk sectors
    fptr = fopen("C:\\Workplace\\Project_Alpha.txt", "w");

    if (fptr == NULL) {
        printf("Error: Insufficient permissions or disk space.\n");
        exit(1);
    }

    fprintf(fptr, "%s", content);
    fclose(fptr); // Flushes buffer to physical storage

    return 0;
}
File Hierarchy and Data Organization
A critical component of digital literacy is the mastery of File Hierarchies. Data is organized in a tree-like structure, starting from a Root Directory (e.g., C:\) and branching into subdirectories.
Logical vs. Physical Storage
Modern professionals must distinguish between local storage (Hard Disk Drives/Solid State Drives) and cloud-based storage (OneDrive, Google Drive). The logic of the path remains the same, but the latency and synchronization mechanics differ.
- Absolute Path: The full address of a file starting from the root (e.g.,
C:\Users\Admin\Documents\Report.docx). - Relative Path: The address relative to the current working directory (e.g.,
..\Documents\Report.docx).
Mathematical Representation of a Directory Tree
A file system can be modeled as a Directed Acyclic Graph (DAG), specifically a tree $T = (V, E)$, where $V$ represents files/folders and $E$ represents the containment relationship.
Algorithm: Recursive Directory Traversal
-----------------------------------------
function traverse(directory):
    for each item in directory:
        if item is file:
            process(item)
        else if item is folder:
            traverse(item) // Recursive call to enter sub-directory
| File System | Max File Size | Features |
|---|---|---|
| NTFS | 16 EB | Journaling, Permissions (ACLs), Encryption |
| FAT32 | 4 GB | High compatibility, no security features |
| exFAT | 16 EB | Optimized for flash drives/SD cards |
| APFS | 8 EB | Apple's modern system, optimized for SSDs |
The Productivity Suite: Microsoft Office vs. Google Workspace
The "Big Two" productivity suites—Microsoft Office and Google Workspace—represent different philosophies of workplace software. Microsoft Office (Word, Excel, PowerPoint) focuses on feature-rich, "heavy" client-side processing. Google Workspace (Docs, Sheets, Slides) prioritizes cloud-native collaboration and real-time synchronization.
Word Processing and Document Engineering
Professional word processing is not just typing; it is Document Engineering. This involves:
- Styles and Semantics: Using
H1,H2, andBodytags to create a logical document structure that is accessible to screen readers. - Pagination and Section Breaks: Managing different headers/footers within a single file.
- Metadata: Understanding that a
.docxfile is actually a zipped collection of XML files containing author data, edit time, and version history.
Spreadsheets: The Engine of Business Logic
A spreadsheet (Excel/Sheets) is a reactive programming environment. Each cell is a variable, and formulas define the relationship between those variables.
The Spreadsheet Theorem: Any business process that can be defined as a finite set of mathematical rules can be modeled in a spreadsheet.
For complex data analysis, professionals often move beyond basic arithmetic to logical functions and lookups. Consider the evolution from a simple SUM to a relational XLOOKUP.
\text{Total Revenue} = \sum_{i=1}^{n} (Quantity_i \times Price_i)
Data Analysis with Python (The Modern Spreadsheet Extension)
In high-level digital literacy, professionals use tools like Python's pandas library to handle datasets that exceed Excel's 1,048,576 row limit.
import pandas as pd

# Load a massive workplace dataset
df = pd.read_csv('quarterly_sales_2023.csv')

# Perform a 'Pivot Table' style operation programmatically
summary = df.groupby('Department')['Revenue'].agg(['sum', 'mean', 'std'])

# Filter for underperforming sectors
underperforming = summary[summary['sum'] < 50000]

print(underperforming)
Internet Security and the Human Firewall
As workplace software becomes increasingly interconnected, Internet Security is no longer just an IT department concern—it is a core digital literacy skill.
The CIA Triad
The foundation of information security is the CIA Triad:
- Confidentiality: Ensuring data is only accessible to authorized users (Encryption, MFA).
- Integrity: Ensuring data is not altered during transit or storage (Hashing, Digital Signatures).
- Availability: Ensuring systems are accessible when needed (Backups, DDoS protection).
Threat Vectors in the Workplace
The most common entry point for cyberattacks is not a technical exploit, but Social Engineering.
| Threat Type | Mechanism | Mitigation |
|---|---|---|
| Phishing | Deceptive emails to steal credentials | Email filtering, User education, MFA |
| Ransomware | Encrypts local files and demands payment | Offline backups, "Least Privilege" access |
| Man-in-the-Middle | Intercepting data on public Wi-Fi | VPN usage, HTTPS/TLS encryption |
| Spoofing | Faking a trusted IP or email address | SPF/DKIM records, Certificate validation |
Security via Command Line
A digitally literate user can use basic network tools to verify the security of their environment.
# Check the route your data takes to a server (identifying potential intercepts)
tracert google.com

# View active network connections on your machine
netstat -an | findstr "ESTABLISHED"

# Verify the integrity of a downloaded file using SHA-256
certutil -hashfile "C:\Downloads\Update.exe" SHA256
Databases and Information Systems
While spreadsheets are excellent for calculation, Databases (like Microsoft Access or SQL Server) are designed for data integrity and complex relationships. Digital literacy includes knowing when to move from a "Flat File" (Excel) to a "Relational Database" (Access).
Relational Logic
In a database, data is normalized to prevent redundancy. Instead of repeating a customer's address in every order row, the order table links to a customer ID.
| Feature | Spreadsheet (Excel) | Database (Access/SQL) |
|---|---|---|
| Data Structure | Flat (Rows/Columns) | Relational (Linked Tables) |
| Data Integrity | Low (Cells can contain anything) | High (Strict Data Types) |
| Capacity | Limited by RAM | Limited by Disk Space |
| Concurrency | Difficult for multiple editors | Designed for multi-user access |
Ethics and Information Literacy
The final pillar of digital literacy is Ethics and Information Literacy. This involves the critical evaluation of digital sources and the responsible use of technology.
- The CRAAP Test: Evaluating information based on Currency, Relevance, Authority, Accuracy, and Purpose.
- Digital Governance: Adhering to organizational policies regarding data privacy (GDPR, CCPA) and acceptable use.
- Accessibility (A11y): Ensuring digital content is usable by people with disabilities, such as providing Alt-text for images in PowerPoint or using high-contrast colors.
The Ethics of Automation: As AI and automation enter the workplace software suite (e.g., Copilot), the ethical professional must validate AI-generated output for bias, hallucination, and intellectual property infringement.
Summary of Workplace Digital Literacy Concepts
To master the digital workplace, one must view software not as a static set of tools, but as a dynamic ecosystem. Proficiency in the Microsoft Office and Google Suites provides the "vocabulary" of business, while an understanding of Windows management and file hierarchies provides the "grammar." Finally, a robust approach to internet security and ethics ensures that these tools are used safely and responsibly.
Key Takeaways:
- Operating Systems are resource managers; understanding them helps in troubleshooting and efficiency.
- File Hierarchies are logical trees; proper organization is the difference between data and noise.
- Spreadsheets are reactive programs; they are the primary tool for business logic and modeling.
- Security is a shared responsibility; the "Human Firewall" is the most important layer of defense.
- Information Literacy is the ability to discern truth and value in an era of information overload.
Word Processing and Document Development
Key concepts: Academic Paper Formatting · Document Lifecycle · Business Letters · Editing Tools · Formatting Standards
In-depth training on creating professional and academic documents using Microsoft Word and Google Docs.
Word Processing and Document Development
Word processing is the foundational pillar of modern digital literacy, representing the transition from the mechanical constraints of the typewriter to the fluid, non-linear environment of digital text manipulation. At its core, a word processor is not merely a "digital typewriter" but a sophisticated software environment designed to manage the Document Lifecycle—a multi-stage process involving the creation, editing, formatting, and distribution of structured information.
To understand word processing at an expert level, one must view a document as a hierarchical data structure. Whether you are drafting a 500-page dissertation in LaTeX or a one-page business memo in Microsoft Word, you are interacting with a system that balances human-readable aesthetics with machine-readable metadata. This article explores the technical mechanics, professional standards, and algorithmic underpinnings of modern document development.
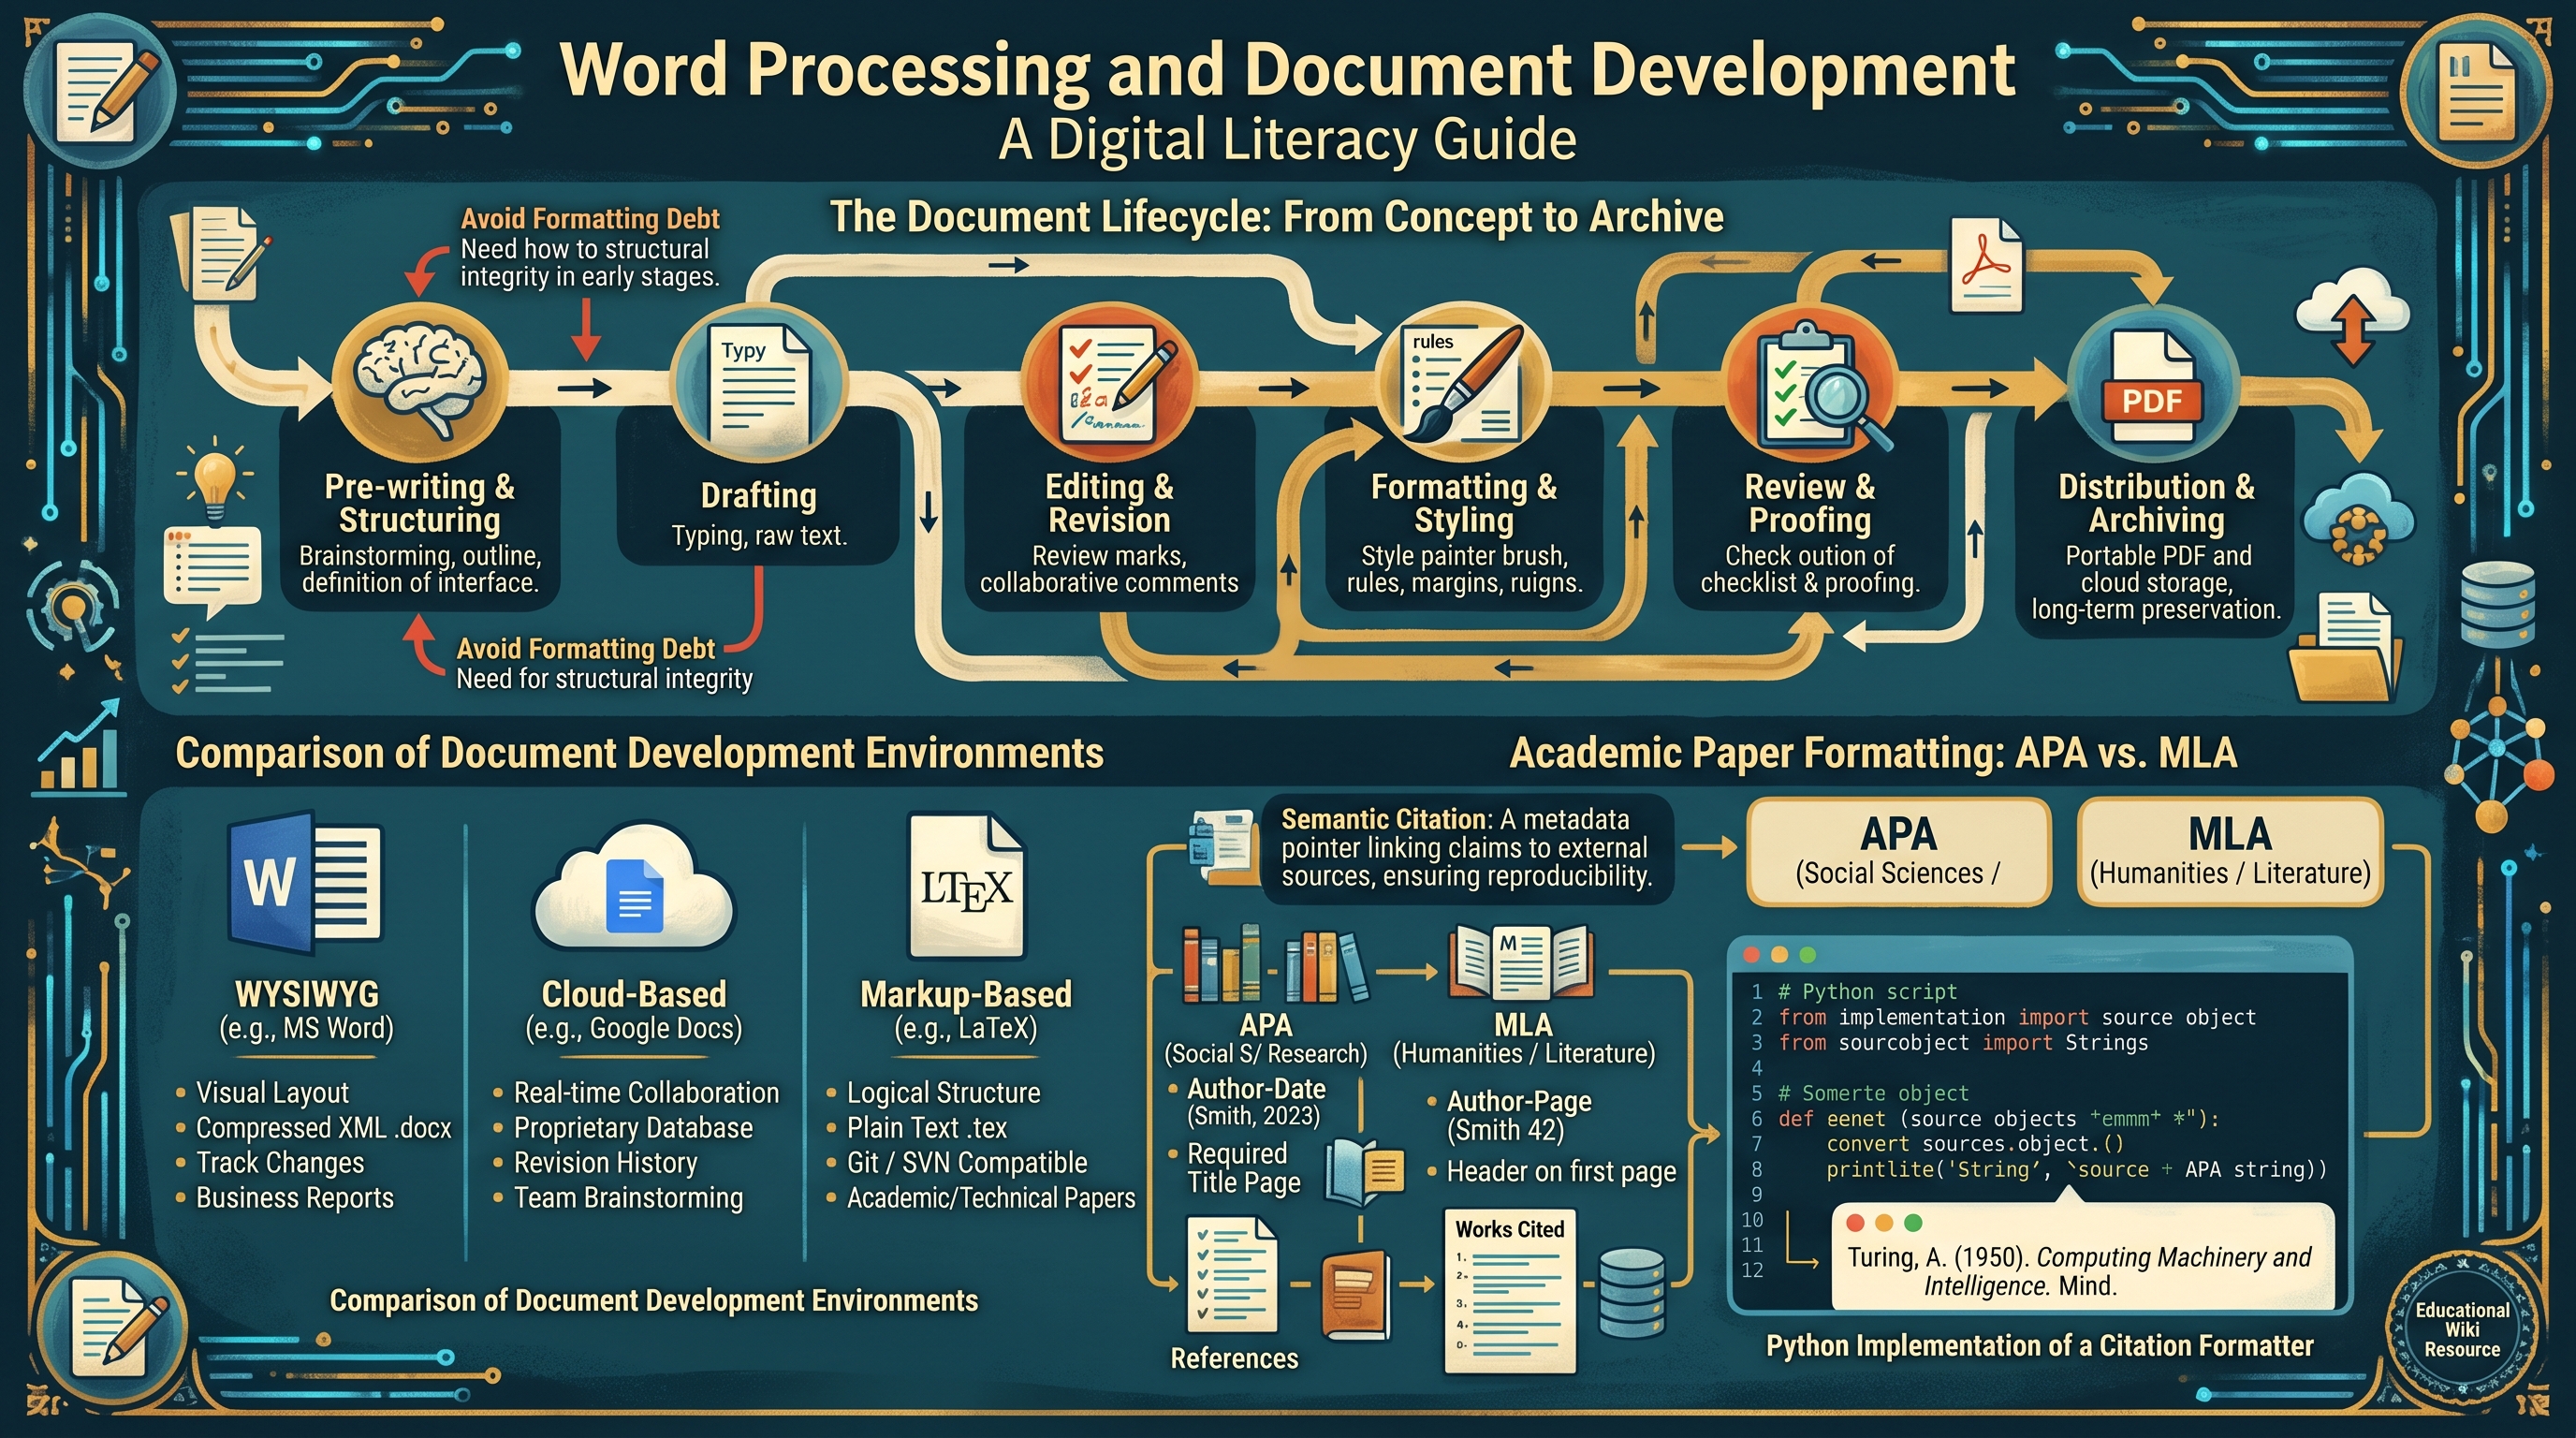
The Document Lifecycle: From Concept to Archive
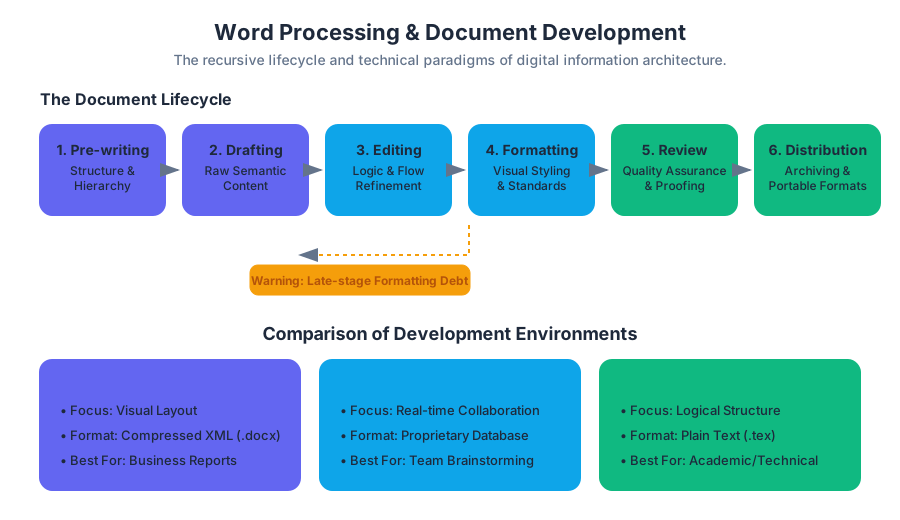
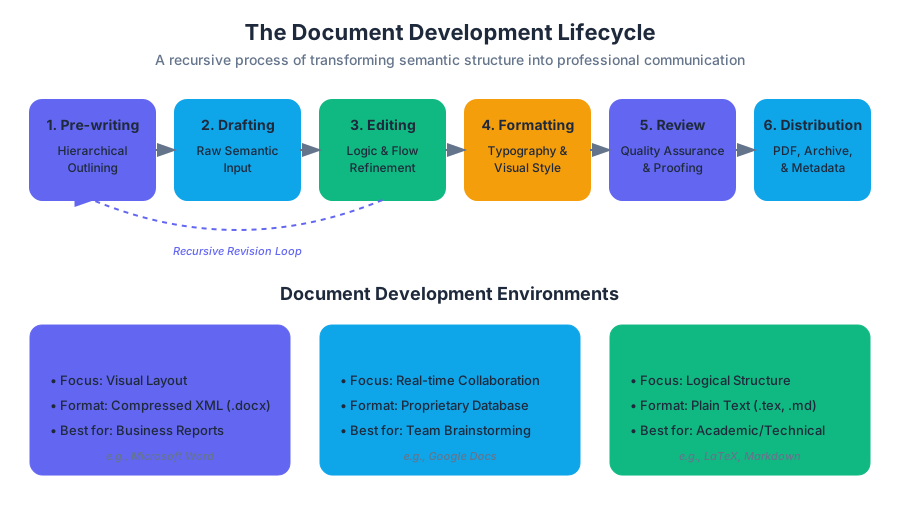
The development of a professional document is rarely a linear path. It follows a recursive lifecycle where each stage informs the next. A failure to respect this lifecycle often results in "formatting debt," where late-stage changes become exponentially difficult to implement because the underlying structure was poorly defined.
- Pre-writing and Structuring: Defining the document's purpose, audience, and hierarchical outline.
- Drafting: The raw input of content, focusing on semantic meaning rather than visual appearance.
- Editing and Revision: Refining the logic, flow, and accuracy of the text. This often involves collaboration tools and version control.
- Formatting and Styling: Applying visual standards (margins, typography, spacing) to the semantic structure.
- Review and Proofing: Final quality assurance, checking for grammatical errors and adherence to style guides.
- Distribution and Archiving: Converting the document into a portable format (like PDF) or a markup language for long-term storage.
Comparison of Document Development Environments
| Feature | WYSIWYG (e.g., MS Word) | Cloud-Based (e.g., Google Docs) | Markup-Based (e.g., LaTeX) |
|---|---|---|---|
| Primary Focus | Visual Layout | Real-time Collaboration | Logical Structure |
| Storage Format | Compressed XML (.docx) | Proprietary Database | Plain Text (.tex) |
| Version Control | Track Changes (Internal) | Revision History | Git / SVN Compatible |
| Learning Curve | Low (Intuitive) | Very Low | High (Code-based) |
| Best For | Business Reports | Team Brainstorming | Academic/Technical Papers |
Academic Paper Formatting: The Logic of Citations
In academia, formatting is not a matter of personal preference; it is a rigorous system of information architecture designed to ensure transparency and reproducibility. The two primary standards—APA (American Psychological Association) and MLA (Modern Language Association)—serve different epistemological needs.
Definition: Semantic Citation A citation is a pointer in a document's metadata that links a claim to an external data source. Formatting standards define the "API" for these pointers, ensuring that any reader can resolve the pointer to the original source without ambiguity.
APA vs. MLA: A Technical Comparison
| Requirement | APA (7th Edition) | MLA (9th Edition) |
|---|---|---|
| Focus | Social Sciences / Research | Humanities / Literature |
| In-text Style | Author-Date (Smith, 2023) | Author-Page (Smith 42) |
| Title Page | Required (Student & Professional) | Not required (Header on first page) |
| Heading Style | Centered, Bold, Title Case | Left-aligned, No specific bolding |
| Reference List | "References" | "Works Cited" |
To automate these standards, modern word processors use citation managers that treat sources as objects in a database.
First Code Block: Python Implementation of a Citation Formatter
This script demonstrates how a word processor might programmatically convert a source object into a formatted APA string.
class Source:
    def __init__(self, author_last, author_first, year, title, publisher):
        self.author_last = author_last
        self.author_first = author_first
        self.year = year
        self.title = title
        self.publisher = publisher

    def to_apa(self):
        """Returns a string formatted in APA 7th Edition style."""
        # Format: Last, F. (Year). Title. Publisher.
        initial = self.author_first[0].upper()
        return f"{self.author_last}, {initial}. ({self.year}). *{self.title}*. {self.publisher}."

# Example Usage
paper_source = Source("Turing", "Alan", 1950, "Computing Machinery and Intelligence", "Mind")
print(paper_source.to_apa())
# Output: Turing, A. (1950). *Computing Machinery and Intelligence*. Mind.
Business Communication and Document Standards
In a corporate environment, documents are extensions of a brand's identity. Business Letters and Formal Reports rely on standardized layouts to convey professionalism and facilitate rapid scanning by executives.
The Anatomy of a Business Letter
A professional business letter typically follows the Block Style, where all text is left-aligned and paragraphs are not indented, separated instead by double spacing.
- Sender's Address: Contact information of the author.
- Date: The formal record of transmission.
- Inside Address: The recipient's full name and professional address.
- Salutation: A formal greeting (e.g., "Dear Mr. Henderson:").
- Body: The core message, usually structured into an opening (purpose), middle (detail), and closing (call to action).
- Complimentary Close: A professional sign-off (e.g., "Sincerely,").
- Signature Block: The printed name and title of the sender.
Professional Document Types and Their Parameters
| Document Type | Purpose | Key Formatting Constraint |
|---|---|---|
| Memo | Internal communication | No signature block; uses "To/From/Date/Subject" header. |
| Executive Summary | High-level overview | Must be concise; usually limited to one page. |
| White Paper | Authoritative report | Heavy use of data visualization and technical citations. |
| Press Release | Public announcement | Includes "FOR IMMEDIATE RELEASE" and contact info. |
Editing Tools and Computational Linguistics
Modern word processors are equipped with "Intelligent Editing" suites. These tools do not just check for typos; they utilize natural language processing (NLP) to analyze syntax and semantics.
Spell-check and the Levenshtein Distance
When a word processor suggests a correction for a misspelled word, it often calculates the Levenshtein Distance (or "Edit Distance") between the typed string and words in its dictionary.
Theorem: Levenshtein Distance The distance between two strings $a, b$ is the minimum number of single-character edits (insertions, deletions, or substitutions) required to change $a$ into $b$.
Second Code Block: Mathematical Derivation of Edit Distance
The following pseudocode represents the dynamic programming approach to calculating the cost of transforming string s1 into s2.
Function LevenshteinDistance(s1, s2):
    m = length(s1)
    n = length(s2)
    d = matrix[0..m, 0..n]

    for i from 0 to m: d[i, 0] = i
    for j from 0 to n: d[0, j] = j

    for j from 1 to n:
        for i from 1 to m:
            if s1[i] == s2[j]:
                substitutionCost = 0
            else:
                substitutionCost = 1

            d[i, j] = minimum(
                d[i-1, j] + 1,           // deletion
                d[i, j-1] + 1,           // insertion
                d[i-1, j-1] + substitutionCost // substitution
            )
    return d[m, n]
Formatting Standards: The Move to XML
Historically, word processing files (like the old .doc format) were binary blobs that were difficult to parse without the original software. Modern standards, such as Office Open XML (.docx) and OpenDocument Format (.odt), are actually compressed ZIP archives containing multiple XML files.
This shift allows for better data recovery and interoperability. If you rename a .docx file to .zip and open it, you will find a file named document.xml which contains the actual text and formatting tags.
Third Code Block: LaTeX - The Programmatic Alternative
While Word uses a GUI, LaTeX uses markup. This example shows how a professional document is defined through code, ensuring perfect consistency across different machines.
\documentclass[12pt, letterpaper]{article}
\usepackage[utf8]{inputenc}
\usepackage{geometry}
 \geometry{margin=1in}

\title{The Impact of Word Processing on Digital Literacy}
\author{Professor of Information Systems}
\date{\today}

\begin{document}

\maketitle

\section{Introduction}
Word processing has evolved from simple text entry to complex document development.
This document demonstrates the power of \textbf{typesetting} over simple word processing.

\subsection{Key Advantages}
\begin{itemize}
    \item Separation of content and style.
    \item Superior handling of mathematical equations: $E = mc^2$.
    \item Automated cross-referencing and indexing.
\end{itemize}

\end{document}
Advanced Formatting: Styles and Templates
The most common mistake among novice users is "Direct Formatting"—applying bold, italics, or font changes directly to text. Experts use Styles.
A Style is a named collection of formatting attributes. By applying a "Heading 1" style rather than manually increasing the font size and bolding a line, you create a semantic map of the document. This map allows the software to automatically generate a Table of Contents (TOC) and enables screen readers to navigate the document for users with visual impairments.
Fourth Code Block: WordprocessingML (XML) Snippet
This is what a "Heading 1" style looks like under the hood in a .docx file's XML structure.
<w:p>
  <w:pPr>
    <w:pStyle w:val="Heading1"/>
    <w:jc w:val="center"/>
  </w:pPr>
  <w:r>
    <w:t>Chapter 1: The Evolution of Text</w:t>
  </w:r>
</w:p>
Common Pitfalls in Document Development
- Manual Spacing: Using the
Enterkey to create space between paragraphs or theSpacebarto align text. This breaks when the font size or margin changes. Use Paragraph Spacing and Tabs/Indents instead. - Version Chaos: Saving files as
Report_v1.docx,Report_v2_FINAL.docx,Report_v2_FINAL_REALLY.docx. Use built-in Track Changes or a dedicated version control system. - Ignoring Accessibility: Failing to use alt-text for images or proper heading hierarchies. This makes documents unusable for colleagues using assistive technologies.
- Over-formatting: Using too many fonts or colors. Professional documents typically limit themselves to two font families (one serif for body text, one sans-serif for headings).
Spreadsheet Management and Data Visualization
Key concepts: Formulas and Functions · Logical and Lookup Functions · Data Visualization · Spreadsheet Fundamentals · Mathematical Computations
Mastering Microsoft Excel and other spreadsheet software for data organization, mathematical computation, and charting.
Spreadsheet Management and Data Visualization
The modern spreadsheet is more than a digital ledger; it is a functional programming environment and a sophisticated engine for relational data modeling. Since the inception of VisiCalc in 1979, spreadsheets have evolved into the primary interface through which the business world interacts with quantitative data. This section explores the mechanics of spreadsheet computation, the logic of data retrieval, and the cognitive principles of effective visualization.
Spreadsheet Fundamentals: The Architecture of the Grid
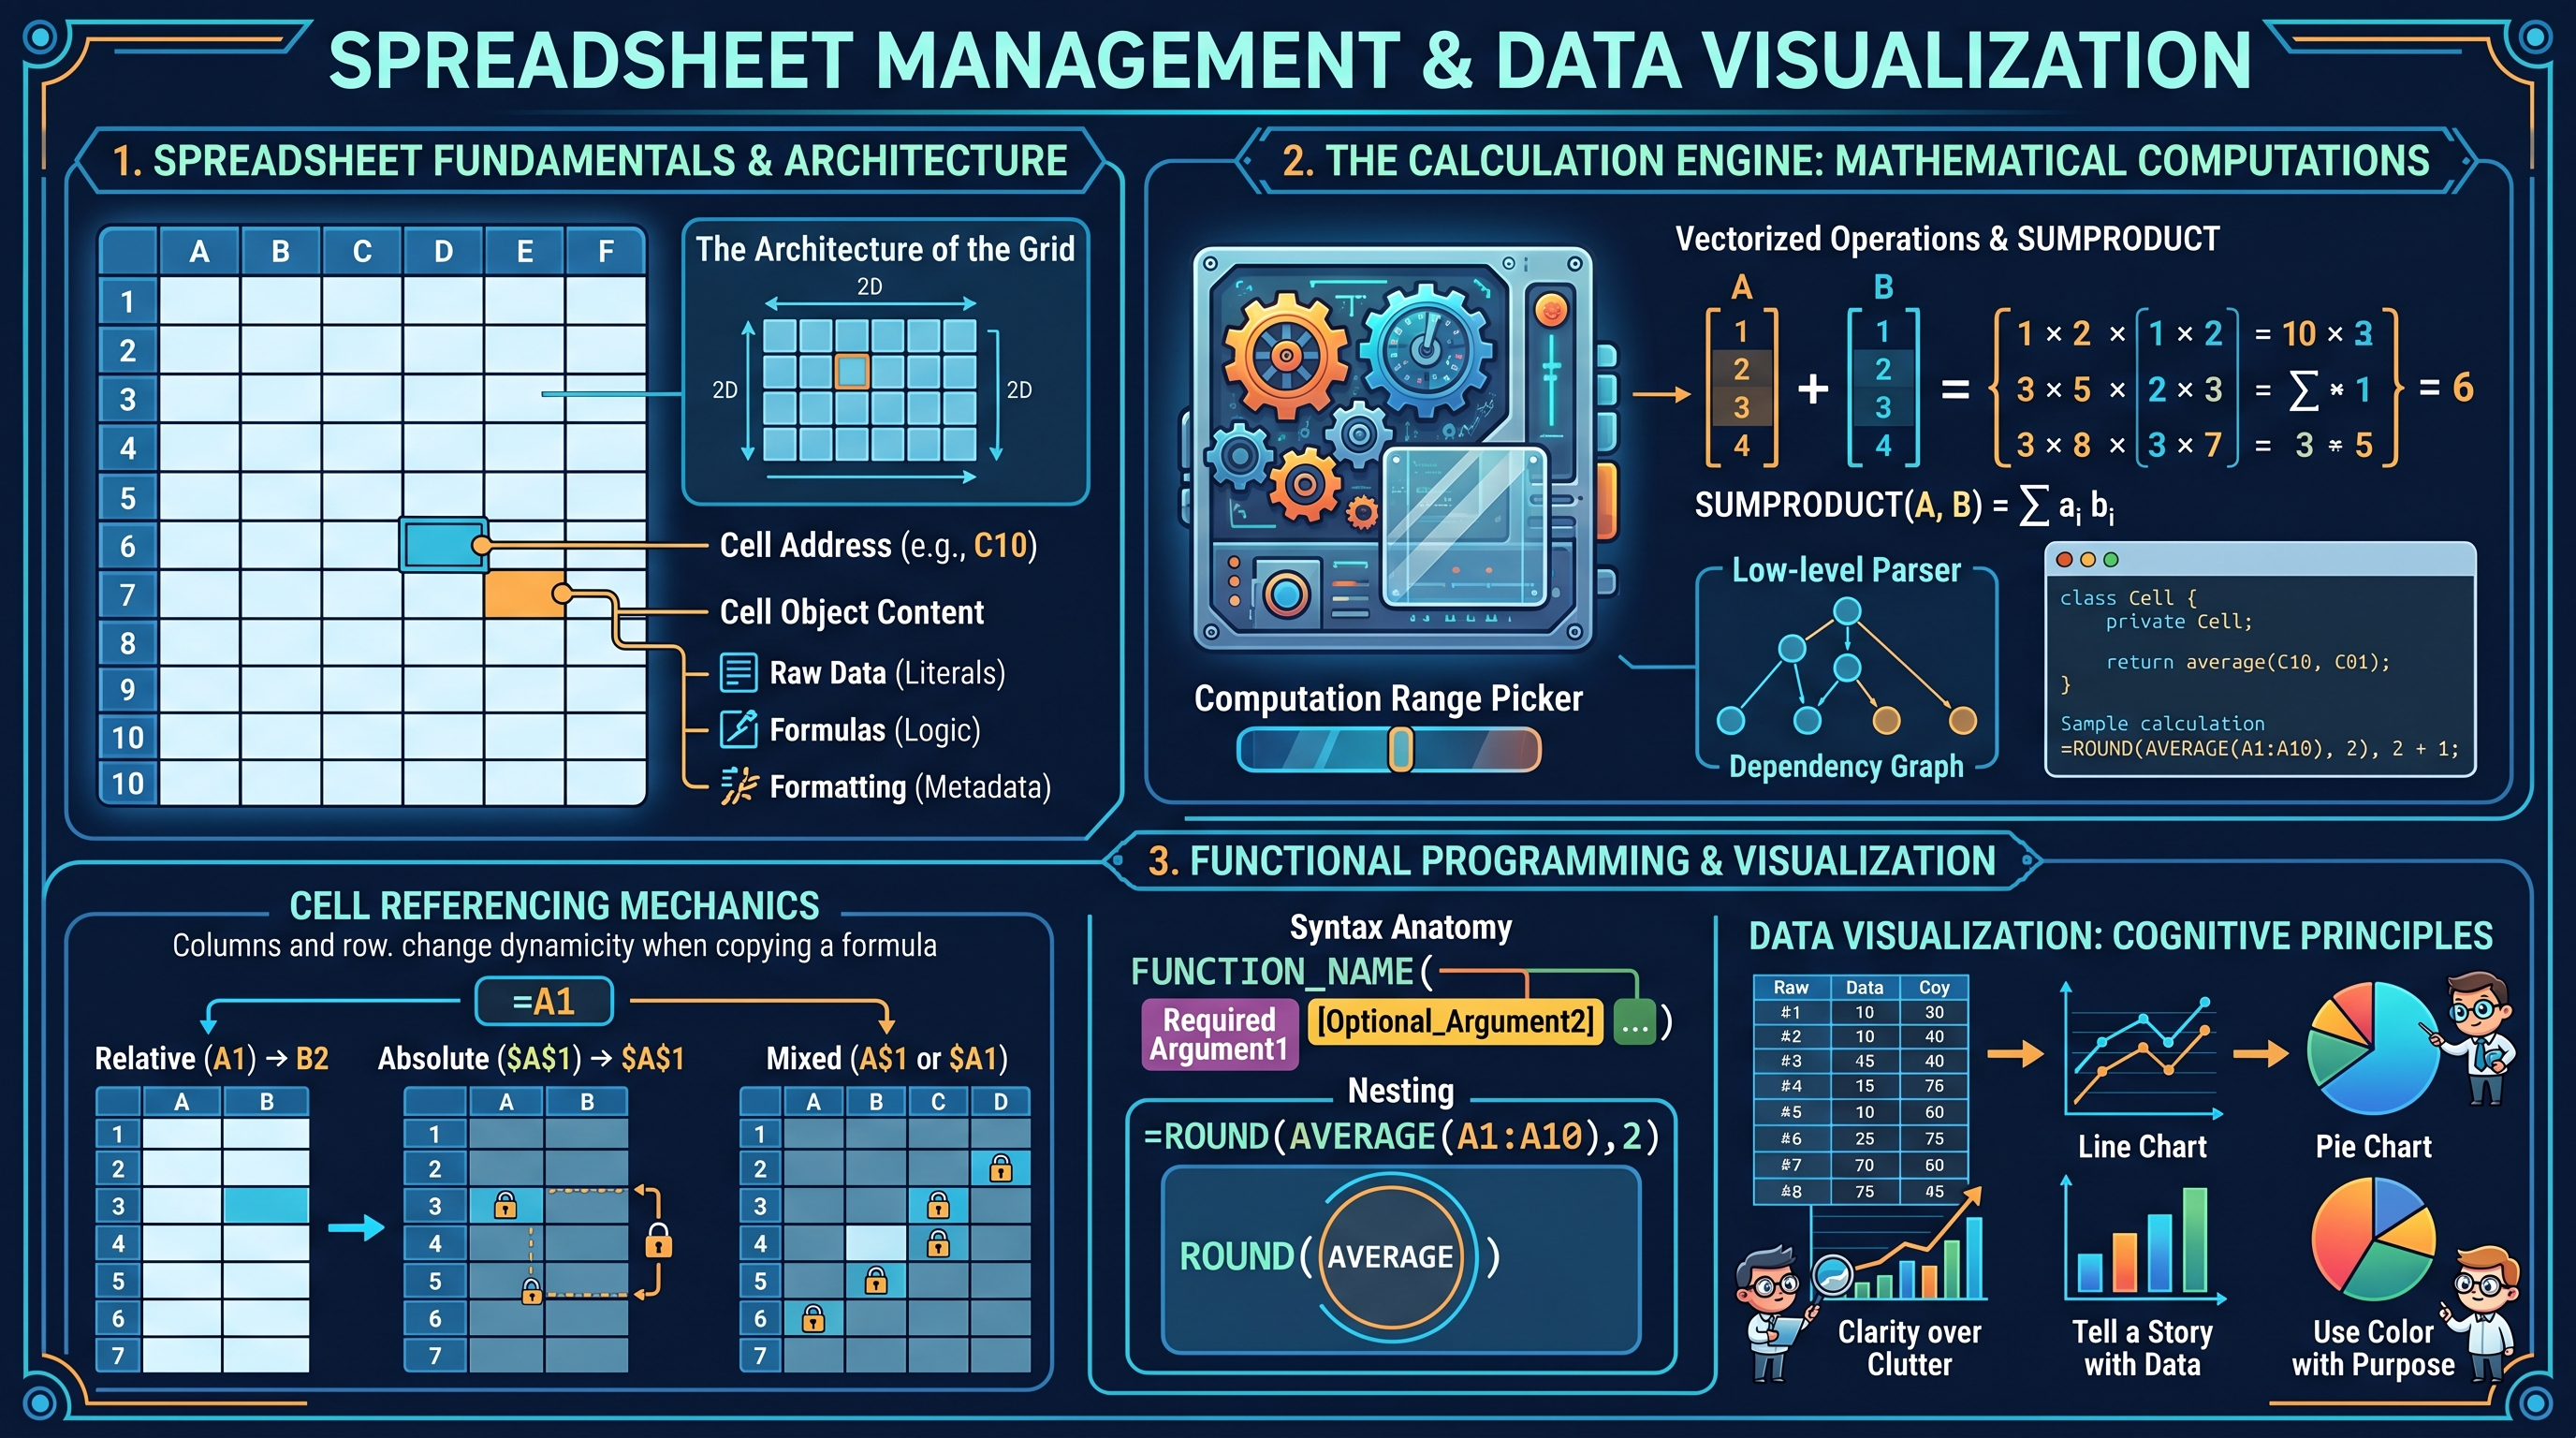
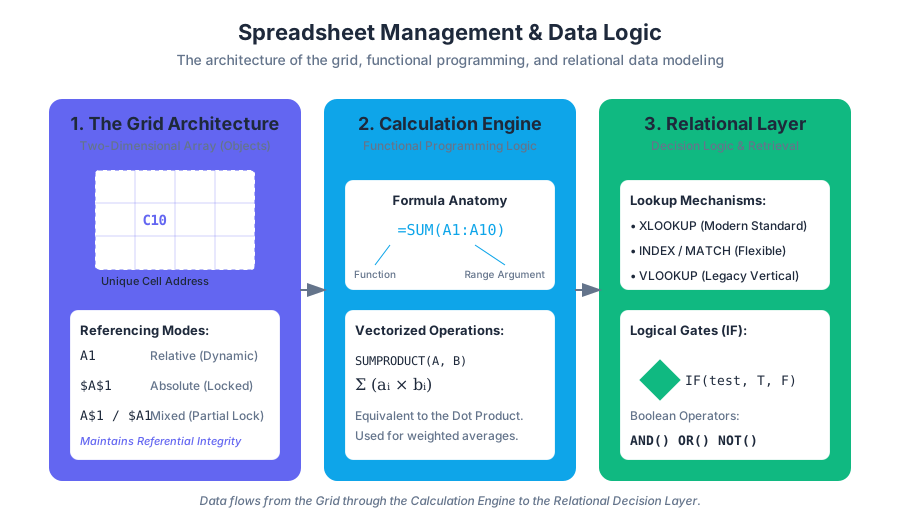
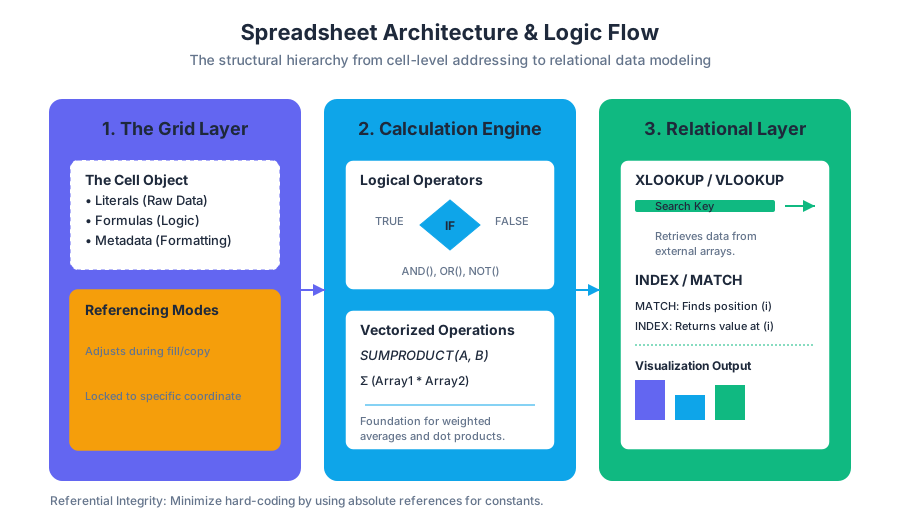
At its core, a spreadsheet is a two-dimensional array of cells, where each cell is an object capable of holding three distinct types of information: raw data (literals), formulas (logic), and formatting (metadata). The intersection of a column (identified by letters) and a row (identified by numbers) creates a unique Cell Address (e.g., C10).
Cell Referencing and Memory Addressing
The most critical concept in spreadsheet architecture is the distinction between Relative, Absolute, and Mixed references. This determines how formulas behave when they are copied across the grid.
| Reference Type | Syntax | Behavior during Fill/Copy | Use Case |
|---|---|---|---|
| Relative | A1 |
Both column and row adjust based on the displacement. | Calculating line-item totals in a list. |
| Absolute | $A$1 |
Neither column nor row changes; the reference is "locked." | Referencing a constant tax rate or discount factor. |
| Mixed (Row) | A$1 |
The column adjusts, but the row remains fixed. | Creating a multiplication table or header-based logic. |
| Mixed (Col) | $A1 |
The row adjusts, but the column remains fixed. | Comparing multiple scenarios against a fixed baseline. |
The Principle of Referential Integrity: A robust spreadsheet model should minimize "hard-coding" (typing numbers directly into formulas). Instead, constants should be placed in dedicated input cells and referenced absolutely, allowing for global updates by changing a single value.
Mathematical Computations: The Calculation Engine
Spreadsheets follow the standard Order of Operations (PEMDAS/BODMAS), but they also introduce specific computational behaviors for handling ranges and arrays.
Vectorized Operations and SUMPRODUCT
While basic arithmetic (+, -, *, /) operates on scalars, functions like SUMPRODUCT introduce vectorized math.
$$ \text{SUMPRODUCT}(A, B) = \sum_{i=1}^{n} a_i b_i $$
This is mathematically equivalent to the dot product of two vectors. It is the foundation for weighted averages and complex conditional sums.
# Low-level representation of a Spreadsheet Cell and Formula Parser
# This simulates how a dependency graph might evaluate cell values

class Cell:
    def __init__(self, expression, sheet):
        self.expression = expression  # Can be a literal (5) or formula ("=A1+B1")
        self.sheet = sheet
        self.value = None

    def evaluate(self):
        if not str(self.expression).startswith('='):
            self.value = float(self.expression)
            return self.value

        # Simple parser for "=CELL+CELL"
        tokens = self.expression[1:].split('+')
        total = 0
        for token in tokens:
            # Recursive lookup in the sheet's cell dictionary
            total += self.sheet[token].evaluate()
        self.value = total
        return self.value

# Usage
data_grid = {
    'A1': Cell(10, None),
    'B1': Cell(20, None),
    'C1': Cell('=A1+B1', None)
}
# Link sheet context
for cell in data_grid.values(): cell.sheet = data_grid

print(f"Evaluated Value of C1: {data_grid['C1'].evaluate()}")
Formulas and Functions: Functional Programming for Non-Programmers
A Formula is a user-defined expression (e.g., =A1+A2), while a Function is a pre-built routine (e.g., SUM(), VLOOKUP()). Functions are the "API" of the spreadsheet, abstracting complex algorithms into simple arguments.
Syntax Anatomy
A function call typically follows the pattern: FUNCTION_NAME(argument1, [optional_argument2], ...).
- Arguments can be literals, cell references, or nested functions.
- Nesting allows for functional composition, where the output of one function becomes the input of another:
=ROUND(AVERAGE(A1:A10), 2).
Logical and Lookup Functions: The Decision Layer
Logical functions allow the spreadsheet to react to data dynamically, while lookup functions transform the grid from a flat list into a relational database.
The IF Logic Gate
The IF function is a ternary operator: IF(test, value_if_true, value_if_false). It is the fundamental building block of spreadsheet automation.
| Operator | Meaning | Example |
|---|---|---|
= |
Equal to | IF(A1=100, "Pass", "Fail") |
<> |
Not equal to | IF(A1<>0, B1/A1, 0) |
> / < |
Greater/Less than | IF(A1>50, "High", "Low") |
AND() |
All conditions true | IF(AND(A1>0, A1<10), "Valid", "Invalid") |
OR() |
Any condition true | IF(OR(A1="Red", A1="Blue"), 1, 0) |
Lookup Mechanisms: VLOOKUP vs. INDEX/MATCH vs. XLOOKUP
Lookup functions are used to retrieve data from a table based on a key.
- VLOOKUP (Vertical Lookup): Searches the first column of a range and returns a value in the same row from a specified column.
- INDEX/MATCH: A more flexible combination where
MATCHfinds the position of a value andINDEXretrieves the value at that position. - XLOOKUP: The modern successor that handles horizontal and vertical searches, defaults to exact matches, and can return entire ranges.
MATHEMATICAL DERIVATION OF INDEX/MATCH LOGIC

Let T be a Table of size m x n.
Let K be the search key.
Let C_search be the column vector in T containing keys.
Let C_return be the column vector in T containing desired values.

Step 1: MATCH(K, C_search, 0)
Find index i such that C_search[i] == K.
i = argmin | j | where C_search[j] == K

Step 2: INDEX(C_return, i)
Retrieve the value at index i from the return vector.
Result = C_return[i]

This decoupling allows C_return to be to the LEFT of C_search,
a feat VLOOKUP cannot perform.
Data Visualization: Mapping Numbers to Optics
Data visualization is the graphical representation of information. Its goal is to communicate complex relationships clearly and efficiently by mapping data variables to visual aesthetics (position, length, color, and shape).
The Grammar of Graphics
Effective visualization follows the "Data-Ink Ratio" principle proposed by Edward Tufte: Maximize the share of ink used to represent data, and minimize the ink used for non-data elements (gridlines, borders, decorations).
Chart Selection Matrix
Choosing the wrong chart type can lead to "misinformation by design."
| Data Relationship | Recommended Chart | Why? |
|---|---|---|
| Trend over Time | Line Chart | Emphasizes continuity and the "slope" of change. |
| Comparison (Categories) | Bar/Column Chart | Uses length to provide an accurate baseline for comparison. |
| Correlation | Scatter Plot | Reveals clusters, outliers, and the strength of relationships ($R^2$). |
| Part-to-Whole | Treemap / Pie | Shows how a total is broken down (Pie is limited to <5 slices). |
| Distribution | Histogram | Shows the frequency of data points within specific "bins." |
Principles of Cognitive Load
- Preattentive Attributes: Use color and size to draw attention to the most important data point before the user consciously processes the chart.
- Avoid 3D Effects: 3D bars and pies distort the viewer's perception of area and length, making accurate comparison impossible.
- Color Theory: Use sequential scales for ordered data (light to dark) and diverging scales for data with a neutral midpoint (e.g., profit/loss).
Advanced Data Management: PivotTables and Power Query
As datasets grow, manual formulas become inefficient. PivotTables allow for the multi-dimensional aggregation of data without writing a single function.
The Pivot Mechanism
A PivotTable takes a flat data source and allows the user to define:
- Rows/Columns: The categorical variables to group by.
- Values: The numerical variable to aggregate (Sum, Count, Average).
- Filters: The subset of data to include.
Data Validation and Cleaning
Before visualization, data must be "tidy." This involves:
- Removing Duplicates: Ensuring each observation is unique.
- Data Validation: Restricting cell input to specific types (e.g., dates only, or a list of names) to prevent "Garbage In, Garbage Out" (GIGO).
- Conditional Formatting: Using logic-based styling to highlight outliers or trends automatically.
/**
 * Real-world usage: Google Apps Script (JavaScript)
 * Custom function to fetch live currency exchange rates into a spreadsheet.
 * This extends spreadsheet functionality beyond static data.
 */

/**
 * Converts currency using an external API.
 * @param {number} amount The amount to convert.
 * @param {string} fromCurrency The source currency code (e.g., "USD").
 * @param {string} toCurrency The target currency code (e.g., "EUR").
 * @return {number} The converted amount.
 * @customfunction
 */
function LIVE_EXCHANGE(amount, fromCurrency, toCurrency) {
  const cache = CacheService.getScriptCache();
  const cacheKey = `${fromCurrency}_${toCurrency}`;
  let rate = cache.get(cacheKey);

  if (!rate) {
    const url = `https://api.exchangerate-api.com/v4/latest/${fromCurrency}`;
    const response = UrlFetchApp.fetch(url);
    const data = JSON.parse(response.getContentText());
    rate = data.rates[toCurrency];
    // Cache for 1 hour to stay within API limits
    cache.put(cacheKey, rate.toString(), 3600);
  }

  return amount * parseFloat(rate);
}
Common Pitfalls in Spreadsheet Management
- Circular References: Occurs when a formula refers to its own cell, either directly or indirectly, creating an infinite loop. Most engines will throw an error unless "Iterative Calculation" is enabled.
- Hidden Rows in Calculations: Functions like
SUM()include hidden rows, whereasSUBTOTAL()can be configured to ignore them. This is a frequent source of reporting errors. - Floating Point Errors: Because computers represent decimal numbers in binary, calculations involving many decimals can result in tiny errors (e.g.,
0.1 + 0.2 = 0.30000000000000004). UseROUND()to mitigate this in financial models. - Hard-coding: Putting numbers inside formulas (e.g.,
=A1*0.07) makes the sheet difficult to audit and update.
Summary of Best Practices
To build professional-grade spreadsheets, one must treat the workbook like a software application:
- Separation of Concerns: Keep raw data, calculations, and presentation (dashboards) on separate tabs.
- Documentation: Use cell comments or a "ReadMe" tab to explain complex logic and data sources.
- Consistency: Use uniform header styles and naming conventions for named ranges.
- Verification: Always cross-check PivotTable totals against the raw data
SUM().
Web Development and Digital Accessibility
Key concepts: HTML · Web Accessibility Auditing · WCAG Standards · WAI-ARIA · Assistive Technology
An introduction to web technologies (HTML) and the critical standards for making digital content accessible to all users.
Web Development and Digital Accessibility
The modern web is often characterized by its visual flair and interactive complexity, yet its fundamental purpose remains the transmission of information. Digital Accessibility (often abbreviated as a11y) is the practice of ensuring that there are no barriers that prevent interaction with, or access to, websites by people with physical disabilities, situational disabilities, or socio-economic restrictions. In the context of professional web development, accessibility is not a "feature" to be added at the end of a project; it is a core architectural requirement, much like security or performance.
The Semantic Foundation: HTML and the Accessibility Tree
At the heart of every web page is HTML (HyperText Markup Language). While many developers view HTML merely as a tool for visual layout, its primary technical role is to provide semantic structure. Semantic HTML uses tags that convey the meaning of the content to the browser and, crucially, to Assistive Technology (AT).
When a browser renders a page, it creates two primary internal models:
- The DOM (Document Object Model): A tree representation of the HTML structure used for rendering and scripting.
- The Accessibility Tree: A subset of the DOM that contains only the information relevant to assistive technologies, such as screen readers.
Definition: The Accessibility Tree The Accessibility Tree is a specialized data structure generated by the browser engine that filters out purely presentational elements and exposes the name, role, state, and value of every interactive element to the OS-level accessibility APIs.
Semantic vs. Non-Semantic Implementation
The difference between semantic and non-semantic code is the difference between a machine "understanding" a button and a machine seeing a generic box.
| Feature | Non-Semantic (<div> / <span>) |
Semantic (<button>, <nav>, <header>) |
|---|---|---|
| Role Mapping | None (Generic) | Explicit (e.g., "Button", "Navigation") |
| Keyboard Focus | Requires tabindex="0" |
Automatic |
| Activation | Requires JS keydown listeners |
Automatic (Enter/Space keys) |
| AT Announcement | "Group" or nothing | "Submit, Button" |
| SEO Impact | Low | High |
Implementation Example: The Custom Toggle
The following JavaScript implementation demonstrates how to programmatically manage accessibility states for a custom component that cannot be represented by a simple native element.
/**
 * AccessibleToggle: A class to manage a custom toggle switch.
 * Ensures that the DOM state and the Accessibility Tree stay in sync.
 */
class AccessibleToggle {
    constructor(elementId) {
        this.button = document.getElementById(elementId);
        this.state = {
            pressed: this.button.getAttribute('aria-pressed') === 'true'
        };
        this.init();
    }

    init() {
        // Ensure the element has the correct ARIA role if not using <button>
        if (this.button.tagName !== 'BUTTON') {
            this.button.setAttribute('role', 'button');
            this.button.setAttribute('tabindex', '0');
        }

        this.button.addEventListener('click', () => this.toggle());
        this.button.addEventListener('keydown', (e) => {
            if (e.key === 'Enter' || e.key === ' ') {
                e.preventDefault();
                this.toggle();
            }
        });
    }

    toggle() {
        this.state.pressed = !this.state.pressed;
        // Update the Accessibility Tree via ARIA attributes
        this.button.setAttribute('aria-pressed', this.state.pressed);

        // Visual update (CSS handles the rest via attribute selector)
        this.button.classList.toggle('is-active', this.state.pressed);

        // Dispatch custom event for application logic
        this.button.dispatchEvent(new CustomEvent('toggleChange', {
            detail: { pressed: this.state.pressed }
        }));
    }
}

// Usage
const mySwitch = new AccessibleToggle('theme-switcher');
WCAG Standards: The POUR Principles
The Web Content Accessibility Guidelines (WCAG), developed by the W3C, serve as the international benchmark for digital inclusion. WCAG is organized under four foundational principles, known by the acronym POUR.
- Perceivable: Information and user interface components must be presentable to users in ways they can perceive (it can't be invisible to all their senses).
- Operable: User interface components and navigation must be operable (the user must be able to operate the interface).
- Understandable: Information and the operation of the user interface must be understandable.
- Robust: Content must be robust enough that it can be interpreted reliably by a wide variety of user agents, including assistive technologies.
WCAG Conformance Levels
WCAG is categorized into three levels of compliance, representing increasing degrees of accessibility.
| Level | Description | Target Audience |
|---|---|---|
| Level A | The minimum level of accessibility. Without meeting these, the site is nearly impossible for some to use. | Essential for all sites. |
| Level AA | The global standard for most commercial and government sites. Addresses the most common barriers. | Professional/Legal standard. |
| Level AAA | The highest and most complex level. Often requires significant design trade-offs. | Specialized/Dedicated sites. |
Mathematical Derivation of Color Contrast
One of the most common WCAG AA requirements is a contrast ratio of at least 4.5:1 for normal text. This is calculated using the relative luminance ($L$) of the colors.
The relative luminance $L$ of a color is defined as: $$L = 0.2126R + 0.7152G + 0.0722B$$ where $R, G, B$ are the sRGB components, linearized.
The contrast ratio is then calculated as: $$Contrast = \frac{L_1 + 0.05}{L_2 + 0.05}$$ where $L_1$ is the luminance of the lighter color and $L_2$ is the luminance of the darker color.
WAI-ARIA: Bridging the Semantic Gap
WAI-ARIA (Web Accessibility Initiative – Accessible Rich Internet Applications) is a technical specification that provides a way to add missing semantic information to HTML. It is particularly vital for dynamic web applications where content changes without a page reload.
ARIA is comprised of three main features:
- Roles: Define what an element is (e.g.,
role="tablist",role="alert"). - Properties: Define characteristics of elements (e.g.,
aria-haspopup="true"). - States: Define the current condition of an element (e.g.,
aria-disabled="true",aria-expanded="false").
The First Rule of ARIA If you can use a native HTML element or attribute with the semantics and behavior you require already built-in, then do so. Do not use ARIA unless you absolutely have to.
ARIA Logic Flow
The following pseudocode describes the logic a developer must follow when determining whether to implement ARIA for a custom UI component.
FUNCTION DetermineAriaRequirement(component):
    IF component.hasNativeEquivalent() THEN
        RETURN "Use Semantic HTML (e.g., <details> instead of ARIA-accordion)"

    IF component.isInteractive() THEN
        SET role = MapToAriaRole(component.type)
        SET tabIndex = 0
        ADD KeyboardEventListeners(['Space', 'Enter', 'Arrows'])

    IF component.contentChangesDynamically() THEN
        SET aria-live = "polite" OR "assertive"

    RETURN "Apply ARIA Role, States, and Properties"
END FUNCTION
Assistive Technology (AT) Ecosystem
To build accessible websites, one must understand the tools users employ to navigate them. Assistive Technology refers to any item, piece of equipment, or software that is used to increase, maintain, or improve the functional capabilities of persons with disabilities.
| AT Category | Examples | Primary Web Interaction |
|---|---|---|
| Screen Readers | NVDA, JAWS, VoiceOver | Converts text/DOM to speech or Braille. |
| Screen Magnifiers | ZoomText, Windows Magnifier | Enlarges portions of the screen; requires high-res assets. |
| Switch Access | Sip-and-puff, Single-button switches | Navigates via sequential "scanning" of interactive items. |
| Voice Recognition | Dragon NaturallySpeaking | Operates the UI via verbal commands (requires clear labels). |
The Role of Screen Readers
Screen readers do not simply read the text from top to bottom. They allow users to navigate by "landmarks" (like <nav> or <main>), headings (<h1> through <h6>), and links. This is why a logical heading hierarchy is a technical requirement, not a stylistic choice.
Web Accessibility Auditing
An Accessibility Audit is a systematic evaluation of a website's compliance with accessibility standards. A comprehensive audit must combine both Automated Testing and Manual Testing.
Automated Testing
Automated tools (like Axe-core, Lighthouse, or Pa11y) can detect approximately 30-40% of accessibility issues, such as missing alt text, low color contrast, or duplicate IDs.
# Example: Running a pa11y audit via CLI for a CI/CD pipeline
# This command checks a local development URL against WCAG 2.1 AA standards
pa11y --standard WCAG2AA --reporter cli http://localhost:3000/dashboard
Manual Testing
Manual testing is required for issues that require human judgment, such as:
- Keyboard Navigation: Can every interactive element be reached and activated using only the
TabandEnterkeys? - Focus Management: When a modal opens, does the focus move inside it? When it closes, does it return to the trigger?
- Alt Text Quality: Does the image description actually convey the intent of the image, or is it just a literal description?
- Screen Reader UX: Does the page flow make sense when heard rather than seen?
Audit Workflow Table
| Step | Method | Tooling | Objective |
|---|---|---|---|
| 1. Static Analysis | Automated | Linters (ESLint-plugin-jsx-a11y) | Catch syntax errors in code. |
| 2. Dynamic Scan | Automated | Lighthouse / Axe DevTools | Catch rendering and contrast issues. |
| 3. Keyboard Walkthrough | Manual | Keyboard Only | Ensure no "keyboard traps" exist. |
| 4. AT Simulation | Manual | VoiceOver / NVDA | Verify the "announcement" logic. |
Common Pitfalls and Edge Cases
The "Clickable Div"
A common mistake is attaching a click listener to a <div>. Because a <div> is not a focusable element, keyboard users cannot interact with it.
Fix: Use a <button> or add tabindex="0" and a keydown listener.
Over-using aria-live
The aria-live attribute tells a screen reader to announce changes to a specific area of the page. Setting it to assertive will interrupt the screen reader's current speech.
Pitfall: Using assertive for non-critical updates (like a clock ticking) creates a "noisy" and unusable experience. Use polite for most updates.
Responsive Design vs. Accessibility
Developers often hide elements on mobile using display: none.
Technical Note: display: none removes the element from the Accessibility Tree. If you want to hide an element visually but keep it for screen readers (e.g., a "Skip to Content" link), use a "visually hidden" CSS utility class.
/* The 'Visually Hidden' pattern */
.sr-only {
    position: absolute;
    width: 1px;
    height: 1px;
    padding: 0;
    margin: -1px;
    overflow: hidden;
    clip: rect(0, 0, 0, 0);
    white-space: nowrap;
    border: 0;
}

/* Edge case: Respecting user system preferences */
@media (prefers-reduced-motion: reduce) {
    * {
        animation-duration: 0.01ms !important;
        animation-iteration-count: 1 !important;
        transition-duration: 0.01ms !important;
        scroll-behavior: auto !important;
    }
}
Conclusion: The Ethics of Code
Web accessibility is the technical manifestation of digital ethics. By adhering to WCAG standards and utilizing semantic HTML and ARIA correctly, developers ensure that the internet remains a universal resource. As the web evolves toward more complex interfaces (AI-driven components, 3D environments, etc.), the principles of the Accessibility Tree and the POUR framework remain the essential guideposts for inclusive engineering.
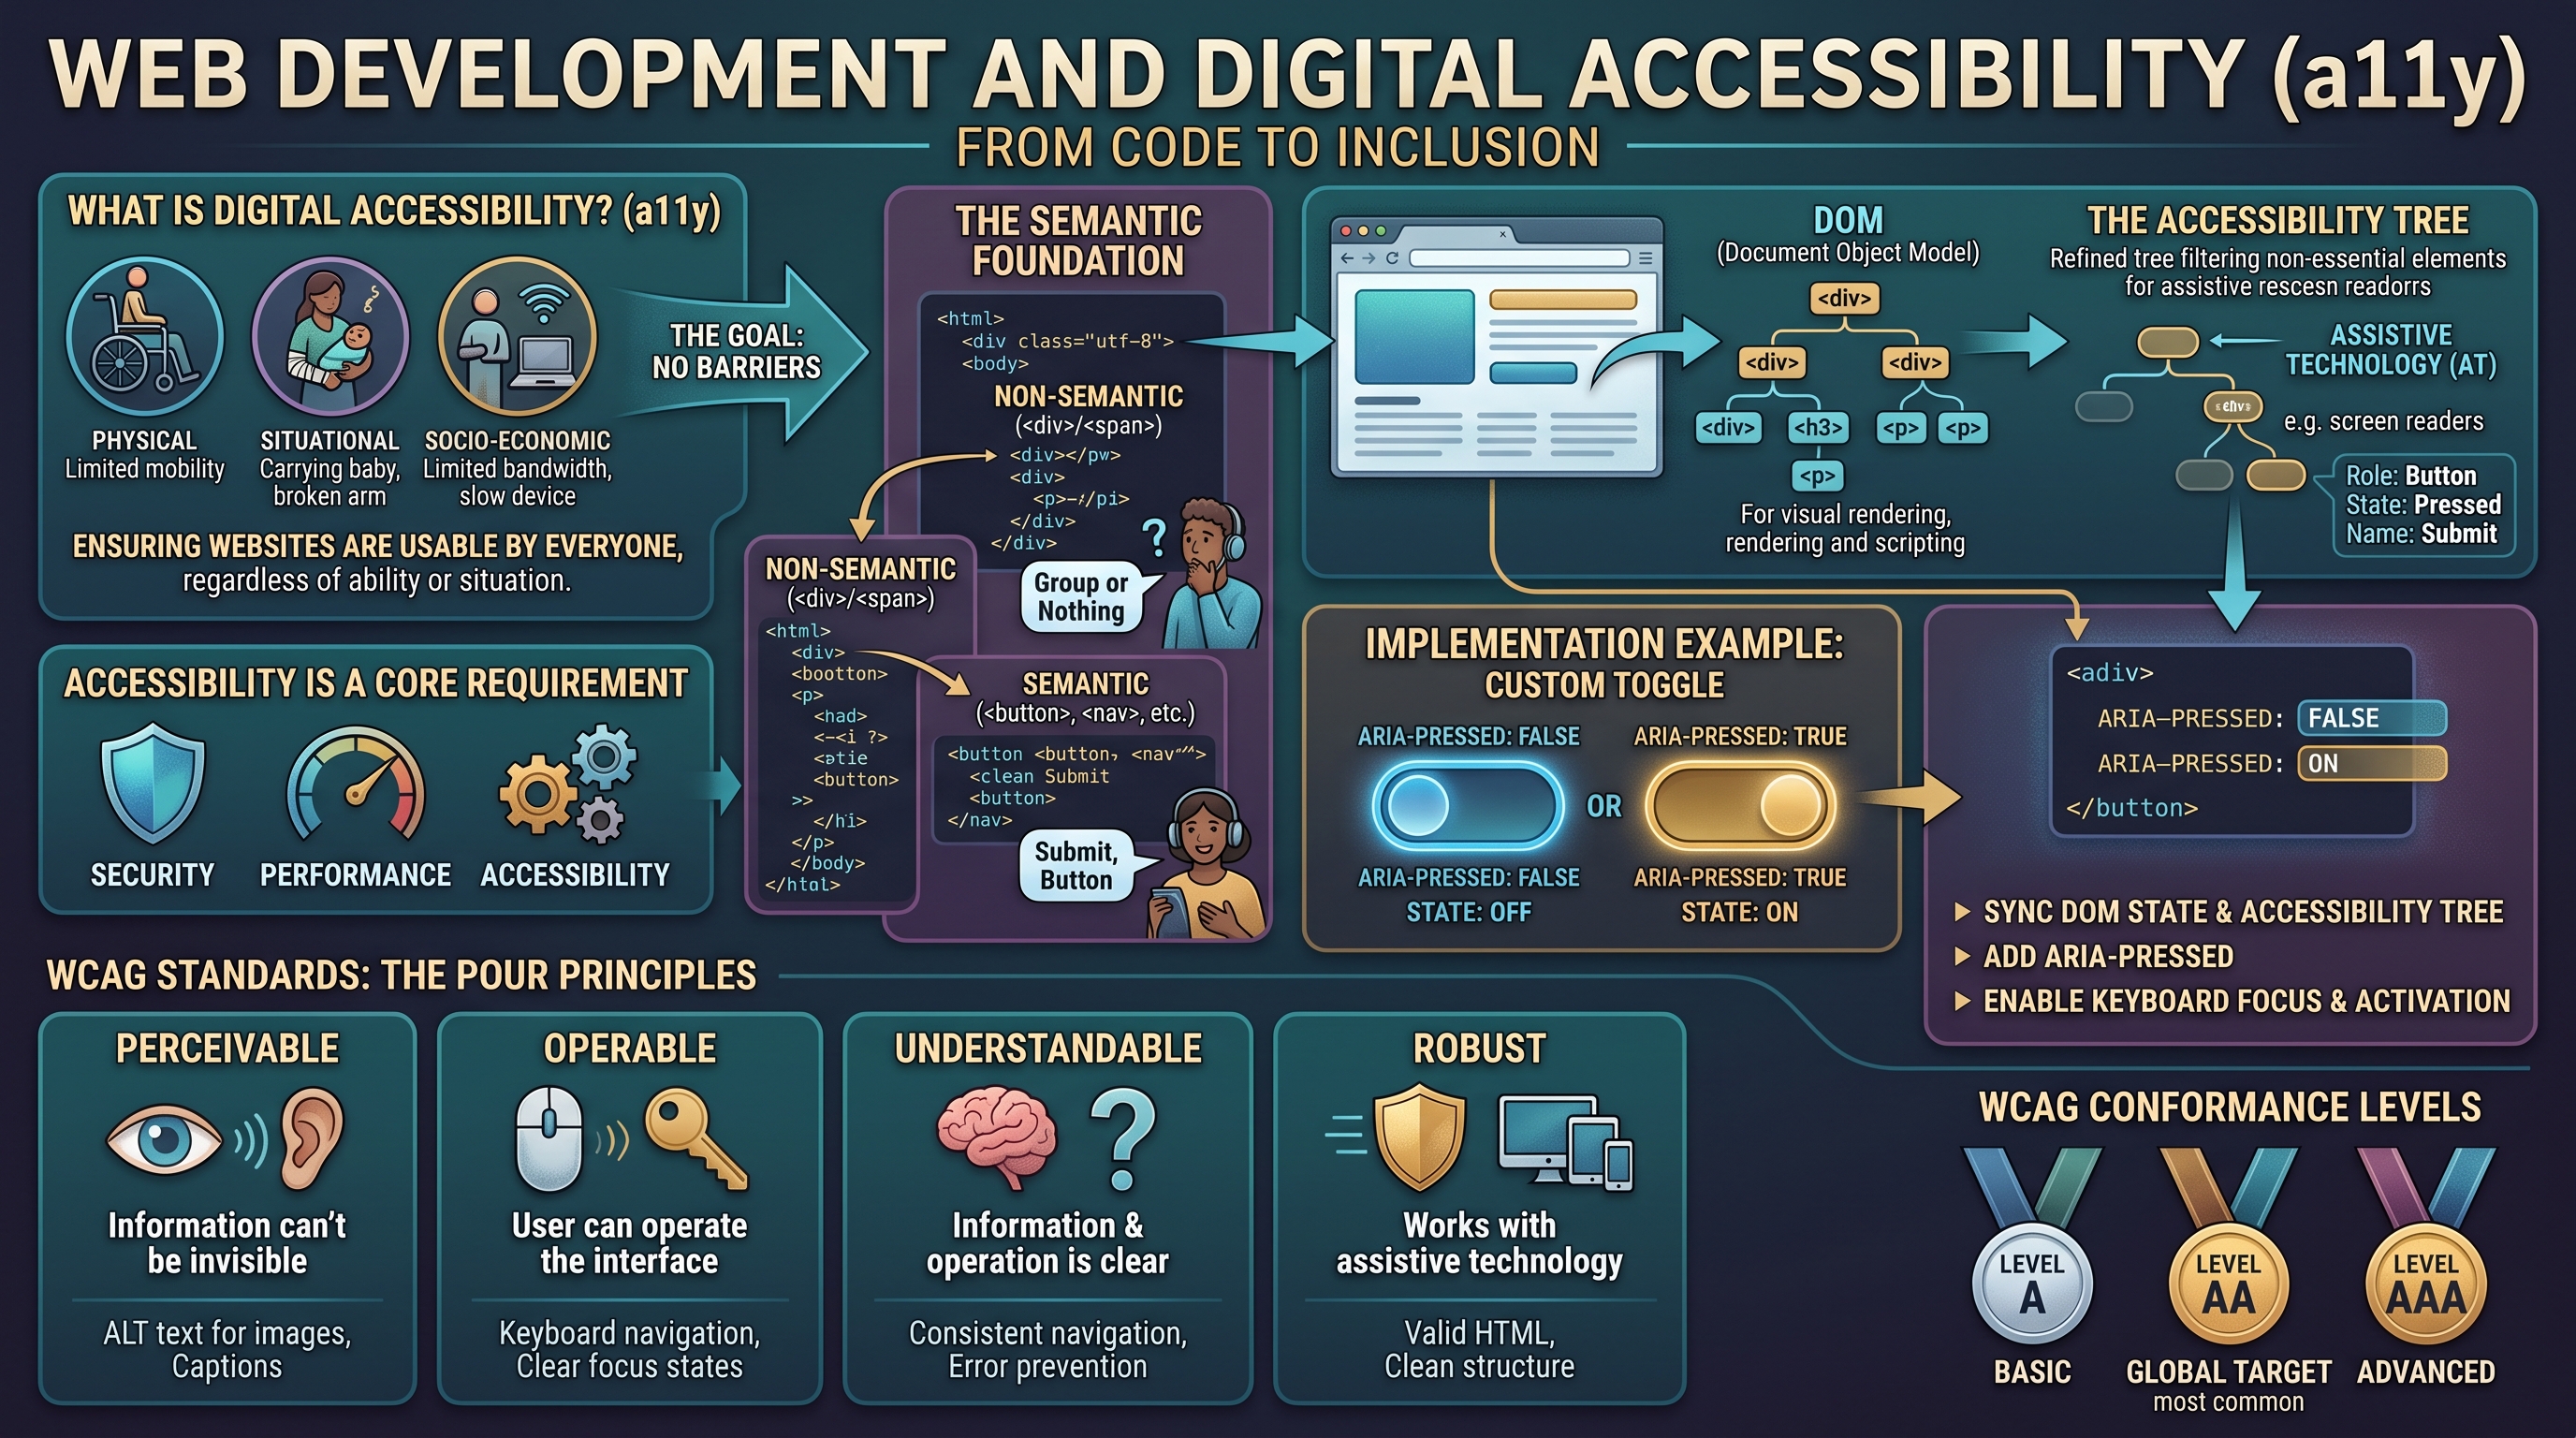
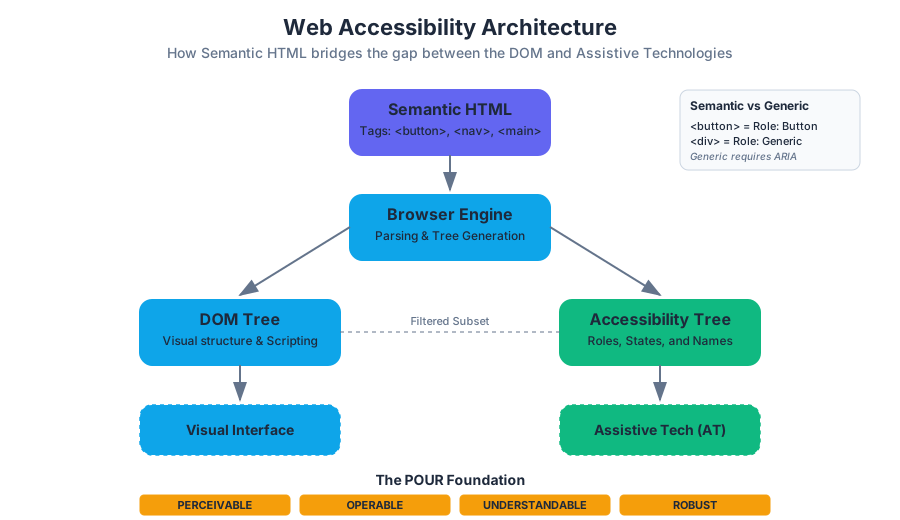
Information Systems for Strategic Advantage
Key concepts: Strategic Advantage · IS Components · Organizational Strategy · Globalized Society · Competitive Edge
Exploring how organizations use Information Systems to gain a competitive edge and manage operations beyond the organization.
Information Systems for Strategic Advantage
In the contemporary landscape of global commerce, Information Systems (IS) have evolved from back-office support functions into the primary engines of Strategic Advantage. A strategic advantage is not merely a temporary boost in sales; it is a sustainable, long-term edge over competitors achieved by leveraging resources in ways that are difficult to replicate. To understand how IS facilitates this, one must look beyond the "IT department" and view IS as a socio-technical assembly where technology meets organizational behavior.
Strategic advantage through IS occurs when an organization aligns its technical capabilities with its Organizational Strategy. This alignment allows firms to manipulate the competitive forces of their industry, optimize their internal value chains, and respond with agility to the shifts of a Globalized Society.
The Five Components of Information Systems
An Information System is more than just hardware and software. It is a complex ecosystem composed of five distinct but interdependent components. For an IS to provide a Competitive Edge, all five must function in harmony.
- Hardware: The physical substrate of computing. This includes servers, workstations, mobile devices, and networking equipment (routers, switches).
- Software: The instructions that govern hardware. This is bifurcated into System Software (OS, utilities) and Application Software (ERP, CRM, Office Suites).
- Data: The raw facts and figures collected by the system. When processed and contextualized, data becomes Information, the lifeblood of strategic decision-making.
- People: The most critical component. This includes the users who interact with the system, the developers who build it, and the leadership that directs its use.
- Processes: The series of steps or rules followed to achieve a specific business goal. Processes define how the other four components are utilized to create value.
Component Dynamics and Strategic Impact
| Component | Strategic Role | Complexity Driver | Key Metric |
|---|---|---|---|
| Hardware | Infrastructure Scalability | Moore’s Law, Power Consumption | Throughput / Latency |
| Software | Functional Agility | Technical Debt, Integration | Feature Velocity |
| Data | Decision Intelligence | Volume, Variety, Veracity | Data Integrity / Insights |
| People | Innovation & Execution | Digital Literacy, Culture | Adoption Rate |
| Processes | Operational Efficiency | Legacy Constraints, Compliance | Cycle Time |
Key Insight: The "Hard" components (Hardware, Software) are easily acquired by competitors. The "Soft" components (People, Processes) are the true sources of sustainable advantage because they are socially complex and difficult to imitate.
Strategic Frameworks for IS
To transform IS into a weapon for competition, organizations utilize established frameworks to identify where technology can exert the most leverage.
Porter’s Five Forces and IS Intervention
Michael Porter’s Five Forces framework helps a firm understand the intensity of competition in an industry. IS can be used to alter these forces in the firm's favor.
| Force | IS Strategic Intervention | Example |
|---|---|---|
| Threat of New Entrants | Create high "Entry Barriers" through massive capital investment in proprietary tech. | Amazon’s global logistics and AI-driven supply chain. |
| Bargaining Power of Buyers | Implement "Switching Costs" via integrated ecosystems or loyalty programs. | Apple’s iCloud and ecosystem lock-in. |
| Bargaining Power of Suppliers | Use B2B integrations to monitor supplier performance and switch easily. | Walmart’s Retail Link system for real-time inventory. |
| Threat of Substitutes | Continuous innovation and "Value-Add" services that software provides. | Streaming services replacing physical media. |
| Intensity of Rivalry | Cost leadership through automation or differentiation through data analytics. | High-frequency trading algorithms in finance. |
The Value Chain Model
The Value Chain disaggregates a firm into its strategically relevant activities. IS can optimize both Primary Activities (Inbound Logistics, Operations, Outbound Logistics, Marketing, Sales, Service) and Support Activities (Procurement, Technology Development, HR, Firm Infrastructure).
For instance, a firm might use a Database Management System (DBMS) to link its inbound logistics directly to its production schedule, a concept known as Just-In-Time (JIT) manufacturing. This reduces inventory costs and increases responsiveness.
Technical Implementation: The Hardware-Software Interface
At the lowest level, strategic advantage is built on the efficiency of the hardware-software interface. A senior engineer must understand how software interacts with the physical components to optimize performance.
/*
 * Example: Low-level memory mapping for a high-speed data ingestion
 * component in a Strategic Information System.
 * This demonstrates direct hardware interaction to minimize latency.
 */

#include <stdio.h>
#include <sys/mman.h>
#include <fcntl.h>
#include <unistd.h>

#define BUFFER_SIZE 4096
#define DEVICE_PATH "/dev/high_speed_sensor"

int main() {
    int fd = open(DEVICE_PATH, O_RDWR);
    if (fd < 0) {
        perror("Failed to open device");
        return 1;
    }

    // Map hardware device memory directly into the process address space
    // to bypass kernel-to-user space copying overhead.
    void *map_base = mmap(NULL, BUFFER_SIZE, PROT_READ | PROT_WRITE, MAP_SHARED, fd, 0);

    if (map_base == MAP_FAILED) {
        perror("mmap failed");
        close(fd);
        return 1;
    }

    // Strategic Advantage: Processing data at wire speed
    volatile unsigned int *data_ptr = (volatile unsigned int *)map_base;
    printf("Real-time telemetry data: %u\n", *data_ptr);

    munmap(map_base, BUFFER_SIZE);
    close(fd);
    return 0;
}
Data Management and Business Intelligence
Data is the raw material of the information age. However, data in its raw form is useless. It must be organized using a Database Management System (DBMS) and analyzed using Business Intelligence (BI) tools.
The Relational Model
Most enterprise systems rely on the relational model, where data is stored in tables with defined relationships. This structure ensures Data Integrity and allows for complex querying.
-- Strategic Query: Identifying high-value customers who haven't
-- purchased in 30 days to trigger a targeted marketing automation.

SELECT
    c.customer_id,
    c.customer_name,
    SUM(o.order_total) AS lifetime_value,
    MAX(o.order_date) AS last_purchase_date
FROM
    Customers c
JOIN
    Orders o ON c.customer_id = o.customer_id
WHERE
    c.status = 'Active'
GROUP BY
    c.customer_id, c.customer_name
HAVING
    MAX(o.order_date) < DATE_SUB(CURDATE(), INTERVAL 30 DAY)
    AND SUM(o.order_total) > 5000
ORDER BY
    lifetime_value DESC;
IS in a Globalized Society
The globalization of the economy is both a result of and a driver for advanced Information Systems. IS allows companies to operate as Transnational Organizations, where geographic boundaries are blurred by high-speed networks and cloud computing.
Global IS Strategies
| Strategy | Configuration | IS Requirement |
|---|---|---|
| Domestic Exporter | Centralized at headquarters. | Strong centralized ERP; basic remote access. |
| Multinational | Financial control centralized; operations decentralized. | Localized IS instances with consolidated reporting. |
| Franchiser | Duplicated systems in local units. | Standardized software stacks; rigid process control. |
| Transnational | Integrated global network; no single HQ focus. | High-bandwidth global backbone; distributed databases. |
Cloud Computing and Scalability
Cloud Computing (IaaS, PaaS, SaaS) has democratized strategic advantage. Small firms can now access the same compute power as global giants, shifting the focus from owning assets to orchestrating services. This provides Scalability, allowing a firm to grow its infrastructure instantly in response to market demand.
Ethics, Governance, and Security
As IS becomes more central to strategic advantage, the risks associated with it increase. Information Literacy and Ethics are no longer just "soft skills"; they are components of risk management.
- Cybersecurity: Protecting the IS from unauthorized access. A breach can destroy a firm's reputation and its competitive edge overnight.
- Privacy and Law: Compliance with regulations like GDPR or CCPA is a strategic necessity. Failure to comply leads to massive fines and loss of consumer trust.
- Digital Ethics: The moral implications of data usage, such as algorithmic bias in AI or the environmental impact of large data centers.
Risk Mitigation Framework
\text{Risk} = \text{Threat} \times \text{Vulnerability} \times \text{Asset Value}
To maximize strategic advantage, firms must minimize risk without stifling innovation. This is achieved through IT Governance—the framework that ensures IT investments support business objectives while managing risks.
# Example: A simple risk assessment script to prioritize
# security patches based on asset criticality and vulnerability score.

import pandas as pd

# Mock data representing system assets and their vulnerabilities
assets = [
    {"name": "Customer DB", "criticality": 10, "cvss_score": 9.8},
    {"name": "Public Website", "criticality": 5, "cvss_score": 7.5},
    {"name": "Internal Wiki", "criticality": 2, "cvss_score": 4.0},
    {"name": "Payment Gateway", "criticality": 10, "cvss_score": 8.5}
]

def calculate_priority(asset_list):
    df = pd.DataFrame(asset_list)
    # Priority is a function of asset importance and vulnerability severity
    df['priority_score'] = df['criticality'] * df['cvss_score']
    return df.sort_values(by='priority_score', ascending=False)

# Strategic Output: Focus resources on the Payment Gateway and Customer DB first
print(calculate_priority(assets))
Common Pitfalls in Strategic IS
Despite the potential, many IS projects fail to deliver strategic advantage. Common reasons include:
- The Productivity Paradox: Investing in IT without seeing a corresponding increase in productivity, often due to poor process alignment.
- Technological Determinism: The belief that buying the "best" technology will automatically solve business problems.
- Lack of Strategic Alignment: Building systems that are technically impressive but do not support the core business goals.
- Ignoring the "People" Component: Underestimating the resistance to change or the need for training.
Conclusion: The Future of Strategic IS
The next frontier of strategic advantage lies in Artificial Intelligence (AI) and Data Analytics. As we move toward a more automated and data-driven world, the ability to process vast amounts of unstructured data into actionable insights will be the primary differentiator. However, the fundamentals remain the same: technology is a tool, but the strategy is human.
- Information System (IS): A set of five components (Hardware, Software, Data, People, Process) that work together to manage information.
- Strategic Advantage: A position where a firm has an edge over its rivals, often through unique IS applications.
- Porter’s Five Forces: A framework for analyzing industry competition (Buyers, Suppliers, Substitutes, New Entrants, Rivalry).
- Value Chain: The series of internal activities a firm performs to create value for customers.
- DBMS: Database Management System; software used to create, process, and administer databases.
- Scalability: The ability of a system to handle growing amounts of work or its potential to be enlarged to accommodate that growth.
- IT Governance: The processes that ensure the effective and efficient use of IT in enabling an organization to achieve its goals.
- Moore’s Law: The observation that the number of transistors on a microchip doubles about every two years, though the cost of computers is halved.
-
Which component of an Information System is considered the most difficult for competitors to copy?
- A) Hardware
- B) Software
- C) Processes
- D) Data
- Answer: C (Processes, along with People, are socially complex and embedded in culture).
-
How does an IS help create an "Entry Barrier" in Porter's Five Forces?
- A) By making it cheaper for customers to switch.
- B) By requiring new competitors to spend heavily on technology to match the incumbent's efficiency.
- C) By reducing the number of suppliers.
- D) By increasing the price of the final product.
- Answer: B.
-
In the context of the Value Chain, which of the following is a "Support Activity"?
- A) Inbound Logistics
- B) Marketing and Sales
- C) Technology Development
- D) Customer Service
- Answer: C.
-
What is the "Productivity Paradox"?
- A) The fact that more computers always lead to more work.
- B) The observation that increased investment in IT does not always result in measurable productivity gains.
- C) The idea that software becomes obsolete as soon as it is released.
- D) The difficulty of training people to use new hardware.
- Answer: B.
-
Which global IS strategy involves a highly integrated network where operations are managed globally without a single headquarters focus?
- A) Domestic Exporter
- B) Multinational
- C) Franchiser
- D) Transnational
- Answer: D.
Strategic IS Mastery Checklist
- Understand the 5 Components: Can you explain how hardware, software, data, people, and processes interact in a real-world scenario (e.g., an e-commerce site)?
- Apply Porter’s Forces: Pick a company (like Netflix or Uber) and identify how they use IS to manipulate at least three of the five forces.
- Value Chain Analysis: Trace a product from raw materials to the customer. Where does IS add value at each step?
- Technical Literacy: Understand the difference between a flat file and a relational database. Why is a DBMS essential for strategic data use?
- Global Context: Explain how cloud computing has changed the "Entry Barrier" for small businesses.
- Ethics & Security: Define the relationship between IT Governance and Risk Management. Why is cybersecurity a strategic rather than just a technical issue?
- Software Proficiency: Practice basic data manipulation in Excel and understand how SQL queries extract strategic insights from data.
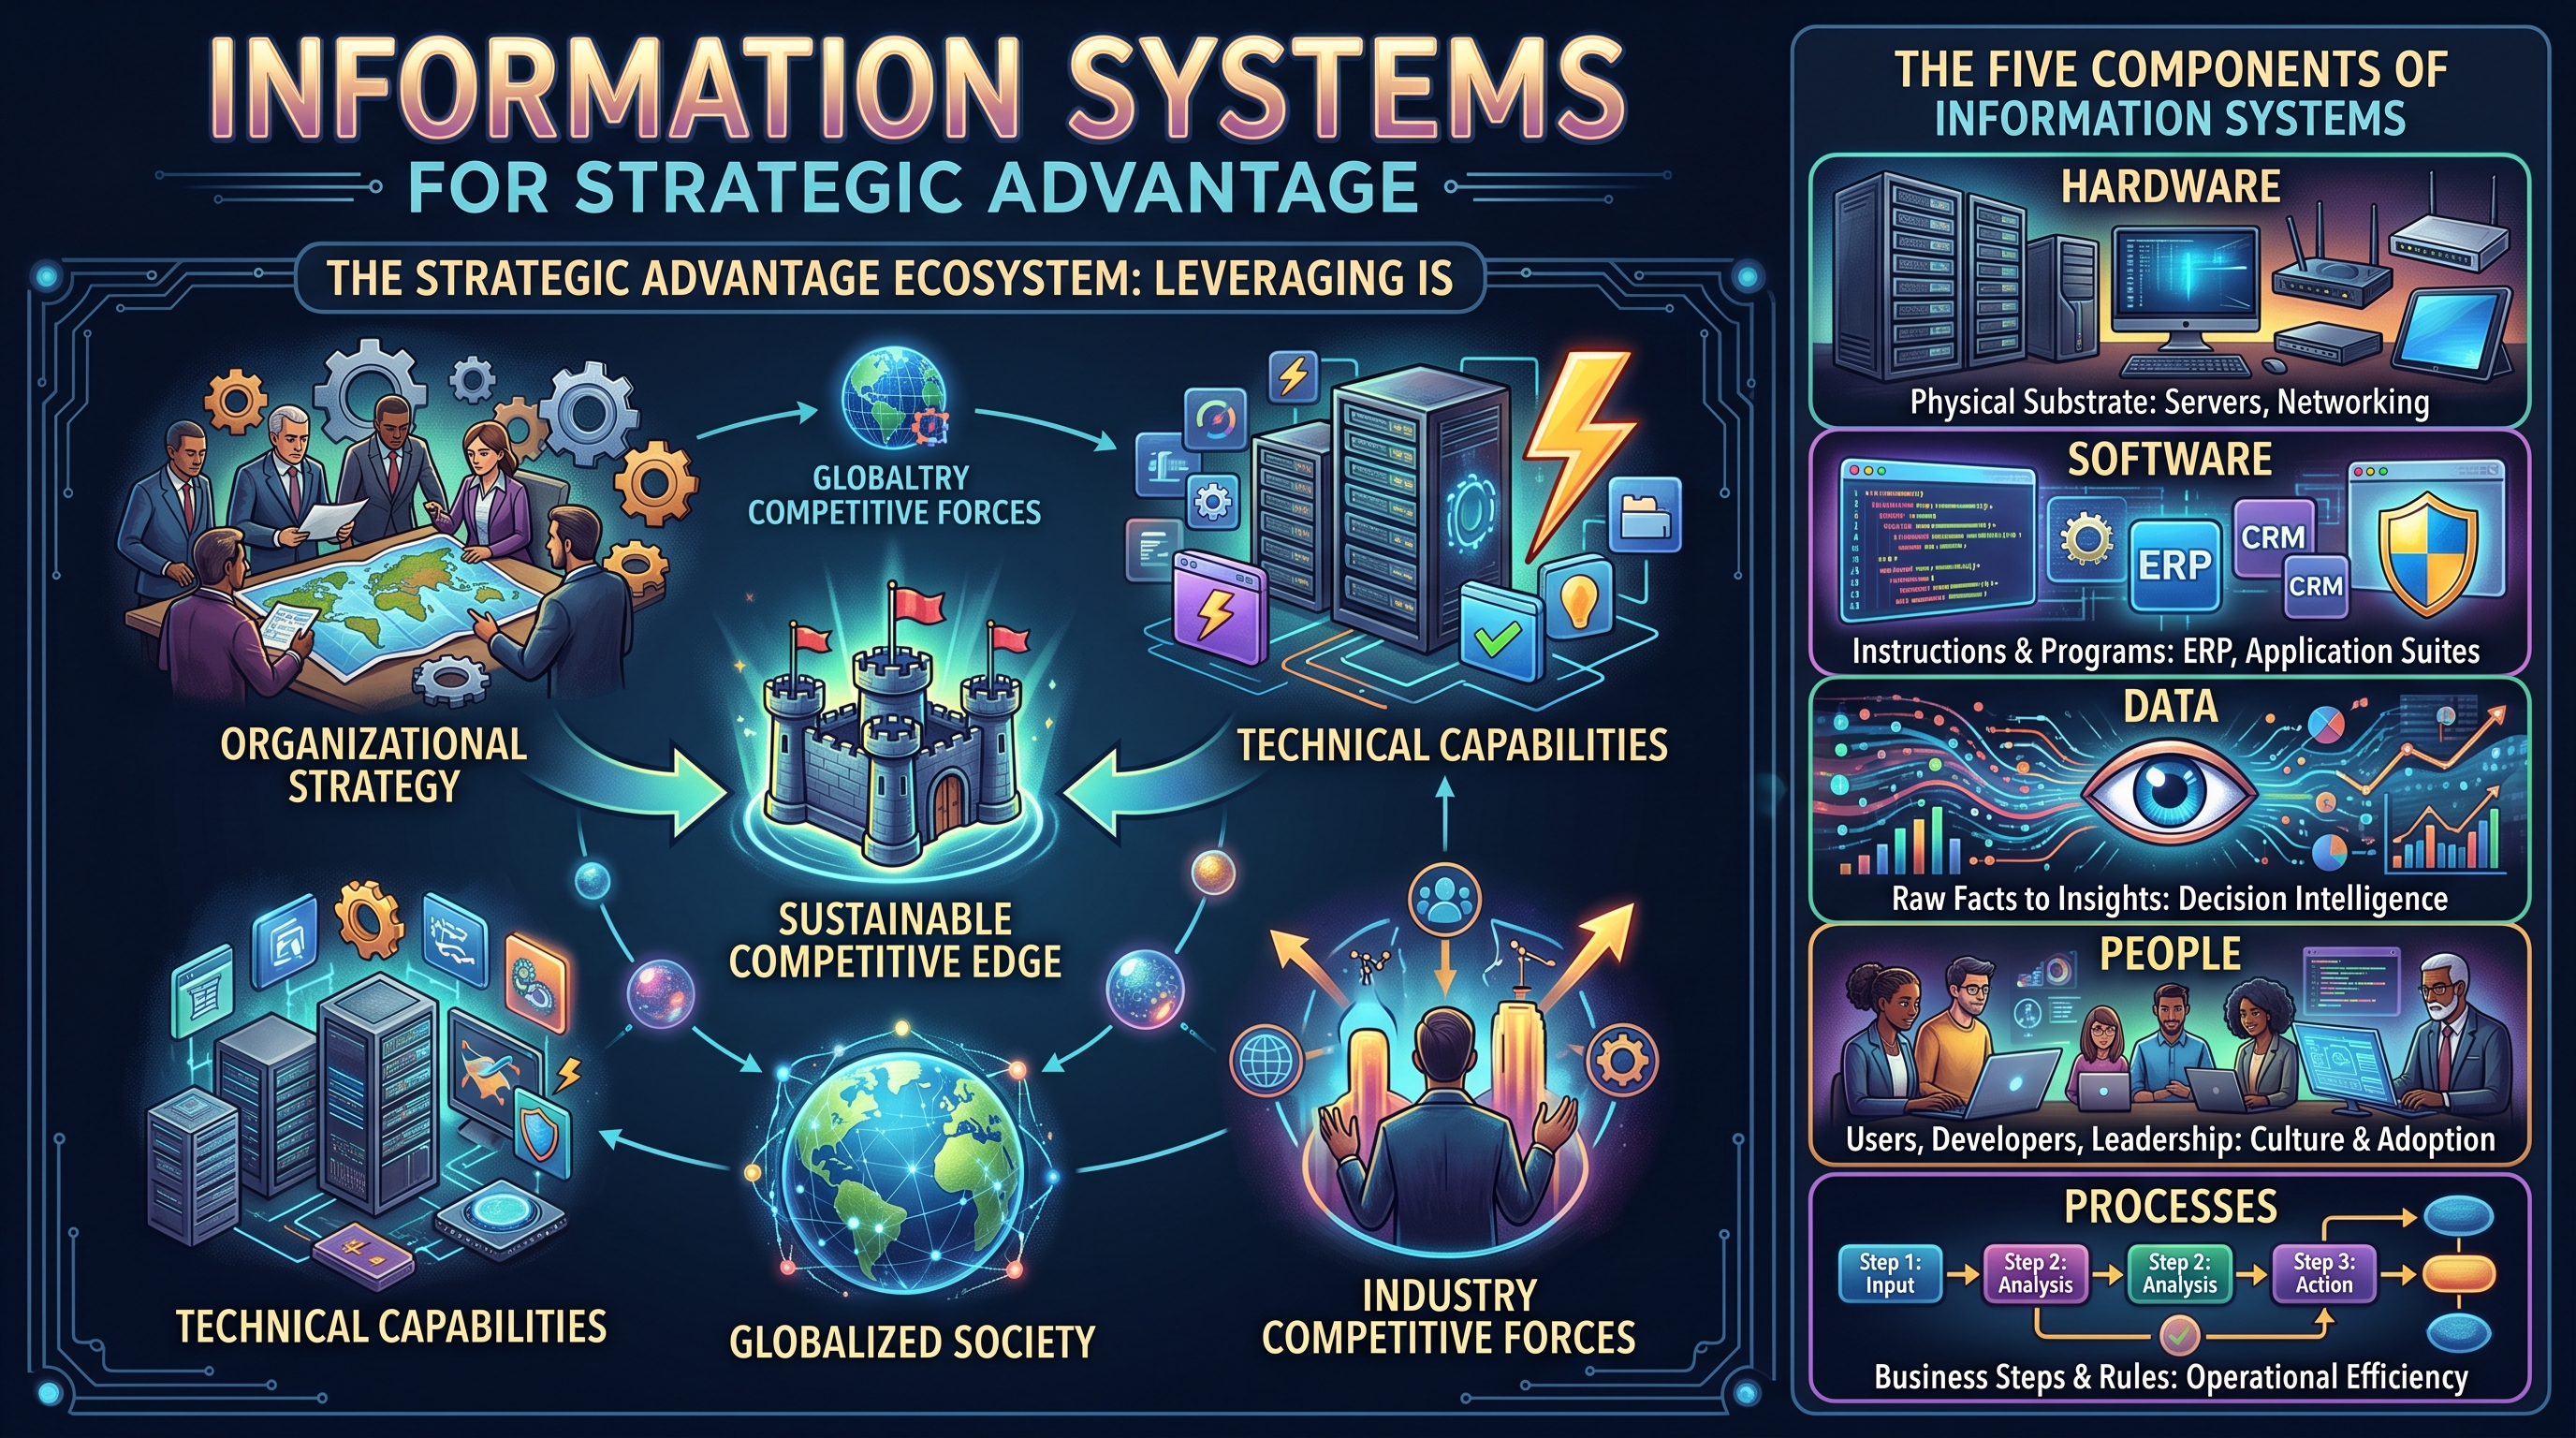
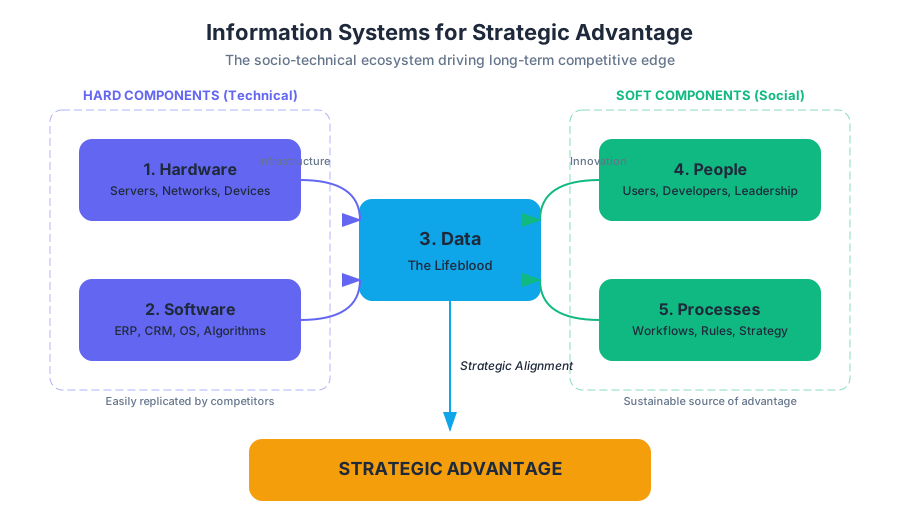
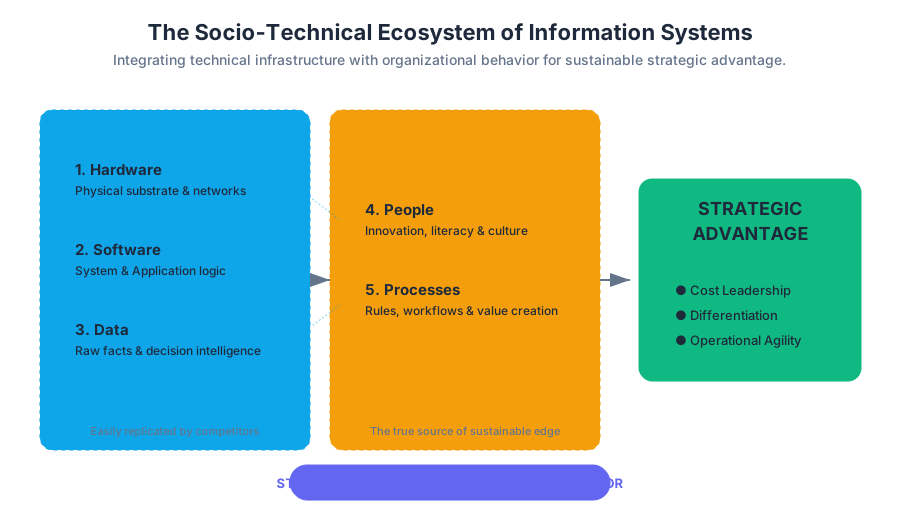
Data Management and Database Systems
Key concepts: Database Management Systems (DBMS) · Information Retrieval · Microsoft Access · Data Modeling · Data Privacy
A deep dive into how data is structured, stored, and retrieved using Database Management Systems (DBMS).
Data Management and Database Systems
In the taxonomy of modern information systems, data management represents the foundational layer upon which all higher-level logic—from business intelligence to artificial intelligence—is constructed. While a spreadsheet might suffice for a personal budget, enterprise-scale operations demand a more rigorous architecture. This section explores the transition from flat-file data storage to the sophisticated world of Database Management Systems (DBMS), the mathematical rigor of Data Modeling, and the critical imperatives of Data Privacy.
The Database Management System (DBMS)
A Database Management System (DBMS) is a specialized software suite designed to define, create, maintain, and control access to a database. It acts as an intermediary between the end-user and the physical data stored on disk, ensuring that data remains consistent, accessible, and secure.
Definition: A DBMS is a collection of programs that enables users to store, modify, and extract information from a database. It provides an abstraction layer that hides the physical details of data storage (such as file formats and hardware addresses) from the logical view of the data.
The Three-Schema Architecture
To achieve data independence, most modern DBMS implementations follow the ANSI-SPARC three-schema architecture:
- External Level (User Views): How individual users see the data (e.g., a salesperson sees customer orders, while HR sees employee records).
- Conceptual Level (Logical Schema): The community view of the entire database structure, defining entities, relationships, and constraints.
- Internal Level (Physical Schema): How the data is actually stored on the storage media, including indexing structures and block sizes.
The ACID Properties
For a DBMS to be considered reliable, especially in financial or mission-critical environments, it must adhere to the ACID properties:
| Property | Description | Technical Implication |
|---|---|---|
| Atomicity | "All or nothing." Transactions are atomic units. | If a power failure occurs mid-transaction, the system rolls back to the start. |
| Consistency | Data must move from one valid state to another. | Integrity constraints (e.g., non-negative bank balance) are never violated. |
| Isolation | Concurrent transactions do not interfere with each other. | Intermediate states of a transaction are invisible to other transactions. |
| Durability | Once committed, data remains committed even after a crash. | Changes are written to non-volatile storage (WAL - Write Ahead Logging). |
Data Modeling and Normalization
Data Modeling is the process of creating a visual representation of an entire information system or parts of it to communicate connections between data points and structures. The most common tool for this is the Entity-Relationship Diagram (ERD).
The Normalization Process
Normalization is a systematic approach of decomposing tables to eliminate data redundancy and undesirable characteristics like Insertion, Update, and Deletion Anomalies. It is governed by a series of "Normal Forms" (NF).
- First Normal Form (1NF): Eliminate duplicate columns and ensure all attributes are atomic (no multi-valued attributes).
- Second Normal Form (2NF): Meet 1NF and ensure all non-key attributes are fully functionally dependent on the entire primary key (eliminate partial dependencies).
- Third Normal Form (3NF): Meet 2NF and ensure no non-key attribute is transitively dependent on the primary key.
The Normalization Mantra: "The data depends on the key [1NF], the whole key [2NF], and nothing but the key [3NF], so help me Codd." (Referring to Edgar F. Codd, the father of the relational model).
Worked Example: Normalizing a Sales Record
Consider a flat table: Sales(OrderID, CustomerID, CustomerName, ProductID, Price).
- 1NF: Ensure each cell has one value.
- 2NF: If
OrderIDandProductIDform a composite key,CustomerNamedepends only onCustomerID, not the whole key. We must split this. - 3NF: If
Pricedepends onProductID, andProductIDis part of the key, but we have other attributes depending on other things, we ensure no "chains" of dependency exist.
Information Retrieval and SQL
Information Retrieval (IR) in the context of databases is primarily achieved through Structured Query Language (SQL). SQL is a declarative language, meaning the user specifies what they want, and the DBMS's query optimizer determines how to get it.
Relational Algebra Foundations
SQL is grounded in relational algebra. Every SELECT statement is essentially a combination of:
- Selection ($\sigma$): Filtering rows based on a condition.
- Projection ($\pi$): Choosing specific columns.
- Join ($\bowtie$): Combining rows from two or more tables based on a related column.
Code Block 1: Low-Level SQL Implementation
The following example demonstrates the creation of a relational schema with strict integrity constraints and a trigger for automated data management.
-- Creating a robust schema for a Library System
CREATE TABLE Authors (
    AuthorID INT PRIMARY KEY GENERATED ALWAYS AS IDENTITY,
    FullName VARCHAR(255) NOT NULL,
    BirthYear INT CHECK (BirthYear > 0 AND BirthYear <= EXTRACT(YEAR FROM CURRENT_DATE))
);

CREATE TABLE Books (
    ISBN VARCHAR(13) PRIMARY KEY,
    Title VARCHAR(500) NOT NULL,
    AuthorID INT,
    StockCount INT DEFAULT 0,
    CONSTRAINT fk_author
        FOREIGN KEY(AuthorID)
        REFERENCES Authors(AuthorID)
        ON DELETE SET NULL
);

-- A Trigger to prevent negative stock levels
CREATE OR REPLACE FUNCTION check_stock_level()
RETURNS TRIGGER AS $$
BEGIN
    IF NEW.StockCount < 0 THEN
        RAISE EXCEPTION 'Stock count cannot be negative for ISBN %', NEW.ISBN;
    END IF;
    RETURN NEW;
END;
$$ LANGUAGE plpgsql;

CREATE TRIGGER trg_stock_check
BEFORE UPDATE ON Books
FOR EACH ROW EXECUTE FUNCTION check_stock_level();
Code Block 2: Relational Algebra and Query Logic (Pseudocode)
Understanding how the DBMS processes a join is crucial for optimization. Below is the logic for a Nested Loop Join, the most basic join algorithm.
ALGORITHM NestedLoopJoin(Table R, Table S, Condition C):
    ResultBuffer = []
    FOR EACH row r IN R:
        FOR EACH row s IN S:
            IF C(r, s) IS TRUE:
                combined_row = concatenate(r, s)
                APPEND combined_row TO ResultBuffer
    RETURN ResultBuffer

COMPLEXITY ANALYSIS:
    Time Complexity: O(|R| * |S|)
    Space Complexity: O(1) (excluding result set)
    Optimization: If S is indexed on the join key, complexity drops to O(|R| * log|S|)
Microsoft Access: Desktop Database Management
Microsoft Access occupies a unique niche as a "Desktop DBMS." Unlike enterprise systems (SQL Server, Oracle, PostgreSQL), Access combines a relational engine (ACE/Jet) with a graphical user interface (GUI) and software development tools.
Key Components of Access
- Tables: The physical storage of data.
- Queries: The SQL-based engine for data manipulation.
- Forms: The user interface for data entry.
- Reports: The output mechanism for data visualization.
Comparison: Access vs. Enterprise RDBMS
| Feature | Microsoft Access | SQL Server / PostgreSQL |
|---|---|---|
| Architecture | File-server (Client processes data) | Client-server (Server processes data) |
| Max Size | 2 GB | Terabytes / Petabytes |
| Concurrent Users | 1–10 (ideal) | Thousands |
| Deployment | Local/Shared Drive | Cloud / Dedicated Server |
| Use Case | Rapid Prototyping, Small Business | Enterprise Applications, Web Backends |
Data Privacy and Security
As databases aggregate vast amounts of sensitive information, Data Privacy becomes a legal and ethical mandate. This involves protecting data from unauthorized access (Security) and ensuring that data is handled according to the rights of the individual (Privacy).
Security Mechanisms
- Authentication: Verifying who the user is (e.g., Multi-Factor Authentication).
- Authorization: Defining what the user can do (Role-Based Access Control - RBAC).
- Encryption:
- At Rest: Encrypting the physical files on the disk (AES-256).
- In Transit: Using TLS/SSL to protect data moving over the network.
Data Masking and Anonymization
For testing or analytical purposes, sensitive data must often be "masked."
- Static Masking: Creating a copy of the database with scrambled data.
- Dynamic Masking: Scrambling data on-the-fly based on the user's permissions.
Code Block 3: Real-World Usage (Python for Data Privacy)
In modern pipelines, we often use Python to interact with databases while ensuring sensitive fields are hashed or encrypted before storage.
import hashlib
import sqlite3
from cryptography.fernet import Fernet

# Generate a key for symmetric encryption
key = Fernet.generate_key()
cipher_suite = Fernet(key)

def process_user_data(email, ssn):
    """
    Hashes the email for indexing and encrypts the SSN for privacy.
    """
    # Hashing (One-way) for the unique identifier
    hashed_email = hashlib.sha256(email.encode()).hexdigest()

    # Encryption (Two-way) for sensitive data
    encrypted_ssn = cipher_suite.encrypt(ssn.encode())

    # Database interaction
    conn = sqlite3.connect('secure_storage.db')
    cursor = conn.cursor()
    cursor.execute("INSERT INTO users (email_hash, ssn_blob) VALUES (?, ?)",
                   (hashed_email, encrypted_ssn))
    conn.commit()
    conn.close()
    print(f"User {hashed_email[:10]}... stored securely.")

# Example Invocation
process_user_data("professor@university.edu", "999-00-1234")
Common Pitfalls in Data Management
- Over-Normalization: While 3NF is great for integrity, it can lead to "Join Hell," where a simple query requires joining 10+ tables, severely degrading performance. In read-heavy systems, some denormalization is often necessary.
- Ignoring Indexing: Without indexes, the DBMS must perform a "Full Table Scan" for every query. However, too many indexes slow down
INSERTandUPDATEoperations because the index must be updated along with the table. - The "Flat File" Mindset: Treating a database like an Excel sheet (e.g., putting multiple values in one cell or creating columns like
Phone1,Phone2,Phone3) violates the fundamental principles of the relational model. - Lack of Backup Testing: A backup is only as good as its last successful restore. Many organizations discover their backups are corrupted only when a disaster occurs.
Advanced Retrieval: Query Optimization
When a user submits a query, the DBMS does not execute it immediately. It passes through a Query Optimizer.
The Optimization Pipeline
- Parser: Checks the SQL syntax.
- Binder: Checks if the tables and columns actually exist.
- Optimizer: Evaluates multiple "Execution Plans." It uses statistics (histograms of data distribution) to decide whether to use an index or a sequential scan.
- Executor: Runs the chosen plan and returns the results.
Code Block 4: Performance Comparison (CLI)
Using the EXPLAIN ANALYZE command in PostgreSQL to see how the optimizer handles a query before and after adding an index.
# 1. Querying without an index
psql -d university -c "EXPLAIN ANALYZE SELECT * FROM students WHERE last_name = 'Smith';"

# Output: Seq Scan on students  (cost=0.00..18.50 rows=1 width=244) (actual time=0.050..0.052 rows=1 loops=1)

# 2. Adding a B-Tree index
psql -d university -c "CREATE INDEX idx_lastname ON students(last_name);"

# 3. Querying with an index
psql -d university -c "EXPLAIN ANALYZE SELECT * FROM students WHERE last_name = 'Smith';"

# Output: Index Scan using idx_lastname on students (cost=0.15..8.17 rows=1 width=244) (actual time=0.012..0.013 rows=1 loops=1)
# Result: Execution time decreased by ~75%!
Conclusion
Data management is the art of balancing the rigid constraints of mathematical logic (Normalization) with the messy realities of hardware performance and human error. By leveraging a robust DBMS, adhering to ACID properties, and maintaining a focus on privacy, organizations can transform raw data into a strategic asset.
- DBMS: Database Management System; software that manages and interacts with the database.
- ACID: Atomicity, Consistency, Isolation, Durability; the four pillars of reliable transactions.
- Normalization: The process of organizing data to reduce redundancy and improve integrity.
- 3NF: Third Normal Form; a state where all attributes depend only on the primary key.
- Relational Algebra: The mathematical foundation of SQL queries ($\sigma, \pi, \bowtie$).
- Primary Key: A unique identifier for a record in a table.
- Foreign Key: A field that links one table to the primary key of another.
- RBAC: Role-Based Access Control; a method of regulating access based on user roles.
-
Which ACID property ensures that a transaction is rolled back if a system failure occurs mid-execution?
- A) Consistency
- B) Durability
- C) Atomicity
- D) Isolation (Answer: C)
-
In the context of normalization, what is a "transitive dependency"?
- A) When a non-key attribute depends on another non-key attribute.
- B) When a primary key depends on a foreign key.
- C) When a table has no primary key.
- D) When a column has multiple values. (Answer: A)
-
Why is Microsoft Access considered a "Desktop DBMS" rather than an "Enterprise DBMS"?
- A) It does not support SQL.
- B) It uses a file-server architecture where the client does the processing.
- C) It cannot store more than 1,000 records.
- D) It does not support relationships between tables. (Answer: B)
-
What is the primary purpose of a Database Index?
- A) To encrypt sensitive data.
- B) To reduce the physical size of the database on disk.
- C) To speed up data retrieval at the cost of slower writes.
- D) To ensure that no two rows are identical. (Answer: C)
Data Management Mastery Checklist
- Understand the Shift: Can you explain why a company would move from Excel to a SQL-based DBMS?
- Normalization Drill: Given a sample invoice, can you break it down into 1NF, 2NF, and 3NF tables?
- SQL Proficiency: Can you write a
JOINquery that connects three tables and filters the results? - Security Awareness: Do you know the difference between encryption "at rest" and "in transit"?
- Tool Selection: When would you recommend Microsoft Access over a system like PostgreSQL?
- Performance: Do you understand how a B-Tree index speeds up a search from $O(N)$ to $O(\log N)$?
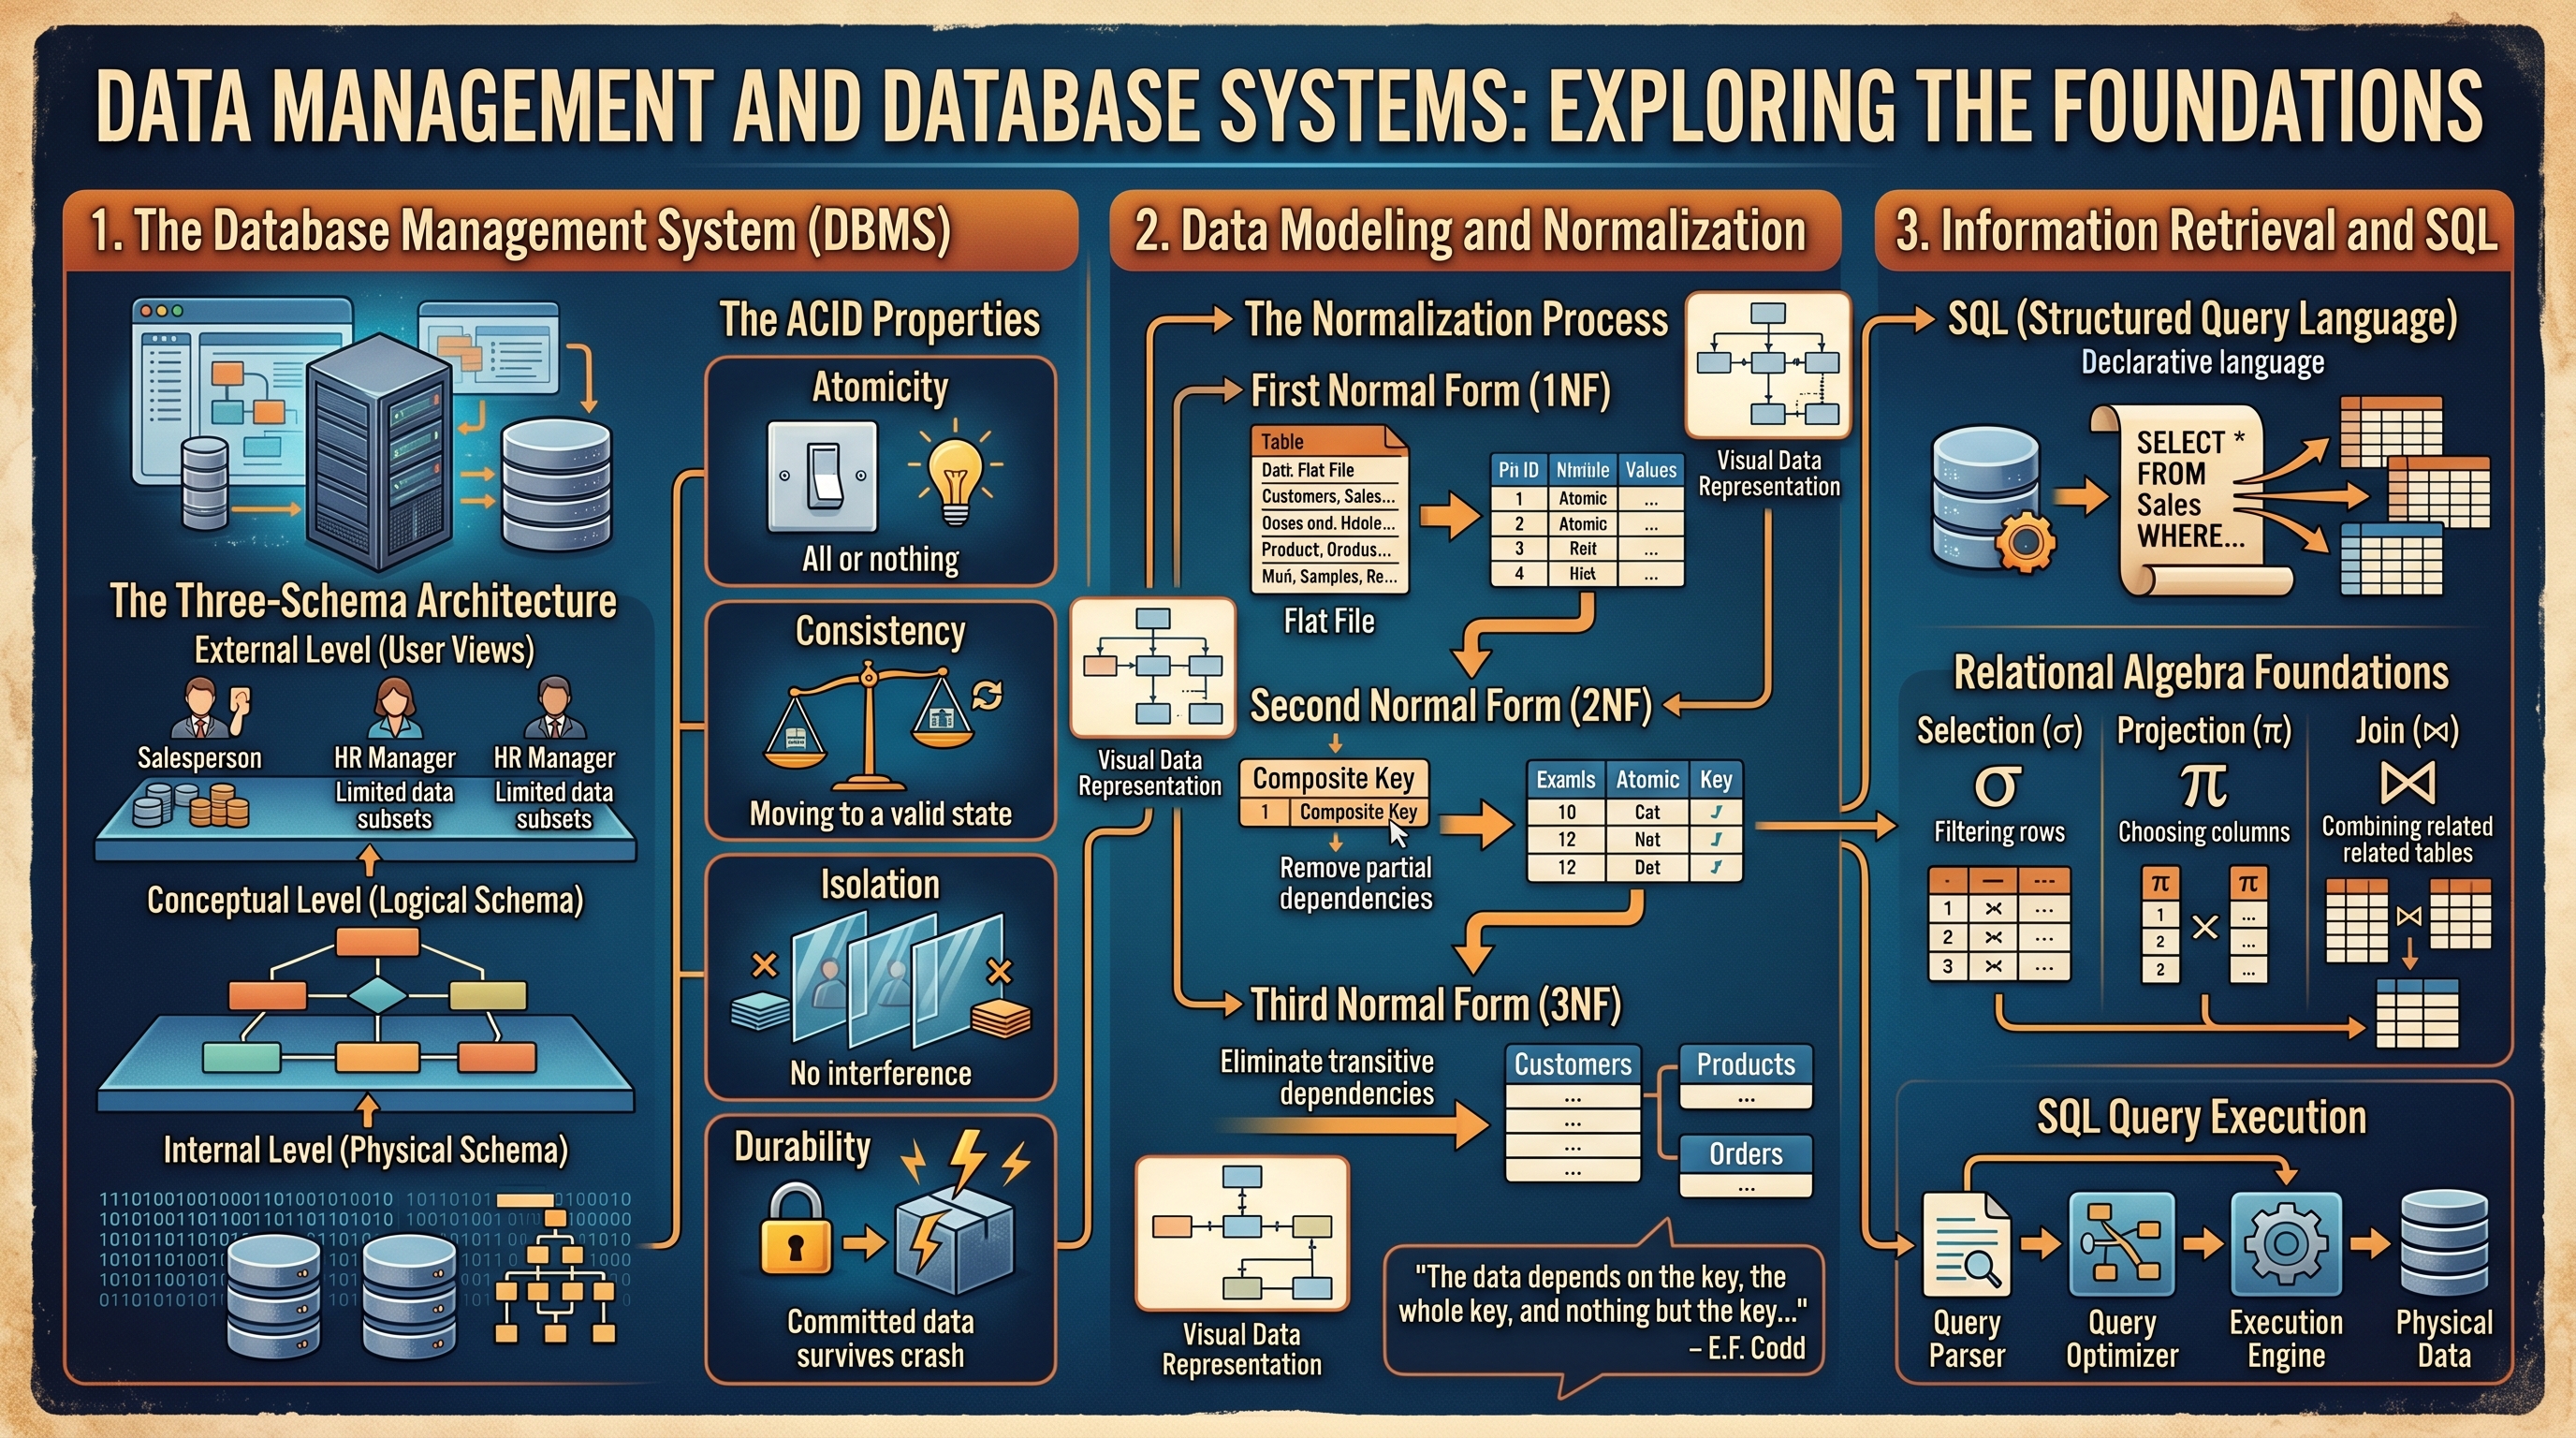
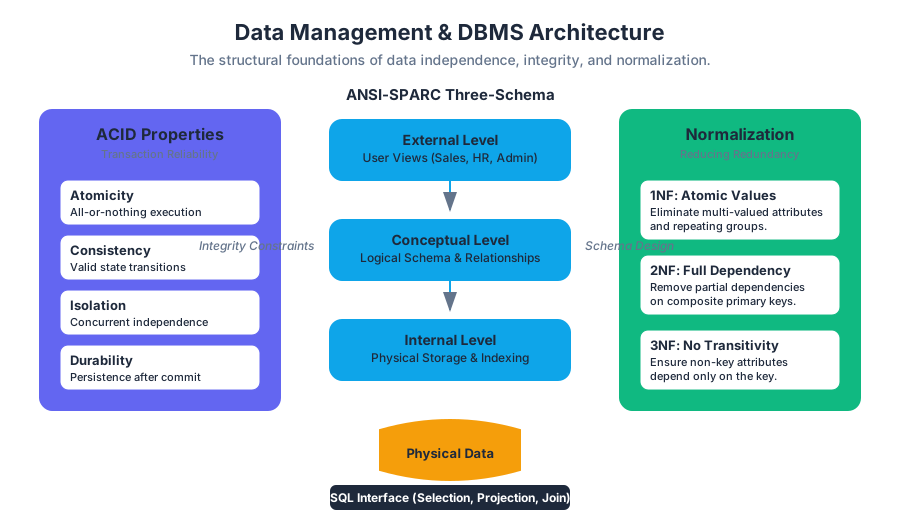
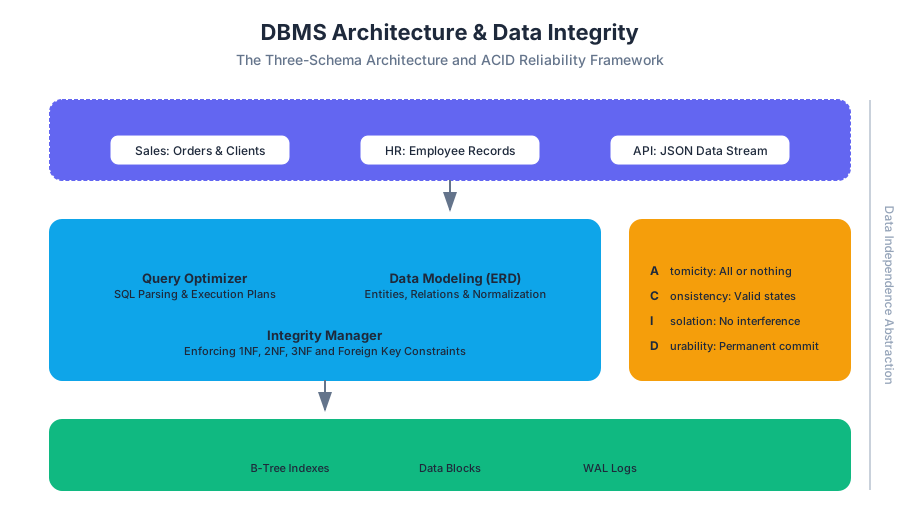
Systems Analysis, Design, and Security
Key concepts: Systems Analysis and Design · Cybersecurity · Risk Management · Enterprise Security · Data Privacy
The lifecycle of information systems development and the critical role of cybersecurity and risk management.
Systems Analysis, Design, and Security
The modern enterprise is a complex tapestry of hardware, software, data, and human processes. Building and maintaining these systems is not merely a task of writing code; it is a rigorous discipline of Systems Analysis and Design (SAD), underpinned by a robust framework of Cybersecurity and Risk Management. In an era where data is the primary currency, the integration of security into the very architecture of a system—rather than as an afterthought—is the hallmark of professional engineering.
This article explores the methodologies used to analyze business needs, the architectural principles of system design, and the multi-layered security strategies required to protect organizational assets in a globalized, digital economy.
The Foundations of Systems Analysis and Design (SAD)
Systems Analysis and Design is the process of examining a business situation, identifying opportunities for improvement, and designing an information system to address those needs. It bridges the gap between business requirements and technical implementation.
The Systems Development Life Cycle (SDLC)
The SDLC is a conceptual model used in project management that describes the stages involved in an information system development project, from an initial feasibility study through maintenance of the completed application.
| Phase | Primary Goal | Key Deliverable |
|---|---|---|
| Planning | Determine why the system should be built. | Feasibility Study / Project Plan |
| Analysis | Determine who will use the system, what it will do, and where/when it will be used. | System Proposal / Requirements Doc |
| Design | Determine how the system will operate (Hardware, Software, Network). | System Specification / Architecture |
| Implementation | Build, test, and install the system. | Working System / Documentation |
| Maintenance | Support the system and handle updates/bugs. | Support Logs / Version Updates |
Definition: Systems Analysis is the "what" (defining requirements), while Systems Design is the "how" (defining the technical solution).
Methodological Perspectives: Waterfall vs. Agile
The choice of methodology dictates the flow of the SDLC. While Waterfall is linear and structured, Agile is iterative and incremental.
| Feature | Waterfall | Agile |
|---|---|---|
| Flexibility | Rigid; changes are difficult and costly. | Highly flexible; embraces changing requirements. |
| Requirement Definition | Defined upfront in detail. | Evolve through iterations (Sprints). |
| Risk | High; issues may not be found until the end. | Low; continuous testing and feedback. |
| Best For | Stable environments with clear requirements. | Dynamic environments with evolving needs. |
Systems Design: Architecture and Organization
Systems design translates the "what" into a blueprint. This involves two distinct but related concepts: Computer Architecture and Computer Organization.
- Computer Architecture refers to those attributes of a system visible to a programmer, or, those attributes that have a direct impact on the logical execution of a program (e.g., instruction sets, bit numbering).
- Computer Organization refers to the operational units and their interconnections that realize the architectural specifications (e.g., hardware details like control signals, interfaces).
Data Management and Database Design
A core component of design is the Database Management System (DBMS). Effective design requires Normalization—the process of organizing data to minimize redundancy and dependency.
-- Example: Implementing Role-Based Access Control (RBAC) in a System Design
-- This schema ensures that security is baked into the data model.

CREATE TABLE Users (
    user_id INT PRIMARY KEY AUTO_INCREMENT,
    username VARCHAR(50) UNIQUE NOT NULL,
    password_hash CHAR(64) NOT NULL, -- SHA-256
    created_at TIMESTAMP DEFAULT CURRENT_TIMESTAMP
);

CREATE TABLE Roles (
    role_id INT PRIMARY KEY AUTO_INCREMENT,
    role_name VARCHAR(20) NOT NULL
);

CREATE TABLE User_Roles (
    user_id INT,
    role_id INT,
    PRIMARY KEY (user_id, role_id),
    FOREIGN KEY (user_id) REFERENCES Users(user_id),
    FOREIGN KEY (role_id) REFERENCES Roles(role_id)
);

-- Query to check if a user has 'Admin' privileges
SELECT u.username
FROM Users u
JOIN User_Roles ur ON u.user_id = ur.user_id
JOIN Roles r ON ur.role_id = r.role_id
WHERE u.username = 'sys_admin' AND r.role_name = 'Admin';
Cybersecurity: The Defense of Information Systems
Cybersecurity is the practice of protecting systems, networks, and programs from digital attacks. These attacks are usually aimed at accessing, changing, or destroying sensitive information, extorting money from users, or interrupting normal business processes.
The CIA Triad
The cornerstone of security is the CIA Triad:
- Confidentiality: Ensuring that data is accessible only to those authorized to have access.
- Integrity: Ensuring that data is accurate and has not been tampered with.
- Availability: Ensuring that systems and data are available to authorized users when needed.
Defense in Depth
A "silver bullet" for security does not exist. Instead, engineers employ Defense in Depth, a strategy that uses multiple layers of security controls throughout an IT system.
- Physical Layer: Biometrics, locks, and security guards.
- Network Layer: Firewalls, IDS/IPS, and VPNs.
- Host Layer: Antivirus, patch management, and OS hardening.
- Application Layer: Input validation, encryption, and secure coding.
Secure Coding and Implementation
Implementation is where the design becomes reality. To prevent vulnerabilities like buffer overflows or SQL injection, developers must adhere to secure coding standards.
/*
 * Low-level Implementation: Secure String Handling in C
 * Demonstrating the prevention of Buffer Overflow, a common system vulnerability.
 */

#include <stdio.h>
#include <string.h>
#include <stdlib.h>

#define MAX_BUFFER 1024

void secure_copy(const char *input) {
    char buffer[MAX_BUFFER];

    // INSECURE: strcpy(buffer, input);
    // This could overflow if input > 1024 bytes.

    // SECURE: strncpy with explicit null termination
    strncpy(buffer, input, MAX_BUFFER - 1);
    buffer[MAX_BUFFER - 1] = '\0';

    printf("Buffer safely contains: %s\n", buffer);
}

int main(int argc, char *argv[]) {
    if (argc < 2) {
        printf("Usage: %s <string>\n", argv[0]);
        return 1;
    }
    secure_copy(argv[1]);
    return 0;
}
Risk Management and Enterprise Security
Risk Management is the process of identifying, assessing, and controlling threats to an organization's capital and earnings. In IT, this means balancing the cost of security controls against the value of the assets being protected.
The Risk Assessment Formula
Risk is often quantified using the following relationship:
$$Risk = Probability \times Impact$$
Where:
- Probability: The likelihood of a threat occurring.
- Impact: The cost (financial, reputational, legal) if the threat occurs.
Risk Response Strategies
Organizations typically choose one of four ways to handle a risk:
| Strategy | Description | Example |
|---|---|---|
| Avoidance | Eliminating the cause of the risk. | Discontinuing a high-risk service. |
| Mitigation | Reducing the probability or impact. | Installing a firewall. |
| Transfer | Moving the risk to a third party. | Purchasing cybersecurity insurance. |
| Acceptance | Acknowledging the risk and doing nothing. | Accepting the risk of a minor, rare glitch. |
Data Privacy, Ethics, and Governance
As systems become more integrated, the ethical and legal implications of data usage grow. IT Governance provides a framework to ensure that IT investments support business objectives while managing risks and meeting legal requirements.
Privacy Frameworks and Laws
Modern systems must comply with various regulations:
- GDPR (General Data Protection Regulation): Focuses on data protection and privacy for all individuals within the EU.
- HIPAA: Governs the protection of medical information in the US.
- CCPA: Enhances privacy rights and consumer protection for residents of California.
Ethical Considerations in System Design
Engineers must consider the social implications of their work. This includes Web Accessibility (ensuring systems are usable by people with disabilities) and Information Literacy (ensuring users can effectively find and evaluate information).
# Data Privacy: Simple Anonymization Script
# Demonstrating the 'Privacy by Design' principle by masking PII (Personally Identifiable Information).

import pandas as pd
import hashlib

def anonymize_data(df, columns_to_mask):
    """
    Masks sensitive columns using SHA-256 hashing to preserve
    data utility for analysis while protecting identity.
    """
    for col in columns_to_mask:
        df[col] = df[col].apply(lambda x: hashlib.sha256(str(x).encode()).hexdigest())
    return df

# Realistic usage
data = {
    'Name': ['Alice Smith', 'Bob Jones'],
    'Email': ['alice@example.com', 'bob@example.com'],
    'Purchase_Amount': [150.00, 200.50]
}

df = pd.DataFrame(data)
anonymized_df = anonymize_data(df, ['Name', 'Email'])

# The output preserves the relationship between records without exposing names/emails
print(anonymized_df)
Modern Integration: DevSecOps
The contemporary approach to systems development is DevSecOps, which integrates security practices into the DevOps pipeline. This ensures that security checks are automated and performed continuously rather than just at the end of the development cycle.
# Real-world Usage: GitHub Actions Workflow for Security Scanning
# This snippet automates Static Analysis Security Testing (SAST).

name: Security Scan

on:
  push:
    branches: [ main ]
  pull_request:
    branches: [ main ]

jobs:
  snyk-scan:
    runs-on: ubuntu-latest
    steps:
      - uses: actions/checkout@v2
      - name: Run Snyk to check for vulnerabilities
        uses: snyk/actions/python@master
        env:
          SNYK_TOKEN: ${{ secrets.SNYK_TOKEN }}
        with:
          args: --severity-threshold=high
Common Pitfalls in Systems Analysis and Security
- Scope Creep: Allowing the system requirements to grow uncontrollably during the SDLC without adjusting time and budget.
- Security Through Obscurity: Relying on the secrecy of the design or implementation as the main security method. This is a fallacy; robust systems are secure even if the attacker knows how they work (Kerckhoffs's Principle).
- Neglecting the "Human Element": Most security breaches occur through Social Engineering (phishing, baiting) rather than technical exploits. User education is as critical as a firewall.
- Underestimating Technical Debt: Rushing the implementation phase of the SDLC often leads to "spaghetti code" that is difficult to secure and maintain later.
Conclusion
Systems Analysis, Design, and Security are not isolated tasks but are deeply interconnected. A well-analyzed system is easier to design; a well-designed system is inherently more secure; and a secure system is more resilient to the risks of the modern digital landscape. By following structured methodologies like the SDLC and adhering to principles like Defense in Depth and Privacy by Design, organizations can build robust infrastructures that provide a strategic advantage in a globalized world.
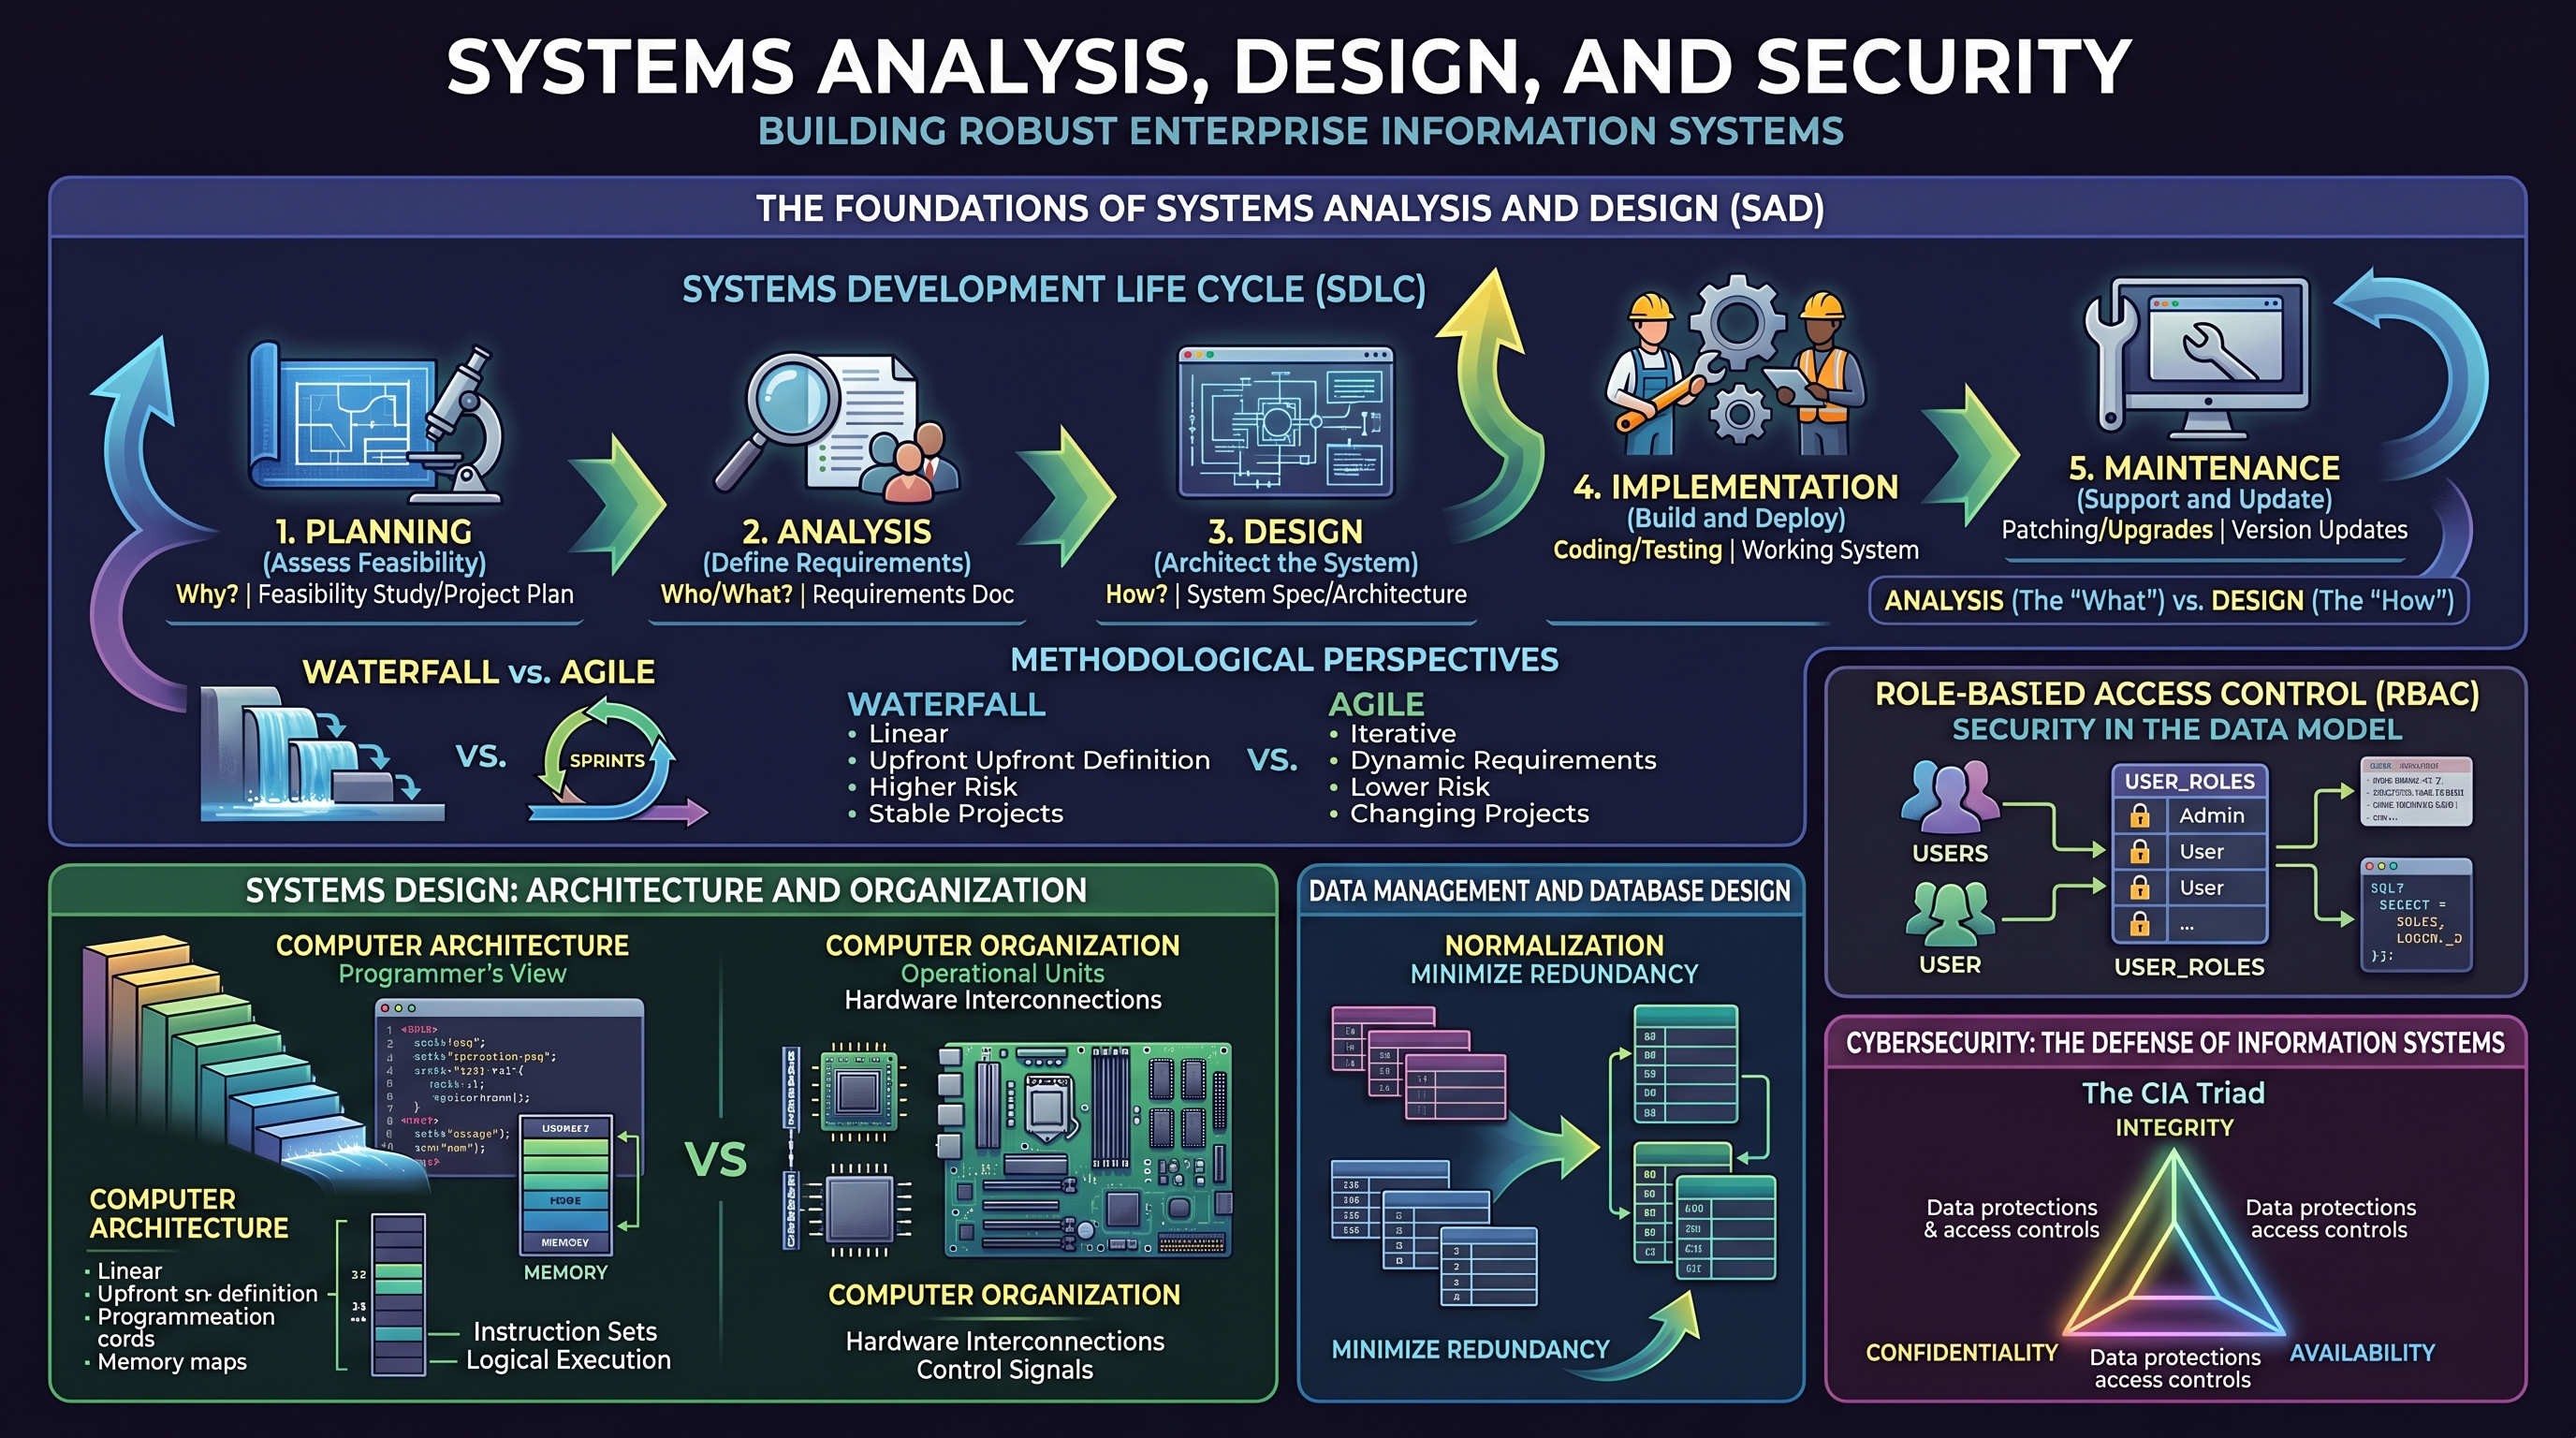
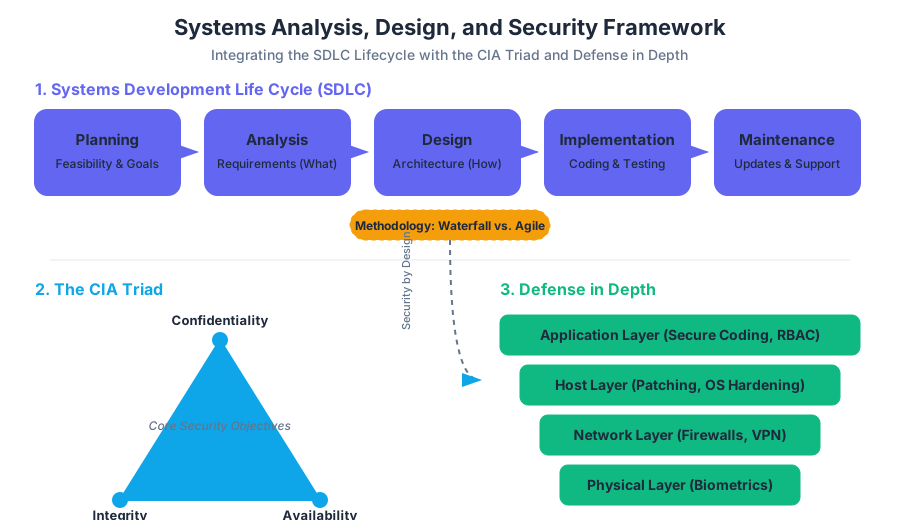
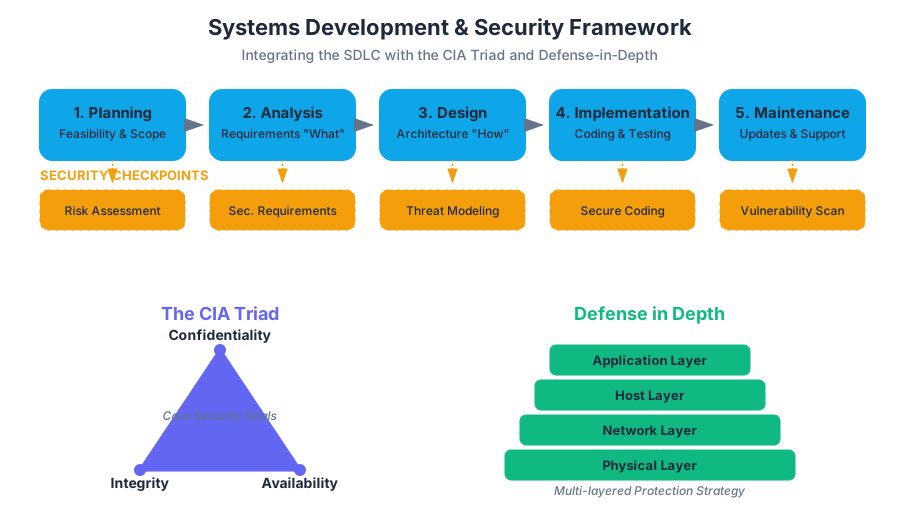
Cloud Computing and Data Analytics
Key concepts: Cloud Computing · Cloud Infrastructure · Data Analytics · Data Modeling · SaaS/PaaS/IaaS
Exploring modern infrastructure through cloud computing and the use of data analytics for business modeling.
Cloud Computing and Data Analytics: The Architectural Synergy
The modern enterprise has undergone a fundamental shift from localized, capital-intensive hardware deployments to a decentralized, utility-based model of computing. This transition, known as the Cloud Revolution, is not merely a change in where code executes, but a radical reimagining of how data is captured, stored, and transformed into actionable intelligence. At the intersection of this shift lies Data Analytics, a discipline that leverages the near-infinite scalability of cloud infrastructure to solve problems that were computationally intractable only a decade ago.
The Genesis of Cloud Computing
Cloud computing is defined as the on-demand delivery of IT resources over the internet with pay-as-you-go pricing. Rather than buying, owning, and maintaining physical data centers and servers, organizations access technology services, such as computing power, storage, and databases, from providers like Amazon Web Services (AWS), Microsoft Azure, and Google Cloud Platform (GCP).
Definition: The NIST Model According to the National Institute of Standards and Technology (NIST), cloud computing is characterized by five essential characteristics: On-demand self-service, Broad network access, Resource pooling, Rapid elasticity, and Measured service.
Why Cloud Computing Matters
Historically, IT departments operated under a CAPEX (Capital Expenditure) model. To launch a new application, one had to estimate peak load, purchase hardware, wait for shipping, and manually configure the stack. This led to "zombie servers"—underutilized hardware that drained resources. Cloud computing introduces the OPEX (Operational Expenditure) model, where costs scale linearly with usage. This enables Rapid Prototyping and Fail-Fast methodologies, as the cost of experimentation is drastically reduced.
Cloud Service Models: IaaS, PaaS, and SaaS
The "Cloud" is not a monolithic entity but a spectrum of abstraction. The choice of service model determines the "Shared Responsibility" between the provider and the consumer.
| Model | Acronym | Description | User Manages | Provider Manages |
|---|---|---|---|---|
| Infrastructure as a Service | IaaS | Fundamental building blocks of computing. | OS, Middleware, Data, Apps | Virtualization, Servers, Storage, Networking |
| Platform as a Service | PaaS | Framework for developers to build/deploy apps. | Applications, Data | OS, Runtime, Middleware, Hardware |
| Software as a Service | SaaS | Completed software products delivered via web. | Nothing (Configuration only) | Everything (The entire stack) |
The Shared Responsibility Matrix
In an IaaS environment, the user is responsible for patching the Operating System (OS). In a SaaS environment, the provider handles everything from the physical security of the data center to the encryption of data at rest within the application.
Cloud Infrastructure and Virtualization
The "magic" of the cloud relies on Virtualization. This is the process of creating a software-based (virtual) representation of something, such as virtual applications, servers, storage, and networks.
The Hypervisor
The core component of virtualization is the Hypervisor (or Virtual Machine Monitor). It is a layer of software that sits between the physical hardware and the Operating Systems, allowing multiple "Guest" OSs to share the same physical "Host" resources.
- Type 1 (Bare Metal): Runs directly on the host's hardware (e.g., VMware ESXi, Xen).
- Type 2 (Hosted): Runs on a conventional OS (e.g., Oracle VirtualBox).
Code Example 1: Low-Level Resource Management
In a cloud environment, we often interact with infrastructure via APIs. Below is a Python implementation using a hypothetical SDK to demonstrate how a cloud controller might balance load by spinning up new instances based on CPU utilization metrics.
import time

class CloudController:
    def __init__(self, threshold=80.0):
        self.threshold = threshold
        self.active_instances = []

    def get_cpu_utilization(self, instance_id):
        # In a real system, this calls a monitoring API like CloudWatch
        # Returns a float representing percentage
        pass

    def scale_up(self):
        new_id = f"inst-{len(self.active_instances) + 1}"
        print(f"[ACTION] Provisioning new instance: {new_id}")
        self.active_instances.append(new_id)

    def monitor_and_scale(self):
        while True:
            total_load = sum(self.get_cpu_utilization(i) for i in self.active_instances)
            avg_load = total_load / len(self.active_instances) if self.active_instances else 100

            print(f"[MONITOR] Average Cluster Load: {avg_load}%")

            if avg_load > self.threshold:
                self.scale_up()

            time.sleep(60) # Polling interval

# Note: This represents the logic behind 'Auto-scaling Groups' in Cloud Infrastructure.
Data Analytics: Extracting Value from the Cloud
If Cloud Computing is the engine, Data Analytics is the fuel. Data Analytics is the science of analyzing raw data to make conclusions. In the cloud, this is often categorized into four types:
- Descriptive: What happened? (e.g., Monthly sales reports)
- Diagnostic: Why did it happen? (e.g., Drill-down into churn data)
- Predictive: What will happen? (e.g., Forecasting demand using ML)
- Prescriptive: How can we make it happen? (e.g., Optimization algorithms)
The Big Data Pipeline
Cloud-native analytics typically follows a pipeline architecture: Ingestion (Kafka, Kinesis) → Storage (S3, Data Lake) → Processing (Spark, Databricks) → Analysis/Visualization (Tableau, Looker).
Data Modeling and Structuring
To analyze data effectively, it must be modeled. Data Modeling is the process of creating a visual representation of either a whole information system or parts of it to communicate connections between data points and structures.
Relational vs. Non-Relational
- RDBMS (SQL): Structured data, ACID compliance, fixed schema. Best for transactional data (e.g., banking).
- NoSQL: Unstructured or semi-structured data (JSON), horizontal scalability. Best for big data and real-time web apps.
The Star Schema
In cloud data warehousing (like Amazon Redshift or Snowflake), the Star Schema is the gold standard for performance. It consists of:
- Fact Tables: Quantitative data (e.g.,
sale_amount,quantity). - Dimension Tables: Descriptive attributes (e.g.,
product_name,store_location).
| Feature | Star Schema | Snowflake Schema |
|---|---|---|
| Normalization | Denormalized | Normalized |
| Query Complexity | Low (fewer joins) | High (more joins) |
| Data Redundancy | High | Low |
| Performance | Faster for OLAP | Slower but more organized |
Code Example 2: Infrastructure as Code (IaC)
To deploy these analytical environments, engineers use Declarative Configuration. Below is a pseudocode representation (similar to Terraform/HCL) for defining a Cloud Data Warehouse and its associated storage.
# Define a Cloud Storage Bucket for the Data Lake
resource "cloud_storage_bucket" "raw_data_lake" {
  name          = "enterprise-analytics-raw-prod"
  location      = "US-EAST-1"
  storage_class = "STANDARD"
  encryption    = "AES256"
}

# Define a Data Warehouse Instance
resource "cloud_data_warehouse" "main_dw" {
  cluster_identifier = "bi-analytics-cluster"
  node_type          = "dw2.large"
  number_of_nodes    = 4
  database_name      = "sales_analytics"

  # Link to the Data Lake for ELT processes
  iam_roles = [cloud_iam_role.dw_read_access.arn]
}
Advanced Data Analytics: The Power of Big Data
Big Data is often defined by the 5 Vs: Volume, Velocity, Variety, Veracity, and Value. Cloud computing solves the "Volume" and "Velocity" problems through Distributed Computing.
Amdahl's Law and Parallelism
In data processing, we aim to parallelize tasks. However, Amdahl's Law reminds us that the speedup of a program using multiple processors is limited by the sequential fraction of the program.
Amdahl's Law Formula $S_{latency}(s) = \frac{1}{(1-p) + \frac{p}{s}}$ Where:
- $S$ is the theoretical speedup.
- $s$ is the number of processors.
- $p$ is the proportion of the execution time that the part benefiting from improved resources originally occupied.
This formula explains why cloud analytics platforms focus on Horizontal Scaling (adding more machines) rather than just Vertical Scaling (adding more RAM/CPU to one machine).
Concrete Example: E-commerce Analytics Pipeline
Imagine an e-commerce giant processing 10,000 transactions per second.
- Ingestion: User clicks are streamed via
cURLor SDKs to a message bus. - Storage: The raw JSON is dumped into an S3 bucket (Data Lake).
- Transformation: A nightly Spark job transforms JSON into a structured Parquet format.
- Modeling: Data is loaded into a Star Schema in a Data Warehouse.
- Querying: Business analysts run SQL queries to find the "Top 10 products by region."
Code Example 3: Analytical SQL Query
This SQL query demonstrates a multi-table join in a Star Schema to calculate regional performance—a classic "Descriptive Analytics" task.
SELECT
    d.region_name,
    p.category,
    SUM(f.sales_amount) AS total_revenue,
    COUNT(DISTINCT f.transaction_id) AS transaction_count
FROM
    fact_sales f
JOIN
    dim_location d ON f.location_key = d.location_key
JOIN
    dim_product p ON f.product_key = p.product_key
WHERE
    f.order_date >= '2023-01-01'
GROUP BY
    d.region_name, p.category
HAVING
    SUM(f.sales_amount) > 10000
ORDER BY
    total_revenue DESC;
Common Pitfalls in Cloud and Analytics
Even with powerful tools, several common mistakes can lead to project failure or massive cost overruns.
- The "Lift and Shift" Trap: Moving a legacy application to the cloud without re-architecting it for cloud-native features (like auto-scaling). This often results in higher costs than on-premise.
- Data Silos: Creating fragmented data sets that cannot be joined, leading to "multiple versions of the truth."
- Ignoring Egress Costs: Cloud providers often charge very little to bring data in, but significant amounts to take data out.
- Over-provisioning: Allocating more resources than necessary.
- Security Misconfiguration: Leaving S3 buckets or databases open to the public internet—a leading cause of data breaches.
Ethics, Privacy, and Governance
As we aggregate massive datasets in the cloud, ethical considerations become paramount. Data Sovereignty laws (like GDPR in Europe) dictate where data can be stored and processed. Organizations must implement Data Governance frameworks to ensure data quality, security, and compliance.
- Anonymization: Removing PII (Personally Identifiable Information) before analysis.
- Auditability: Keeping logs of who accessed what data and when.
- Bias in Analytics: Ensuring that predictive models do not reinforce historical biases (e.g., in hiring or lending algorithms).
Summary of Key Formulae and Concepts
- Total Cost of Ownership (TCO): $TCO = Acquisition + Operating + Maintenance$. In the cloud, $Acquisition$ approaches zero.
- Availability: Measured in "Nines." 99.9% (Three Nines) allows for ~9 hours of downtime per year; 99.999% (Five Nines) allows for only ~5 minutes.
- ETL vs. ELT:
- ETL (Extract, Transform, Load): Data is transformed before reaching the warehouse.
- ELT (Extract, Load, Transform): Data is loaded raw into the warehouse and transformed using the warehouse's compute power (preferred in modern cloud architectures).
| Metric | On-Premise | Cloud (IaaS/PaaS) |
|---|---|---|
| Scaling Speed | Weeks/Months | Seconds/Minutes |
| Cost Structure | Fixed (CAPEX) | Variable (OPEX) |
| Maintenance | High (Physical) | Low (Software-defined) |
| Global Reach | Difficult | Instant (Multi-region) |
The synergy of Cloud Computing and Data Analytics has democratized high-performance computing. Today, a startup with a credit card has access to the same computational power that was once reserved for global superpowers, enabling a new era of data-driven innovation.
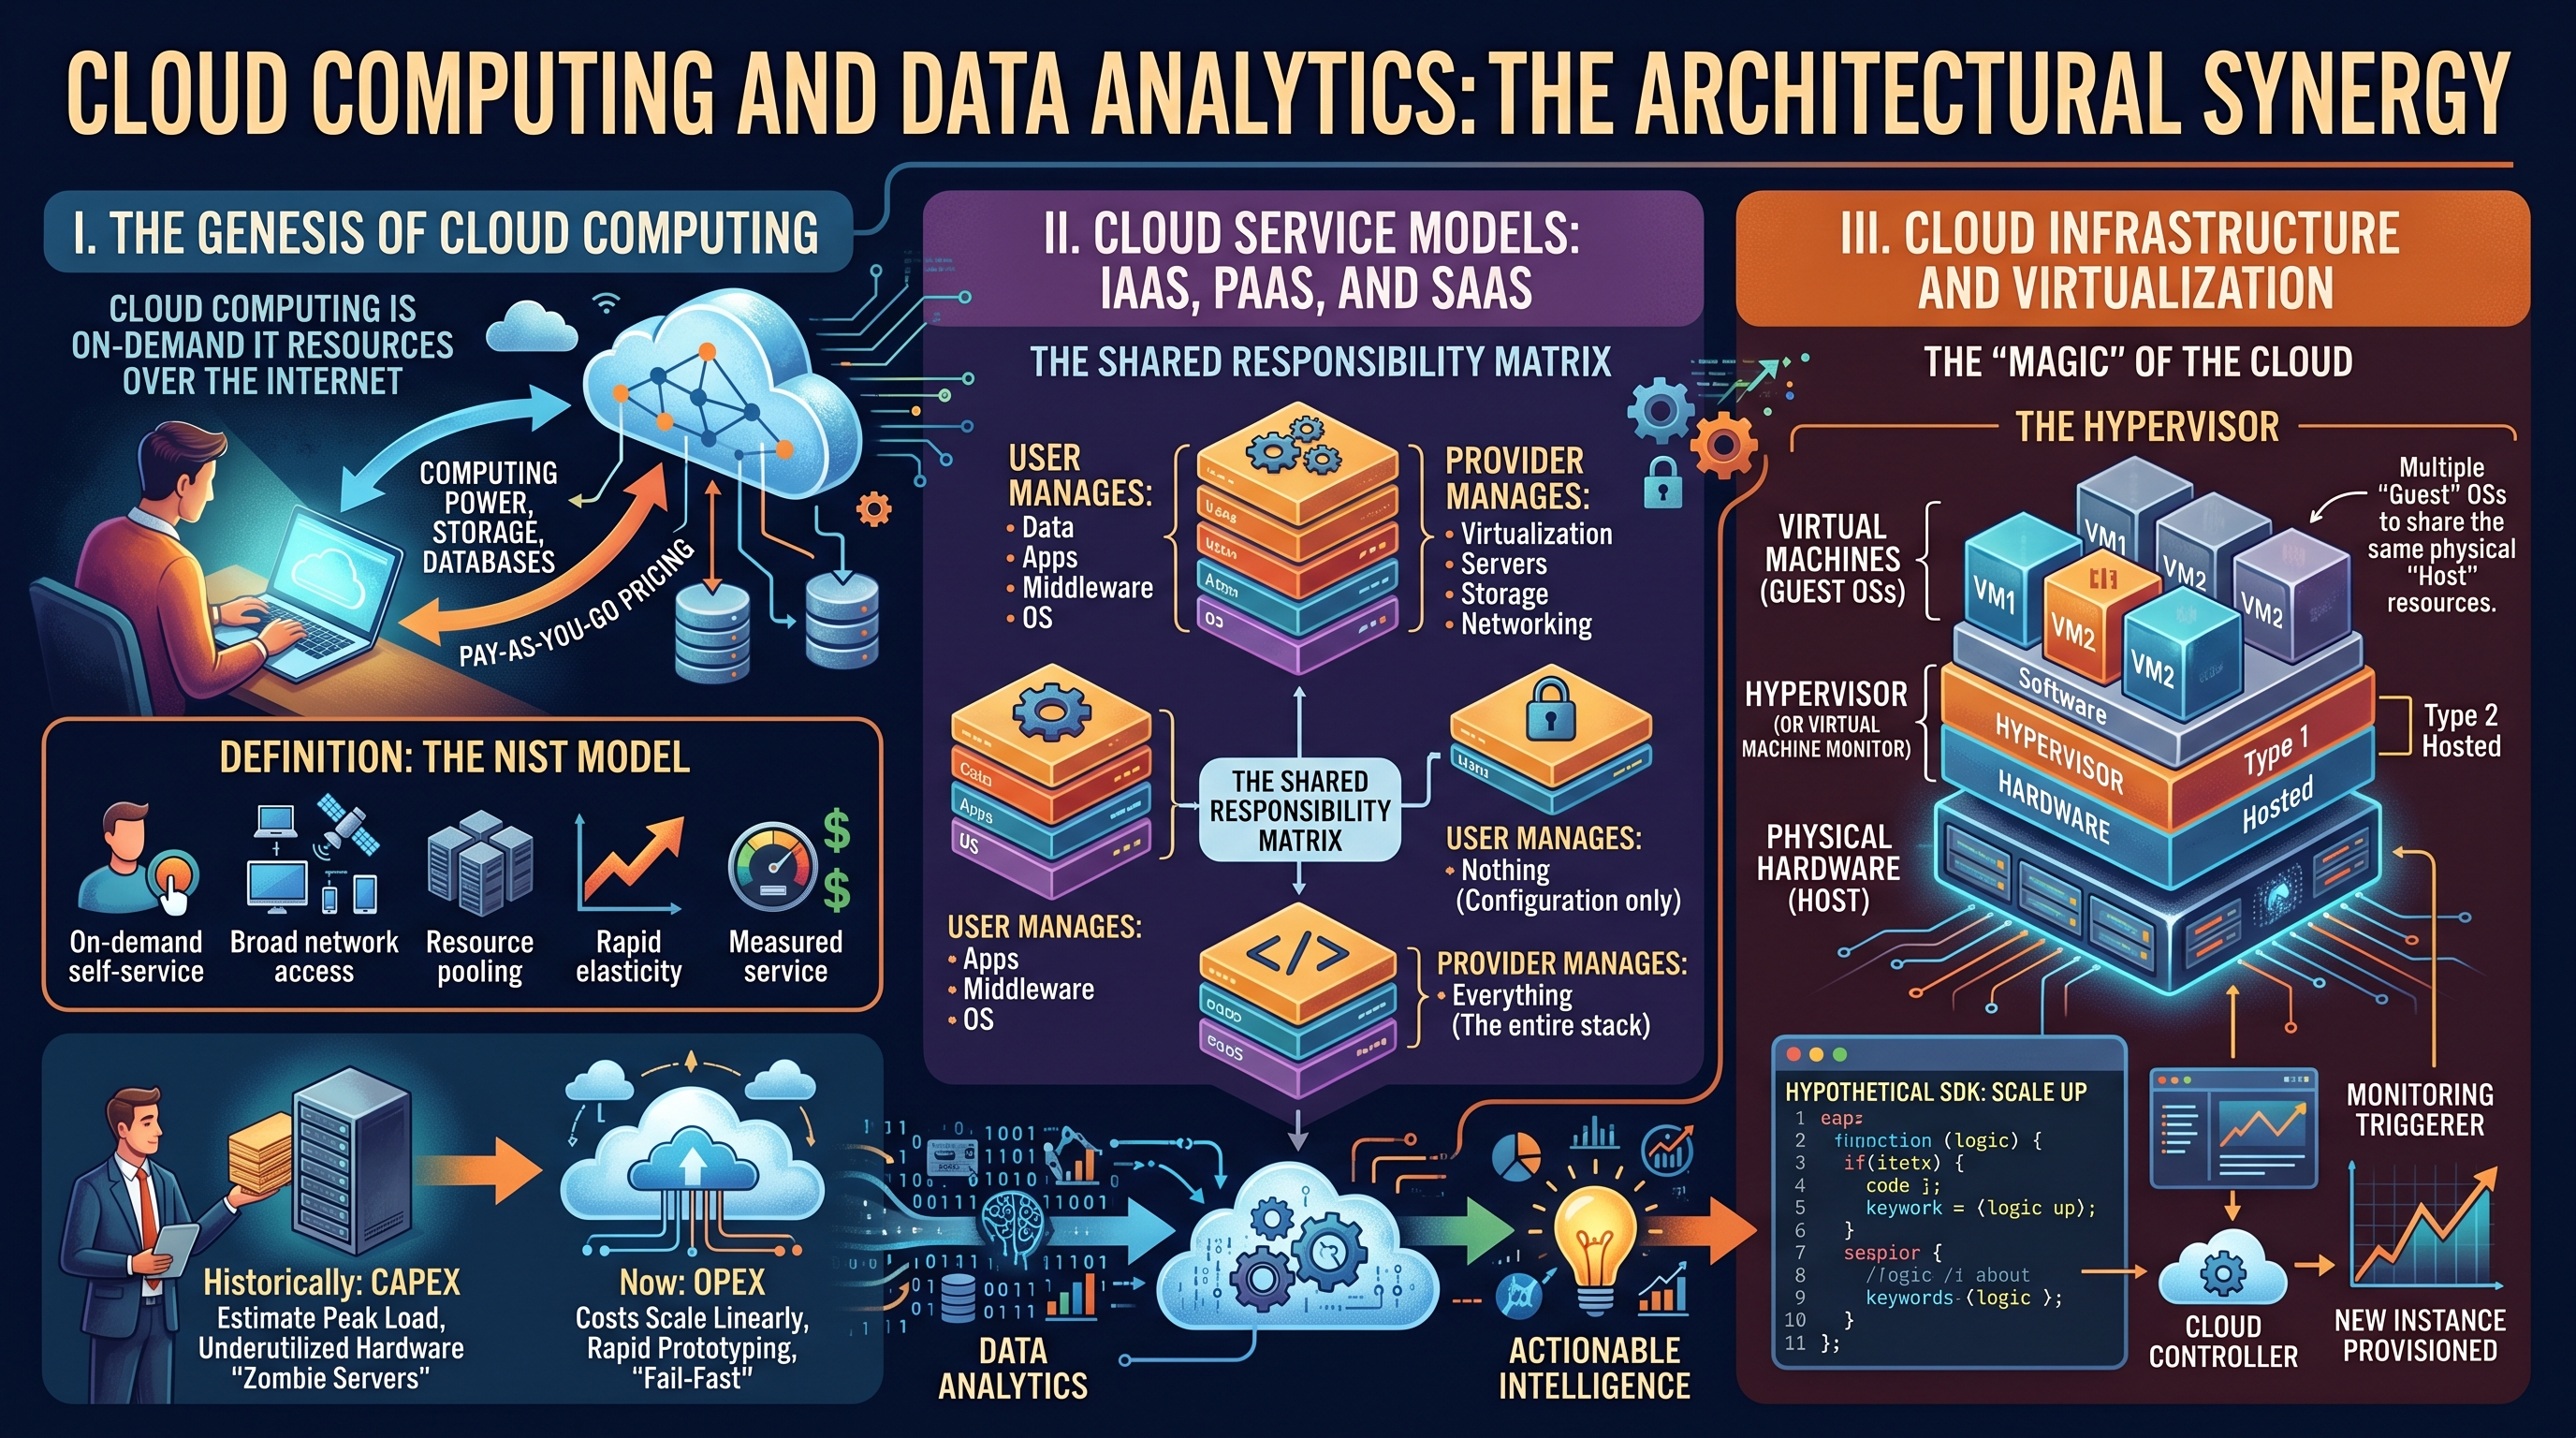
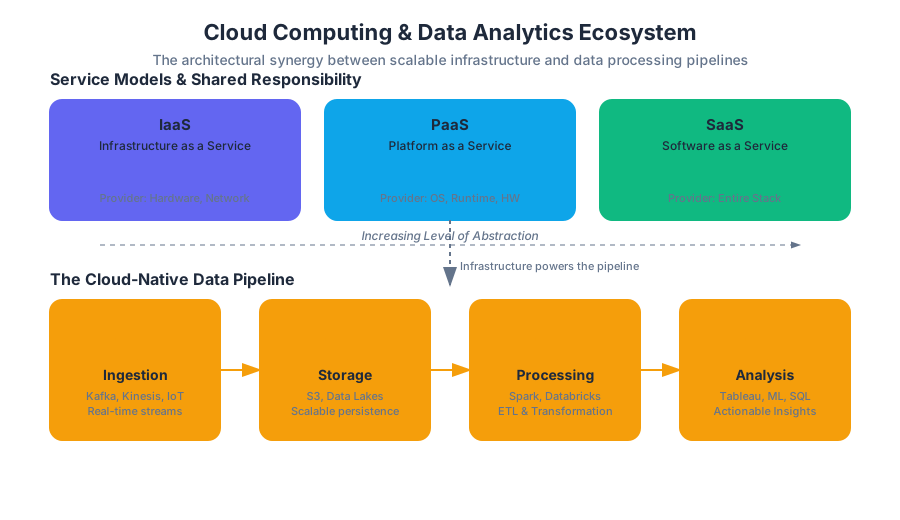
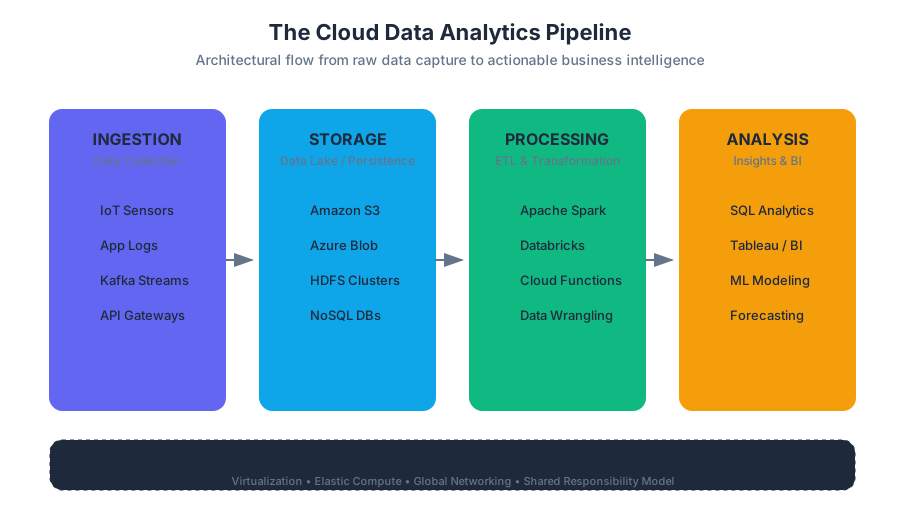
IS Project Management and Emerging Technologies
Key concepts: Project Management · Emerging Technologies · Global Information Systems · Sustainability · Frontiers of IS
Managing IT projects and staying ahead of the curve with emerging technological frontiers.
IS Project Management and Emerging Technologies
The intersection of Information Systems (IS) Project Management and Emerging Technologies represents the "bleeding edge" of organizational strategy. In a landscape where the half-life of technical knowledge is shrinking, the ability to successfully shepherd a project from conceptualization to deployment is no longer just a functional requirement—it is a competitive necessity. This article explores the rigorous frameworks of project management, the disruptive potential of nascent technologies like AI and Blockchain, and the critical imperatives of global scaling and environmental sustainability.
The Architecture of IS Project Management
Project management in the IS domain is the systematic application of knowledge, skills, tools, and techniques to project activities to meet specific technical and business requirements. Unlike traditional engineering, IS projects are often characterized by intangibility, high complexity, and rapidly shifting requirements.
The Triple Constraint and Beyond
Historically, project success was measured by the Triple Constraint: Scope, Time, and Cost. In modern IS, this has evolved into a hexagonal model adding Quality, Risk, and Benefits Realization.
Definition: The Triple Constraint A model of the constraints inherent in managing a project. It asserts that the quality of work is constrained by the project's budget, deadlines, and features (scope). Mathematically, this can be expressed as: $Quality = f(Scope, Cost, Time)$ where any change in one variable necessitates a compensatory change in at least one of the others to maintain equilibrium.
Methodological Paradigms: Waterfall vs. Agile vs. DevOps
The choice of methodology often determines the project's terminal velocity and risk profile.
| Feature | Waterfall (SDLC) | Agile (Scrum/Kanban) | DevOps / DevSecOps |
|---|---|---|---|
| Structure | Linear, sequential phases | Iterative, incremental cycles | Continuous integration/delivery |
| Requirement Stability | High (Fixed at start) | Low (Evolving) | Dynamic (Automated) |
| Risk Discovery | Late (Testing phase) | Early and frequent | Real-time (Monitoring) |
| Primary Goal | Predictability and control | Flexibility and speed | Reliability and automation |
| Best For | Regulated/Fixed-scope projects | Product development | SaaS and cloud-native apps |
Implementation: The Critical Path Method (CPM)
To manage complex dependencies, senior PMs utilize the Critical Path Method. This algorithm identifies the longest stretch of dependent activities and measures the time required to complete them from start to finish. Any delay in a critical path activity directly impacts the project completion date.
# Python Implementation of a Simple Critical Path Logic
# Using a directed acyclic graph (DAG) approach

class Task:
    def __init__(self, name, duration, dependencies=None):
        self.name = name
        self.duration = duration
        self.dependencies = dependencies or []
        self.earliest_start = 0
        self.earliest_finish = 0

def calculate_es_ef(tasks):
    """
    Calculates Earliest Start (ES) and Earliest Finish (EF) for a list of tasks.
    Assumes tasks are sorted topologically.
    """
    for task in tasks:
        if not task.dependencies:
            task.earliest_start = 0
        else:
            # ES is the maximum EF of all dependencies
            task.earliest_start = max(dep.earliest_finish for dep in task.dependencies)

        task.earliest_finish = task.earliest_start + task.duration
        print(f"Task {task.name}: ES={task.earliest_start}, EF={task.earliest_finish}")

# Example Project: Web App Deployment
t1 = Task("Requirements", 5)
t2 = Task("Design", 10, [t1])
t3 = Task("Backend Dev", 20, [t2])
t4 = Task("Frontend Dev", 15, [t2])
t5 = Task("Integration", 5, [t3, t4])

calculate_es_ef([t1, t2, t3, t4, t5])
Emerging Technologies: The New Frontiers
Emerging technologies are those characterized by radical novelty, relatively fast growth, and the potential to exert a considerable impact on the socio-economic domain. In IS, the focus is currently on the "ABCD" of innovation: Artificial Intelligence, Blockchain, Cloud, and Data (IoT).
Artificial Intelligence and Machine Learning (AI/ML)
AI is shifting IS from deterministic systems (if-this-then-that) to probabilistic systems (pattern recognition). The challenge for PMs is that AI projects are research-heavy and their outcomes are often non-linear.
Blockchain and Distributed Ledgers
Blockchain provides a decentralized, immutable record of transactions. It solves the "Double Spend" problem without a central authority.
Theorem: The Blockchain Trilemma Proposed by Vitalik Buterin, it suggests that it is nearly impossible for a blockchain system to simultaneously achieve Decentralization, Security, and Scalability. Most systems must sacrifice one to optimize the other two.
The Internet of Things (IoT) and Edge Computing
IoT extends internet connectivity into physical devices. The architectural shift here is toward Edge Computing, where data is processed near the source to reduce latency and bandwidth consumption.
ALGORITHM: Proof of Work (Simplified Pseudocode)

FUNCTION mine_block(block_data, difficulty_target):
    nonce = 0
    LOOP:
        hash_attempt = SHA256(block_data + nonce)
        IF hash_attempt < difficulty_target:
            RETURN (nonce, hash_attempt)
        ELSE:
            nonce = nonce + 1
    END LOOP

MATHEMATICAL REPRESENTATION:
Find 'n' such that:
H(B_n || n) < T
Where:
- H is a cryptographic hash function (e.g., SHA-256)
- B_n is the block header
- n is the nonce
- T is the target threshold (derived from difficulty)
| Technology | Core Value Proposition | Primary IS Challenge |
|---|---|---|
| Generative AI | Content creation & automation | Hallucinations & Data Privacy |
| Blockchain | Trustless verification | Energy consumption & Throughput |
| IoT | Real-world data ingestion | Security (Mirai-style botnets) |
| Quantum Computing | Exponential processing speed | Cryptographic obsolescence |
Global Information Systems (GIS)
As organizations expand, they must manage technology across international borders. A Global Information System is an IS that spans multiple countries, requiring the management of diverse cultural, legal, and technical environments.
Key Challenges in GIS
- Data Sovereignty and Residency: Regulations like GDPR (EU) or CCPA (California) dictate where data can be stored and how it can be moved across borders.
- Localization (L10n): Adapting software for specific languages, currencies, and cultural norms (e.g., right-to-left text processing).
- Infrastructure Disparity: Managing high-latency connections in developing regions versus high-speed fiber in tech hubs.
Strategies for Global Integration
- Multinational: Each subsidiary operates its own IS.
- Global: Centralized IS at headquarters; subsidiaries follow strict standards.
- Transnational: Integrated global network where resources are shared across all nodes regardless of location.
Sustainability and Green IT
The environmental footprint of Information Systems is no longer an afterthought. With data centers consuming approximately 1-2% of global electricity, Green IT focuses on the triple bottom line: People, Planet, and Profit.
Metrics of Sustainability
The industry standard for measuring data center efficiency is Power Usage Effectiveness (PUE).
$$PUE = \frac{\text{Total Facility Power}}{\text{IT Equipment Power}}$$
An ideal PUE is 1.0, indicating that all power goes directly to the computing equipment rather than cooling or lighting.
The E-Waste Crisis
Project managers must account for the Lifecycle Assessment (LCA) of hardware. This includes responsible procurement, energy-efficient operation, and certified electronic waste disposal to prevent heavy metals from entering the ecosystem.
| Sustainability Metric | Definition | Target Goal |
|---|---|---|
| PUE | Power Usage Effectiveness | < 1.2 |
| CUE | Carbon Usage Effectiveness | 0.0 (Carbon Neutral) |
| WUE | Water Usage Effectiveness | Minimize (Liters/kWh) |
| Circular Rate | % of hardware recycled/refurbished | 100% |
Frontiers: Ethics, Governance, and Law
As technology outpaces legislation, the ethical framework of the IS professional becomes the primary safeguard.
IT Governance
IT Governance (e.g., COBIT or ITIL) ensures that IT investments support business objectives and that risks are mitigated. It provides a structure for aligning IT strategy with enterprise strategy.
Ethical Considerations
- Algorithmic Bias: Ensuring AI does not perpetuate human prejudices.
- Digital Divide: The gap between those with access to modern IS and those without.
- Surveillance Capitalism: The ethical implications of monetizing user data.
Implementation: Infrastructure as Code (IaC)
To maintain global standards and governance, modern IS projects use IaC. This ensures that a server in Tokyo is configured identically to one in London, reducing "configuration drift."
# Terraform Example: Global Infrastructure Deployment
# Deploying a Load Balancer across multiple regions for a GIS

resource "google_compute_global_forwarding_rule" "default" {
  name       = "global-rule"
  target     = google_compute_target_http_proxy.default.id
  port_range = "80"
}

resource "google_compute_backend_service" "default" {
  name        = "backend-service"
  protocol    = "HTTP"
  timeout_sec = 10

  backend {
    group = google_compute_instance_group_manager.us_web_servers.instance_group
  }

  backend {
    group = google_compute_instance_group_manager.eu_web_servers.instance_group
  }

  health_checks = [google_compute_health_check.default.id]
}
Common Pitfalls in IS Projects
- Brooks’s Law: "Adding manpower to a late software project makes it later." This occurs because the communication overhead increases quadratically with the number of people.
- Scope Creep: The uncontrolled expansion of project scope without adjustments to time, cost, and resources.
- Technical Debt: Choosing an easy, short-term solution instead of a better approach that would take longer, leading to "interest" in the form of future rework.
- The "Silver Bullet" Myth: Believing that a new technology (like AI) will magically solve fundamental organizational or process problems.
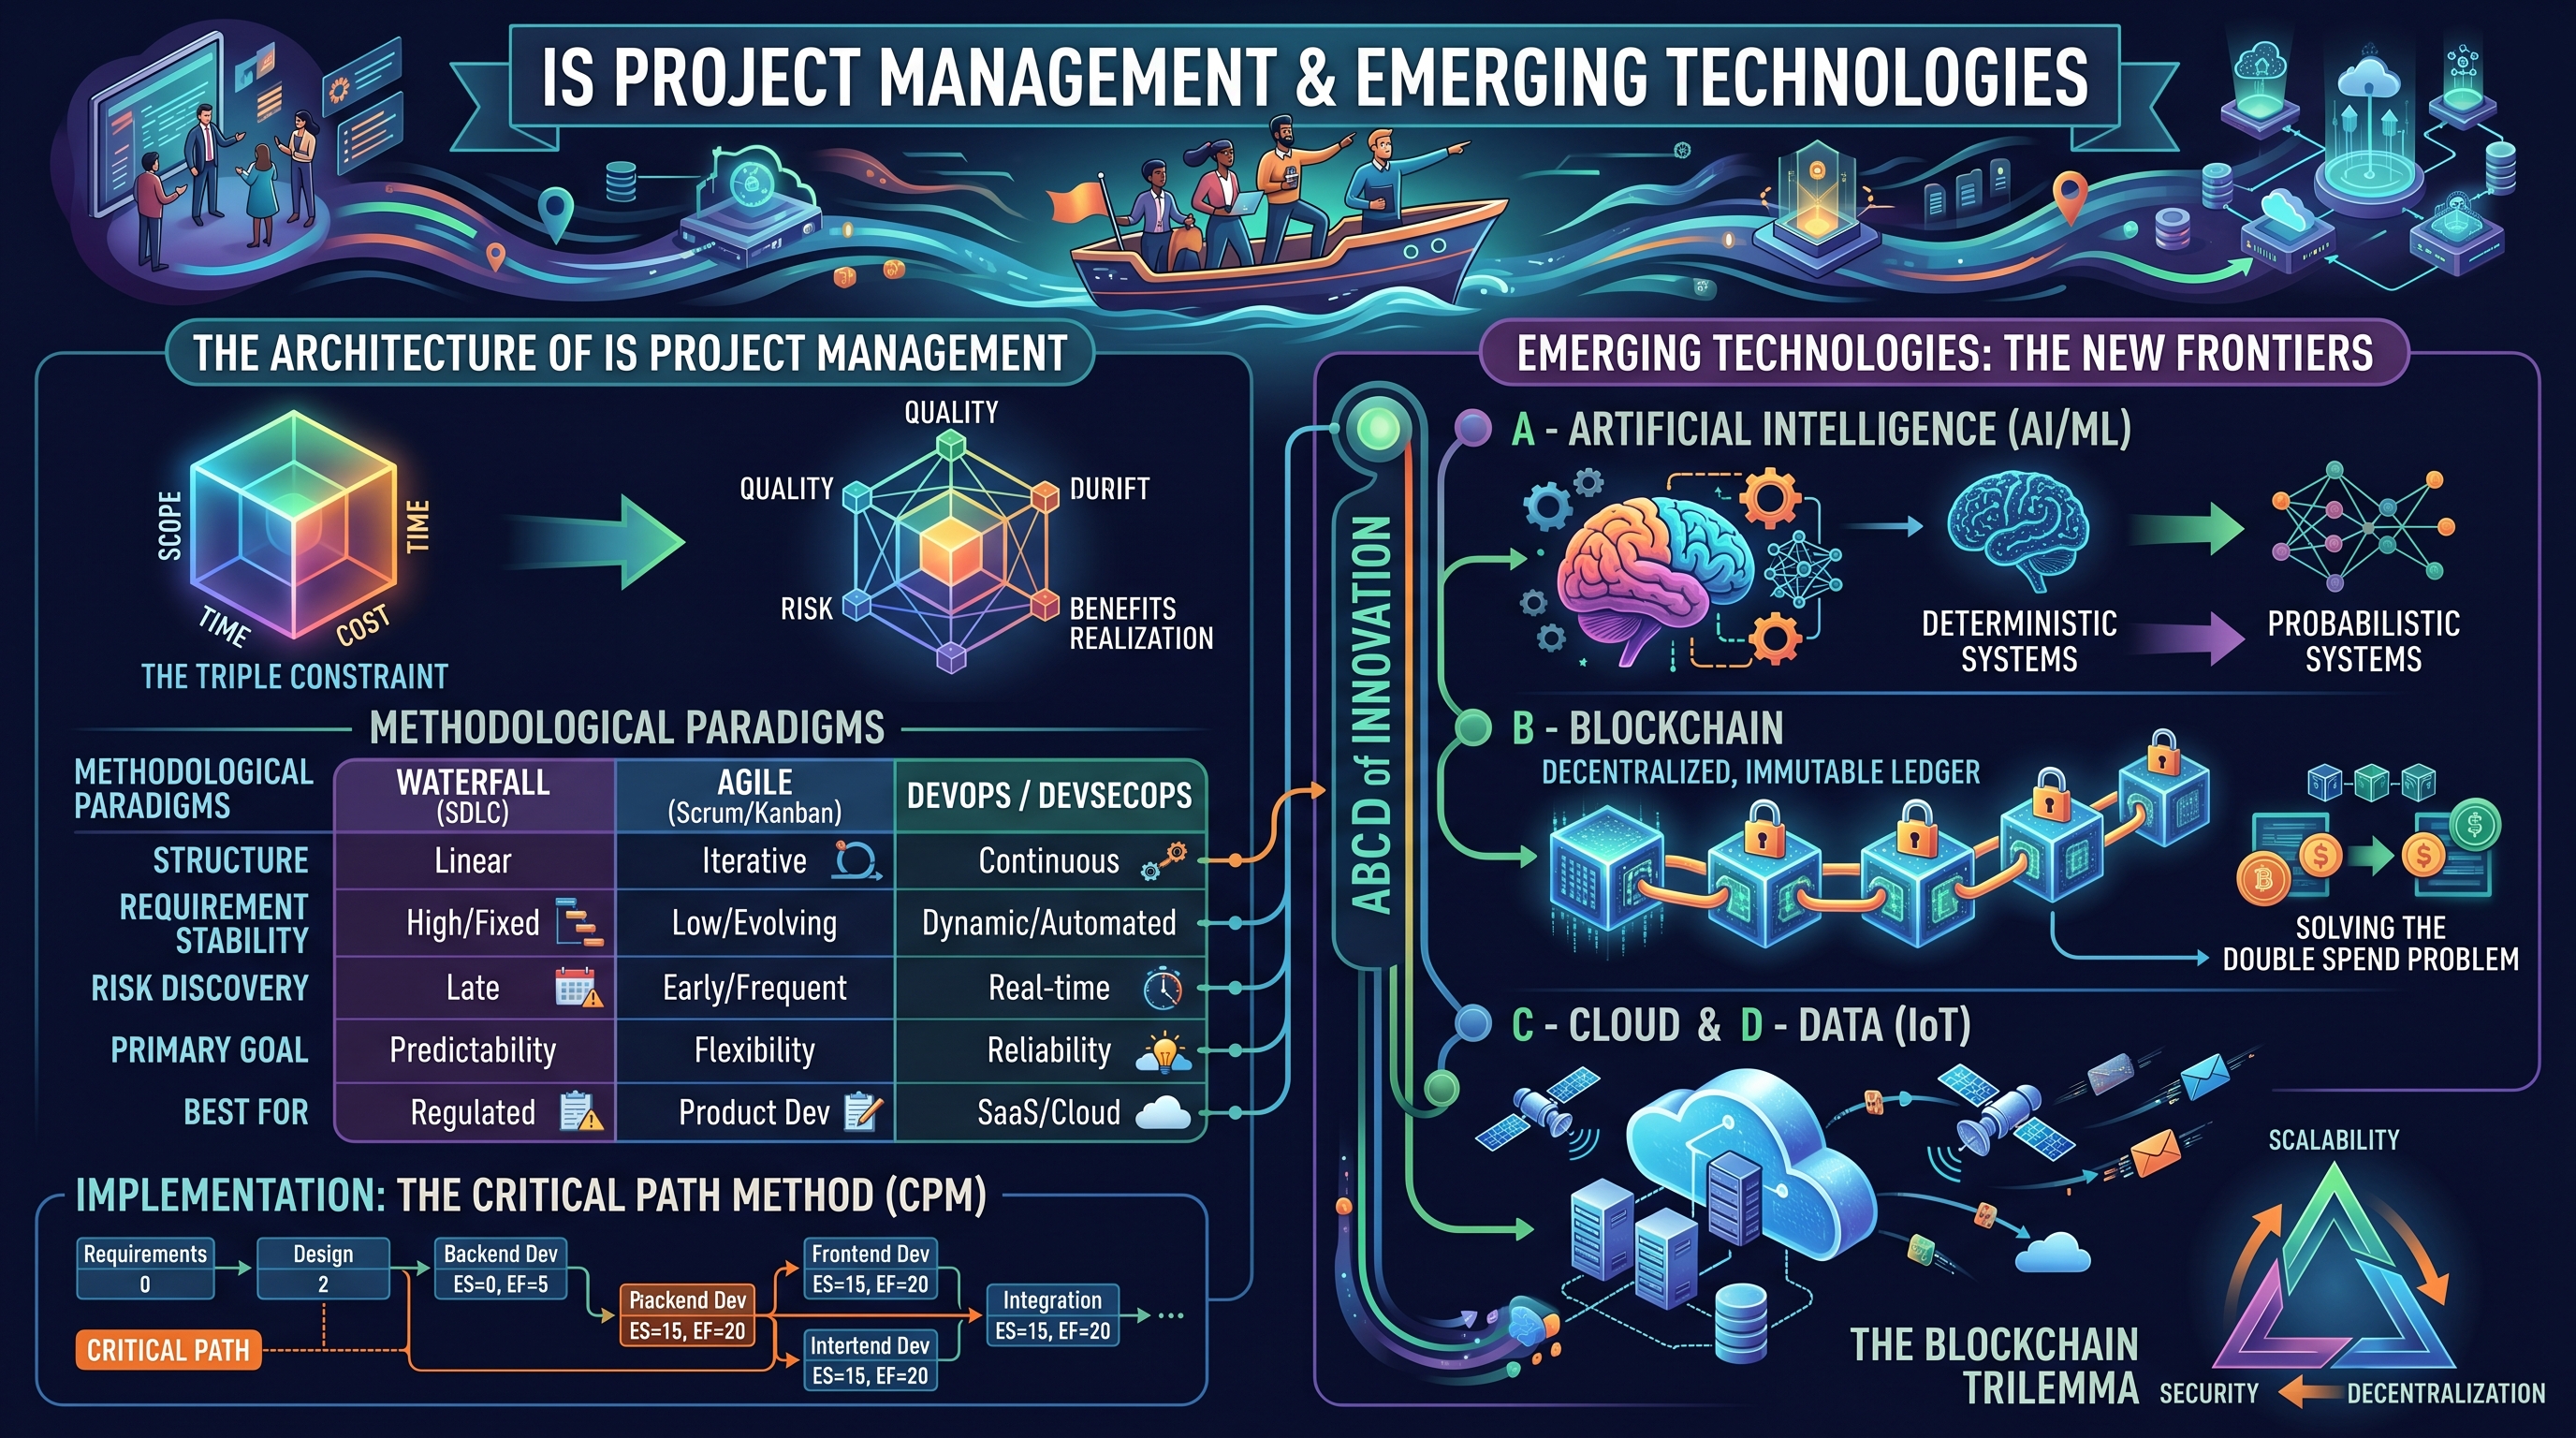
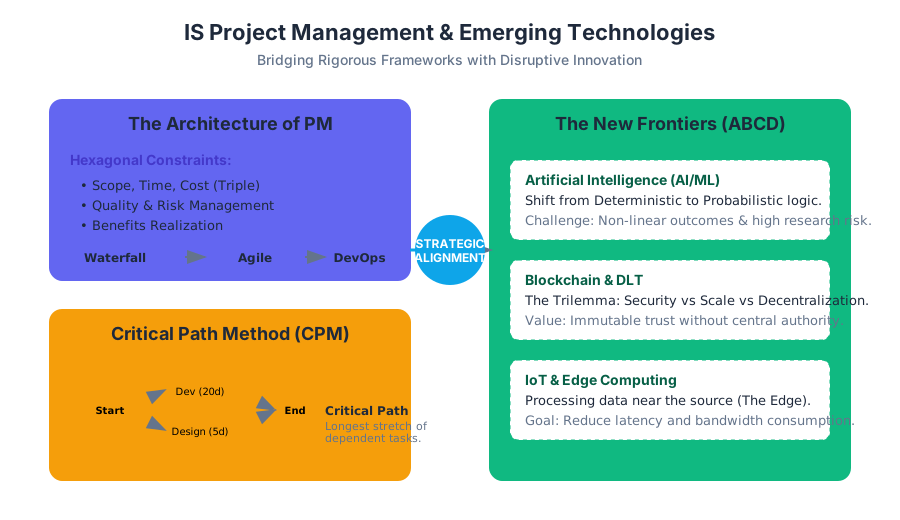
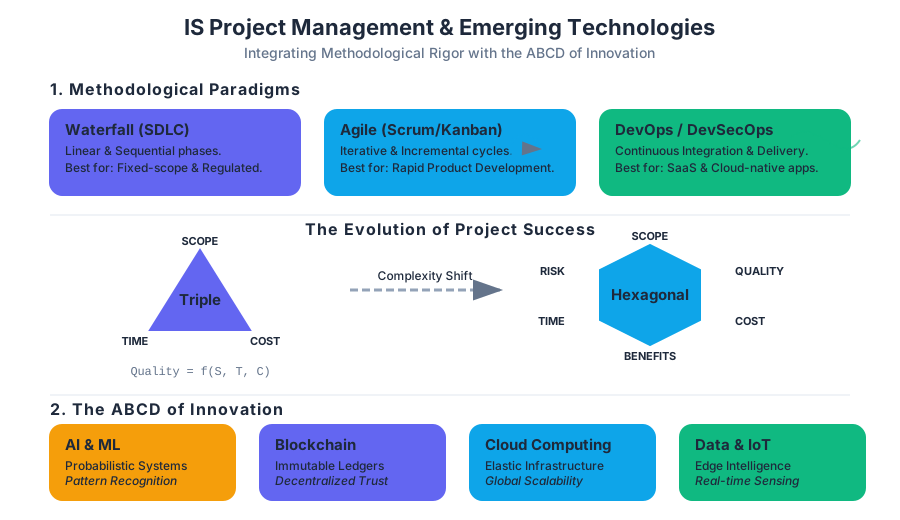
Source Materials
- Computer Applications and Information Technology
- Information Systems
- 2: Data Management and Information Systems Business Strategies
- Workplace Software and Skills (OpenStax)
- Introduction to Computer Applications and Concepts (Lumen)
- Information Systems for Business and Beyond (Bourgeois) (2019 Edition)
- InfoTech Governance, Policy, Ethics and Law (Tuffley)
- Professional Web Accessibility Auditing Made Easy
- Information Technology Hardware
- Computer Fundamentals for Technical Students (Heisserer)
- Introduction to Spreadsheets (Lumen)
- Computer Applications
Study Computer Applications and Information Technology with AI — Free on Lykke
Sign up for free to generate personalized flashcards, quizzes, and study guides from this course. Chat with an AI tutor that knows the material.
Get Started FreeView this course wiki on Lykke · Browse all public course wikis