AP Environmental Science
Institution: MIT
113 study materials · 59 sections
AP Environmental Science students working the current College Board Course and Exam Description, including first-time students with no prior background, plus teachers reviewing the page for CED alignment.; Teach every official CED unit and every numbered topic at topic granularity.; Develop every AP skill / science-practice code explicitly and by name.; Replace description with teaching: worked contextual examples, named misconceptions, and in-flow retrieval checks.; Build an exam-practice unit covering every task type on the current exam.
Course Sections
Course Framework, Skills and Reasoning Processes
Key concepts: AP Environmental Science course framework · Big ideas as cross-cutting concepts · Concept explanation · Visual representation and interpretation · Text analysis · Scientific investigation and reasoning · Energy flow through systems · Interactions between Earth systems · Ecosystems · Biodiversity and terrestrial biomes
Environmental systems are best understood as connected systems: energy moves through them, matter cycles within them, organisms interact with one another and their surroundings, and human decisions can either strengthen or destabilize those relationships.
Course Framework, Skills and Reasoning Processes
Environmental systems are best understood as connected systems: energy moves through them, matter cycles within them, organisms interact with one another and their surroundings, and human decisions can either strengthen or destabilize those relationships.
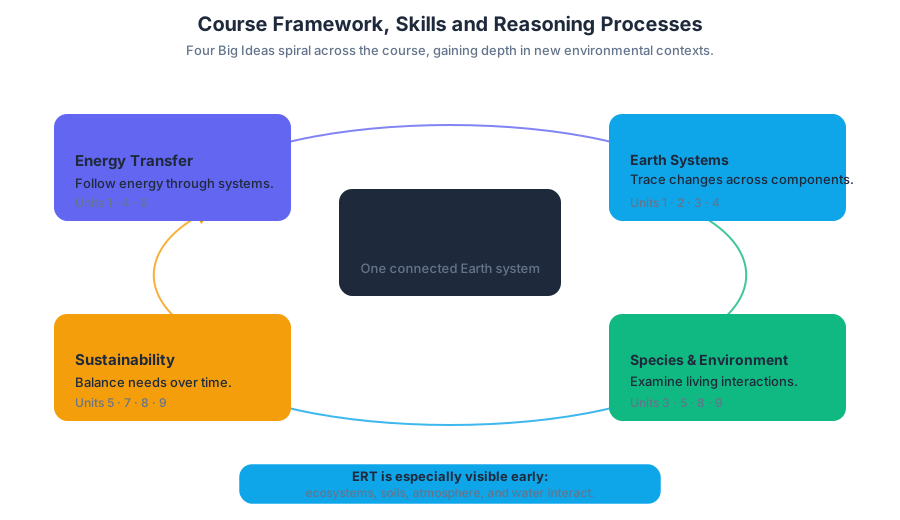
Four Big Ideas that spiral across the course
The course framework is organized around four Big Ideas rather than isolated chapters. These ideas spiral: students encounter the same underlying concept repeatedly, but apply it to increasingly varied environmental contexts.
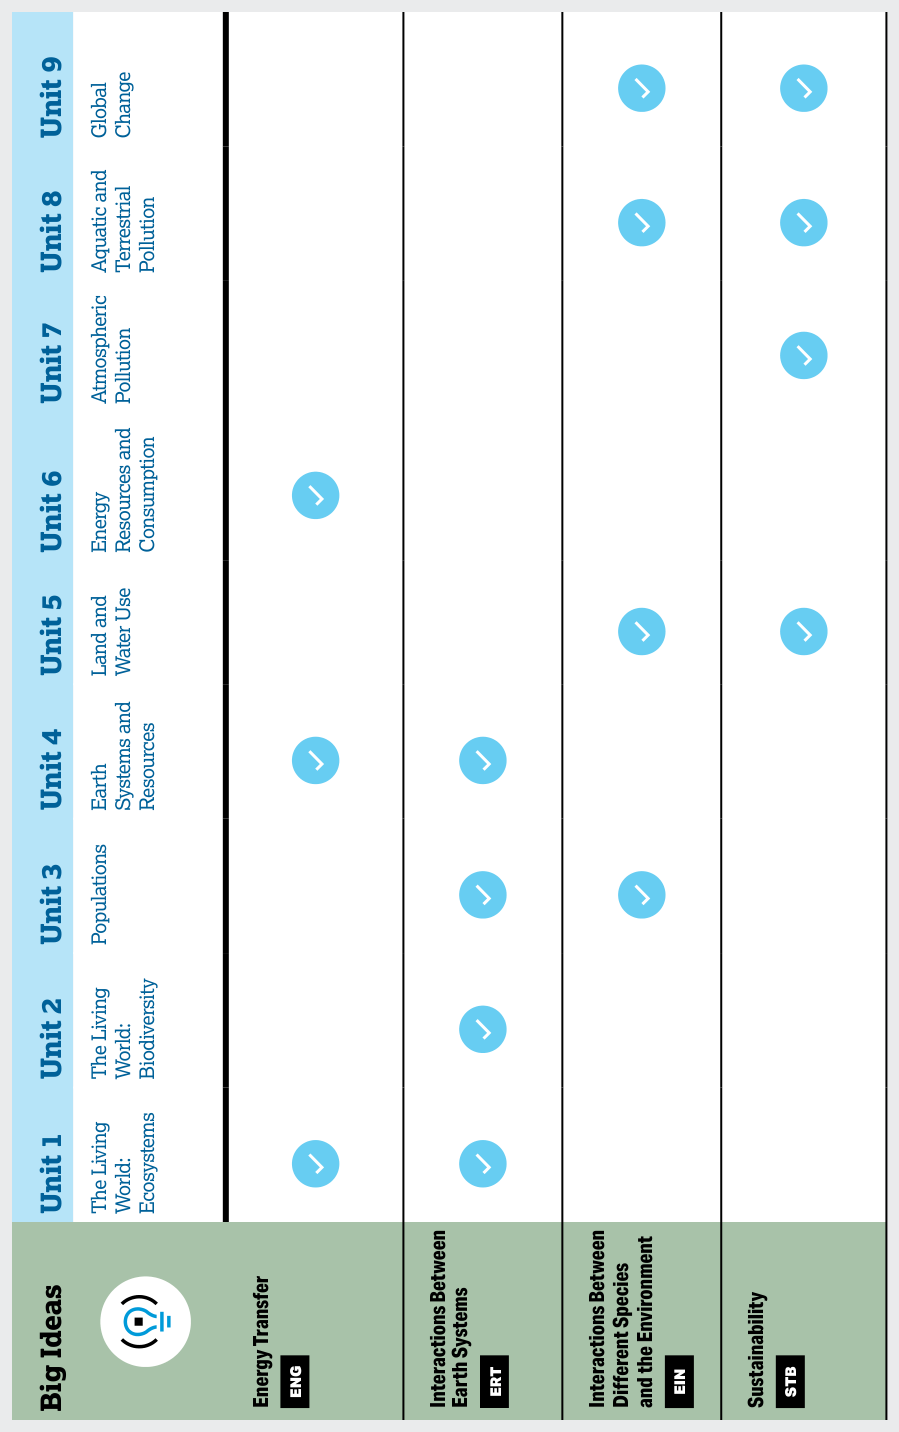
| Code | Big Idea | Where it is emphasized |
|---|---|---|
| ENG | Energy Transfer | Units 1, 4, and 6 |
| ERT | Interactions Between Earth Systems | Units 1, 2, 3, and 4 |
| EIN | Interactions Between Different Species and the Environment | Units 3, 5, 8, and 9 |
| STB | Sustainability | Units 5, 7, 8, and 9 |
ERT, or Interactions Between Earth Systems, is especially visible early in the course. Ecosystems, biodiversity, populations, soils, atmosphere, and water are not separate subjects: they are interacting parts of Earth’s system. A change in one component can propagate through others—for example, altered precipitation can affect soil moisture, plant productivity, food webs, and human food production.
A central ENG principle is that energy is not created; it must come from somewhere. Solar radiation supplies most energy entering ecosystems, and energy is transferred through producers and consumers. At every transfer, some energy becomes less usable, often leaving the system as heat. Matter such as carbon, nitrogen, phosphorus, and water cycles through Earth systems, but energy flows in one direction.
Roadmap: which ideas and practices recur?
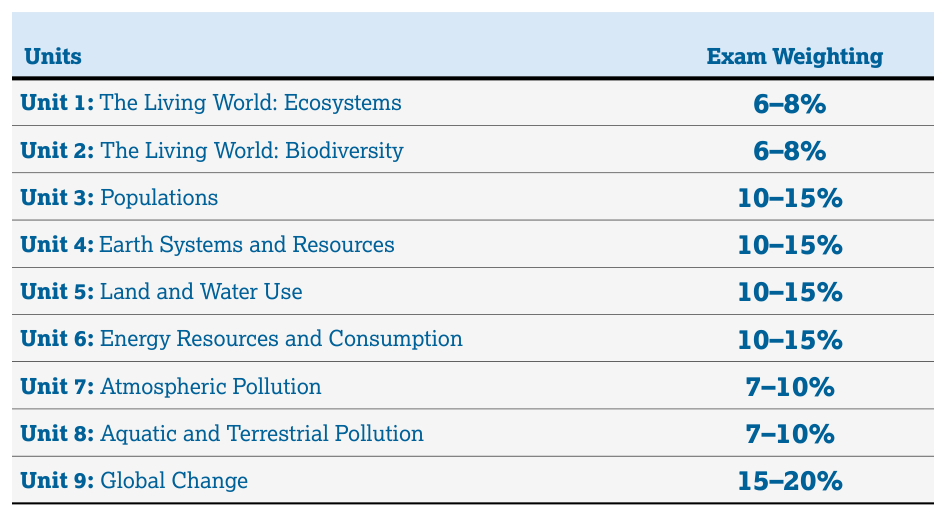
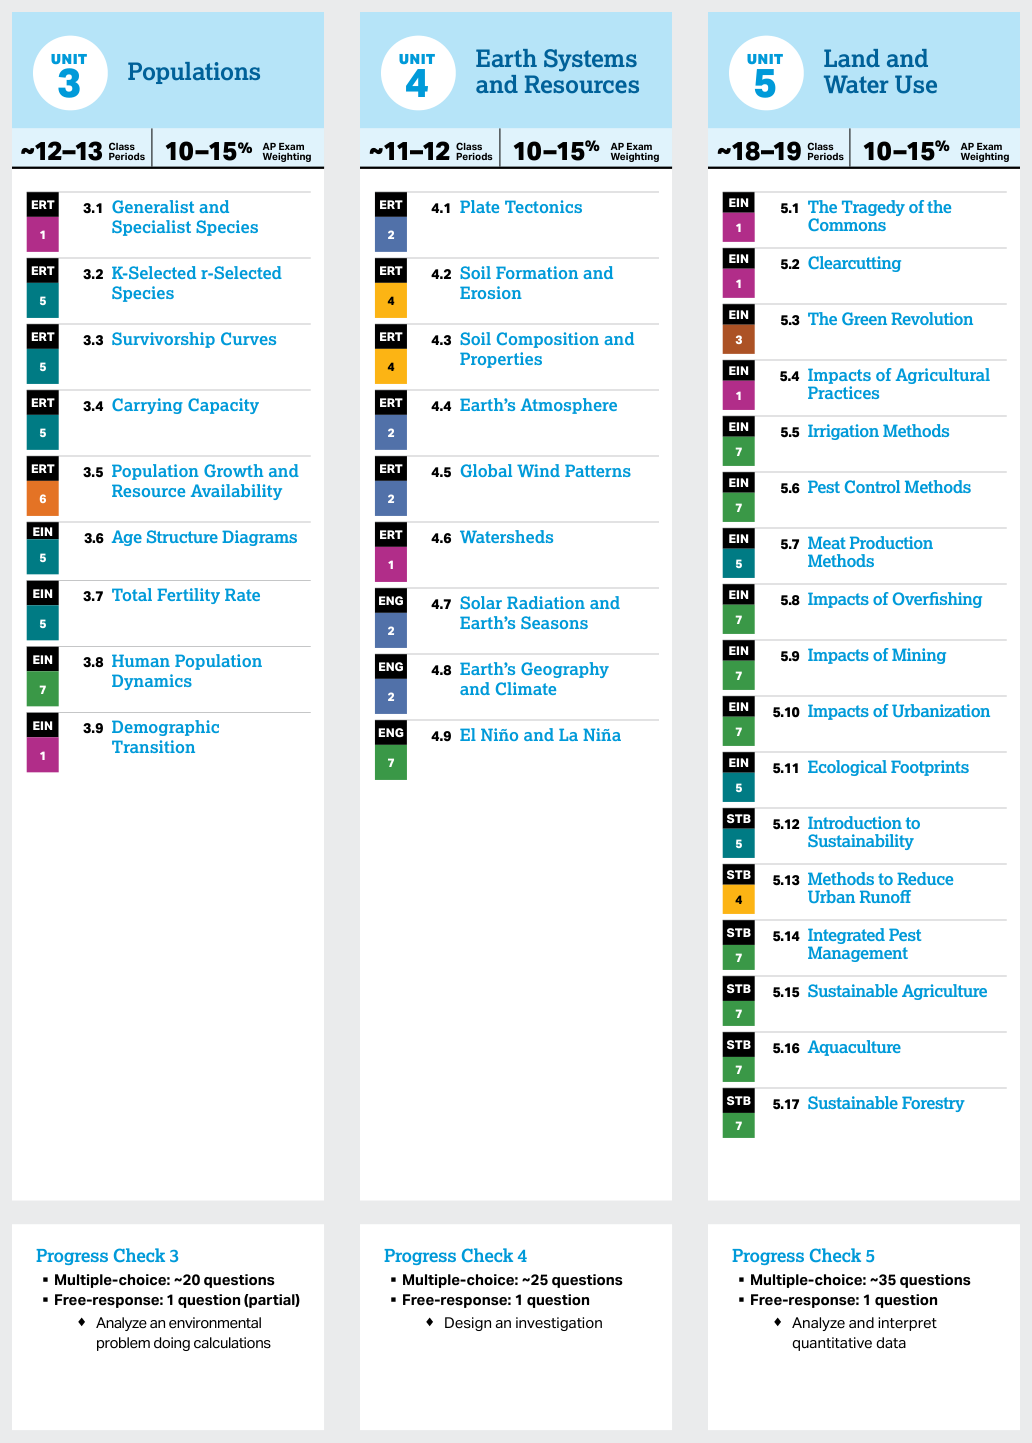
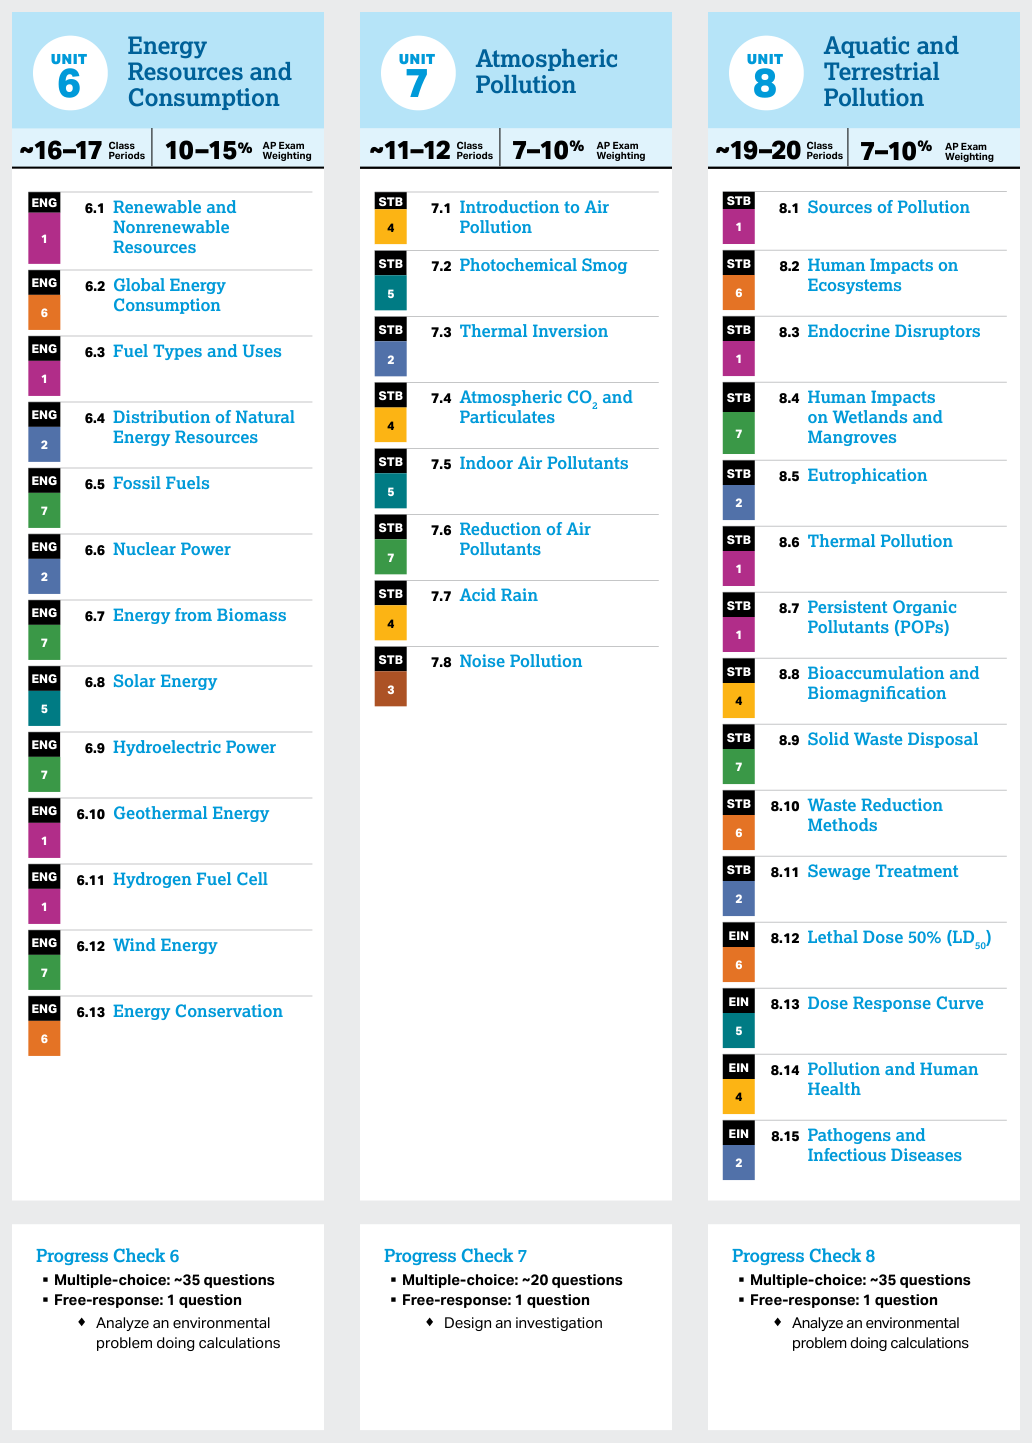
The Course at a Glance places ecosystems and biodiversity near the beginning because they establish relationships that later units reuse. Unit 1 leans strongly on ERT, ENG, Concept Explanation, and Visual Representations; Units 2–4 extend ERT into biodiversity, populations, soils, atmosphere, and climate. Units 5–9 increasingly emphasize EIN, STB, Data Analysis, Mathematical Routines, and Environmental Solutions.
The sequence shown in the Course at a Glance is an optional sequence, not a required order. Schools may organize instruction differently, provided the required content, Big Ideas, and science practices are addressed.
The seven Science Practices
The Big Ideas state what environmental understanding is being developed. The seven Science Practices state what students do with that understanding.
- Concept Explanation — Students explain environmental concepts, processes, or models in written formats. A strong explanation identifies a mechanism and connects cause to effect. For example, instead of merely stating that fertilizer causes algal blooms, a response explains that added nutrients increase algal growth, and decomposition of that biomass lowers dissolved oxygen.
- Visual Representations — Students describe or explain concepts and processes represented in diagrams, maps, graphs, models, and other visuals. They must read patterns and translate visual evidence into scientific language.
- Text Analysis — Students analyze written scientific or environmental information, including claims, evidence, assumptions, and implications.
- Scientific Experiments — Students plan or evaluate investigations. This includes identifying a testable question, independent and dependent variables, controls, repeated trials, and appropriate measurements.
- Data Analysis — Students interpret tables, graphs, and datasets; identify trends; compare groups; evaluate evidence; and use data to support a conclusion.
- Mathematical Routines — Students perform quantitative procedures such as percent change, rates, energy-transfer calculations, population calculations, and unit-based reasoning.
- Environmental Solutions — Students propose or evaluate solutions by connecting a strategy to an environmental problem, explaining its mechanism, and considering consequences or limitations.
How the practices work together
Environmental reasoning rarely uses only one practice. A typical investigation might begin with Text Analysis of a claim, use Scientific Experiments to design a test, apply Data Analysis to the results, use Mathematical Routines to calculate a rate or percentage, and finish with Concept Explanation and Environmental Solutions.
For example, suppose a wetland restoration project reports increased bird abundance. A scientifically careful response would ask: What was measured? Was there a comparison site? Did water quality change? Does the graph show correlation or a demonstrated cause? The ability to evaluate scientific accuracy, credibility, and validity prevents a visually impressive claim from being accepted without sufficient evidence.
Course-framework labels
The required-content labeling system moves from broad to specific:
$$ \text{Big Idea} \rightarrow \text{Enduring Understanding} \rightarrow \text{Learning Objective} \rightarrow \text{Essential Knowledge} $$
For instance, ERT may lead to an enduring understanding about ecosystems resulting from biotic and abiotic interactions. A learning objective then asks students to describe a distribution or process, while Essential Knowledge supplies the factual relationships needed to support that objective. Topic pages also pair content with a suggested practice, such as 1.A Explain environmental concepts and processes, 2.A, 2.B, or 6.C.
Assessment across the exam
The fully digital exam contains 80 multiple-choice questions in 90 minutes, worth 60% of the score, and three free-response questions in 70 minutes, worth 40%. Multiple-choice questions can combine any Big Idea with visual interpretation, text analysis, data, or calculations; free-response questions especially require complete-sentence explanations, investigation design, quantitative interpretation, calculations, and proposed environmental solutions.
Worked reasoning check: If a graph shows dissolved oxygen falling as nutrient concentration rises, do not write only “there is a negative relationship.” A creditworthy explanation identifies the mechanism: nutrient enrichment increases algal growth; decomposition increases biological oxygen demand; dissolved oxygen declines, potentially stressing aquatic organisms. That chain demonstrates Visual Representations, Data Analysis, and Concept Explanation together.
Key insight: Knowing an environmental fact is only the starting point. AP Environmental Science assesses whether you can use that fact to explain a mechanism, interpret evidence, evaluate an investigation, calculate a quantity, or defend a solution.
Retrieval check: Which Big Idea connects nutrient cycling, species interactions, and changes in water quality? Which Science Practice would you use to evaluate whether a graph supports a researcher’s claim?



1.1 Introduction to Ecosystems · 1.2 Terrestrial Biomes
Key concepts: Ecosystems · Terrestrial biomes · Biotic and abiotic factors · Climate · Global distribution of biomes · Species interactions · Resource distribution · Energy transformations · Temperate seasonal forests · Savannas
An ecosystem is a community of organisms interacting with one another and with the nonliving environment around them. A forest, for example, is not merely a collection of trees: sunlight, soil minerals, temperature, water, fungi, insects, birds, and decomposers continuously affect one another.
1.1 Introduction to Ecosystems · 1.2 Terrestrial Biomes
An ecosystem is a community of organisms interacting with one another and with the nonliving environment around them. A forest, for example, is not merely a collection of trees: sunlight, soil minerals, temperature, water, fungi, insects, birds, and decomposers continuously affect one another.
ERT-1 — Ecosystems are the result of biotic and abiotic interactions.
Ecosystems: living and nonliving factors
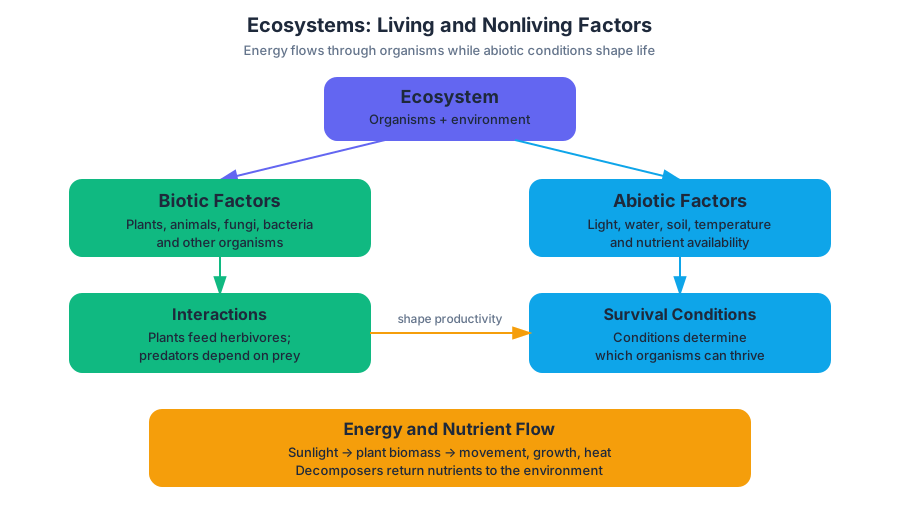
Biotic factors are living components, including plants, animals, fungi, bacteria, and other organisms. Abiotic factors are nonliving components, such as temperature, precipitation, sunlight, soil, salinity, wind, and nutrient availability. An ecosystem emerges from the interaction of both: plants require light, water, carbon dioxide, and nutrients; herbivores depend on plants; predators depend on prey; and decomposers return nutrients to the environment.
Energy also changes forms within ecosystems. Light energy can become chemical energy stored in plant biomass through photosynthesis; that chemical energy can then become movement, growth, heat, or chemical energy in another organism. Energy transfer is therefore linked to interactions among organisms, while abiotic conditions determine which organisms can survive and how productive the ecosystem can be.
Resources shape species interactions
Resources are not always distributed evenly. Resource distribution means the way necessities such as water, light, nutrients, food, or shelter vary across space and time. A shaded forest floor may receive little light but retain moisture, while a canopy receives intense light but may be exposed to drying winds. These differences create distinct opportunities and limits for different species.
Consider two plant species growing in the same forest. One has broad leaves and thrives in dim understory light; the other grows rapidly in bright canopy openings. If a fallen tree creates a sunny gap, the second species may outcompete the first there, while the shade-tolerant species remains successful beneath closed canopy. The resource pattern—light changing from place to place—helps determine species distributions and reduces or intensifies competition.
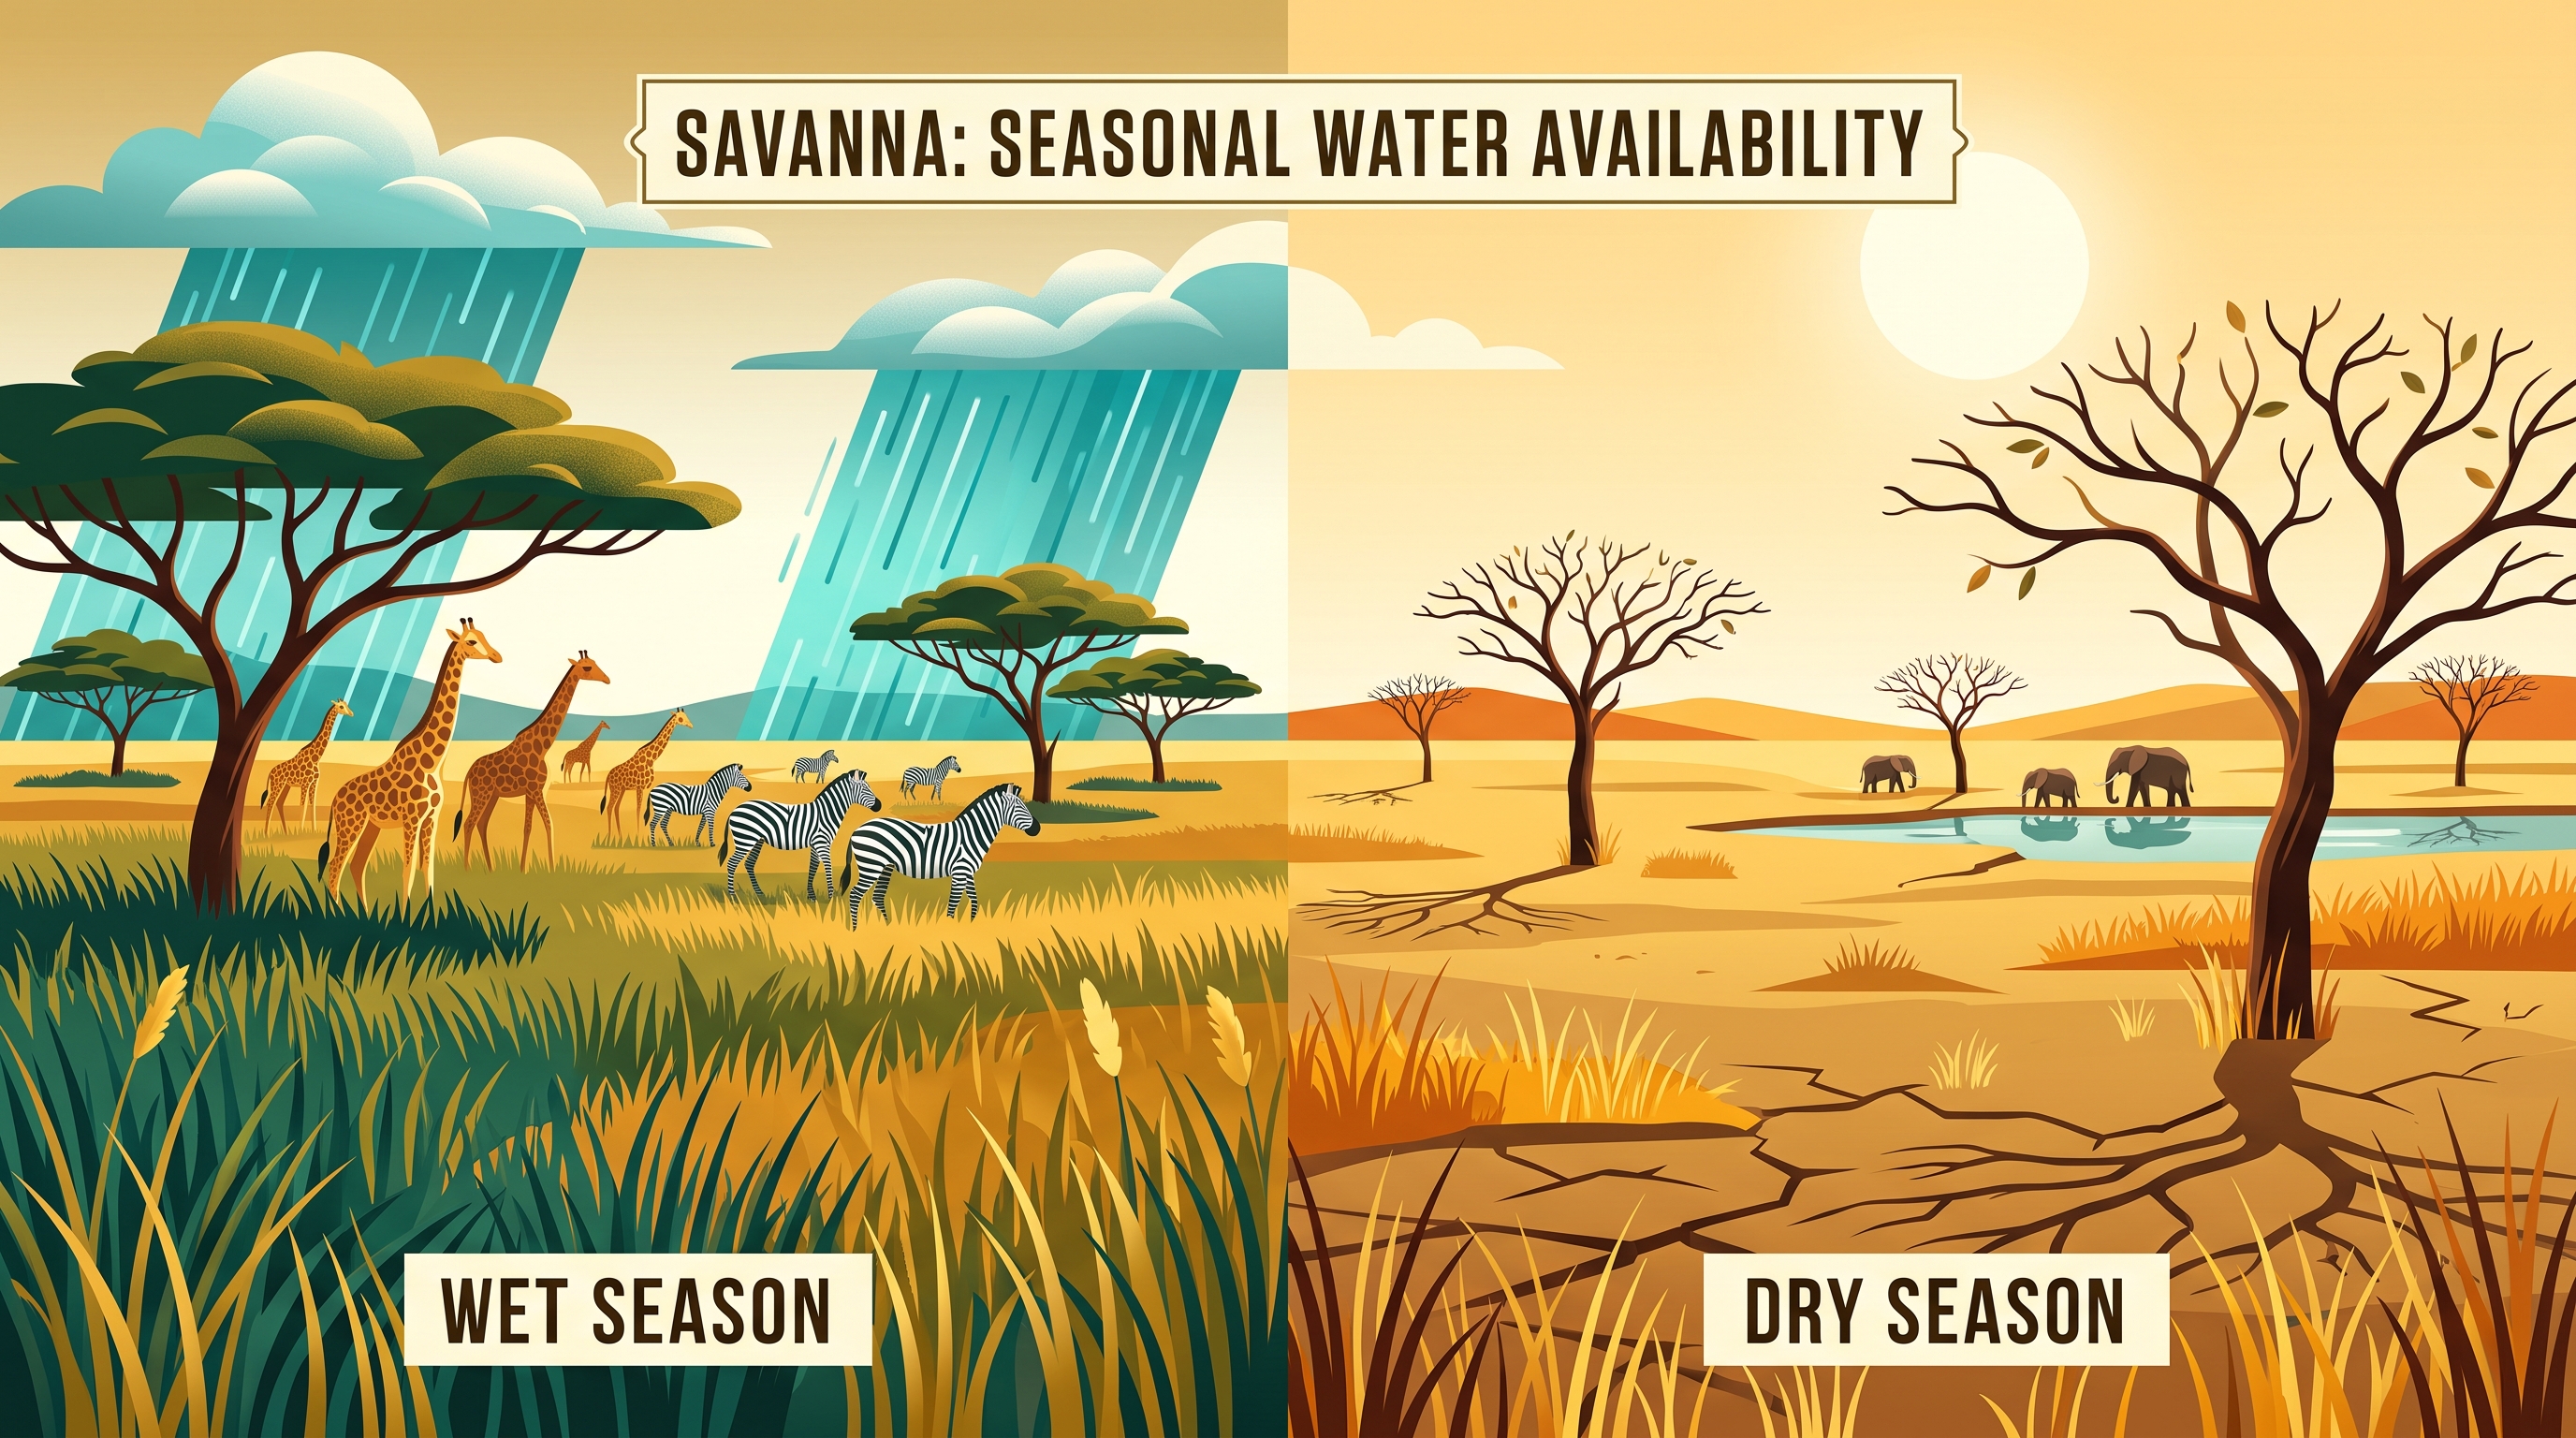
Resource availability can also change seasonally. In a savanna, water is abundant during the rainy season but scarce during the dry season. Organisms may compete more intensely for water, migrate, become dormant, or use different feeding times. Thus, species interactions depend not only on what resources exist, but also on where and when those resources are available.
Misconception check: “If two species use the same ecosystem, they must compete equally.”
Competition depends on overlap in resource use. Species that use different foods, spaces, seasons, or light levels may reduce competition through resource partitioning, even when they live in the same ecosystem.
Terrestrial biomes and climate
A biome is a large regional ecosystem identified by characteristic climate, vegetation, and organisms. Biomes occur across the globe in both terrestrial and aquatic environments, but terrestrial biomes are especially strongly shaped by temperature and precipitation. Latitude, elevation, seasonal patterns, and local conditions help explain why vegetation changes across Earth’s surface.
ERT-1.B — Describe the global distribution and principal environmental aspects of terrestrial biomes.
Major terrestrial biomes include tropical rain forests, tropical seasonal forests, savannas, deserts, temperate seasonal forests, temperate rain forests, temperate grasslands, chaparral, and taiga. Their boundaries are not rigid lines: climate can shift gradually across a landscape, and the worldwide distribution of biomes is dynamic. Past climate change has altered biome locations, and future climate change may shift them again.
The following comparison shows why similar-looking grasslands and forests cannot be identified from temperature alone.
| Biome | Seasonal pattern | Annual precipitation | Vegetation pattern |
|---|---|---|---|
| Temperate seasonal forest | Four distinct seasons | More precipitation than a savanna; precipitation occurs throughout the year | Deciduous and evergreen trees |
| Savanna | Warm conditions with distinct rainy and dry seasons | Less annual precipitation than a temperate seasonal forest | Grasses with scattered trees |
A temperate seasonal forest experiences four distinct seasons and receives precipitation throughout the year. A savanna has distinct rainy and dry seasons and receives less annual precipitation. Even if a savanna supports scattered trees, its seasonal drought and frequent water limitation favor grasses and drought-adapted organisms rather than a closed forest canopy.
Worked interpretation: identifying a biome
Suppose a climate record describes a region with four seasons, moderate temperatures, and precipitation in every month. The best interpretation is temperate seasonal forest, not savanna. The decisive evidence is the combination of four-season temperature patterns and year-round precipitation; a savanna would show a pronounced rainy season followed by a distinct dry season.
This reasoning demonstrates 1.B Concept Explanation: connect evidence about climate to the environmental characteristics and global distribution of a biome. On a map or climate graph, do not identify a biome from one variable alone. Match temperature, precipitation amount, and precipitation timing to the biome’s characteristic vegetation and organisms.
Retrieval check
A landscape receives heavy rain for six months and very little rain for six months, with warm temperatures year-round. Is it more consistent with a temperate seasonal forest or a savanna? Explain using both precipitation timing and ecosystem structure.
Answer: It is more consistent with a savanna because precipitation is concentrated in a rainy season followed by a distinct dry season. Seasonal water scarcity favors grasses and scattered trees rather than the continuous, year-round moisture associated with a temperate seasonal forest.
1.3 Aquatic Biomes · 1.4 The Carbon Cycle
Key concepts: Freshwater biomes · Marine biomes · Algae and aquatic primary productivity · Carbon reservoirs · Carbon cycle · Photosynthesis · Cellular respiration · Fossil fuel combustion · Carbon dioxide in the atmosphere · Aquatic photosynthesis in low-light environments
Water is not one ecosystem: a fast, oxygen-rich stream, a nutrient-loaded estuary, and a dark deep-ocean zone impose very different conditions on life. At the same time, these aquatic systems participate in the global carbon cycle, the movement of carbon among living organisms, the atmosphere, oceans, soils, and…
1.3 Aquatic Biomes · 1.4 The Carbon Cycle
Water is not one ecosystem: a fast, oxygen-rich stream, a nutrient-loaded estuary, and a dark deep-ocean zone impose very different conditions on life. At the same time, these aquatic systems participate in the global carbon cycle, the movement of carbon among living organisms, the atmosphere, oceans, soils, and geological stores.
1.3 Aquatic Biomes
The enduring understanding for this topic is ERT-1: Ecosystems are the result of biotic and abiotic interactions. The learning objective ERT-1.C: Describe the global distribution and principal environmental aspects of aquatic biomes requires more than naming ecosystems: it requires connecting their organisms and resources to abiotic conditions.
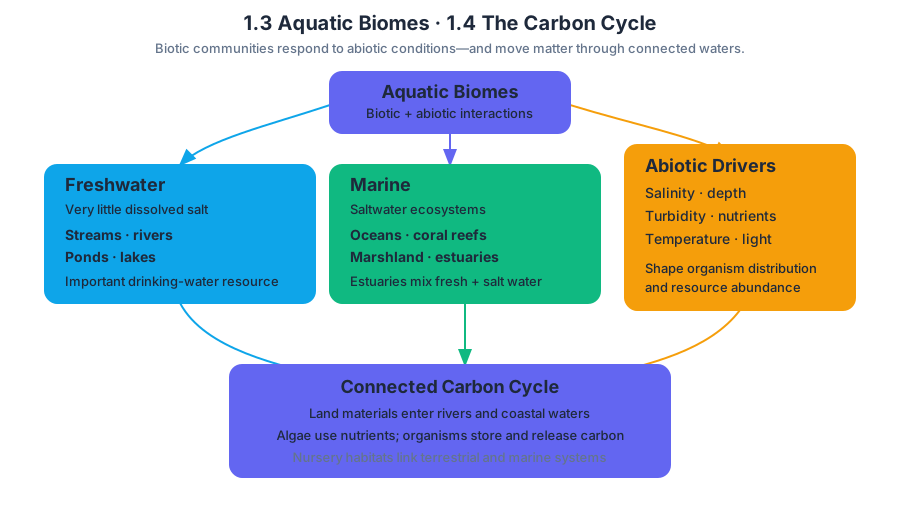
Freshwater biomes contain very little dissolved salt compared with marine systems. They include streams, rivers, ponds, and lakes, and they are a vital resource for drinking water.
Marine biomes include oceans, coral reefs, marshland, and estuaries. An estuary is a place where freshwater and seawater mix, producing changing salinity and often highly productive habitat. Marshland and estuarine environments also provide nursery habitat for many organisms and connect land-based materials to coastal waters.
The distribution of marine organisms and resources, including different types of fish, depends on a combination of salinity, depth, turbidity, nutrient availability, and temperature. These factors interact: nutrient-rich water may support abundant algae, but high turbidity can reduce the light available for photosynthesis.
Marine algae are especially important because they supply a large portion of Earth’s oxygen and take in carbon dioxide from the atmosphere. Aquatic photosynthesizers may live where visible light is limited, so they have adaptations that allow them to perform photosynthesis, the process of using light energy to convert carbon dioxide and water into stored chemical energy.
$$6CO_2 + 6H_2O \xrightarrow{\text{light energy}} C_6H_{12}O_6 + 6O_2$$
Misconception check — “Only forests produce important oxygen.” Forests are major terrestrial producers, but marine algae and other aquatic photosynthesizers supply a large portion of Earth’s oxygen. “Aquatic” does not mean ecologically minor.
Worked aquatic-biome example
A coastal estuary receives nutrient-rich freshwater after rainfall. The nutrients stimulate algal growth, but muddy runoff increases turbidity. The correct prediction is not simply “more nutrients means more productivity.” Initially, nutrients may increase algal production; if turbidity blocks light, however, photosynthesis can become light-limited. The outcome depends on the interaction between nutrient availability and turbidity.
This is an application of Science Practice 1: Concept Explanation, especially 1.B: Explain environmental concepts and processes. A strong explanation names the abiotic factor, identifies its effect on a biological process, and links that process to an ecosystem outcome.
1.4 The Carbon Cycle
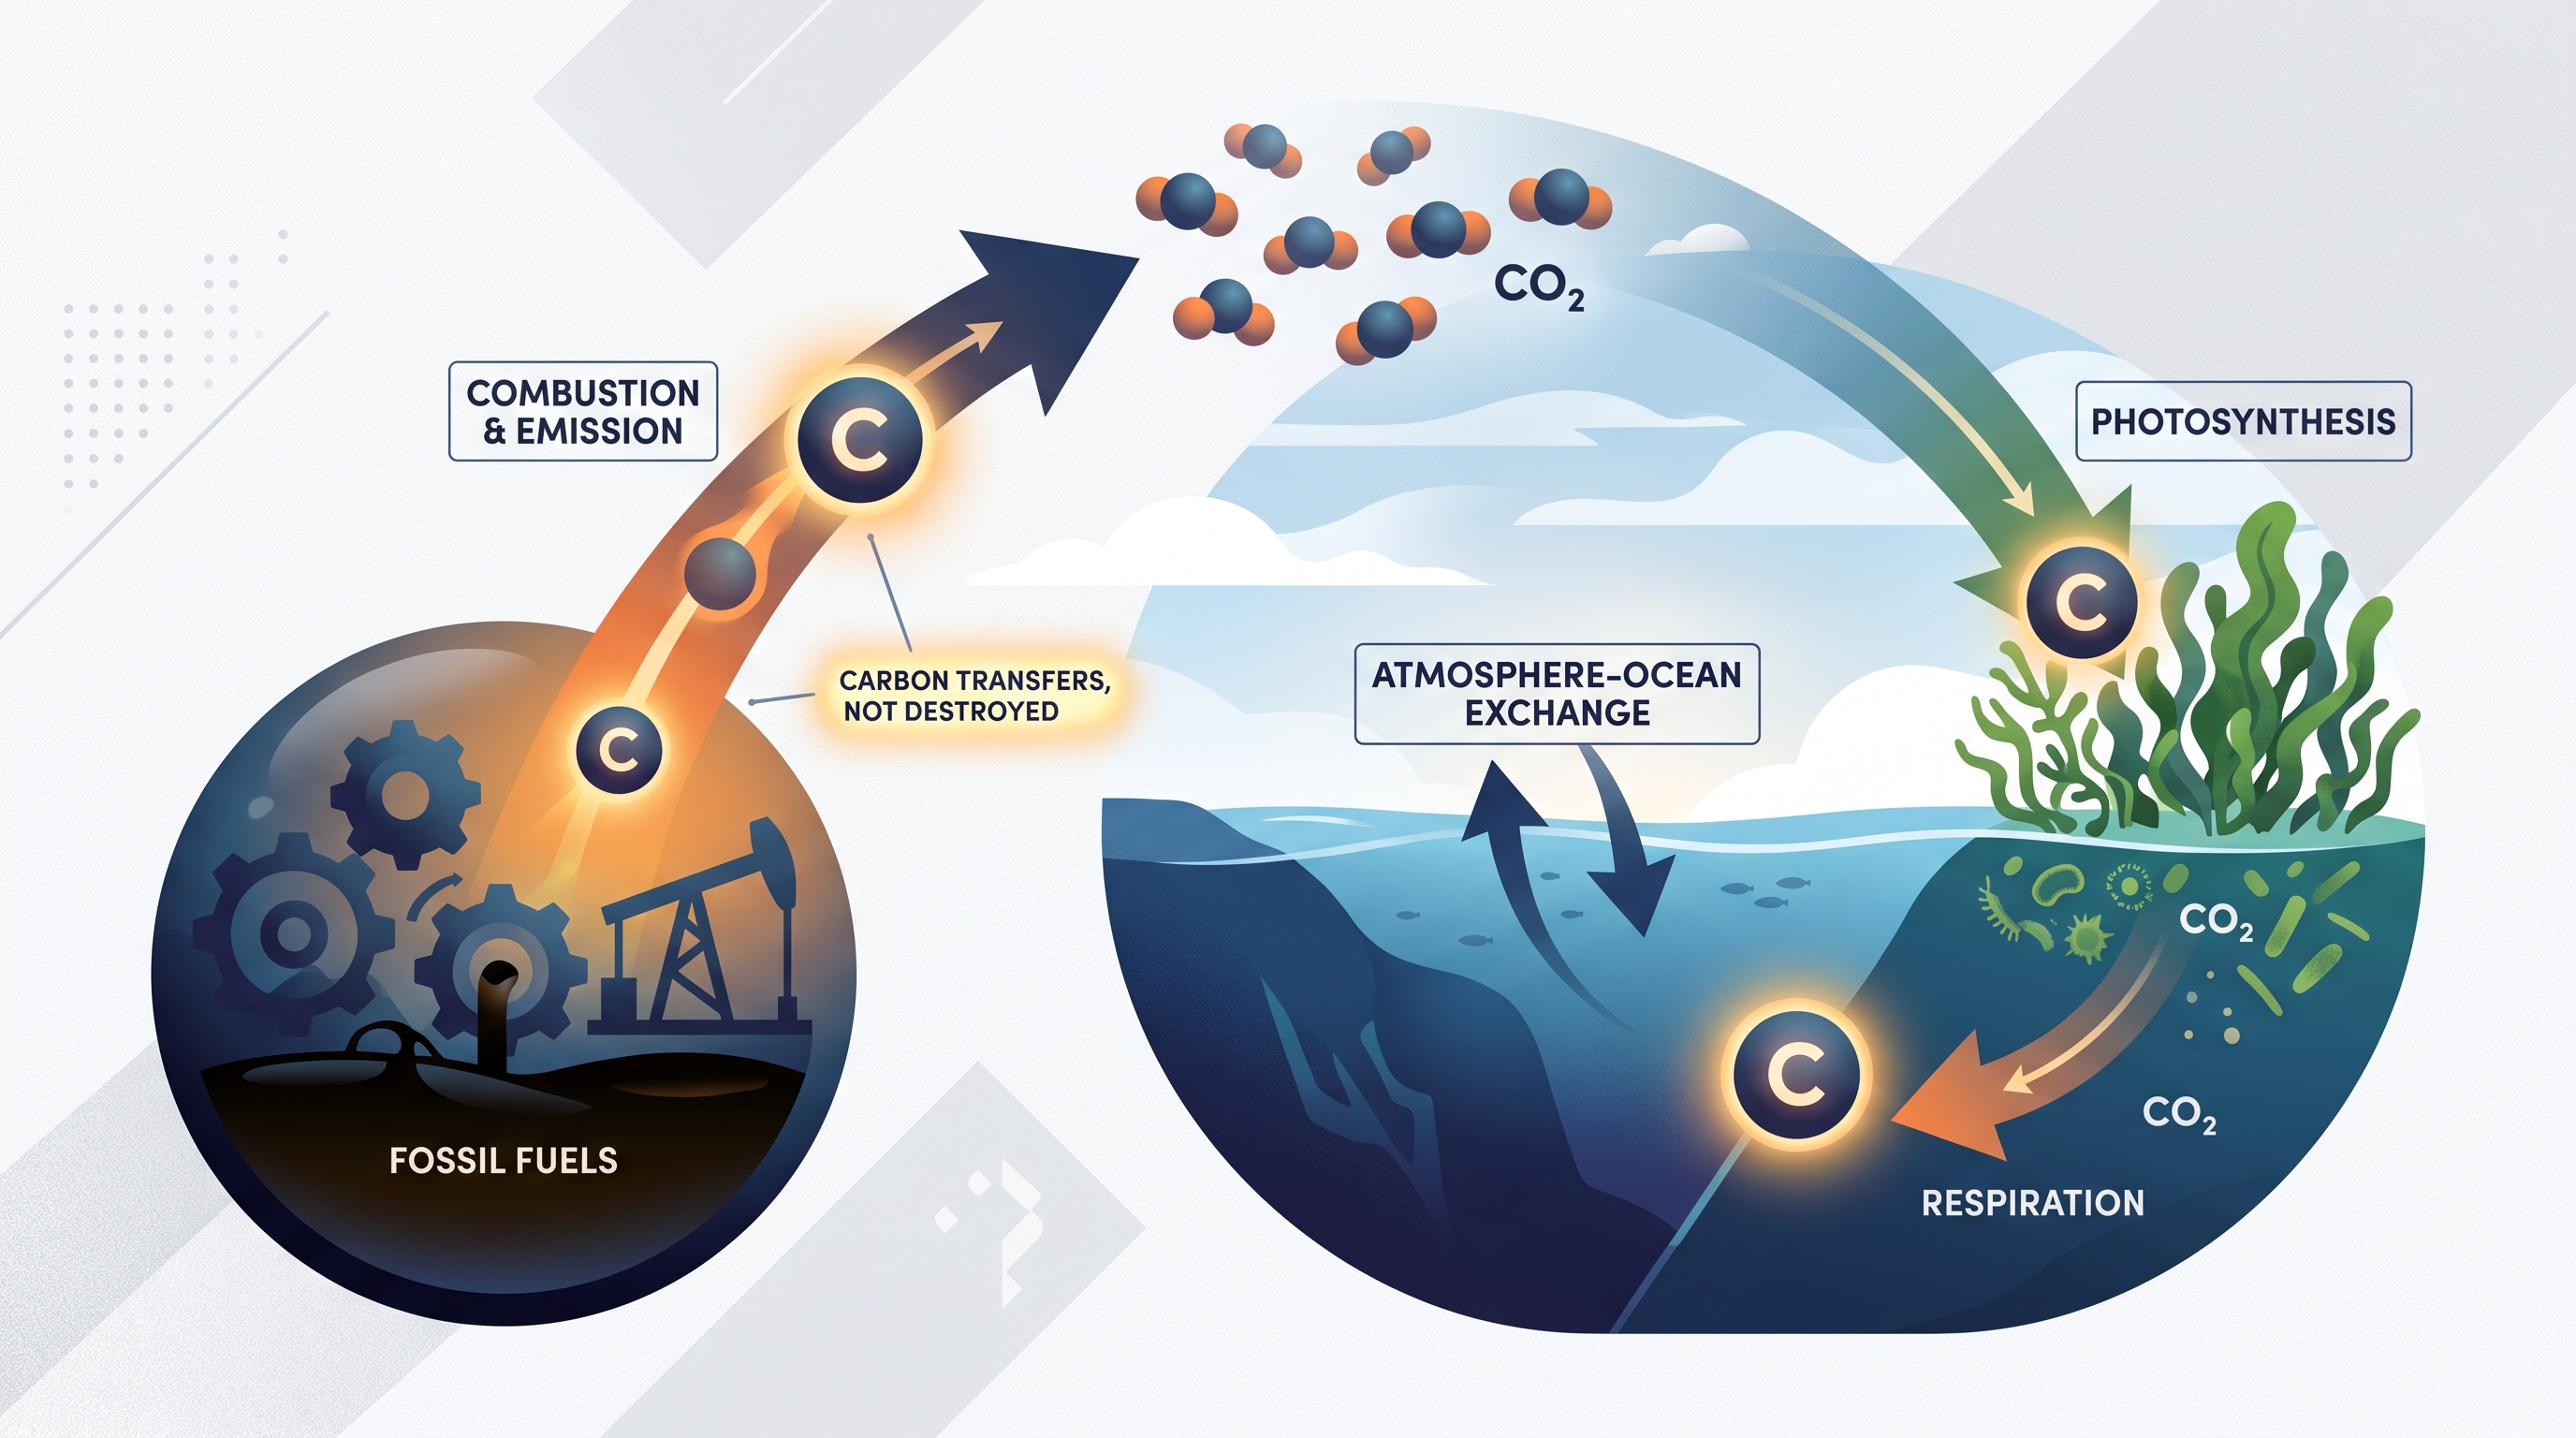
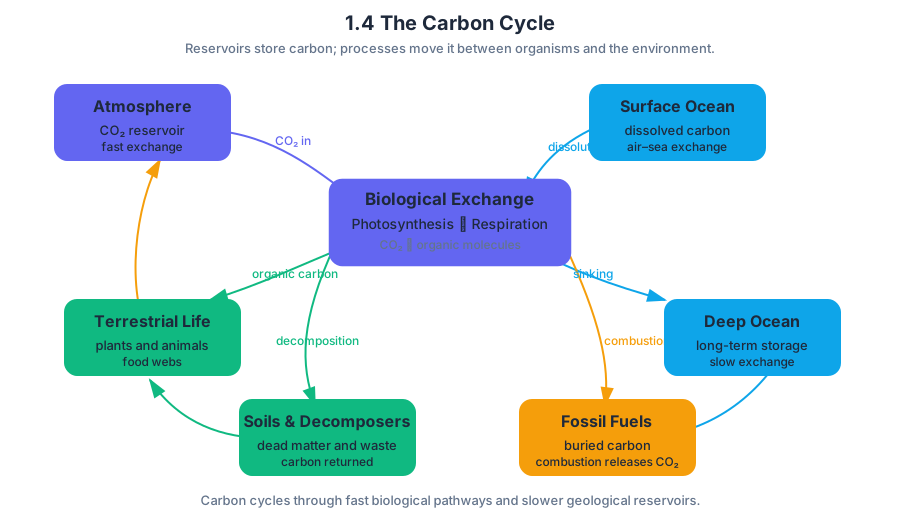
The learning objective for ERT-1.D: Explain how carbon cycles between organisms and the environment is built on the movement of carbon through reservoirs. A carbon reservoir is a place where carbon is stored for a period of time; reservoirs can exchange carbon at very different rates.
Important reservoirs include the atmosphere, surface ocean, deep ocean, marine organisms, fossil fuels, and terrestrial animals. Carbon also moves through plants, soils, decomposers, and other living organisms as ecosystems exchange matter with the surrounding environment.
The central biological exchange is between photosynthesis and cellular respiration:
- Photosynthesis removes $CO_2$ from the atmosphere or water and stores carbon in organic molecules.
- Cellular respiration breaks down organic molecules and returns carbon to the atmosphere or water as $CO_2$.
- Decomposition transfers carbon from dead organisms and waste into soils, sediments, water, and the atmosphere.
- Combustion releases stored carbon, especially from fossil fuels, as atmospheric $CO_2$.
Landfills can also increase atmospheric carbon dioxide. Organic waste decomposes, producing gases; when landfill gas is released or burned, carbon can ultimately enter the atmosphere as $CO_2$. The key reasoning move is to follow the carbon atom rather than memorize a single pathway.
Worked carbon-reservoir example
A power plant burns fossil fuel. Begin at the fossil-fuel reservoir and draw an arrow to the atmosphere:
$$\text{fossil fuels} \xrightarrow{\text{combustion}} \text{atmospheric } CO_2$$
The atmosphere can then exchange carbon with the surface ocean, while algae can remove dissolved carbon dioxide through photosynthesis and store it in marine biomass. If those organisms respire or decompose, some of that carbon returns to the water or atmosphere.
Misconception check — “Carbon is destroyed when fuel burns.” Combustion changes carbon-containing molecules into new substances; it does not destroy the carbon. The carbon moves from a long-term fossil-fuel reservoir into atmospheric carbon dioxide.
For an exam explanation, use Science Practice 2: Visual Representations when drawing or interpreting reservoir arrows, and Science Practice 5: Data Analysis when identifying a carbon-storage trend in a graph. A complete response states both the direction of movement and the process causing it.
Retrieval check: If marine algae remove carbon dioxide through photosynthesis and later undergo cellular respiration, which reservoir receives carbon next, and why? The expected reasoning is that respiration transfers carbon from marine organisms back to the surrounding water or atmosphere as $CO_2$.
1.5 The Nitrogen Cycle · 1.6 The Phosphorus Cycle
Key concepts: Nitrogen cycle · Nitrogen fixation · Nitrogen compounds as limiting nutrients · Human impacts on the nitrogen cycle · Strategies to reduce human impact on the nitrogen cycle · Phosphorus cycle · Phosphorus-bearing minerals and sediments · Phosphorus as a limiting nutrient · Absence of a significant atmospheric reservoir in the phosphorus cycle · Synthetic nitrogen fertilizer and compost application calculations
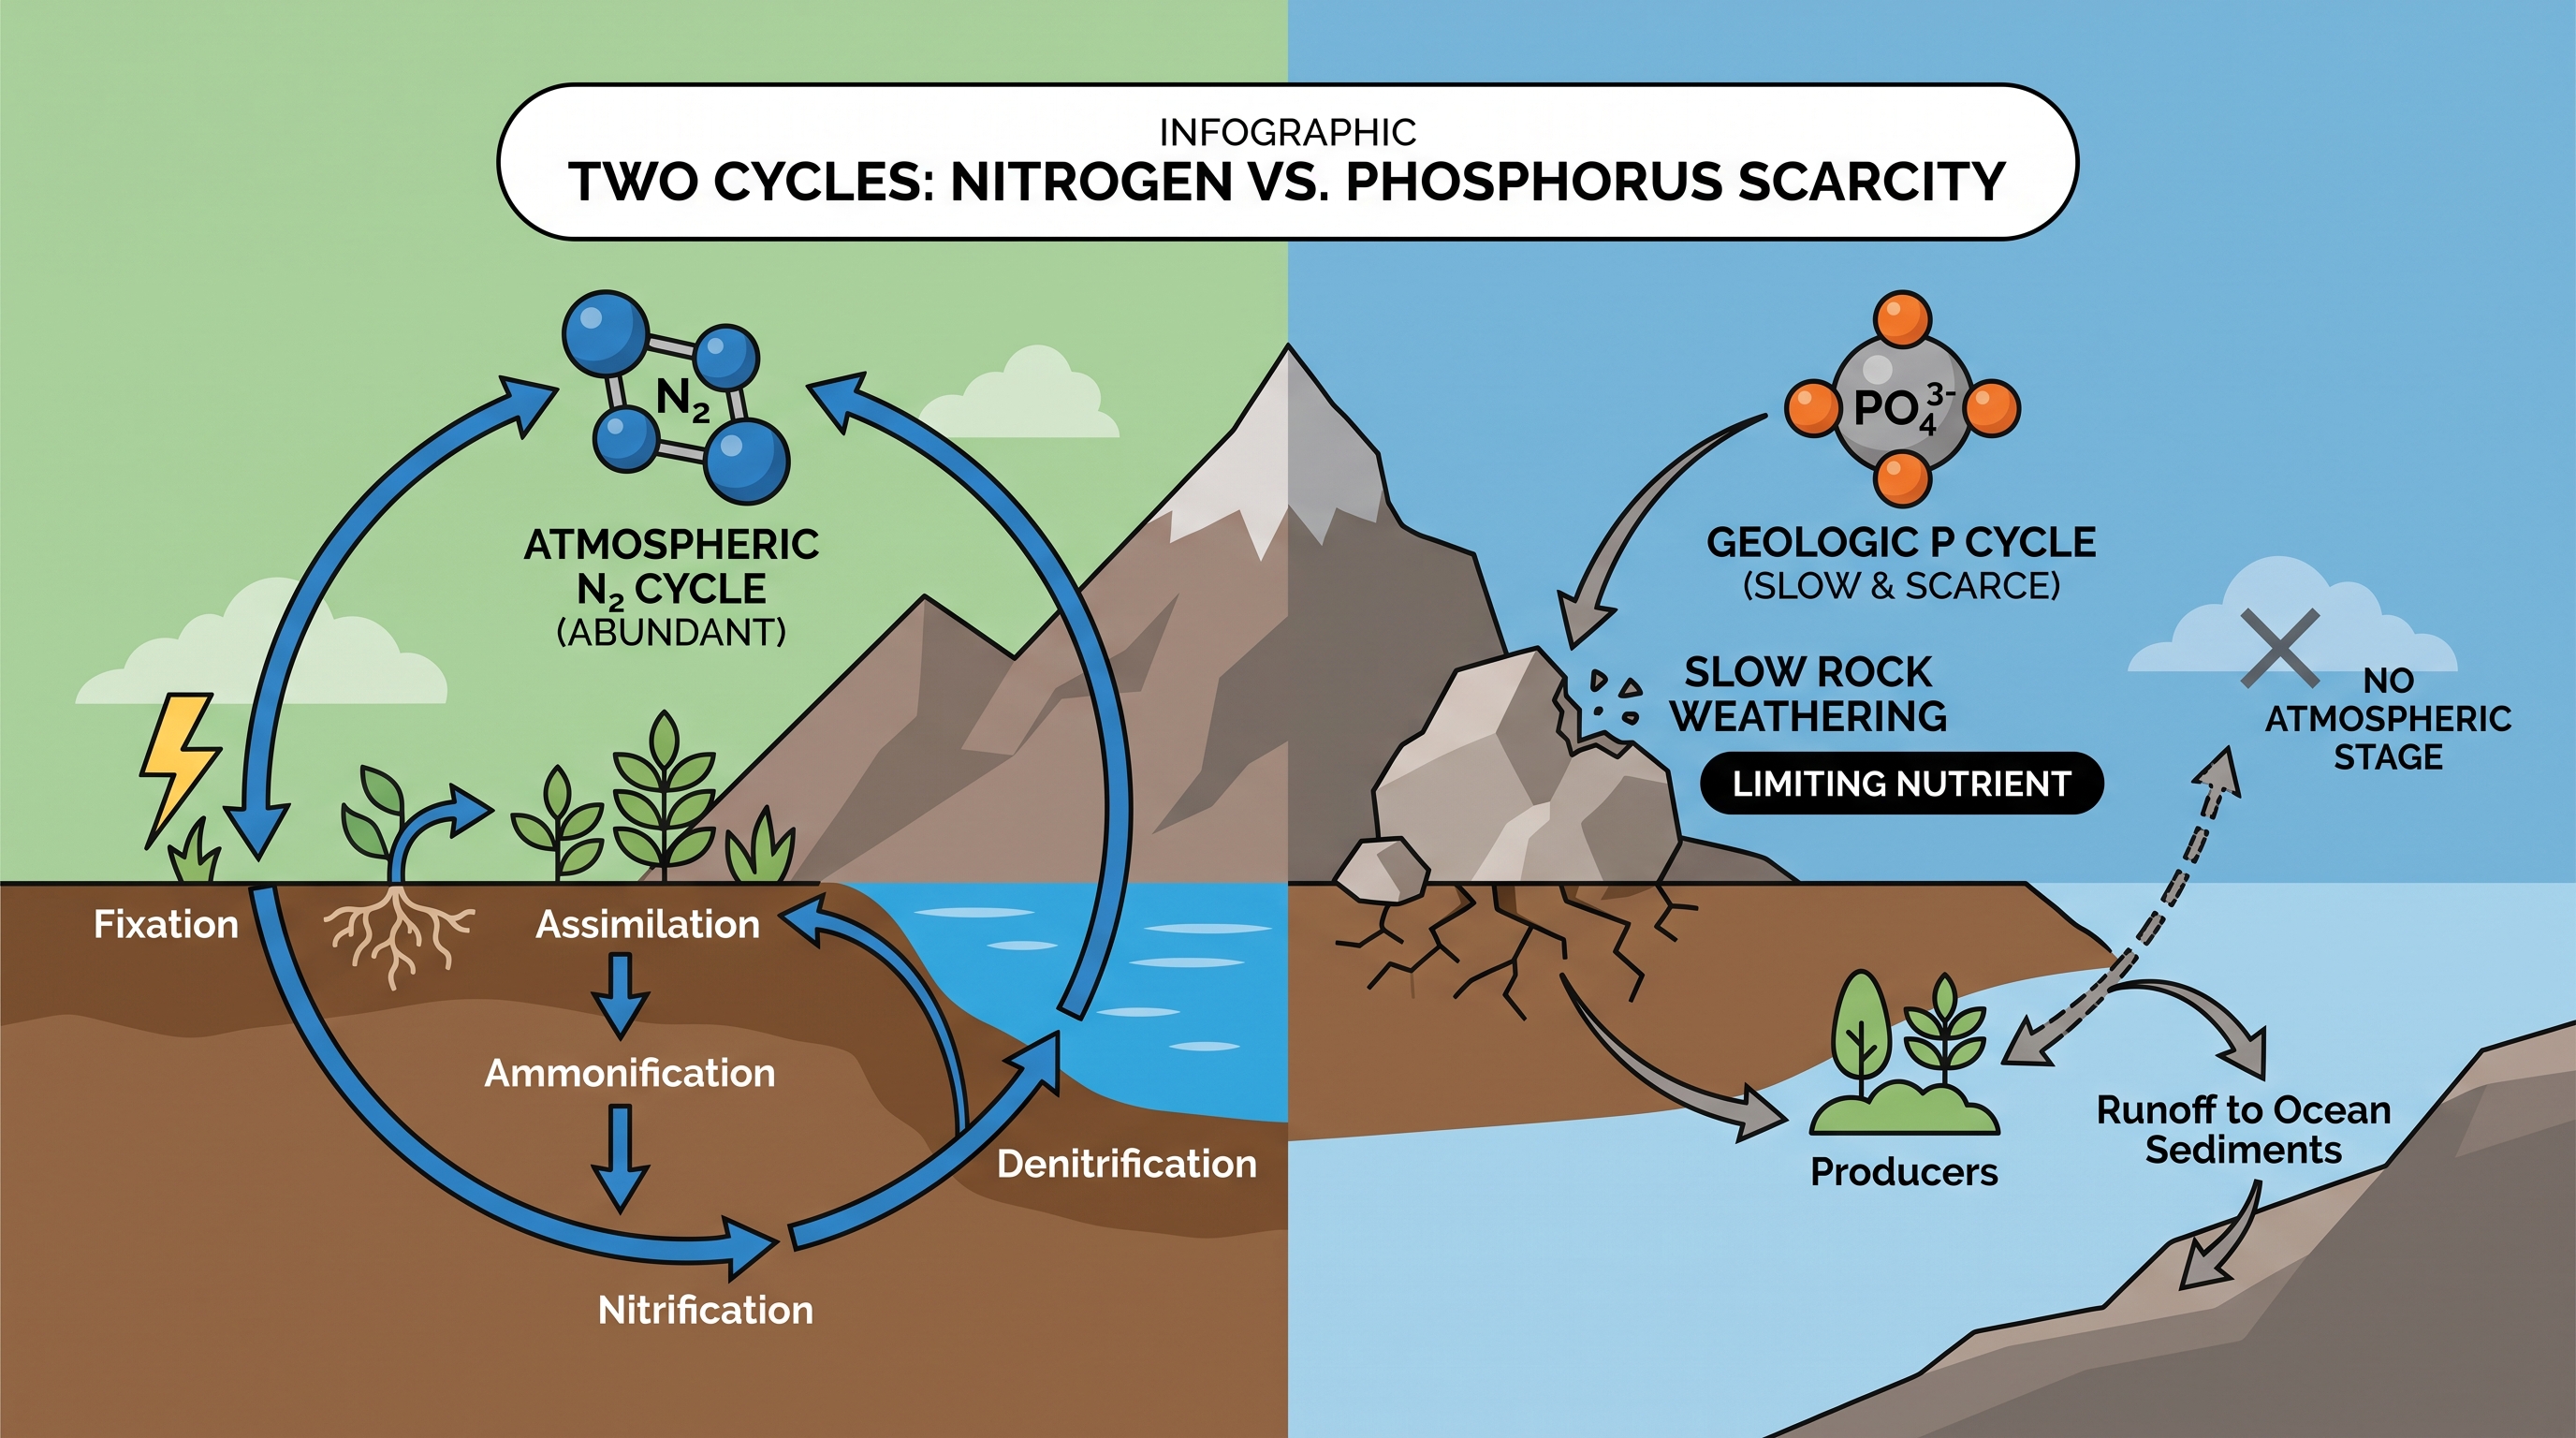
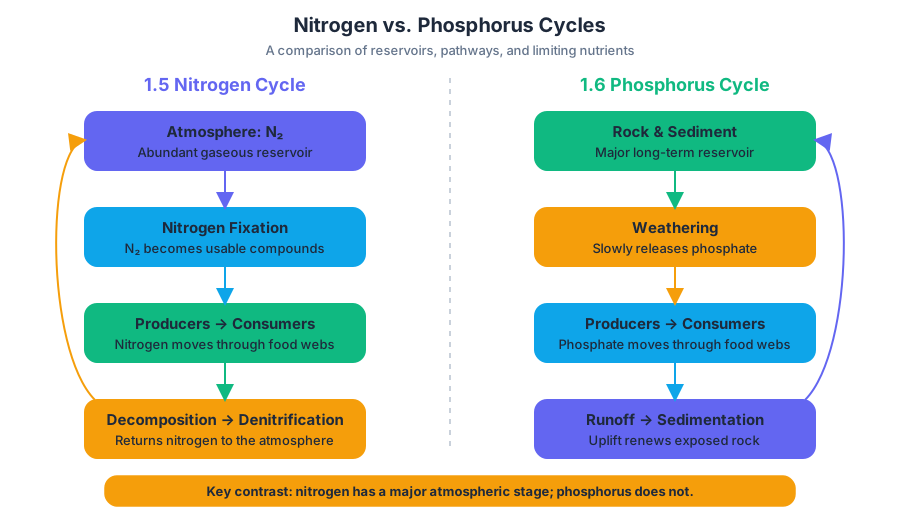
Nitrogen and phosphorus are both essential nutrients, but ecosystems often receive them through very different pathways: nitrogen enters through biological conversion of atmospheric $N_2$, while phosphorus is released mainly when rocks and sediments weather.
1.5 The Nitrogen Cycle · 1.6 The Phosphorus Cycle
Nitrogen and phosphorus are both essential nutrients, but ecosystems often receive them through very different pathways: nitrogen enters through biological conversion of atmospheric $N_2$, while phosphorus is released mainly when rocks and sediments weather. That difference determines which nutrient limits producer growth and how human activities disrupt each cycle.
The nitrogen cycle: making atmospheric nitrogen usable
The atmosphere is the largest reservoir of nitrogen, but most organisms cannot use atmospheric nitrogen gas, $N_2$, directly. Nitrogen fixation is the conversion of $N_2$ into ammonia, $NH_3$, and then ammonium, $NH_4^+$, forms that can enter biological processes. Soil microorganisms perform much of this conversion, so the availability of usable nitrogen compounds is limited by the rate of nitrogen fixation.
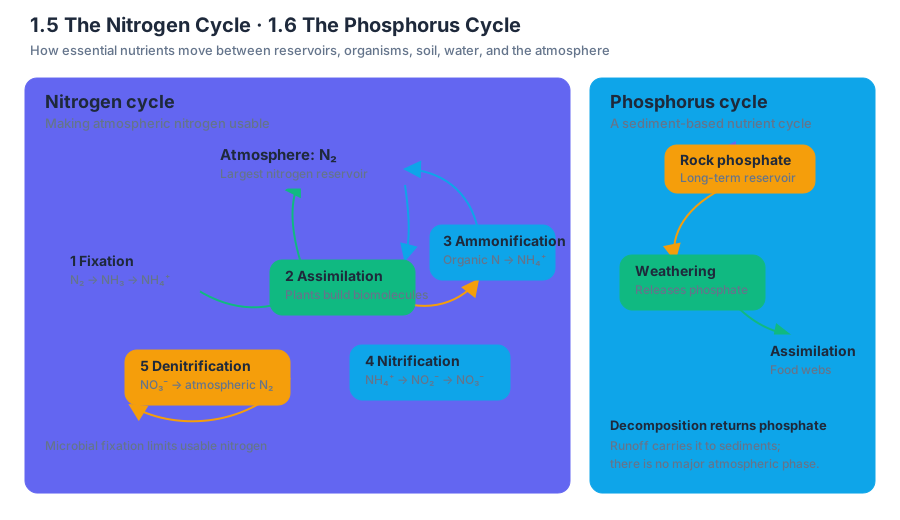
Under ERT-1.E.1, the nitrogen cycle is the movement of nitrogen between sources and sinks through five important processes:
- Fixation: Atmospheric $N_2$ becomes $NH_3$ and $NH_4^+$.
- Assimilation: Plants and other producers absorb inorganic nitrogen, especially ammonium or nitrate, and incorporate it into proteins and nucleic acids.
- Ammonification: Decomposers convert organic nitrogen in wastes and dead organisms into $NH_4^+$.
- Nitrification: Soil bacteria convert $NH_4^+$ first into nitrite, $NO_2^-$, and then into nitrate, $NO_3^-$.
- Denitrification: Other bacteria convert $NO_3^-$ back into atmospheric $N_2$, returning nitrogen to the atmosphere.
A reservoir is a place where matter is stored; a sink is a reservoir that receives and holds matter, at least temporarily. The atmosphere is the largest nitrogen reservoir, while soil, living biomass, wastes, and water contain nitrogen compounds in reservoirs that generally hold them for relatively short periods of time. This is a key distinction: nitrogen may be abundant globally but unavailable to plants locally.
Nitrogen as a limiting nutrient
A limiting nutrient is a nutrient whose scarcity restricts producer growth and therefore limits primary production. In many ecosystems, plants have adequate light, water, and carbon dioxide but cannot increase growth because usable nitrogen compounds are insufficient. Adding nitrogen can increase plant growth at first, but excess nitrogen may then wash into aquatic ecosystems and stimulate harmful algal growth.
Worked example — fertilizer and nitrogen loading. A garden receives nitrogen at a rate of $1\ \mathrm{kg}$ per $70.0\ \mathrm{m^2}$. For a $140\ \mathrm{m^2}$ garden:
$$ \text{nitrogen required}
140\ \mathrm{m^2} \left( \frac{1\ \mathrm{kg\ N}}{70.0\ \mathrm{m^2}} \right)
2.00\ \mathrm{kg\ N} $$
If compost contains $2.5%$ nitrogen by mass, the compost required is:
$$ \text{compost mass}
\frac{2.00\ \mathrm{kg\ N}}{0.025}
80.0\ \mathrm{kg\ compost} $$
If a synthetic fertilizer were labeled $10%$ nitrogen, the equivalent fertilizer mass would be:
$$ \frac{2.00\ \mathrm{kg\ N}}{0.10}
20.0\ \mathrm{kg\ fertilizer} $$
The nitrogen percentage must be written as a decimal before dividing.
Human impacts and defensible solutions
Human activities accelerate nitrogen movement. Applying more fertilizer or manure than crops can absorb increases nitrate runoff and groundwater contamination. Burning fossil fuels produces nitrogen oxides, which contribute to atmospheric pollution and can return to ecosystems through deposition. Excess irrigation can waterlog soil, filling soil pores with water and reducing oxygen availability; this can alter microbial transformations, including denitrification.
A viable reduction strategy must identify both the action and the mechanism. For example, farmers can use precision fertilizer application: apply nitrogen at the crop’s actual rate and near the time of greatest uptake. This reduces the amount available for runoff or leaching while maintaining crop production. Vegetated buffer strips provide a second defense by slowing runoff and allowing plants and soil microbes to retain or transform nitrogen before it reaches a stream.
Misconception check: “More nitrogen always means more plant growth.”
Nitrogen increases production only when nitrogen is limiting and other conditions remain suitable. Beyond the required amount, additional nitrogen becomes pollution rather than a growth benefit.
For this topic, Suggested Skill: Visual Representations means tracing each arrow between nitrogen reservoirs and labeling the process responsible for the transfer. Concept Application requires linking a changed process—such as excess fertilizer application—to a consequence such as nitrate pollution or eutrophication. Environmental Solutions requires justifying why a proposed intervention reduces a specific human impact.
The phosphorus cycle: a sediment-dominated cycle
Under ERT-1.F.1, the phosphorus cycle is the movement of atoms and molecules containing phosphorus between sources and sinks. Its major reservoirs are phosphorus-bearing minerals in rock and ocean sediments, not the atmosphere.
Weathering slowly releases phosphate from rock into soil and water. Producers absorb phosphate, consumers obtain it by feeding, and decomposition returns phosphorus to soil or water. Some phosphorus is carried by runoff into lakes and oceans, where it becomes part of sediments; over geologic time, uplift can expose these sediments and rocks to renewed weathering.
ERT-1.F.2 emphasizes that the phosphorus cycle lacks a significant atmospheric component. ERT-1.F.3 explains why phosphorus is relatively scarce: rocks weather slowly. Consequently, phosphorus is often a limiting nutrient for plants and other producers, particularly in freshwater and some terrestrial ecosystems.
Misconception check: “All nutrient cycles have major atmospheric stages.”
Nitrogen does, because the atmosphere stores abundant $N_2$. Phosphorus does not; its long-term storage is concentrated in rocks and sediments.
Retrieval check: Name the five nitrogen-cycle processes in order from atmospheric nitrogen entering biological availability to its return to the atmosphere. Then explain why phosphorus limitation is especially likely when rock weathering is slow. A complete response should include fixation, assimilation, ammonification, nitrification, denitrification, and the absence of a significant atmospheric phosphorus reservoir.
1.7 The Hydrologic (Water) Cycle · 1.8 Primary Productivity
Key concepts: The hydrologic (water) cycle · Primary productivity · Gross primary productivity (GPP) · Photosynthesis · Net primary production (NPP) · Solar energy conversion · Energy flow in ecosystems · Productivity comparisons among common ecosystems · Productivity measured per unit area · Productivity measured as total energy
A forest can grow only where water arrives, remains available, and can be moved through living tissue; an ocean can contain abundant water yet support very different photosynthetic activity at different depths.
1.7 The Hydrologic (Water) Cycle · 1.8 Primary Productivity
A forest can grow only where water arrives, remains available, and can be moved through living tissue; an ocean can contain abundant water yet support very different photosynthetic activity at different depths. The hydrologic cycle describes the movement and distribution of water through Earth’s atmosphere, land, surface waters, groundwater, and organisms, while primary productivity measures how quickly photosynthesizers convert solar energy into stored chemical energy.
The hydrologic cycle: water in motion
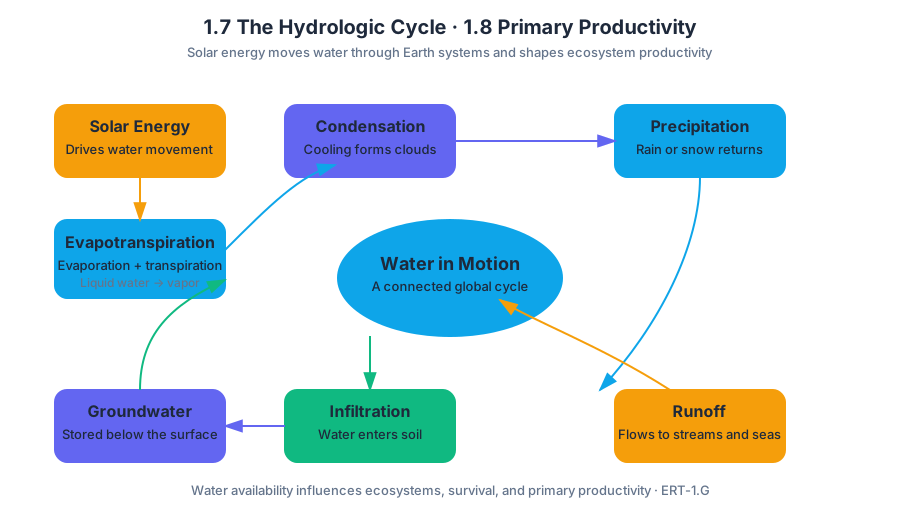
Water is a globally distributed natural resource, but it is not distributed evenly in usable forms. Solar energy drives evaporation, the conversion of liquid water to water vapor, from oceans, lakes, and soil. Plants add water vapor through transpiration, the release of water from leaves. Together, evaporation and transpiration are often called evapotranspiration.
As moist air rises and cools, water vapor undergoes condensation and forms clouds. Water then returns to Earth as precipitation, including rain or snow. Once it reaches the surface, some water enters soil through infiltration, some moves across the land as runoff, and some becomes groundwater that can later flow into streams, lakes, or oceans.
The cycle is not merely a list of processes: it connects Earth systems. For example, vegetation can slow runoff, increase infiltration, and return water to the atmosphere through transpiration. The global distribution of water therefore affects which ecosystems can exist, how productive they can be, and which organisms can survive there. This relationship is part of ERT-1.G, the Earth-systems reasoning associated with water availability and resource distribution.
Worked example: why two landscapes receive the same rain but retain different amounts
Suppose a forest and a paved urban area each receive $100\ \text{mm}$ of rainfall. Forest soil and plant roots allow a substantial portion to infiltrate, while leaves intercept some precipitation and release water gradually through transpiration. Pavement prevents infiltration, so a larger fraction becomes rapid runoff, potentially carrying pollutants into a stream and increasing flood risk.
Misconception check — “Rainfall equals water availability.” Not necessarily. Water availability depends on precipitation and storage, infiltration, runoff, evaporation, transpiration, groundwater access, and human use. A region may receive substantial precipitation but still experience seasonal water shortages if water leaves the system rapidly or demand exceeds supply.
Primary productivity: converting sunlight into biomass
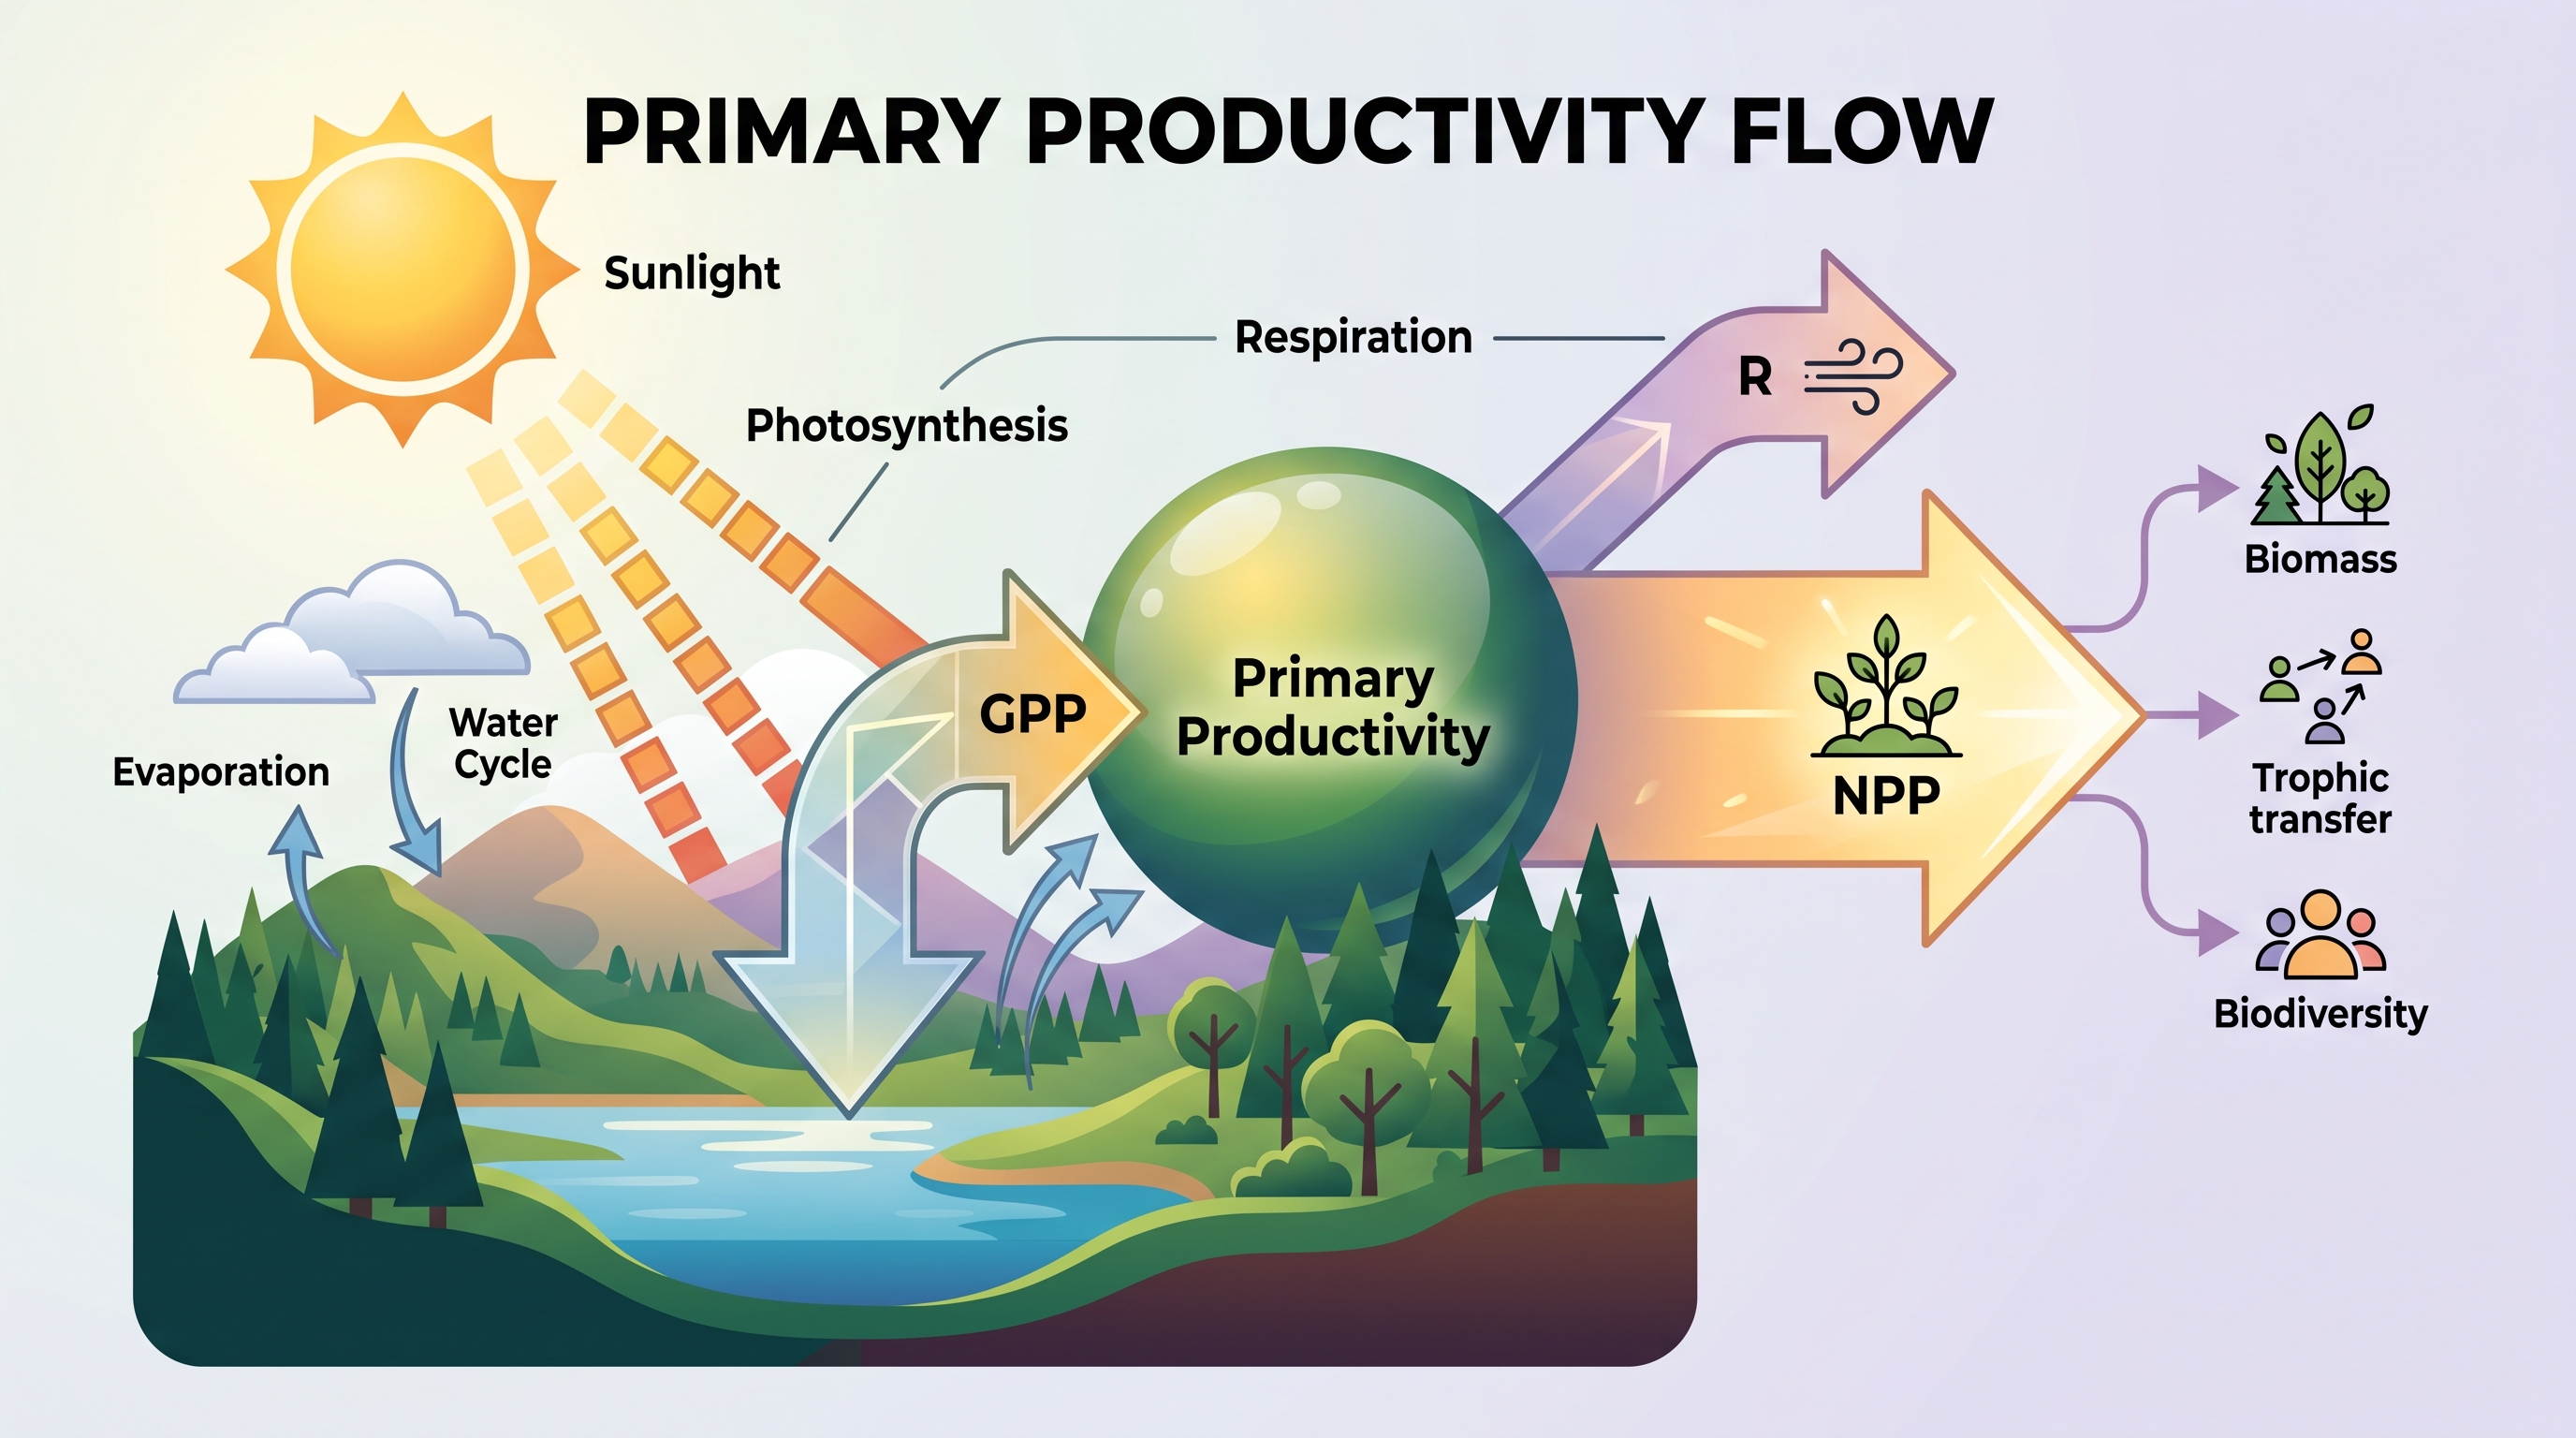
Primary productivity is the rate at which solar energy is converted into organic compounds through photosynthesis over a unit of time (ENG-1.A.1). During photosynthesis, producers use light energy to build energy-rich organic molecules from carbon dioxide and water:
$$ 6CO_2 + 6H_2O + \text{light energy} \rightarrow C_6H_{12}O_6 + 6O_2 $$
The total rate of photosynthesis in a given area is gross primary productivity (GPP) (ENG-1.A.2). Producers do not retain all of this captured energy: they use some for cellular respiration. The energy remaining after respiration is net primary productivity (NPP), the rate of energy storage by photosynthesizers (ENG-1.A.3):
$$ \text{NPP} = \text{GPP} - \text{respiration} $$
Productivity is commonly expressed as energy per unit area per unit time, such as $\text{kcal},\text{m}^{-2},\text{yr}^{-1}$ (ENG-1.A.4). It can also be expressed as total energy, such as total $\text{kcal}$ produced by an entire ecosystem. These are different measurements: one describes intensity per area, while the other describes the overall energy captured.
Per-unit-area productivity versus total productivity
Imagine two ecosystems:
| Ecosystem | Area | Productivity | Total energy captured |
|---|---|---|---|
| Coastal marsh | $10\ \text{km}^2$ | $1{,}000\ \text{kcal},\text{m}^{-2},\text{yr}^{-1}$ | Smaller total |
| Open ocean | Very large | $100\ \text{kcal},\text{m}^{-2},\text{yr}^{-1}$ | Larger total |
The marsh may be more productive per square meter, but the immense ocean can capture more energy in total. Misconception check — “The ecosystem with the highest productivity per unit area produces the most energy overall.” This confuses a rate density with a total. To compare total productivity, multiply productivity per unit area by ecosystem area, after converting all areas to compatible units.
Light limits aquatic productivity
Light availability changes with depth. Most red light is absorbed within the upper $1\ \text{m}$ of water, while blue light can penetrate deeper than $100\ \text{m}$ only in the clearest water (ENG-1.A.5). Aquatic photosynthesizers therefore adapt to limited visible light, and productivity generally declines below the well-lit surface zone.
A lake with clear water may support photosynthesis deeper than a muddy lake because suspended particles scatter and absorb light. However, nutrients, temperature, mixing, and the availability of carbon dioxide also influence productivity; light alone does not determine GPP or NPP.
AP skill and retrieval check
This topic is directly assessed through Science Practice 1.A, Concept Explanation: Describe environmental concepts and processes. A strong explanation links mechanism to outcome: sunlight powers photosynthesis, photosynthesis produces GPP, respiration reduces stored energy, and the remainder is NPP. Science Practice 2, Visual Representations, Science Practice 5, Data Analysis, and Science Practice 6, Mathematical Routines may require interpreting or calculating productivity from graphs.
Retrieval check: An ecosystem has a GPP of $2{,}400\ \text{kcal},\text{m}^{-2},\text{yr}^{-1}$ and producer respiration of $900\ \text{kcal},\text{m}^{-2},\text{yr}^{-1}$. Its NPP is:
$$ 2{,}400 - 900 = 1{,}500\ \text{kcal},\text{m}^{-2},\text{yr}^{-1} $$
If a second ecosystem has lower productivity per unit area but covers a much larger area, it may still have greater total productivity.
1.9 Trophic Levels · 1.10 Energy Flow and the 10% Rule
Key concepts: Trophic levels · Energy flow through ecosystems · The 10% rule · Producers · Primary, secondary, and tertiary consumers · Food chains and food webs · Omnivores and carnivores · Detritivores and decomposers · Nutrient cycling · Energy and matter in ecosystems
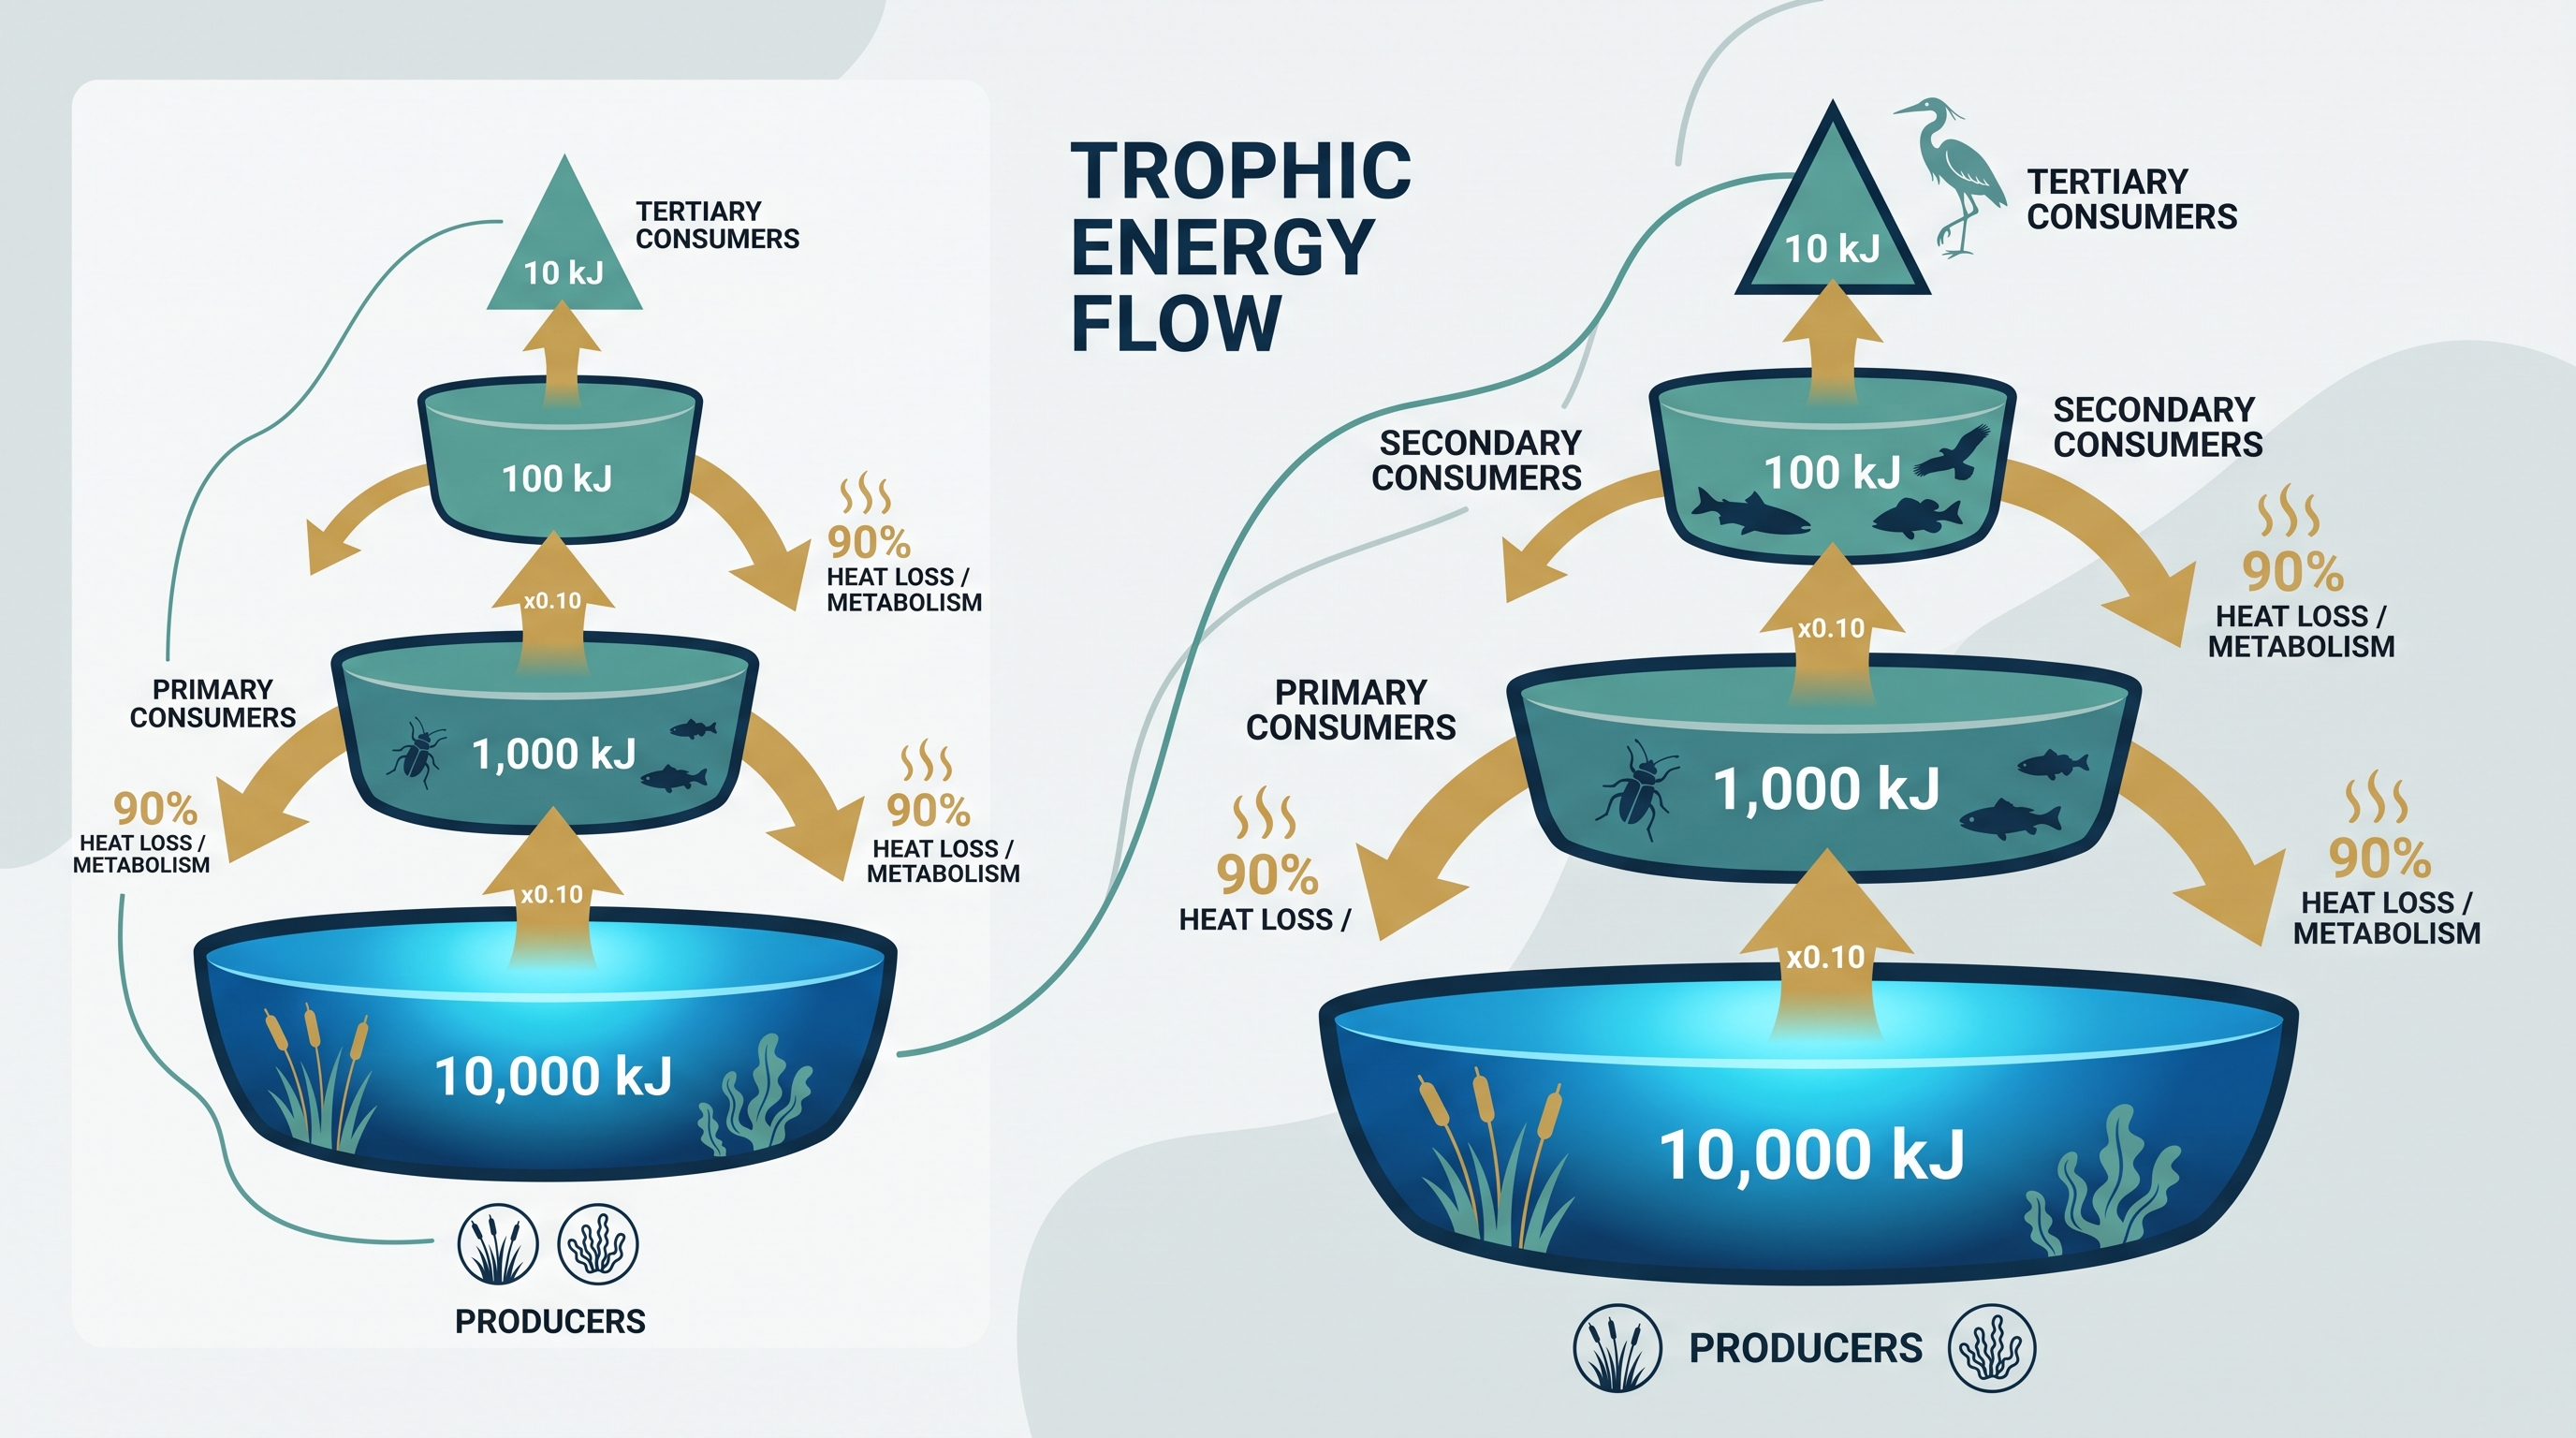
Only about $10\%$ of the energy available at one trophic level reaches the next, so ecosystems contain progressively less usable energy as energy moves upward from producers to consumers.
1.9 Trophic Levels · 1.10 Energy Flow and the 10% Rule
Only about $10%$ of the energy available at one trophic level reaches the next, so ecosystems contain progressively less usable energy as energy moves upward from producers to consumers.
The energy staircase
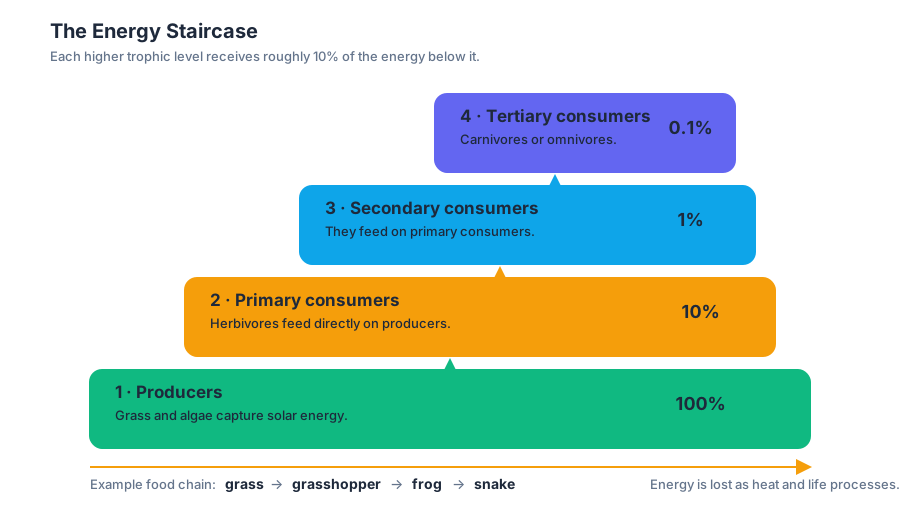
Imagine a staircase whose bottom step is wide and whose higher steps become sharply narrower. The bottom step represents producers, organisms such as plants and algae that capture solar energy and store it as chemical energy. Each higher step represents a trophic level, or feeding position in an ecosystem.
Under ENG-1.C and its required knowledge, trophic levels organize organisms according to how they obtain energy:
- Producers occupy the first trophic level.
- Primary consumers occupy the second trophic level and feed directly on producers. They are usually herbivores.
- Secondary consumers occupy the third trophic level and feed on primary consumers.
- Tertiary consumers occupy the fourth trophic level and feed on secondary consumers. They may be carnivores or omnivores.
A useful chain is:
$$ \text{grass} \rightarrow \text{grasshopper} \rightarrow \text{frog} \rightarrow \text{snake} $$
Here, grass is the producer, the grasshopper is the primary consumer, the frog is the secondary consumer, and the snake is the tertiary consumer. The arrows represent the direction of energy transfer: energy moves from the organism being eaten to the organism that eats it.
Why energy decreases upward
At every trophic level, organisms use much of the energy they obtain for cellular respiration, movement, growth, reproduction, and maintaining body functions. Much of that energy ultimately leaves the ecosystem as heat; additional energy remains in uneaten material or waste. Therefore, only about one-tenth is transferred to the next level.
10% rule:
$$\text{Energy transferred} = 0.10 \times \text{energy available at the previous trophic level}$$
The remaining energy is approximately:
$$ \text{Energy lost} = 0.90 \times \text{energy available at the preceding trophic level} $$
The $10%$ value is an ecological approximation, not a fixed law. Transfer efficiency varies among ecosystems and organisms, but the reliable exam pattern is that energy decreases as it flows from lower to higher trophic levels.
Worked example: tracing energy through four levels
Suppose producers contain $20{,}000\ \text{kJ}$ of available chemical energy. Calculate the energy transferred to each succeeding trophic level.
$$ \text{Primary consumers} = 0.10(20{,}000\ \text{kJ}) = 2{,}000\ \text{kJ} $$
$$ \text{Secondary consumers} = 0.10(2{,}000\ \text{kJ}) = 200\ \text{kJ} $$
$$ \text{Tertiary consumers} = 0.10(200\ \text{kJ}) = 20\ \text{kJ} $$
The decrease from producers to tertiary consumers is:
$$ 20{,}000\ \text{kJ} - 20\ \text{kJ} = 19{,}980\ \text{kJ} $$
Thus, only $20\ \text{kJ}$ reaches the tertiary level, while approximately $19{,}980\ \text{kJ}$ is not transferred upward. A correct AP response reports both the calculation and the unit, such as $\text{kJ}$.
Food chains, food webs, and the matter–energy distinction
A food chain is a single pathway showing energy and matter moving through trophic levels. A food web combines interlocking food chains, giving a more realistic picture because most organisms eat—and are eaten by—multiple species.
For example, a grassland plant may be eaten by grasshoppers, rabbits, and mice. Grasshoppers may be eaten by frogs and birds, while mice may be eaten by snakes and hawks. If one species disappears, several pathways can change, producing positive or negative feedback effects in the web. This relationship is identified in ENG-1.D.2.
Energy and matter behave differently:
| Ecosystem quantity | Typical behavior |
|---|---|
| Energy | Enters primarily as sunlight, moves through trophic levels, and is eventually released as heat |
| Matter | Moves among organisms and the nonliving environment through cycles |
| Nutrients | Returned to soil and water by waste, death, detritivores, and decomposers |
Detritivores consume dead organic material, while decomposers chemically break down that material. Together they return nutrients to soil and make those nutrients available again to producers. They recycle matter, but they do not recycle energy back into sunlight or restore energy lost as heat.
Misconception check
Misconception: The arrows in a food web point toward the organism that provides food.
Correction: Arrows point in the direction of energy transfer—from the food organism to the consumer.
Another common error is to calculate $10%$ of the original producer energy at every step. Instead, apply the rule repeatedly to the previous trophic level. Starting with $5{,}000\ \text{kJ}$, the next levels contain $500\ \text{kJ}$, then $50\ \text{kJ}$, then $5\ \text{kJ}$.
AP science practices in action
Science Practice 2: Visual Representations, especially 2.A — Describe characteristics of an environmental concept, process, or model represented visually, is assessed when you identify trophic levels, interpret arrows, or explain a food-web diagram. Science Practice 6: Mathematical Routines, especially 6.B — Apply mathematical routines, is assessed when you use the $0.10$ relationship, calculate energy loss, and include appropriate units.
Retrieval check: In a chain containing algae, zooplankton, small fish, and a heron, identify the primary and tertiary consumers. If the algae contain $8{,}000\ \text{kJ}$, how much energy is available to the heron? Explain why nutrients may return to the algae but energy does not.
1.11 Food Chains and Food Webs
Key concepts: Food chains · Food webs · Visual representations and models · Biogeochemical cycles · Effects of changes within a cycle · Phosphorus cycle and nutrient limitation · Invasive species and ecosystem impacts · Habitat fragmentation, disturbance, and species richness · Ecosystem services · Environmental characteristics and processes
A food chain is a single pathway showing who eats whom; a food web is the more realistic network of interconnected feeding pathways in an ecosystem.
1.11 Food Chains and Food Webs
A food chain is a single pathway showing who eats whom; a food web is the more realistic network of interconnected feeding pathways in an ecosystem. These models do more than name organisms: they help predict how a change in one population, nutrient reservoir, or habitat can spread through the entire system.
Reading ecological models
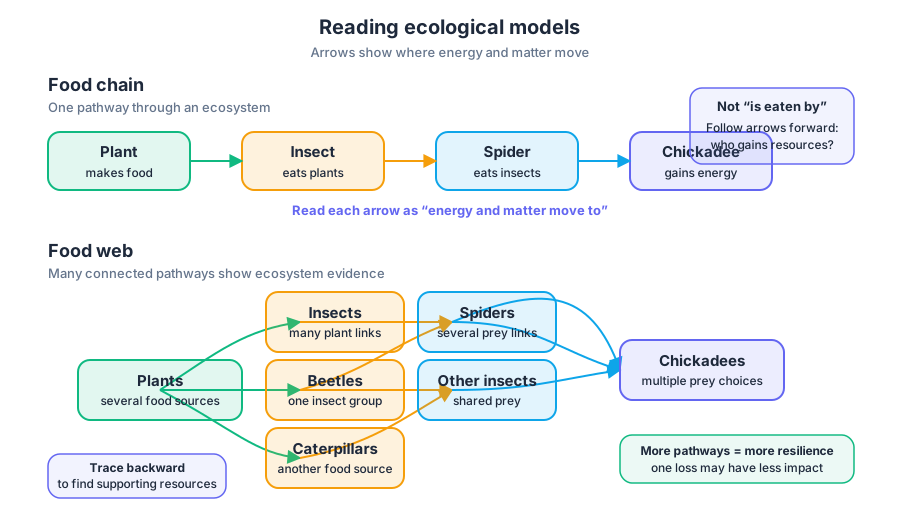
In a food chain, arrows point from the organism being eaten toward the organism that obtains the energy and matter. For example:
$$ \text{plant} \rightarrow \text{insect} \rightarrow \text{spider} \rightarrow \text{chickadee} $$
The arrow does not mean “is eaten by” in a grammatical sense; it means “energy and matter move to.” A food web combines many such pathways. Chickadees may eat insects and spiders, spiders may eat several kinds of insects, and insects may consume several plant species.
Visual models should be read as evidence, not decoration. Trace arrows forward to predict which consumers may gain or lose food, and trace them backward to identify the resources supporting a population. A food web also reveals that most species have more than one food source and more than one predator, so an ecosystem may respond less dramatically to the loss of one pathway than a simple food chain suggests.
Cycles connect food webs to the wider ecosystem
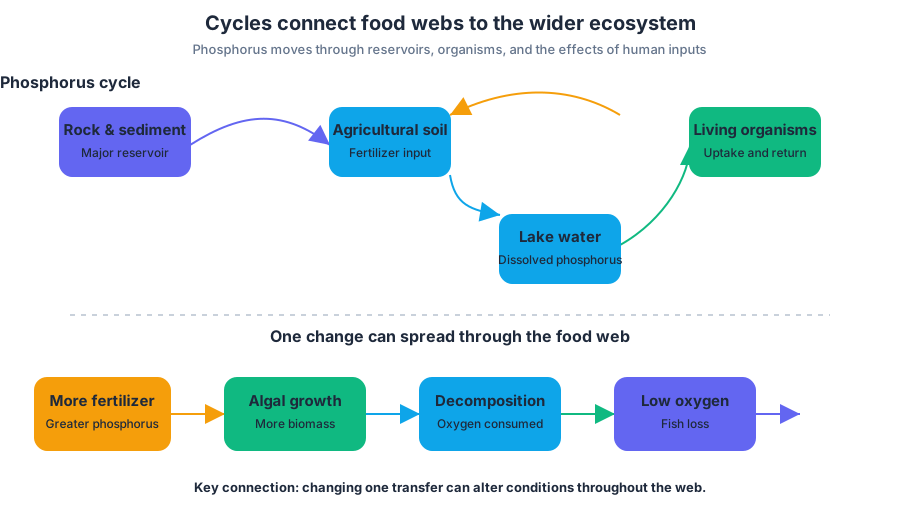
Biogeochemical cycles describe how matter moves among organisms and nonliving reservoirs. In a visual cycle, the reservoir is the major storage location for a substance, while arrows represent processes that move it elsewhere. For phosphorus, the major reservoir is rock and sediment rather than the atmosphere.
A change at one point in a cycle can produce effects elsewhere in the system. If phosphorus-containing fertilizer enters a lake, phosphorus may move from agricultural soil into the water. Algal growth can increase, and when algae die, decomposers consume dissolved oxygen while breaking down the organic matter. The original change—greater phosphorus input—can therefore contribute to oxygen depletion and fish loss.
Key connection: A cycle is not a set of isolated arrows. It is a linked system in which changing one transfer or reservoir can alter conditions throughout the food web.
Why phosphorus can limit productivity
A limiting nutrient is a nutrient whose scarcity restricts biological growth. Phosphorus is often limiting because rocks weather slowly, releasing phosphate into soil and water gradually. Unlike carbon and nitrogen, phosphorus has no major, rapid atmospheric pathway in the cycle.
Phosphorus limitation is especially important in freshwater ecosystems and in some terrestrial ecosystems. In a phosphorus-limited lake, even a small increase in phosphate can stimulate excessive algal growth. In a terrestrial ecosystem, slow release from rock may restrict plant growth despite adequate sunlight, water, and carbon dioxide.
Invasive species and ecosystem services
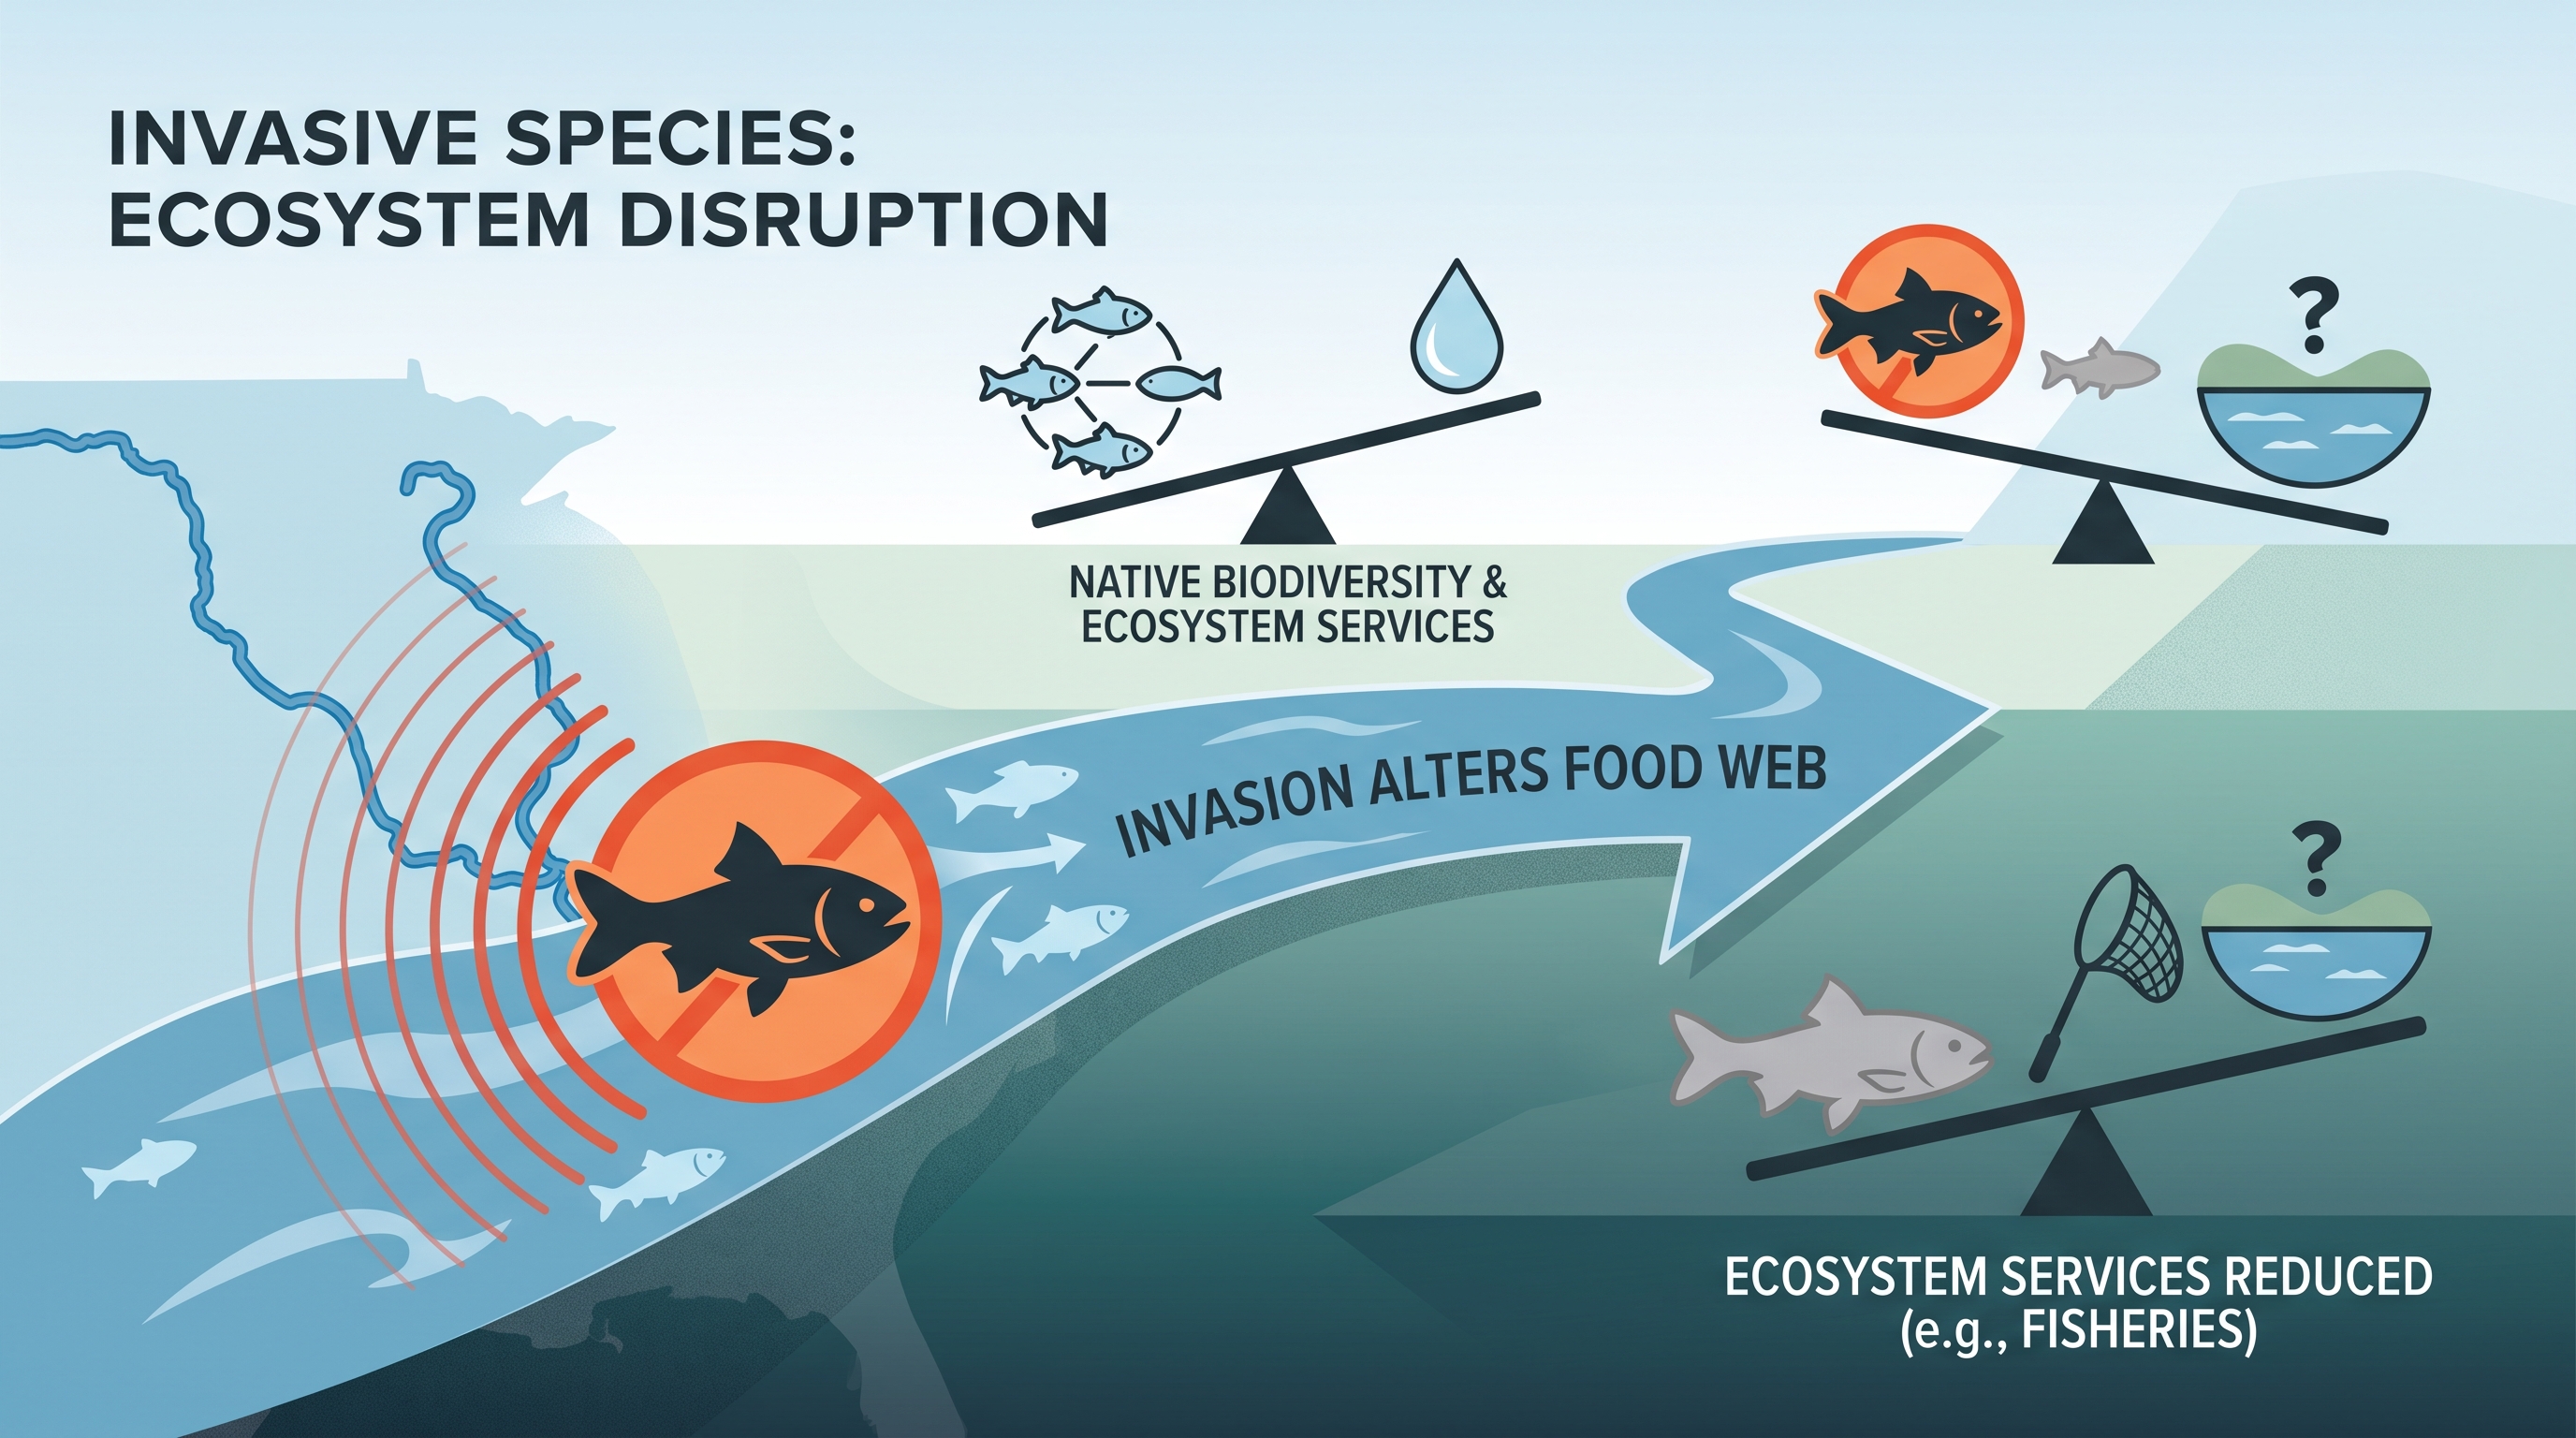
An invasive species is a nonnative species that spreads and causes ecological, economic, or human-health harm. It can alter food webs by consuming native organisms, competing for resources, changing habitat, or introducing new interactions. Those ecological effects can reduce ecosystem services, including provisioning services such as fisheries, regulating services such as water purification, and cultural services such as recreation.
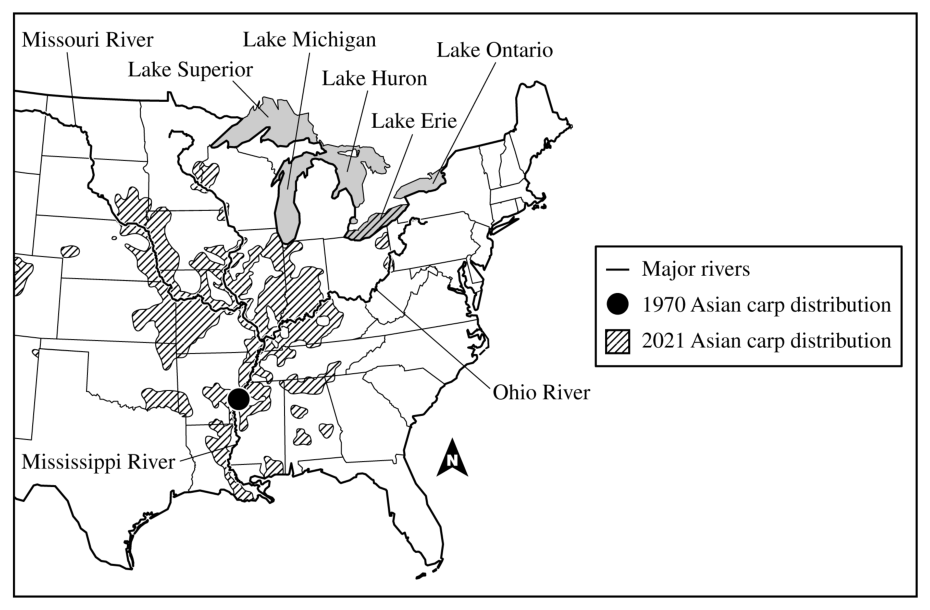
A map-based question may ask you to identify a water body invaded by Asian carp and then interpret the invasion’s spread. The Mississippi River is an appropriate example of an invaded body of water. A strong visual interpretation would describe the distribution as having expanded substantially along the river system, rather than merely stating that the species is “present.”
The reasoning should then connect distribution to consequences. If Asian carp compete with native fish for food, native fish populations may decline; that can reduce fishery yields and affect the provisioning ecosystem services of connected waters such as the Great Lakes region.
Disturbance, roads, and species richness
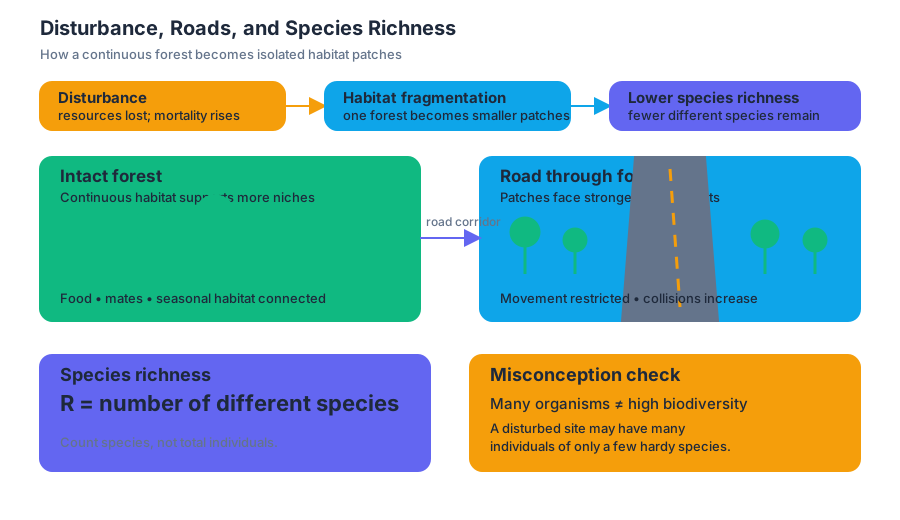
Species richness is the number of different species in an area. Habitat disturbance can reduce richness when it destroys resources, increases mortality, or makes conditions unsuitable for sensitive species. Roads add habitat fragmentation by dividing one continuous forest into smaller patches separated by a disturbed corridor.
A road through a forest may restrict movement by species such as deer or bears, increase collisions with vehicles, and separate individuals from food, mates, or seasonal habitat. Smaller, isolated patches generally support fewer species than an intact forest because they contain less habitat and experience stronger edge effects.
Misconception check: More organisms does not necessarily mean more biodiversity. A disturbed site may contain many individuals of a few hardy species while having lower species richness.
In-flow retrieval check
A lake receives a large phosphorus input after heavy rain. Predict one food-web change and one water-quality change. Then explain why building a road through a forest could reduce species richness even if the total forest area lost is small.
Answer: Extra phosphorus can increase algal growth, followed by greater decomposition and lower dissolved oxygen. The road can fragment habitat, isolate populations, increase edge effects and wildlife mortality, and leave patches too small for some species to survive.
2.1 Ecosystem Services · 2.2 Island Biogeography
Key concepts: Ecosystem services · Provisioning services · Regulating services · Cultural services · Supporting services · Human disruptions to ecosystem services · Island biogeography theory · Calculating average number of species across islands · Invasive species range expansion · Spatial-temporal interpretation of species distributions
A forest can be valuable even when no timber is harvested: it may filter drinking water, store carbon, support pollinators, provide recreation, and sustain food webs.
2.1 Ecosystem Services · 2.2 Island Biogeography
A forest can be valuable even when no timber is harvested: it may filter drinking water, store carbon, support pollinators, provide recreation, and sustain food webs. These benefits are ecosystem services—the contributions ecosystems make to human well-being and economic activity.
Ecosystem services: four categories
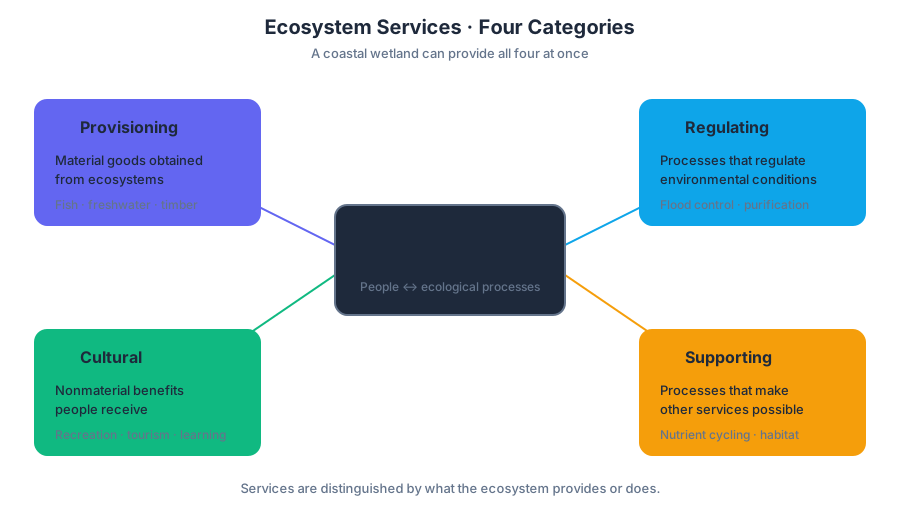
The CED organizes ecosystem services under ERT-2.B and ERT-2.B.1. The four categories are distinguished by what the ecosystem provides or does:
| Category | Meaning | Concrete examples |
|---|---|---|
| Provisioning services | Material goods obtained from ecosystems | Food, freshwater, timber, fuel, and medicinal resources |
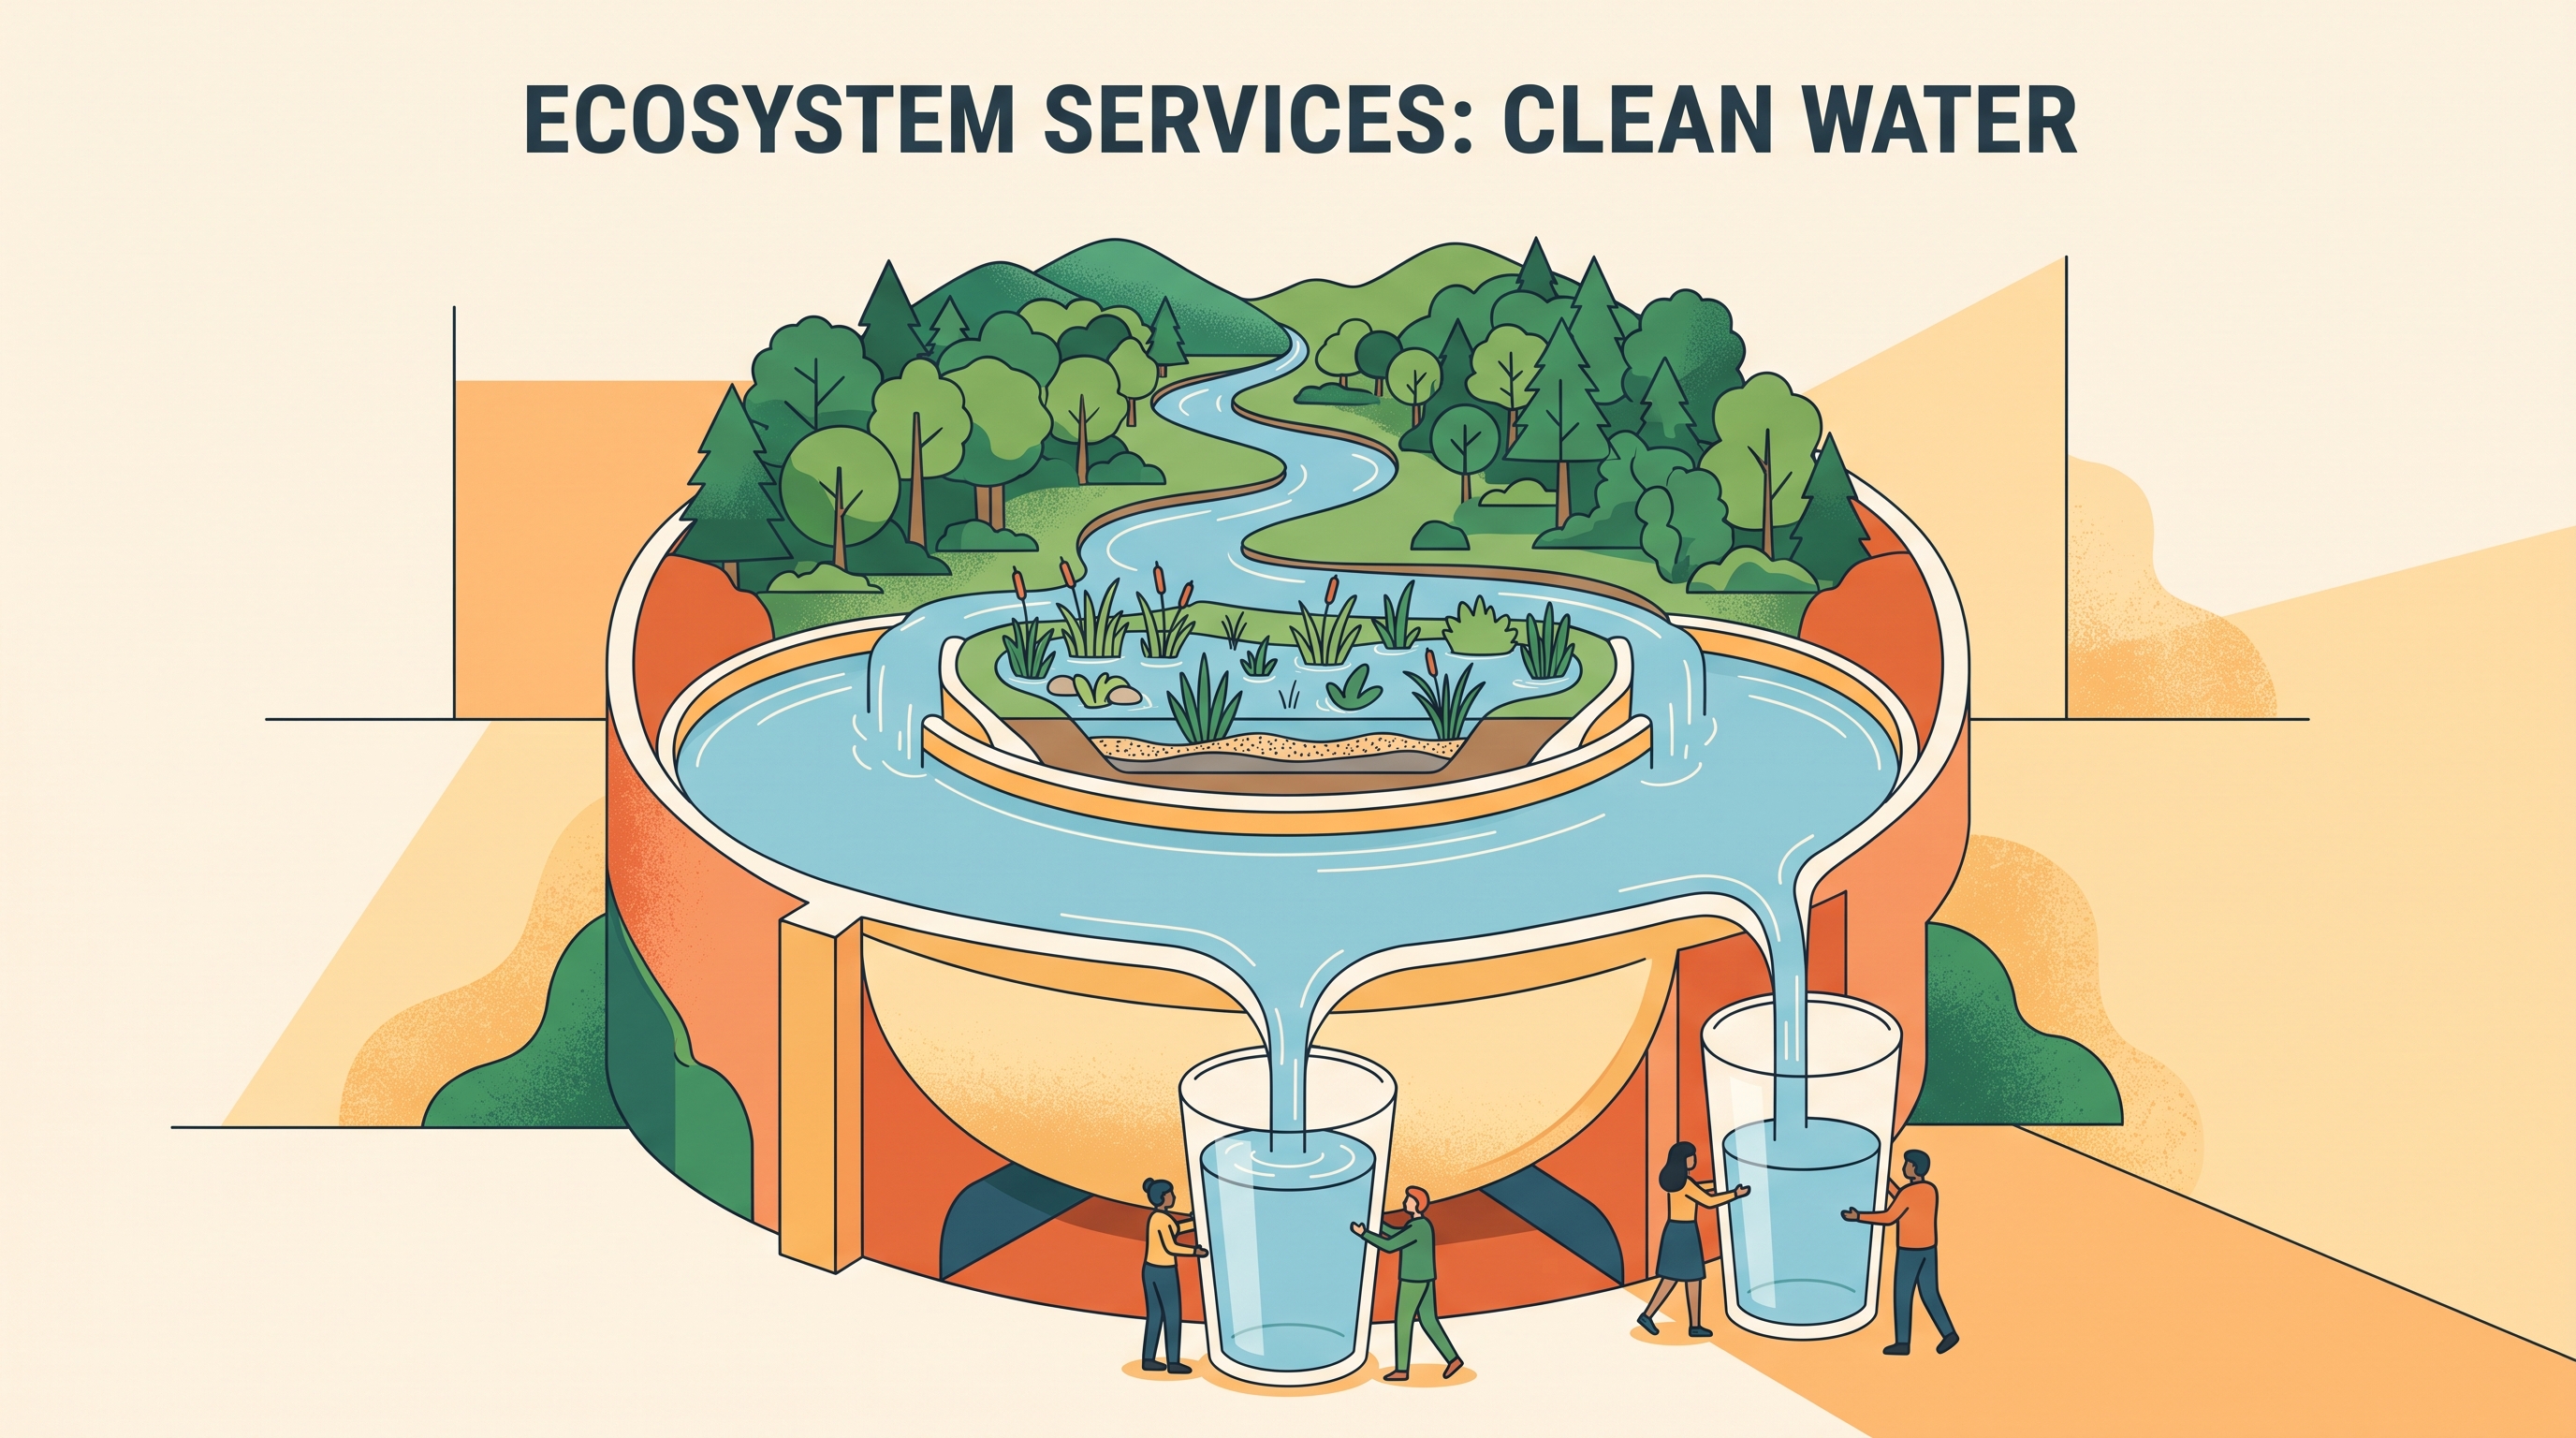
| Regulating services | Natural processes that regulate environmental conditions | Flood control, water purification, climate regulation, pollination, and erosion control |
| Cultural services | Nonmaterial benefits people receive from ecosystems | Recreation, tourism, aesthetic value, spiritual meaning, and education |
| Supporting services | Fundamental ecological processes that make the other services possible | Primary productivity, nutrient cycling, soil formation, and habitat that supports organisms |
A single ecosystem can supply all four categories at once. A coastal wetland, for example, may provide fish and shellfish as provisioning services, reduce storm damage as a regulating service, attract visitors as a cultural service, and support nutrient cycling and nursery habitat as supporting services.
Human disruption of services
Under ERT-2.C, students must describe the results of human disruptions to ecosystem services. ERT-2.C.1 states that anthropogenic activities—activities caused by humans—can disrupt ecosystem services, producing both economic and ecological consequences.
Worked example: wetland conversion. Suppose a city drains a wetland to construct buildings. The immediate economic benefit may include new housing, roads, and commercial space. However, the lost wetland no longer stores as much floodwater, filters pollutants as effectively, or provides nursery habitat for fish. Flood-repair costs may increase, local fisheries may decline, and recreational value may be lost. One land-use decision therefore affects regulating, provisioning, cultural, and supporting services simultaneously.
Misconception check — “Only goods count as ecosystem services.” Timber and fish are provisioning services, but flood reduction and water purification are also services even though they are not harvested. A second misconception is that disruption must destroy an ecosystem completely; reducing a service’s capacity can be ecologically and economically significant even when the ecosystem remains visibly present.
For this topic, Science Practice 1.B, Concept Explanation, means connecting the human action to the ecological mechanism and then to the consequence. A strong explanation does not merely say “pollution harms wetlands”; it identifies the disrupted process—such as reduced water filtration—and explains the resulting ecological or economic effect.
Island biogeography: why size and isolation matter
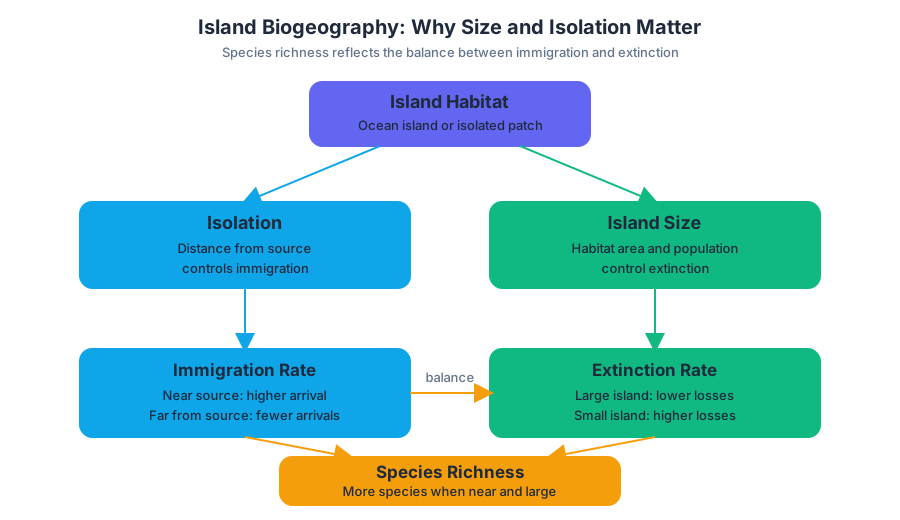
Island biogeography theory explains patterns of species richness on islands or island-like habitats. Immigration tends to be higher on islands closer to a source population, while extinction tends to be lower on larger islands because they contain more habitat and usually support larger populations.
The “island” can be a literal oceanic island or an isolated habitat patch surrounded by unsuitable conditions. A small, distant reserve generally receives fewer colonizing species and loses species more easily than a large, nearby reserve.
Worked calculation: adding an island
Imagine three islands containing $12$, $18$, and $24$ bird species. The calculated average number of species is
$$ \bar{S}=\frac{12+18+24}{3}=18\text{ species}. $$
A new island is surveyed and contains $30$ species. The revised average is
$$ \bar{S}_{\text{new}}=\frac{12+18+24+30}{4} =\frac{84}{4} =21\text{ species}. $$
The average increases from $18$ to $21$ species because the added island has more species than the original average. If the new island had contained only $10$ species, the new average would instead be
$$ \frac{12+18+24+10}{4}=16\text{ species}. $$
Misconception check — “Adding an island always increases the average.” The average depends on the new island’s species count relative to the existing average. Also, adding a species-rich island to a dataset changes the calculated average; it does not automatically prove that every island became more diverse.
Asian carp: reading expansion on a distribution map
Distribution maps turn island-biogeography reasoning into a spatial-temporal investigation. In the 1970s, Asian carp distribution was concentrated at a single point in the southern Mississippi River basin near the junction of the Mississippi and Ohio rivers. By 2021, the distribution extended throughout the Mississippi River mainstem from the Gulf of Mexico to Minnesota.
The 2021 range also expanded up the Missouri and Ohio rivers, with movement northwest and northeast along connected river systems. Compared with the smaller 1970s range, the later distribution covered a much larger network of waterways.
When interpreting the map, identify the geographic features first: the Mississippi River mainstem, the Missouri River, the Ohio River, the Gulf of Mexico, and Minnesota. Then compare the two dates by asking: Where was the species present initially, and in which directions did the range expand? This applies Science Practice 2.A, Visual Representations, and Science Practice 2.C, Visual Representations, because the map must be used to identify features and explain a spatial change over time.
Introducing an invasive species can disrupt ecosystem services. Asian carp may compete with native fish for food and habitat, alter food-web relationships, and reduce native biodiversity. Those ecological changes can also affect provisioning services such as commercial or subsistence fishing and cultural services such as recreation and sport fishing.
Retrieval check
A new island contains $14$ species, while the existing islands average $11$ species. Will adding it raise or lower the calculated average? On an Asian carp map, what evidence would demonstrate range expansion rather than simply a change in reporting?
Answer: Adding an island with $14$ species raises the average because $14>11$. Evidence of range expansion would be presence in new connected waterways—such as the Missouri and Ohio rivers and the Mississippi River reach toward Minnesota—compared with the concentrated 1970s distribution near the Mississippi–Ohio junction.
2.3 Ecological Tolerance · 2.4 Natural Disruptions to Ecosystems
Key concepts: Ecological tolerance · Temperature, salinity, flow rate, and sunlight as environmental conditions · Individual and species tolerance ranges · Natural disruptions to ecosystems · Short-term and long-term ecosystem impacts · Environmental consequences of natural disruptions · Major environmental change and upheaval over geological time · Ecosystem structure and diversity changing over time · Analyzing and interpreting tables, charts, and graphs
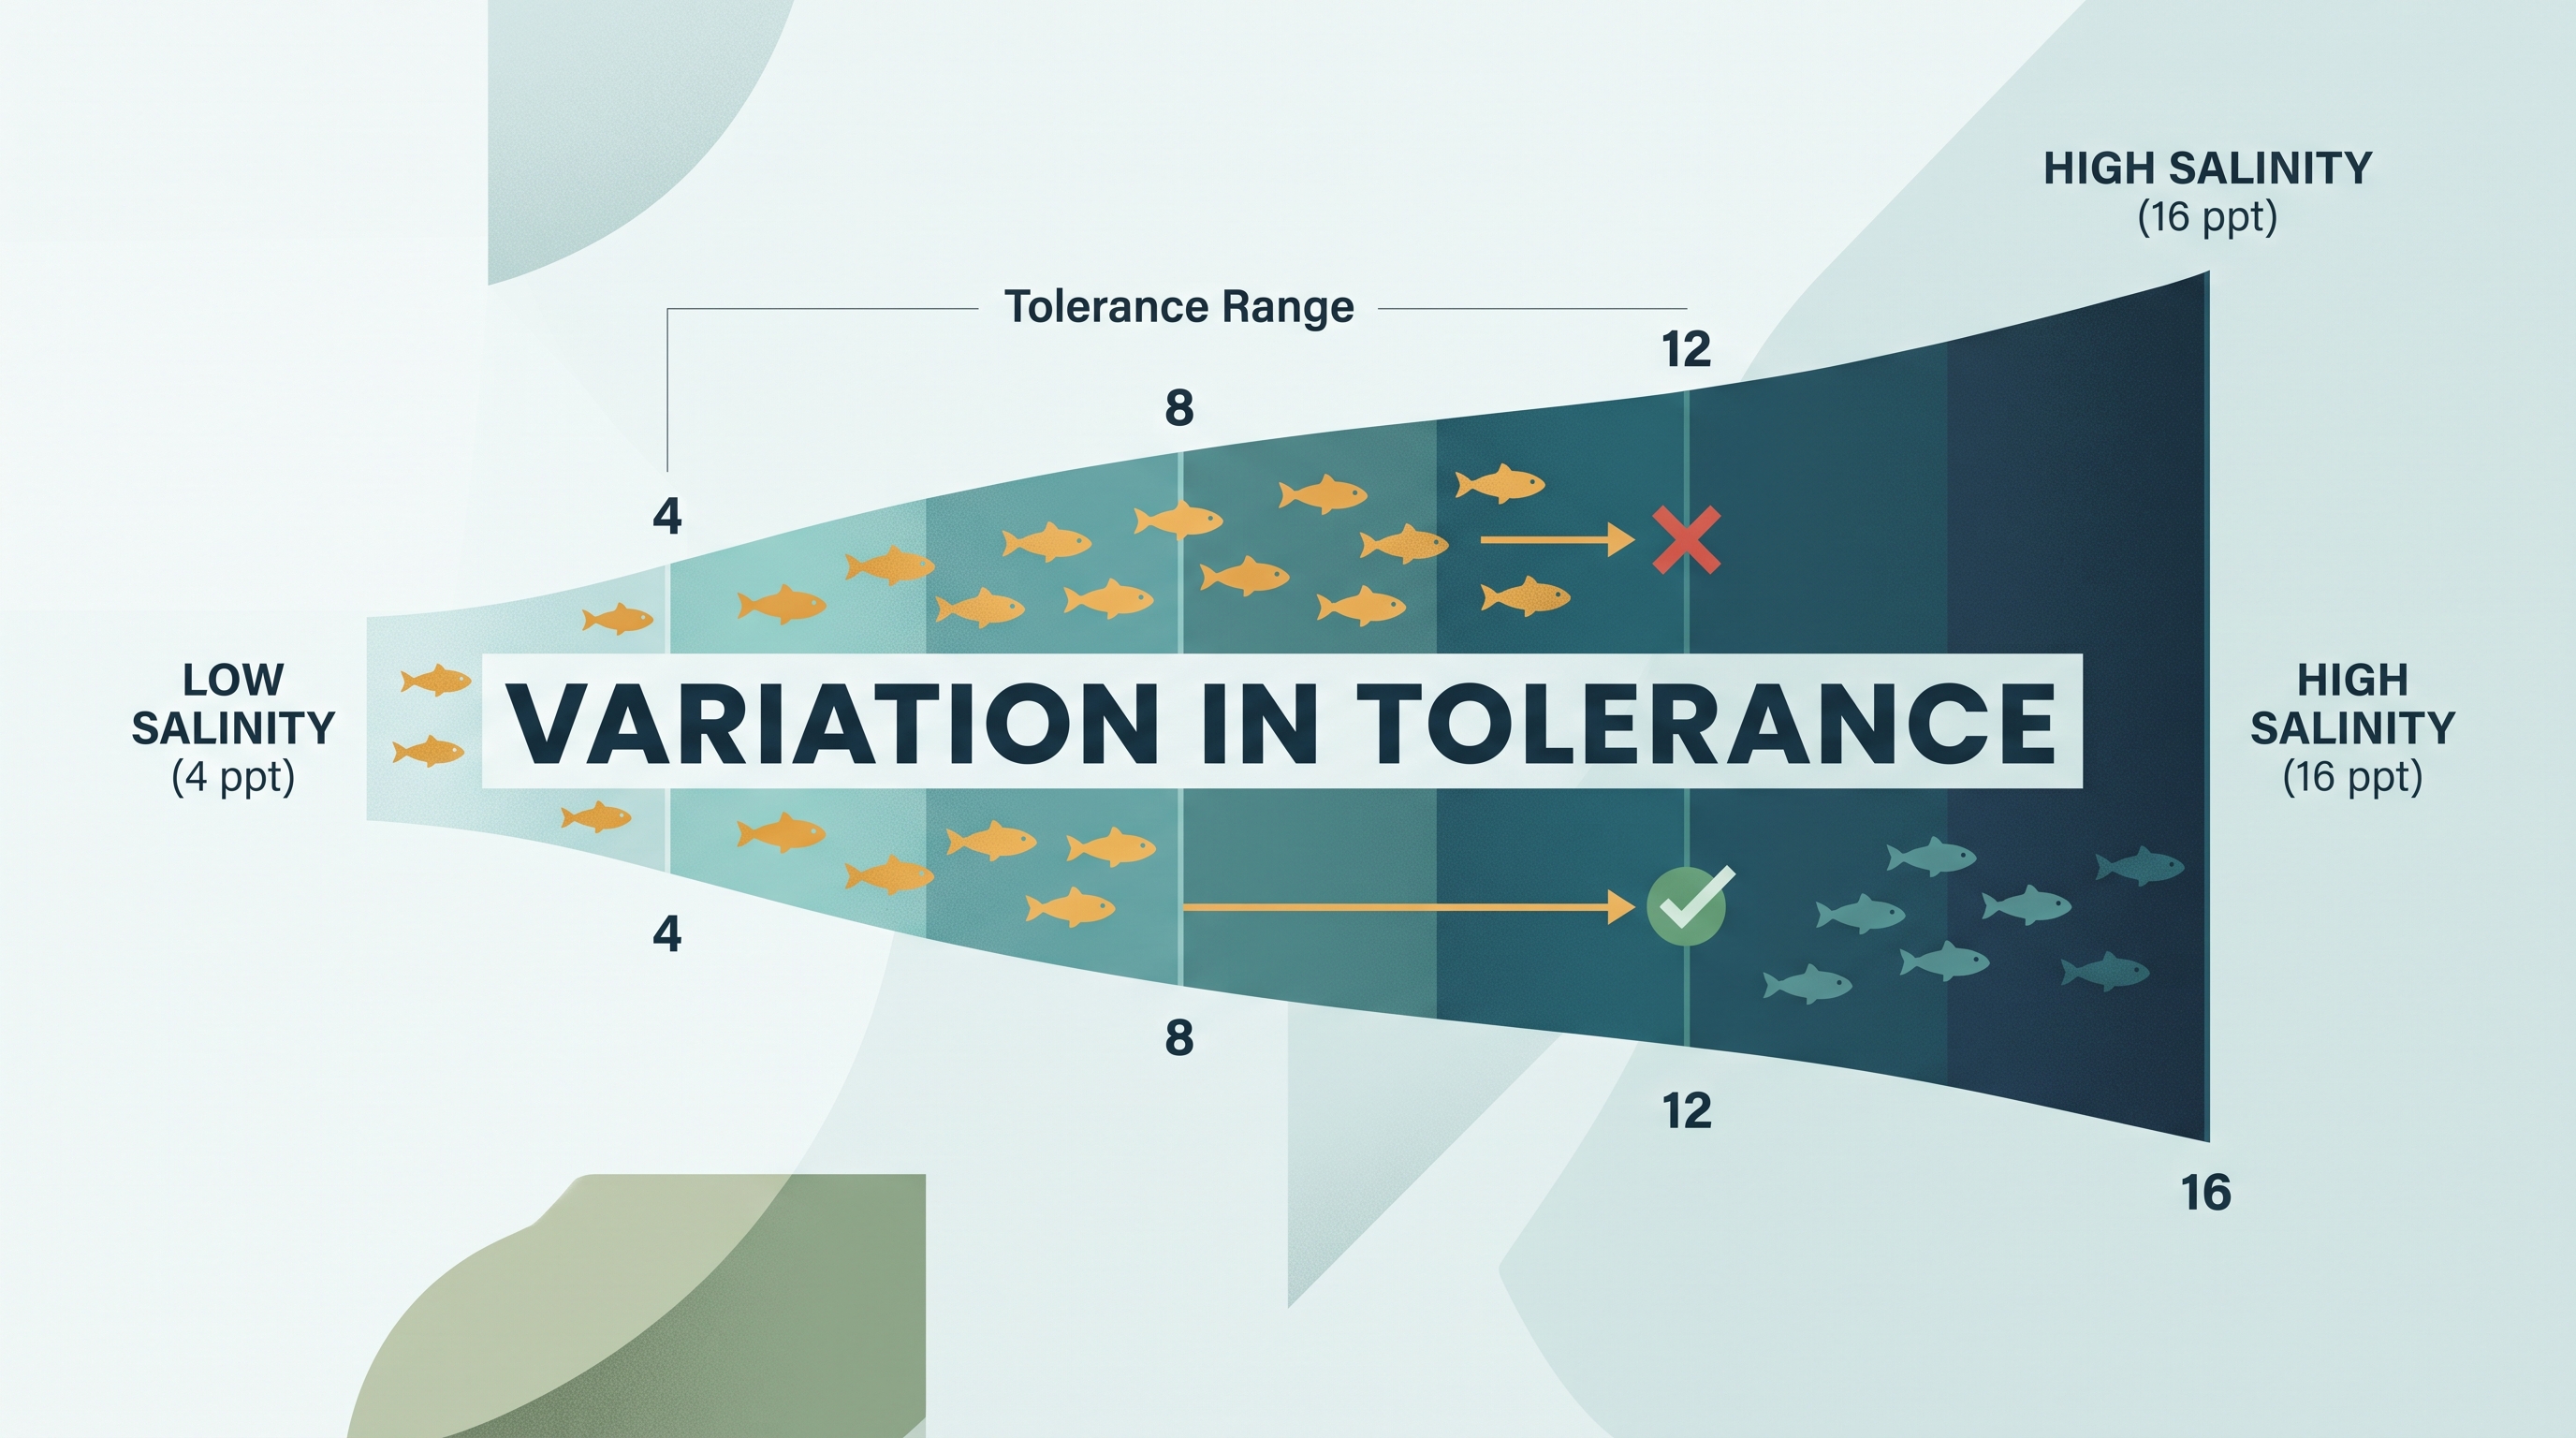
A trout cannot survive in every stream: temperature, salinity, flow rate, and sunlight each impose limits on where it can live, grow, and reproduce. Ecological tolerance is the range of environmental conditions an organism can endure before injury or death results.
2.3 Ecological Tolerance · 2.4 Natural Disruptions to Ecosystems
A trout cannot survive in every stream: temperature, salinity, flow rate, and sunlight each impose limits on where it can live, grow, and reproduce. Ecological tolerance is the range of environmental conditions an organism can endure before injury or death results.
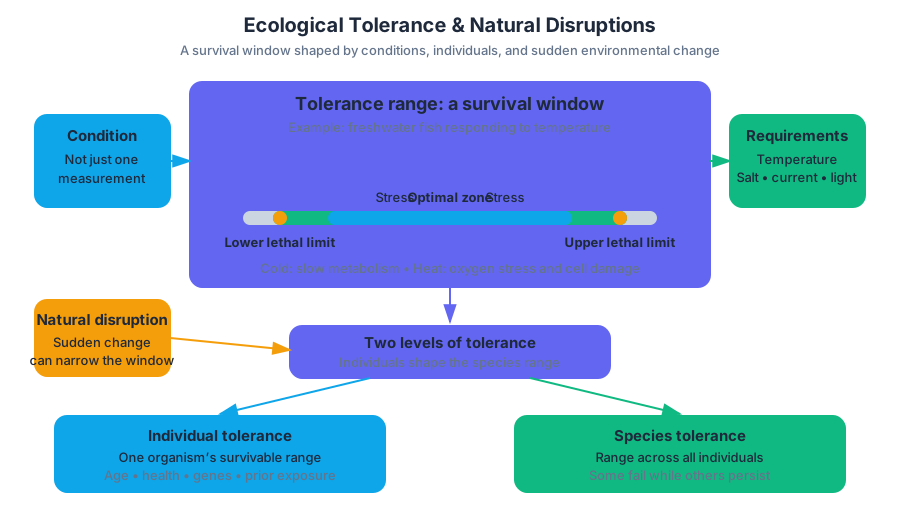
ERT-2.F.1: Ecological tolerance refers to the range of conditions, such as temperature, salinity, flow rate, and sunlight, that an organism can endure before injury or death results.
Ecological tolerance: a survival window
Imagine sliding a temperature control from cold to hot while observing a freshwater fish. At very low temperatures, metabolism slows; within a middle range, the fish functions best; at very high temperatures, oxygen stress and cellular damage increase. The full interval between the lower and upper lethal limits is the fish’s tolerance range.
A tolerance range applies at two levels:
- Individual tolerance: the conditions one organism can withstand. Two fish of the same species may differ because of age, health, genetics, or previous exposure.
- Species tolerance: the broader range represented across all individuals in a species. A species may persist even when some individuals cannot tolerate a particular condition.
The condition is not always a single measurement. A stream organism may be limited by water temperature, dissolved salt concentration, current speed, or the amount of sunlight reaching its habitat. A condition can also affect another requirement: warmer water, for example, generally holds less dissolved oxygen, creating additional stress for aquatic organisms.
ERT-2.F.2: Ecological tolerance can apply to individuals and to species.
Worked example: reading a tolerance pattern
Suppose a freshwater snail population is observed at different salinities. The observations below are invented for practice but illustrate the reasoning required when interpreting environmental data.
| Salinity | Average snails observed per square meter |
|---|---|
| $0$ parts per thousand | $42$ |
| $4$ parts per thousand | $48$ |
| $8$ parts per thousand | $31$ |
| $12$ parts per thousand | $7$ |
| $16$ parts per thousand | $0$ |
The population performs best near $4$ parts per thousand, but the species tolerates at least some salinity through $12$ parts per thousand. The data suggest a declining abundance as salinity rises, not an immediate death threshold at the optimum. A strong interpretation distinguishes best performance from maximum survival.
Misconception check: “One species has one fixed tolerance”
A species does not have a single unchanging tolerance value. The range can vary among individuals and populations, and an organism may tolerate a condition briefly without being able to reproduce there. Therefore, presence alone does not prove that conditions are ideal; abundance, health, and reproductive success provide stronger evidence.
2.4 Natural Disruptions to Ecosystems
A wildfire, flood, volcanic eruption, drought, hurricane, or sudden disease outbreak can reorganize an ecosystem in a matter of days. Other changes, such as shifting climate or changing glacial ice, operate over decades, centuries, or geological time.
ERT-2.G: Explain how natural disruptions, both short- and long-term, impact an ecosystem.
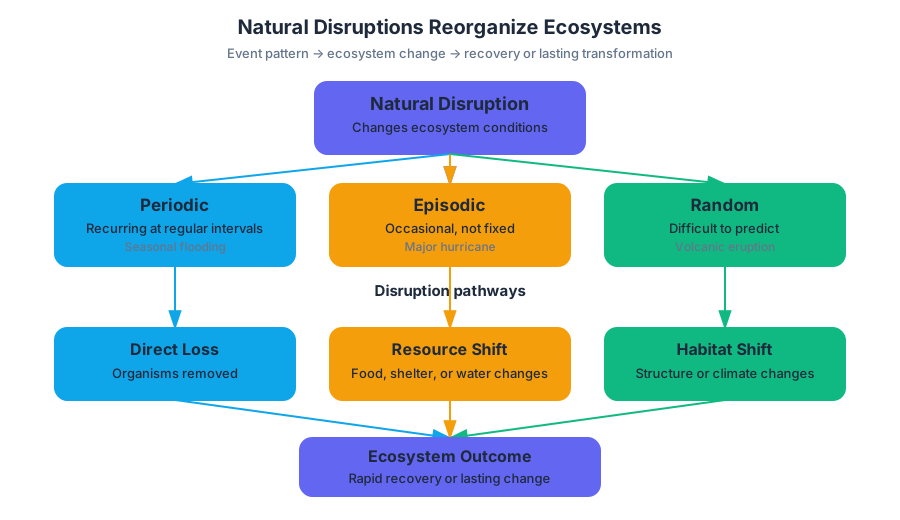
Natural disruptions are events or processes that alter ecosystem conditions, populations, habitat, or resource availability without being caused primarily by human activity. They may be:
- Periodic: recurring at fairly regular intervals, such as seasonal flooding.
- Episodic: occurring occasionally but not on a fixed schedule, such as a major hurricane.
- Random: difficult to predict in timing, such as a particular volcanic eruption.
A disruption may remove organisms directly, change food or shelter, alter water quality, or shift the physical structure of habitat. Its consequences may be short-lived if organisms quickly return, or long-lasting if habitat is destroyed, climate conditions change, or local populations disappear.
Natural change across geological time
Earth’s climate has changed repeatedly over geological time for many reasons. Sea level has also varied substantially as the amount of glacial ice changed: when more water was stored as land-based ice, less remained in the oceans. Major environmental upheaval commonly produces large-scale habitat changes, forcing organisms to move, adapt, or decline.
Wildlife migration can therefore be a response to both short-term and long-term disruption. A herd may move temporarily after a drought, while a species may shift its range over many generations as temperature or water availability changes. Natural disruptions can have environmental consequences as great as, or greater than, those of many human-made disruptions for a particular occurrence.
Data interpretation: connecting disruption to ecosystem response
Consider a grassland survey after a natural fire:
| Year after fire | Plant species richness | Bare ground |
|---|---|---|
| $0$ | $6$ species | $78%$ |
| $2$ | $14$ species | $39%$ |
| $5$ | $19$ species | $18%$ |
| $10$ | $16$ species | $22%$ |
The pattern shows that species richness increased from $6$ to $19$ species during the first five years, while bare ground decreased. By year $10$, richness had declined slightly, so the correct conclusion is not “fire always increases biodiversity.” Instead, the data support a more precise claim: this fire was followed by an initial increase in plant diversity, followed by a modest decline as ecosystem structure changed.
Misconception check: “Natural means harmless”
Natural does not mean insignificant or beneficial in every circumstance. A natural flood can replenish sediment and water wetlands, but it can also remove nests and reduce local populations. The effect depends on the event’s intensity, timing, duration, frequency, and the ecosystem’s existing conditions.
AP science practices in action
This topic most directly develops 3.A, Text Analysis: Identify the author’s claim, when evaluating a scientific explanation about tolerance or disruption, and 5.A, Data Analysis: Describe patterns or trends in data, when interpreting tables, charts, or graphs. A complete data response names the direction of change, identifies exceptions or turning points, and links the pattern to an ecological mechanism rather than merely repeating numbers.
Retrieval check
A population disappears after salinity rises from $4$ to $16$ parts per thousand, while a nearby population persists at $12$ parts per thousand. What should you conclude? The strongest answer is that individuals and populations differ in tolerance, and that the species’ tolerance range may extend farther than the first population’s range.
2.5 Adaptations · 2.6 Ecological Succession
Key concepts: Ecological succession · Primary succession · Secondary succession · Pioneer species · Successional stages and soil development · Adaptations of pioneer species · Plant diversity and ecosystem resilience · Recovery after disturbance · Succession in different biomes · Relationships among variables in ecological data
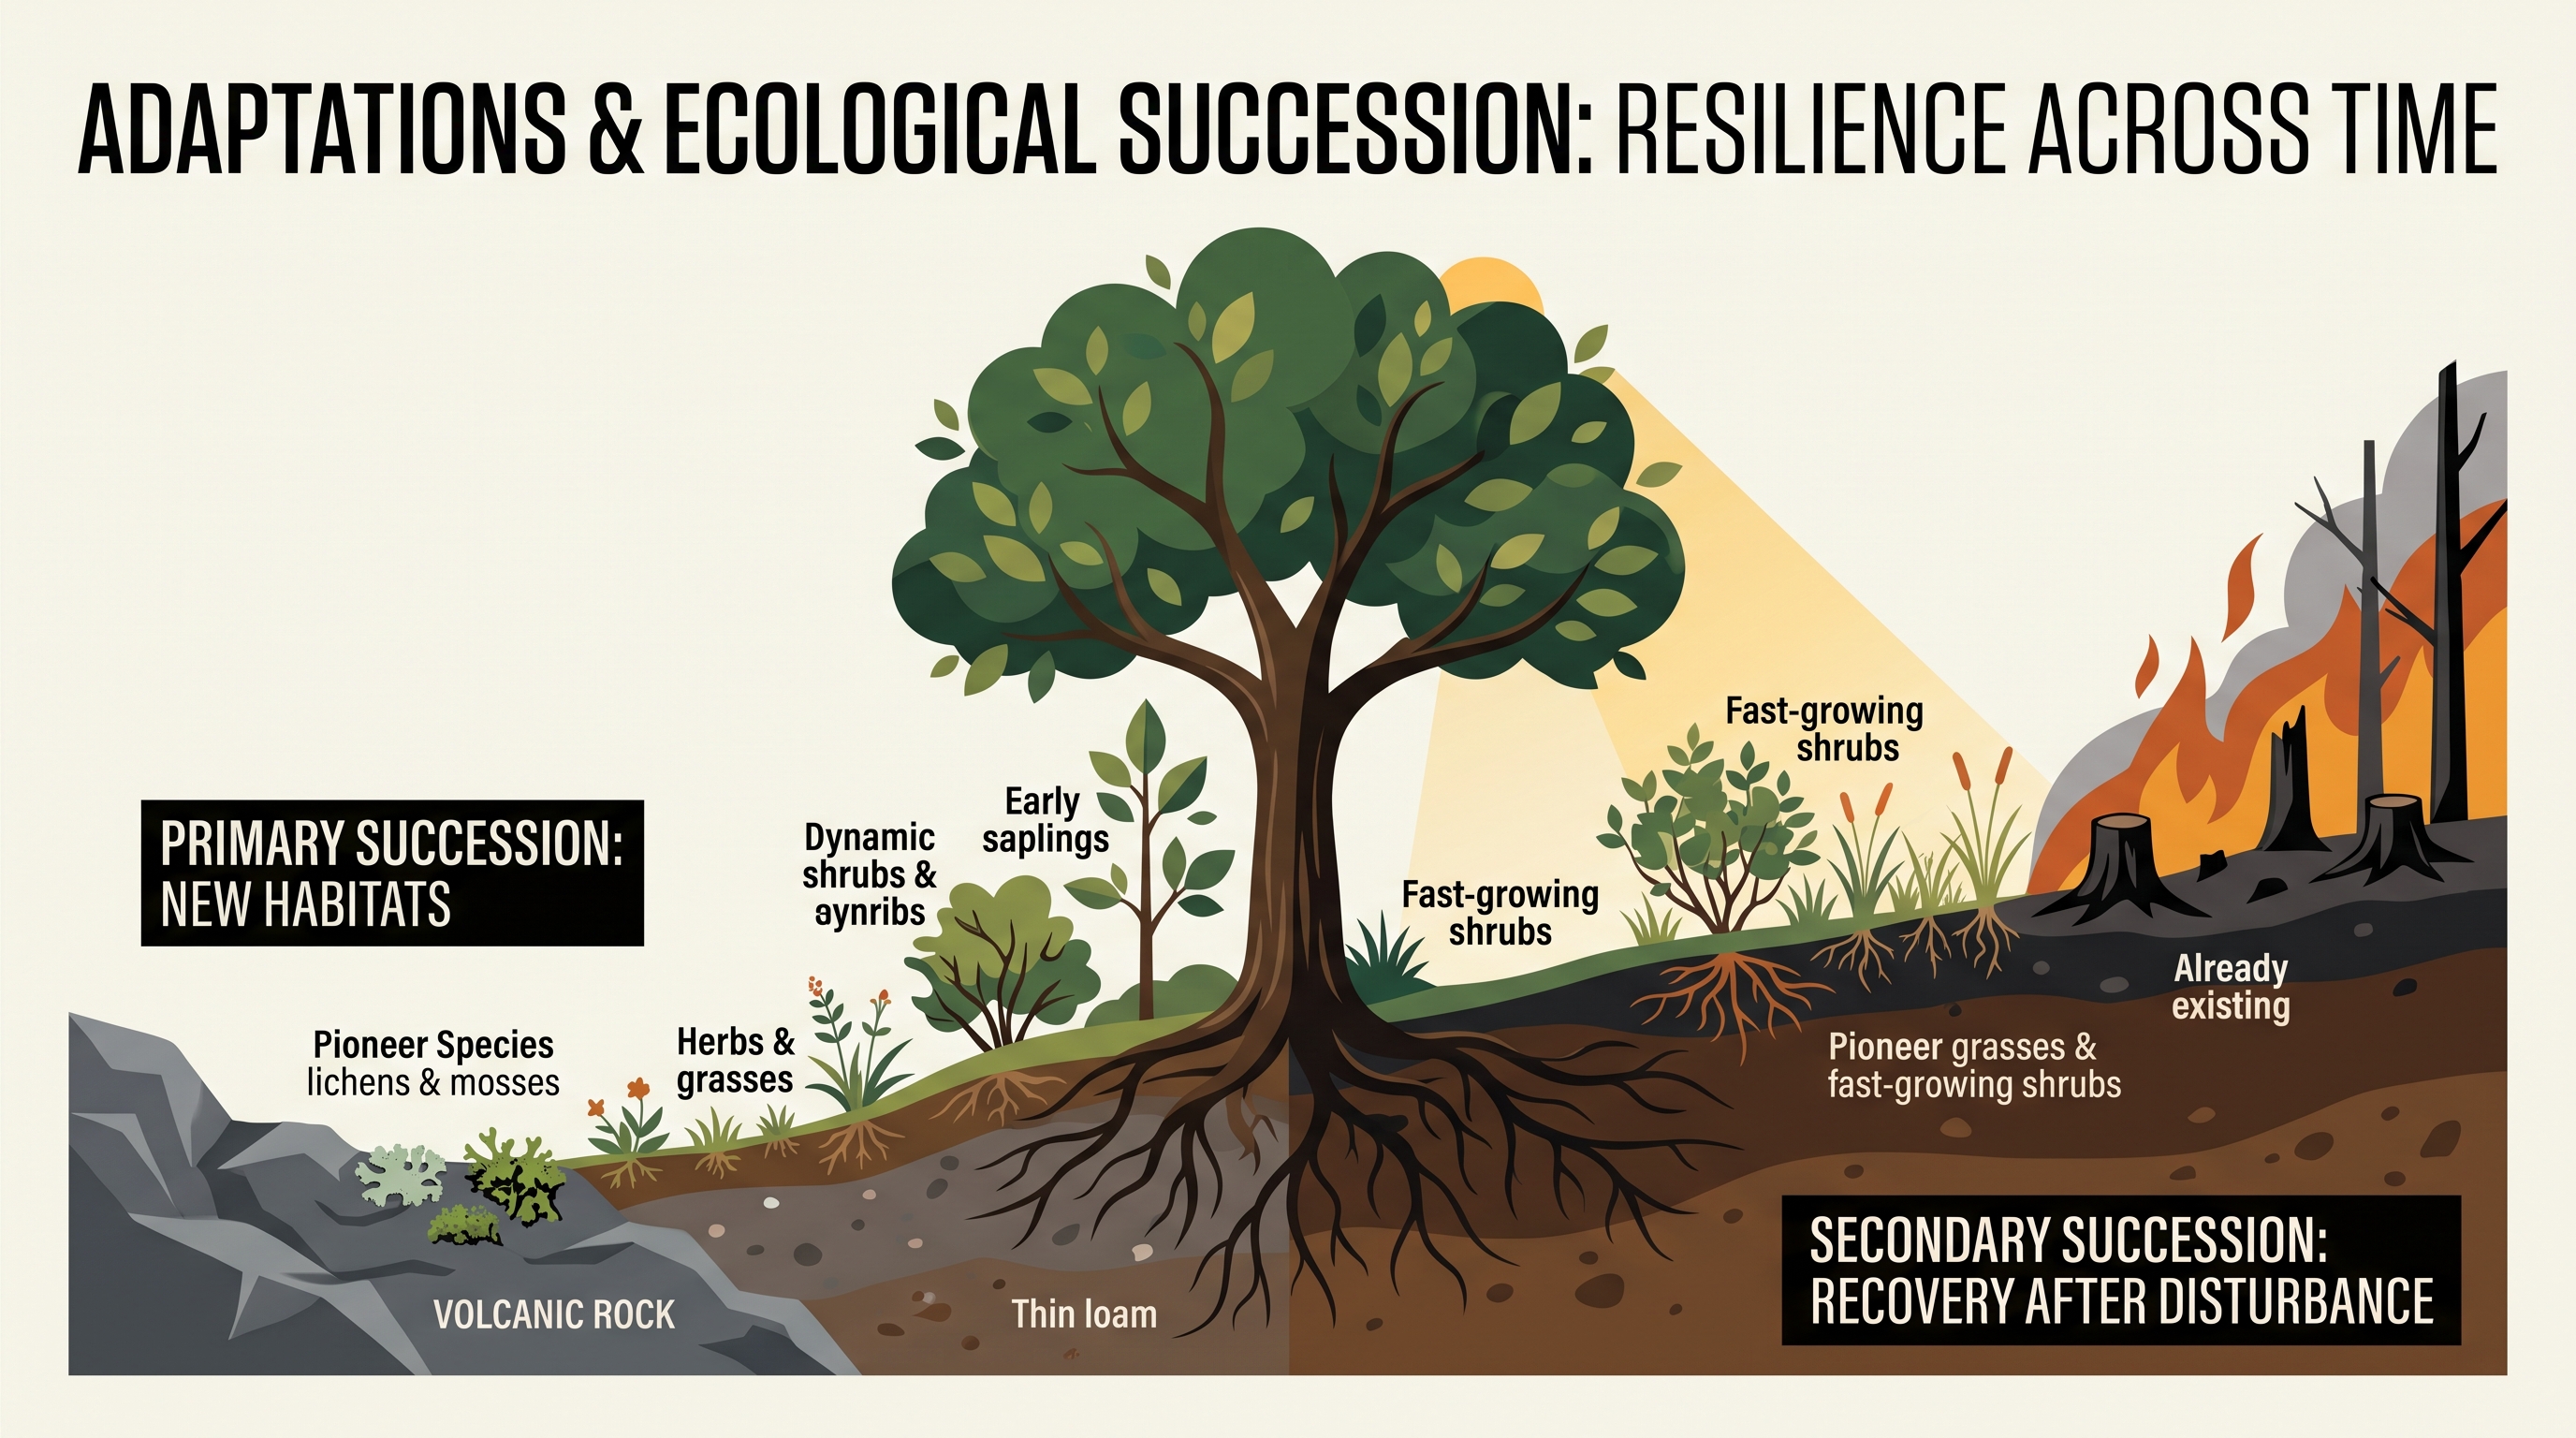
A community does not return after disturbance all at once: organisms arrive in a sequence shaped by soil, sunlight, nutrients, climate, and biological interactions. Ecological succession is the predictable change in species composition and community structure over time.
2.5 Adaptations · 2.6 Ecological Succession
A community does not return after disturbance all at once: organisms arrive in a sequence shaped by soil, sunlight, nutrients, climate, and biological interactions. Ecological succession is the predictable change in species composition and community structure over time.
Adaptations determine who arrives first
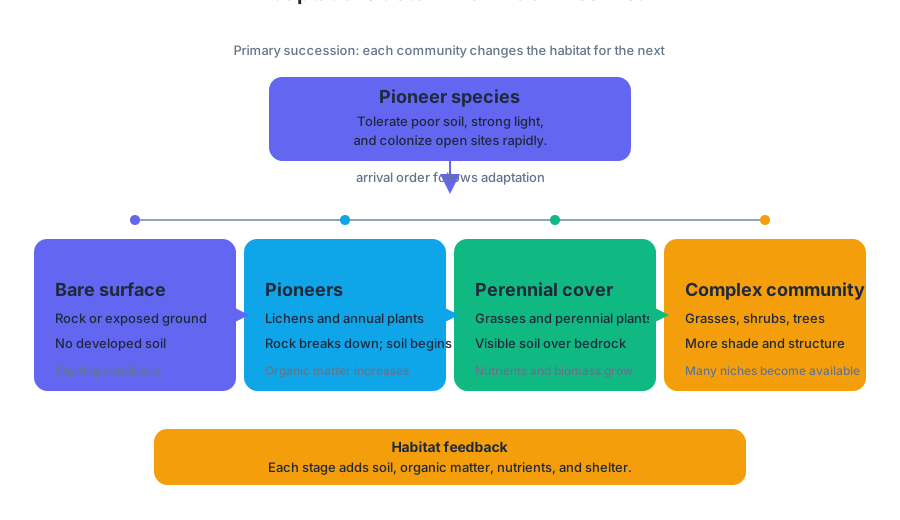
A pioneer species is an organism adapted to colonize a newly exposed or disturbed habitat. Pioneer species can tolerate little or poor soil, low organic matter, low nutrient availability, intense sunlight, and a wide range of habitats. They also tend to colonize rapidly, allowing them to reach open sites before slower-growing species.
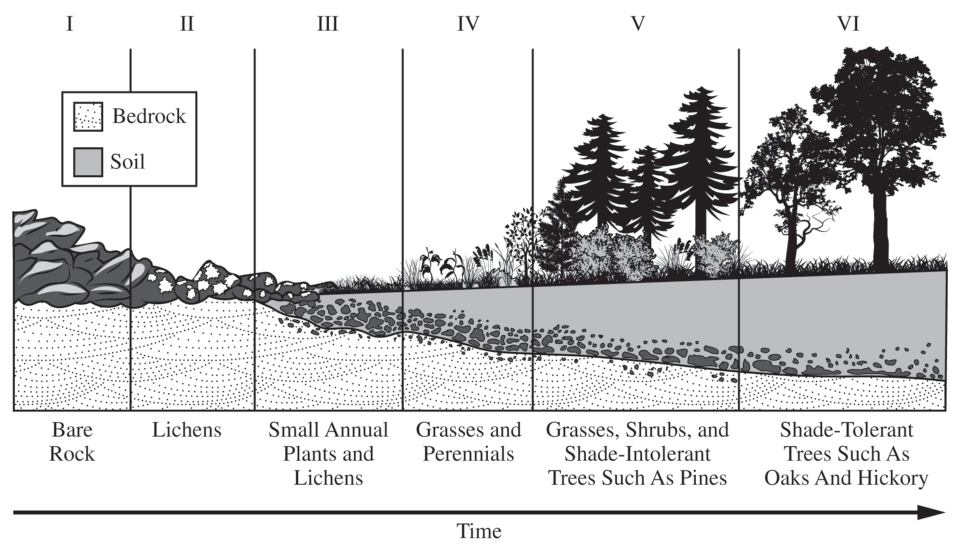
Typical pioneers include lichens and small annual plants. Lichens help break down bare rock, while their dead organic matter contributes material that can mix with mineral particles. Small plants add additional organic matter when they die and decompose, gradually improving conditions for later vegetation.
The sequence is not simply “small plants become large plants.” Each stage changes the physical environment, making it more suitable for different species:
| Successional stage | Typical vegetation | Environmental change |
|---|---|---|
| Stage I | Bare rock or exposed surface | No developed soil |
| Stage II/2 | Lichens and small annual plants | Early soil formation begins |
| Stage III | Grasses and perennial plants | A visible soil layer forms over bedrock |
| Later stages | Grasses, shrubs, and shade-intolerant or shade-tolerant vegetation | More organic matter, nutrients, biomass, and structural complexity |
Adaptations are not intentional improvements made by individual organisms. An organism already possessing traits that fit the conditions is more likely to survive and reproduce. Over generations, natural selection can make those traits common in the population. For pioneers, useful traits include rapid growth, rapid reproduction, tolerance of full sunlight, efficient use of scarce nutrients, and the ability to establish across many habitat types.
Primary versus secondary succession
Primary succession begins on bare rock or another surface without soil. Because soil must first develop, primary succession is generally slow. A newly exposed rock surface is an example: lichens and small annual plants appear in Stage II/2, contribute organic matter, and help initiate the formation of soil; by Stage III, a visible soil layer has formed over the bedrock.
Secondary succession occurs after a disturbance when soil remains. Burning crops leaves soil, so the field undergoes secondary rather than primary succession. Fast-growing, early-successional organisms can recolonize the existing soil, usually much sooner than vegetation can establish on bare rock.
Misconception check — “fire always causes primary succession.” The disturbance itself does not determine the type of succession. The deciding question is: Did soil remain? Fire that removes vegetation but leaves soil causes secondary succession; a disturbance that removes the soil layer and exposes bare substrate can initiate primary succession.
Biodiversity and recovery
Communities with greater plant diversity generally recover more quickly from disturbances such as flooding. Higher species richness, meaning more species in the community, makes it less likely that one event will eliminate a large proportion of the community. Different species also have different tolerances and functions, so some may survive and repopulate after others are damaged.
A diverse community may also contain greater genetic diversity and more complex ecological connections. By contrast, a dominant species or monoculture can be severely affected when a disturbance targets its particular traits—for example, when nearly all plants lack flood tolerance. Diversity therefore increases the likelihood that resistant or resilient organisms remain.
Applying succession to ecological data
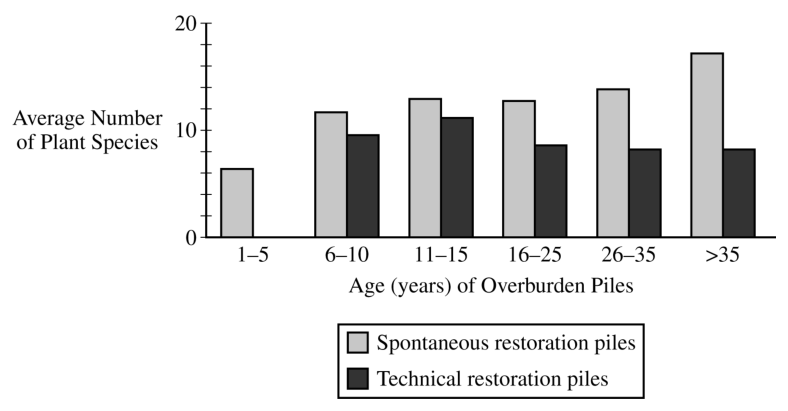
Suppose plant species richness is measured on mine-waste piles of different ages. If older piles generally contain more plant species, the data support a relationship of increasing species richness with site age. A strong response describes the pattern and connects it to succession: soil development and accumulating organic matter allow grasses, perennials, shrubs, and additional vegetation to establish.
Recovery rate also depends on biome conditions. Plant recovery after mining would generally be slower in a tundra than in a temperate forest because tundra has colder conditions and a shorter growing season. The recovering plants would be tundra-native, and the site would generally reflect the lower species diversity typical of that biome.
AP Science Practices in action
This topic is assessed especially through Science Practice 1: Concept Explanation, when distinguishing primary from secondary succession or explaining why diversity increases resilience; Science Practice 2: Visual Representations, when interpreting succession diagrams; Science Practice 4: Scientific Experiments, when comparing spontaneous and human-assisted restoration; Science Practice 5: Data Analysis, when describing species-richness trends across sites of different ages; and Science Practice 7: Environmental Solutions, when evaluating restoration strategies after mining or fire.
Retrieval check: A crop field is burned, but its soil remains. Identify the type of succession, name the likely early colonizers, and explain why a diverse plant community would usually recover from flooding more quickly than a monoculture.
3.1 Generalist and Specialist Species · 3.2 K-Selected and r-Selected Species
Key concepts: Generalist species · Specialist species · Habitat stability and species advantage · Changing habitats and species advantage · Invasive species · Generalist or r-selected characteristics of invasive species · K-selected species · r-selected species · Biodiversity and ecosystem recovery · Habitat loss and species loss
A habitat that changes slowly rewards precision; a habitat that changes often rewards flexibility. These two pressures help explain why some organisms are specialist species, adapted to a narrow range of conditions, while others are generalist species, able to use many resources and tolerate varied conditions.
3.1 Generalist and Specialist Species · 3.2 K-Selected and r-Selected Species
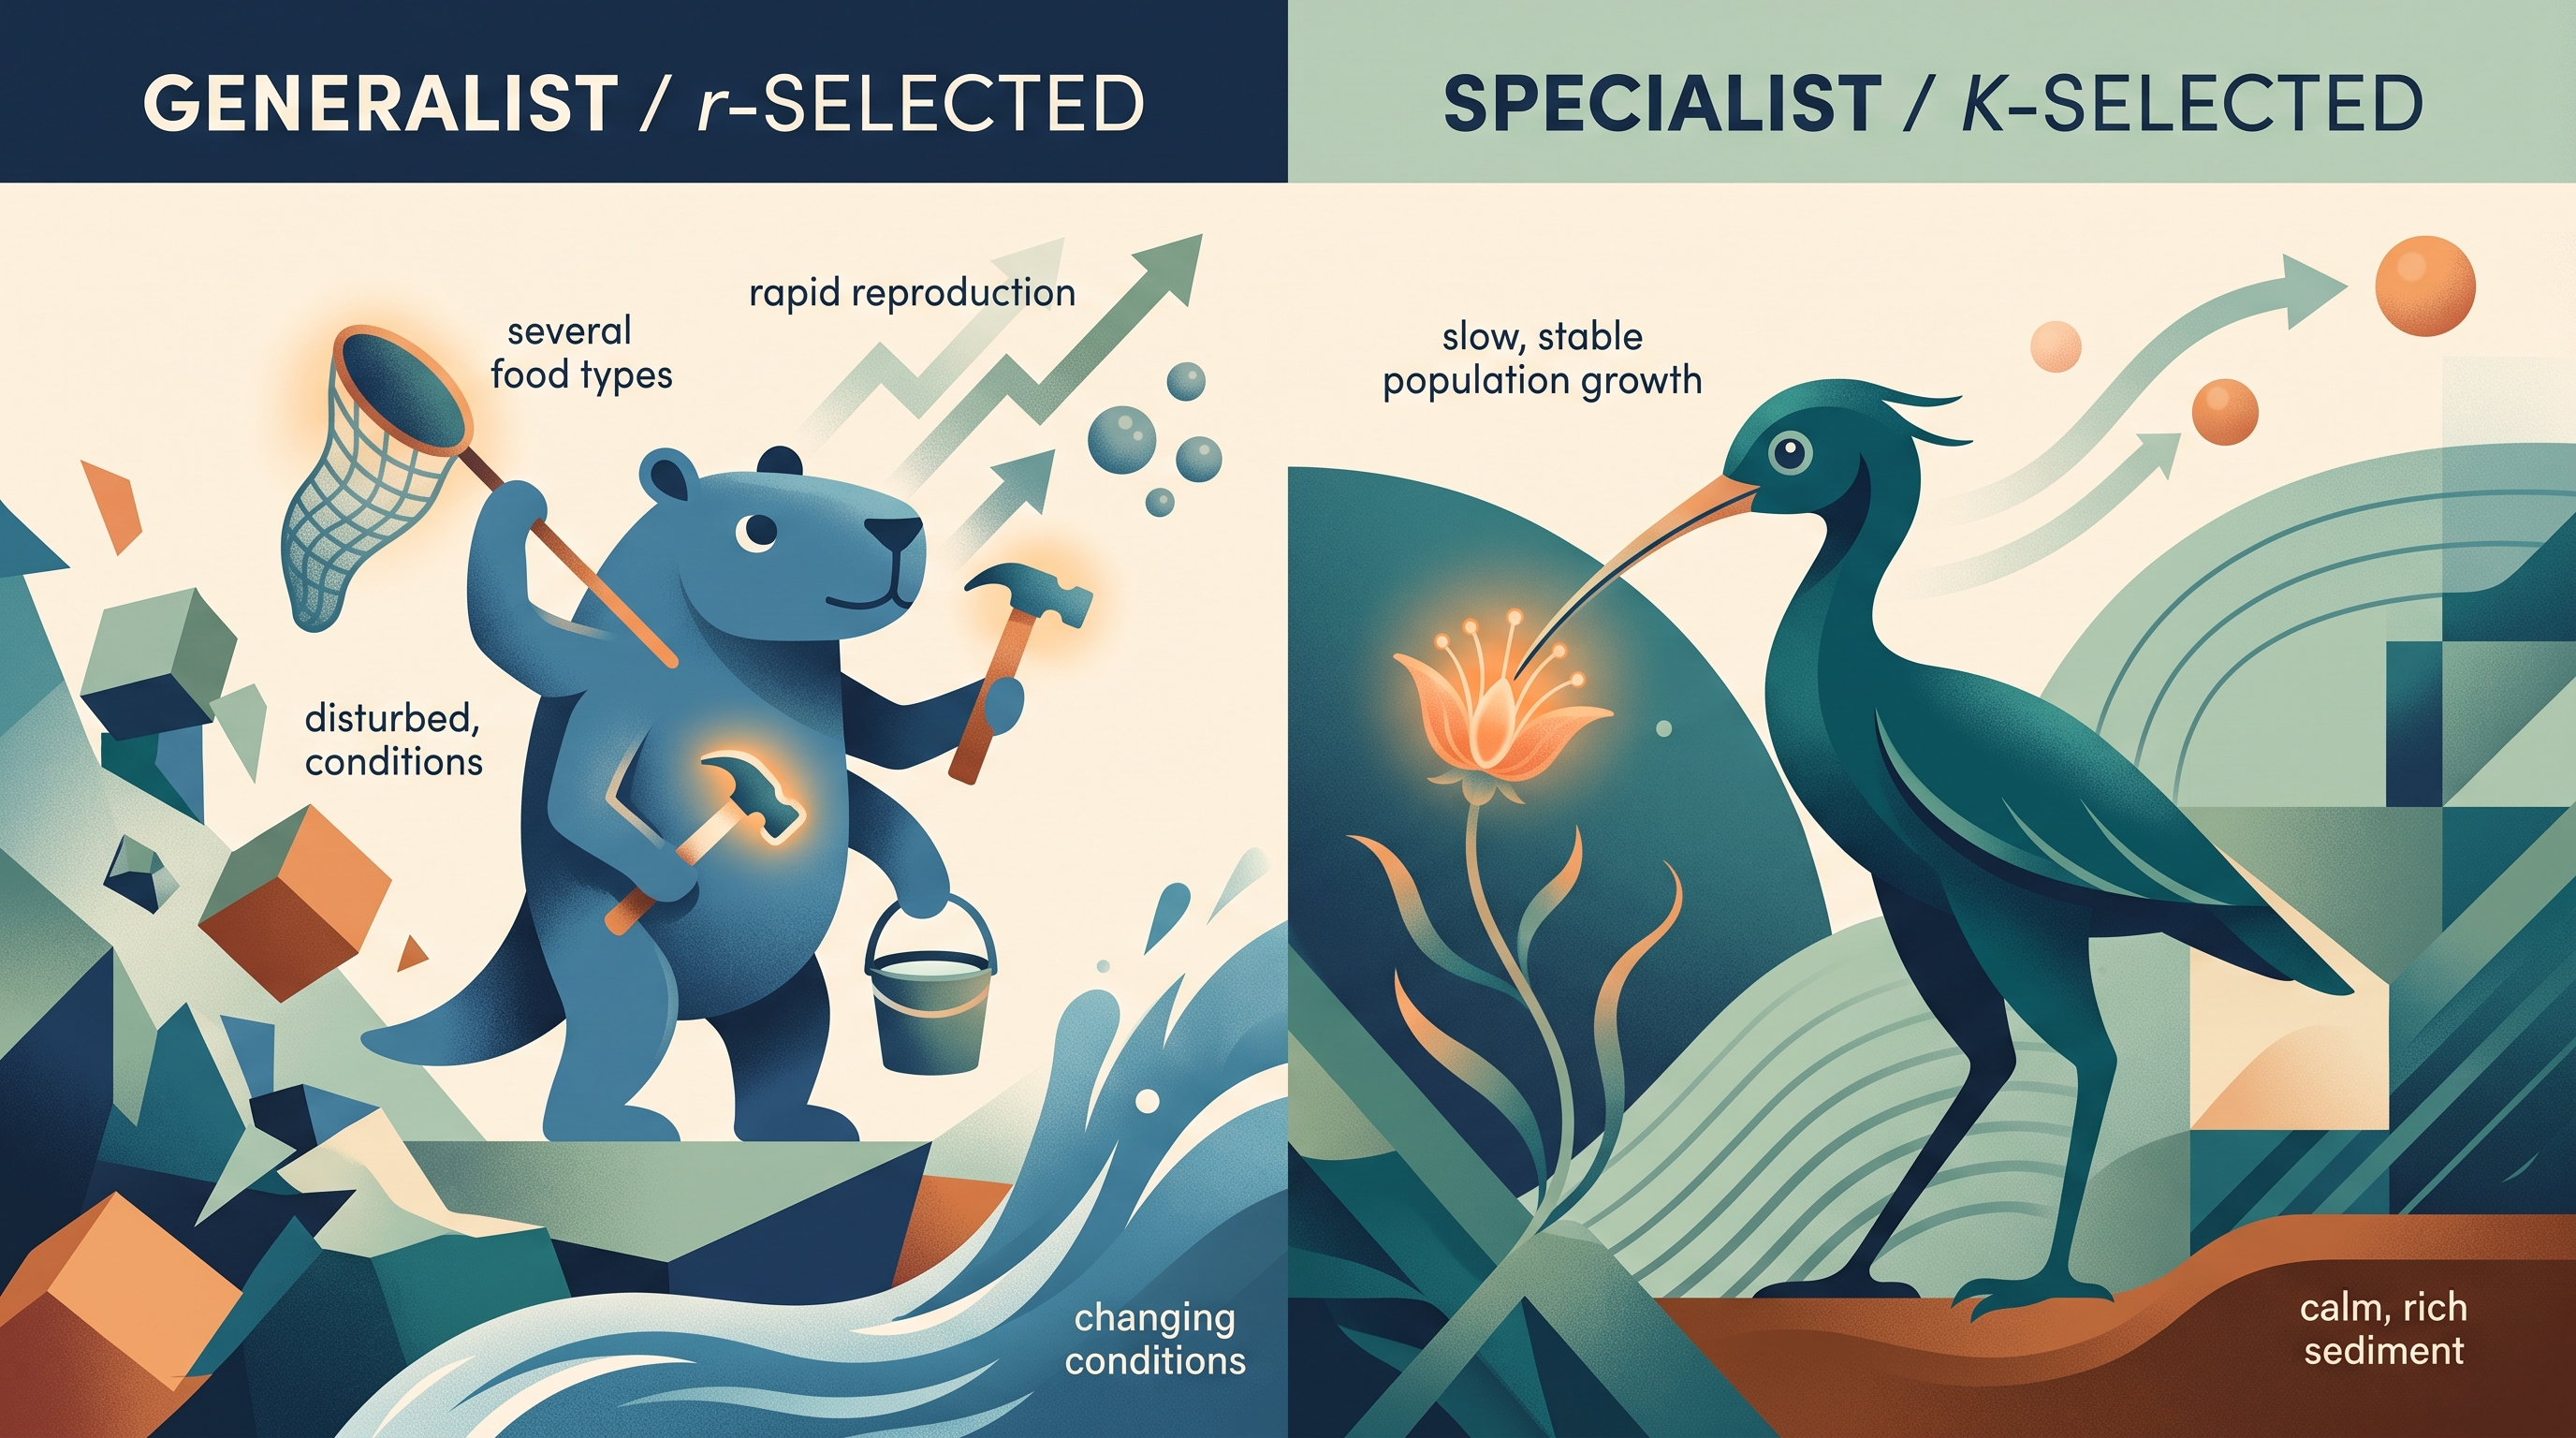
A habitat that changes slowly rewards precision; a habitat that changes often rewards flexibility. These two pressures help explain why some organisms are specialist species, adapted to a narrow range of conditions, while others are generalist species, able to use many resources and tolerate varied conditions.
Generalist and Specialist Species
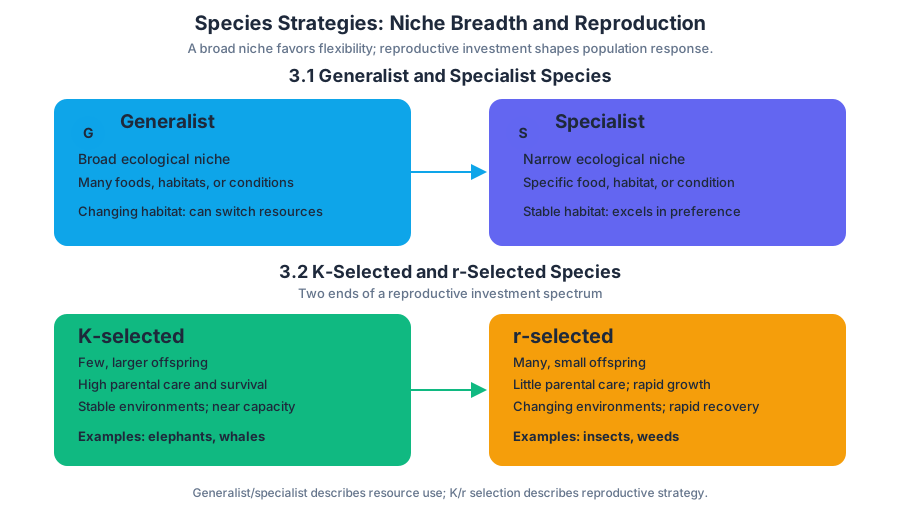
A specialist species has a narrow ecological niche—the specific range of resources, conditions, and relationships it needs to survive. A generalist species has a broader niche and can often eat different foods, occupy several habitats, or tolerate a wider range of environmental conditions.
| Species strategy | Resource use | Advantage in a stable habitat | Advantage in a changing habitat |
|---|---|---|---|
| Specialist | Narrow food source, habitat, or environmental requirement | Performs very well when its preferred conditions remain constant | Vulnerable if its resource or conditions disappear |
| Generalist | Many foods, habitats, or tolerable conditions | May face stronger competition from specialists using the same preferred resource | More likely to persist because it can switch resources or locations |
Worked example: Imagine a forest containing one tree species whose seeds are eaten by a bird with a highly specialized beak. If that tree species remains abundant for decades, the specialist bird may be extremely successful. If drought kills the trees, however, the bird cannot easily replace its food source. A generalist bird that eats seeds, insects, and fruit may be less efficient at using any one resource, but it has more ways to survive the drought.
This is the central relationship in Topic 3.1, aligned with ERT-3 and the learning objective to identify differences between generalist and specialist species. Specialist species tend to be advantaged in habitats that remain constant, while generalist species tend to be advantaged in habitats that are changing.
Habitat loss and changing advantage
Habitat destruction often removes specialists first because fragmentation or degradation eliminates the precise conditions they require. Generalists may persist longer by using disturbed areas, substitute foods, or smaller habitat patches, but continued habitat loss can eventually reduce generalist populations as well. Species requiring large territories are especially vulnerable because even apparently suitable fragments may be too small to support them.
The ecological consequence is not simply that “some animals disappear.” Losing specialists can remove particular pollination, predation, seed-dispersal, or feeding relationships; losing generalists later reduces the remaining flexibility of the community. Habitat change therefore alters both species composition and ecosystem function.
Misconception check: “Generalists are better-adapted than specialists.”
Correction: Neither strategy is universally superior. A specialist may outcompete a generalist when a preferred resource is abundant and stable. Generalists gain an advantage mainly when conditions vary or preferred resources become unreliable.
K-Selected and r-Selected Species
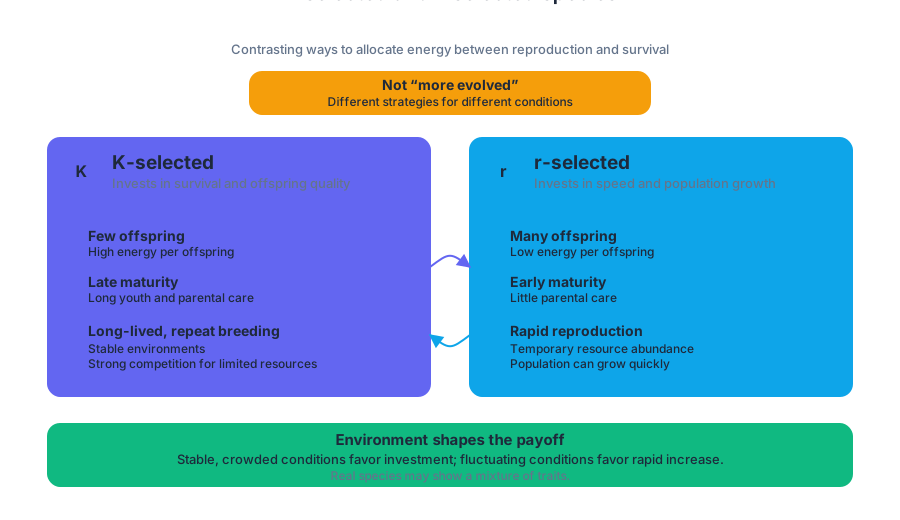
K-selected species and r-selected species represent contrasting reproductive strategies. The comparison is about how organisms allocate energy to reproduction and survival—not about whether one species is “more evolved” than another.
A K-selected species tends to be large, produce few offspring during each reproductive event, invest substantial energy in each offspring, mature after an extended period of youth and parental care, live relatively long lives, and reproduce more than once. Its population commonly experiences strong competition because resources in its relatively stable environment are limited.
An r-selected species generally emphasizes rapid reproduction and population increase. It tends to produce many offspring with relatively little investment in each individual, allowing the population to grow quickly when resources are temporarily abundant or when disturbed conditions create open opportunities.
| Reproductive strategy | Typical environmental context | Main population advantage | Common vulnerability |
|---|---|---|---|
| K-selected | Relatively stable conditions with intense competition | Efficient investment in a small number of offspring | Slow recovery when adult individuals or breeding habitat are lost |
| r-selected | Variable or disturbed conditions | Rapid increase in population size | Many offspring may fail to survive when resources become limited |
Worked contextual example: After a field is disturbed, fast-reproducing weeds may colonize exposed soil before slower-growing organisms arrive. Their high reproductive output allows a rapid increase in population size. A large mammal that produces one offspring after years of development cannot respond as quickly; even if adults survive, the population may recover slowly because replacement occurs over a longer time.
Invasive species
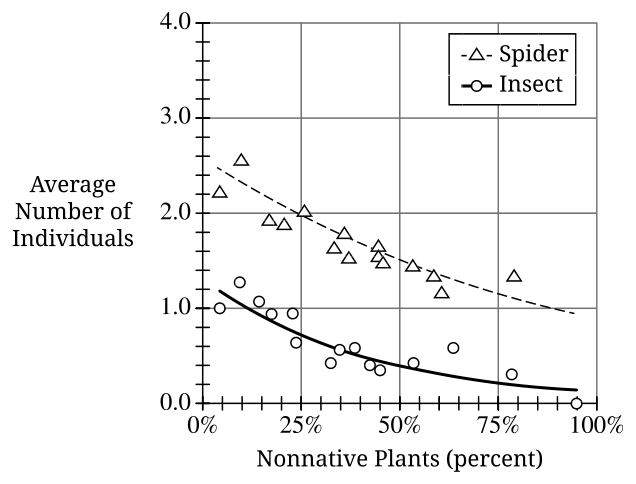
An invasive species is a nonnative species that spreads in a new environment and causes ecological, economic, or human-health harm. Invasive species may display generalist or r-selected characteristics: they often tolerate many conditions, use multiple resources, reproduce rapidly, and colonize disturbed habitats.
These traits do not mean that every invasive species is both generalist and r-selected, nor that every generalist or r-selected species is invasive. The important reasoning chain is: broad tolerance or rapid reproduction can help a nonnative population establish; escape from its original predators, parasites, or competitors can then allow it to expand and displace native species.
Misconception check: “Nonnative means invasive.”
Correction: Nonnative describes origin; invasive describes harmful spread. A species can be nonnative without becoming invasive.
AP skill and retrieval check
This topic is assessed through Science Practice 1: Concept Explanation, specifically 1.A — Explain environmental concepts and processes. A strong response names the strategy, connects it to habitat conditions, and explains the population consequence rather than merely labeling an organism.
Retrieval check: A wetland dries periodically, contains several food types, and is frequently disturbed. Which organisms should generally gain an advantage: specialists or generalists; K-selected or r-selected species? Explain using two linked reasons.
Answer: Generalists should generally be favored because they can use multiple resources and tolerate changing conditions. r-selected species may also gain an advantage because rapid reproduction can exploit temporary opportunities created by disturbance.
3.3 Survivorship Curves · 3.4 Carrying Capacity
Key concepts: Survivorship curves · Cohorts and cohort survival · The three main survivorship-curve shapes · Survival patterns across different life stages · K-selected and r-selected reproductive strategies · The relationship between reproductive strategy and survivorship-curve shape · Carrying capacity · Resource availability and sustainable population size · Habitat loss and reduced carrying capacity · Analyzing and explaining patterns and trends in survivorship data
A population can lose most of its members either early in life, steadily across life, or mainly near old age. A survivorship curve shows how the proportion of a birth group remains alive as the group ages; carrying capacity, in contrast, describes how many individuals an environment can sustain.
3.3 Survivorship Curves · 3.4 Carrying Capacity
A population can lose most of its members either early in life, steadily across life, or mainly near old age. A survivorship curve shows how the proportion of a birth group remains alive as the group ages; carrying capacity, in contrast, describes how many individuals an environment can sustain.
Cohorts: Following One Birth Group Through Time
A cohort is a group of individuals born during the same period. Researchers can follow one cohort—such as all bobcats born in a particular year—and record how many survive at successive ages. If $800$ newborns become $600$ yearlings, then $75%$ of the original cohort survived to age one; if $200$ remain at age eight, the cohort survival is $25%$.
$$ \text{Proportion surviving at age }x
\frac{\text{number alive at age }x}{\text{number born in the cohort}} $$
The vertical axis of a survivorship graph therefore represents the fraction or percentage of the original cohort still alive, while the horizontal axis represents age. The curve is about age-specific survival, not the total number of organisms currently living in the ecosystem.
The Three Main Survivorship-Curve Shapes
| Curve type | Survival pattern | Typical interpretation |
|---|---|---|
| Type I | High survival through early and middle life, followed by a steep decline in old age | Most individuals live to an advanced age |
| Type II | A relatively constant probability of dying at any age | Juveniles, adults, and older individuals experience a similar death rate |
| Type III | Very high mortality early in life, followed by high survival among the few that remain | Many offspring die young, but survivors may live much longer |
Imagine three different slopes. A Type I curve stays high and bends sharply downward near the end. A Type II curve descends at a fairly steady rate. A Type III curve drops sharply at the beginning and then levels out. These shapes summarize patterns across life stages rather than predicting the exact lifespan of every individual.
Misconception check — “Type III means the species is unhealthy.” Not necessarily. A species may produce thousands of offspring while only a small number survive to adulthood. High early mortality can be a normal life-history pattern, especially when offspring receive little protection or parental investment.
Reproductive Strategy and Survivorship Shape
The relationship with reproductive strategy is statistical, not absolute. K-selected reproductive patterns often align with Type I curves because relatively few offspring receive substantial investment and tend to have high survival after early life. r-selected patterns often align with Type III curves because many offspring are produced, but most do not survive early stages. Real populations can show exceptions, and a species should be classified from its observed survival data rather than from a label alone.
Reading Survivorship Data as Evidence
When interpreting a graph, first identify what each axis measures. Then describe the pattern with a direction and life stage: “survival decreases rapidly during the juvenile years and changes little afterward” is stronger than “the population is affected.” Finally, connect the pattern to a defensible ecological explanation, such as predation on young organisms, disease in older organisms, or protection of offspring.
Worked Example: A Coastal Turtle Cohort
A cohort begins with $1{,}000$ hatchlings. After one year, $120$ remain; after five years, $90$ remain; and after twenty years, $70$ remain. The largest loss occurs during the earliest life stage:
$$ \frac{120}{1{,}000}=0.12=12% $$
Only $12%$ survive to age one, but approximately $58%$ of the one-year survivors remain at age twenty:
$$ \frac{70}{120}\approx 0.58=58% $$
This pattern is consistent with a Type III curve: very high mortality occurs early, while individuals that reach later life stages have a much greater chance of surviving. An evidence-based conclusion would state both the trend and its support: the cohort shows Type III survivorship because survival falls sharply before age one but declines much more slowly afterward.
This is an application of Science Practice 5: Data Analysis, especially 5.E: Explain what the data implies or illustrates about environmental issues. On an exam, use values or visible graph features as evidence; do not merely name the curve.
Carrying Capacity Is a Different Population Measure
Carrying capacity, represented by $K$, is the maximum population size that an environment can sustain over time with its available resources. Food, water, space, shelter, and habitat quality all influence $K$. A survivorship curve can remain unchanged while the number of individuals an area supports changes, because the two concepts answer different questions:
- Survivorship curve: At what ages do individuals in a cohort survive or die?
- Carrying capacity: How many individuals can the environment support?
Worked Example: Bobcats and Habitat Loss
Suppose a forest supports $40$ bobcats when it contains abundant prey and shelter. If roads and development remove much of the forest, fewer resources remain. The area’s carrying capacity for bobcats decreases, perhaps from $K=40$ to $K=18$; the reduction is caused by habitat and resource loss, not by a change in the definition of a survivorship curve.
If the bobcat population remains above the new $K$, overshoot occurs. Resource depletion can then produce dieback, often through famine, disease, or conflict. A strong data-based explanation would connect the representations in sequence: reduced habitat $\rightarrow$ fewer resources $\rightarrow$ lower $K$ $\rightarrow$ possible overshoot and population decline.
Retrieval Check
A graph drops steeply during the first year and then becomes nearly flat. Identify the curve type, state what the graph says about survival at different life stages, and explain why removing habitat would affect carrying capacity even though the graph itself describes age-specific survival.
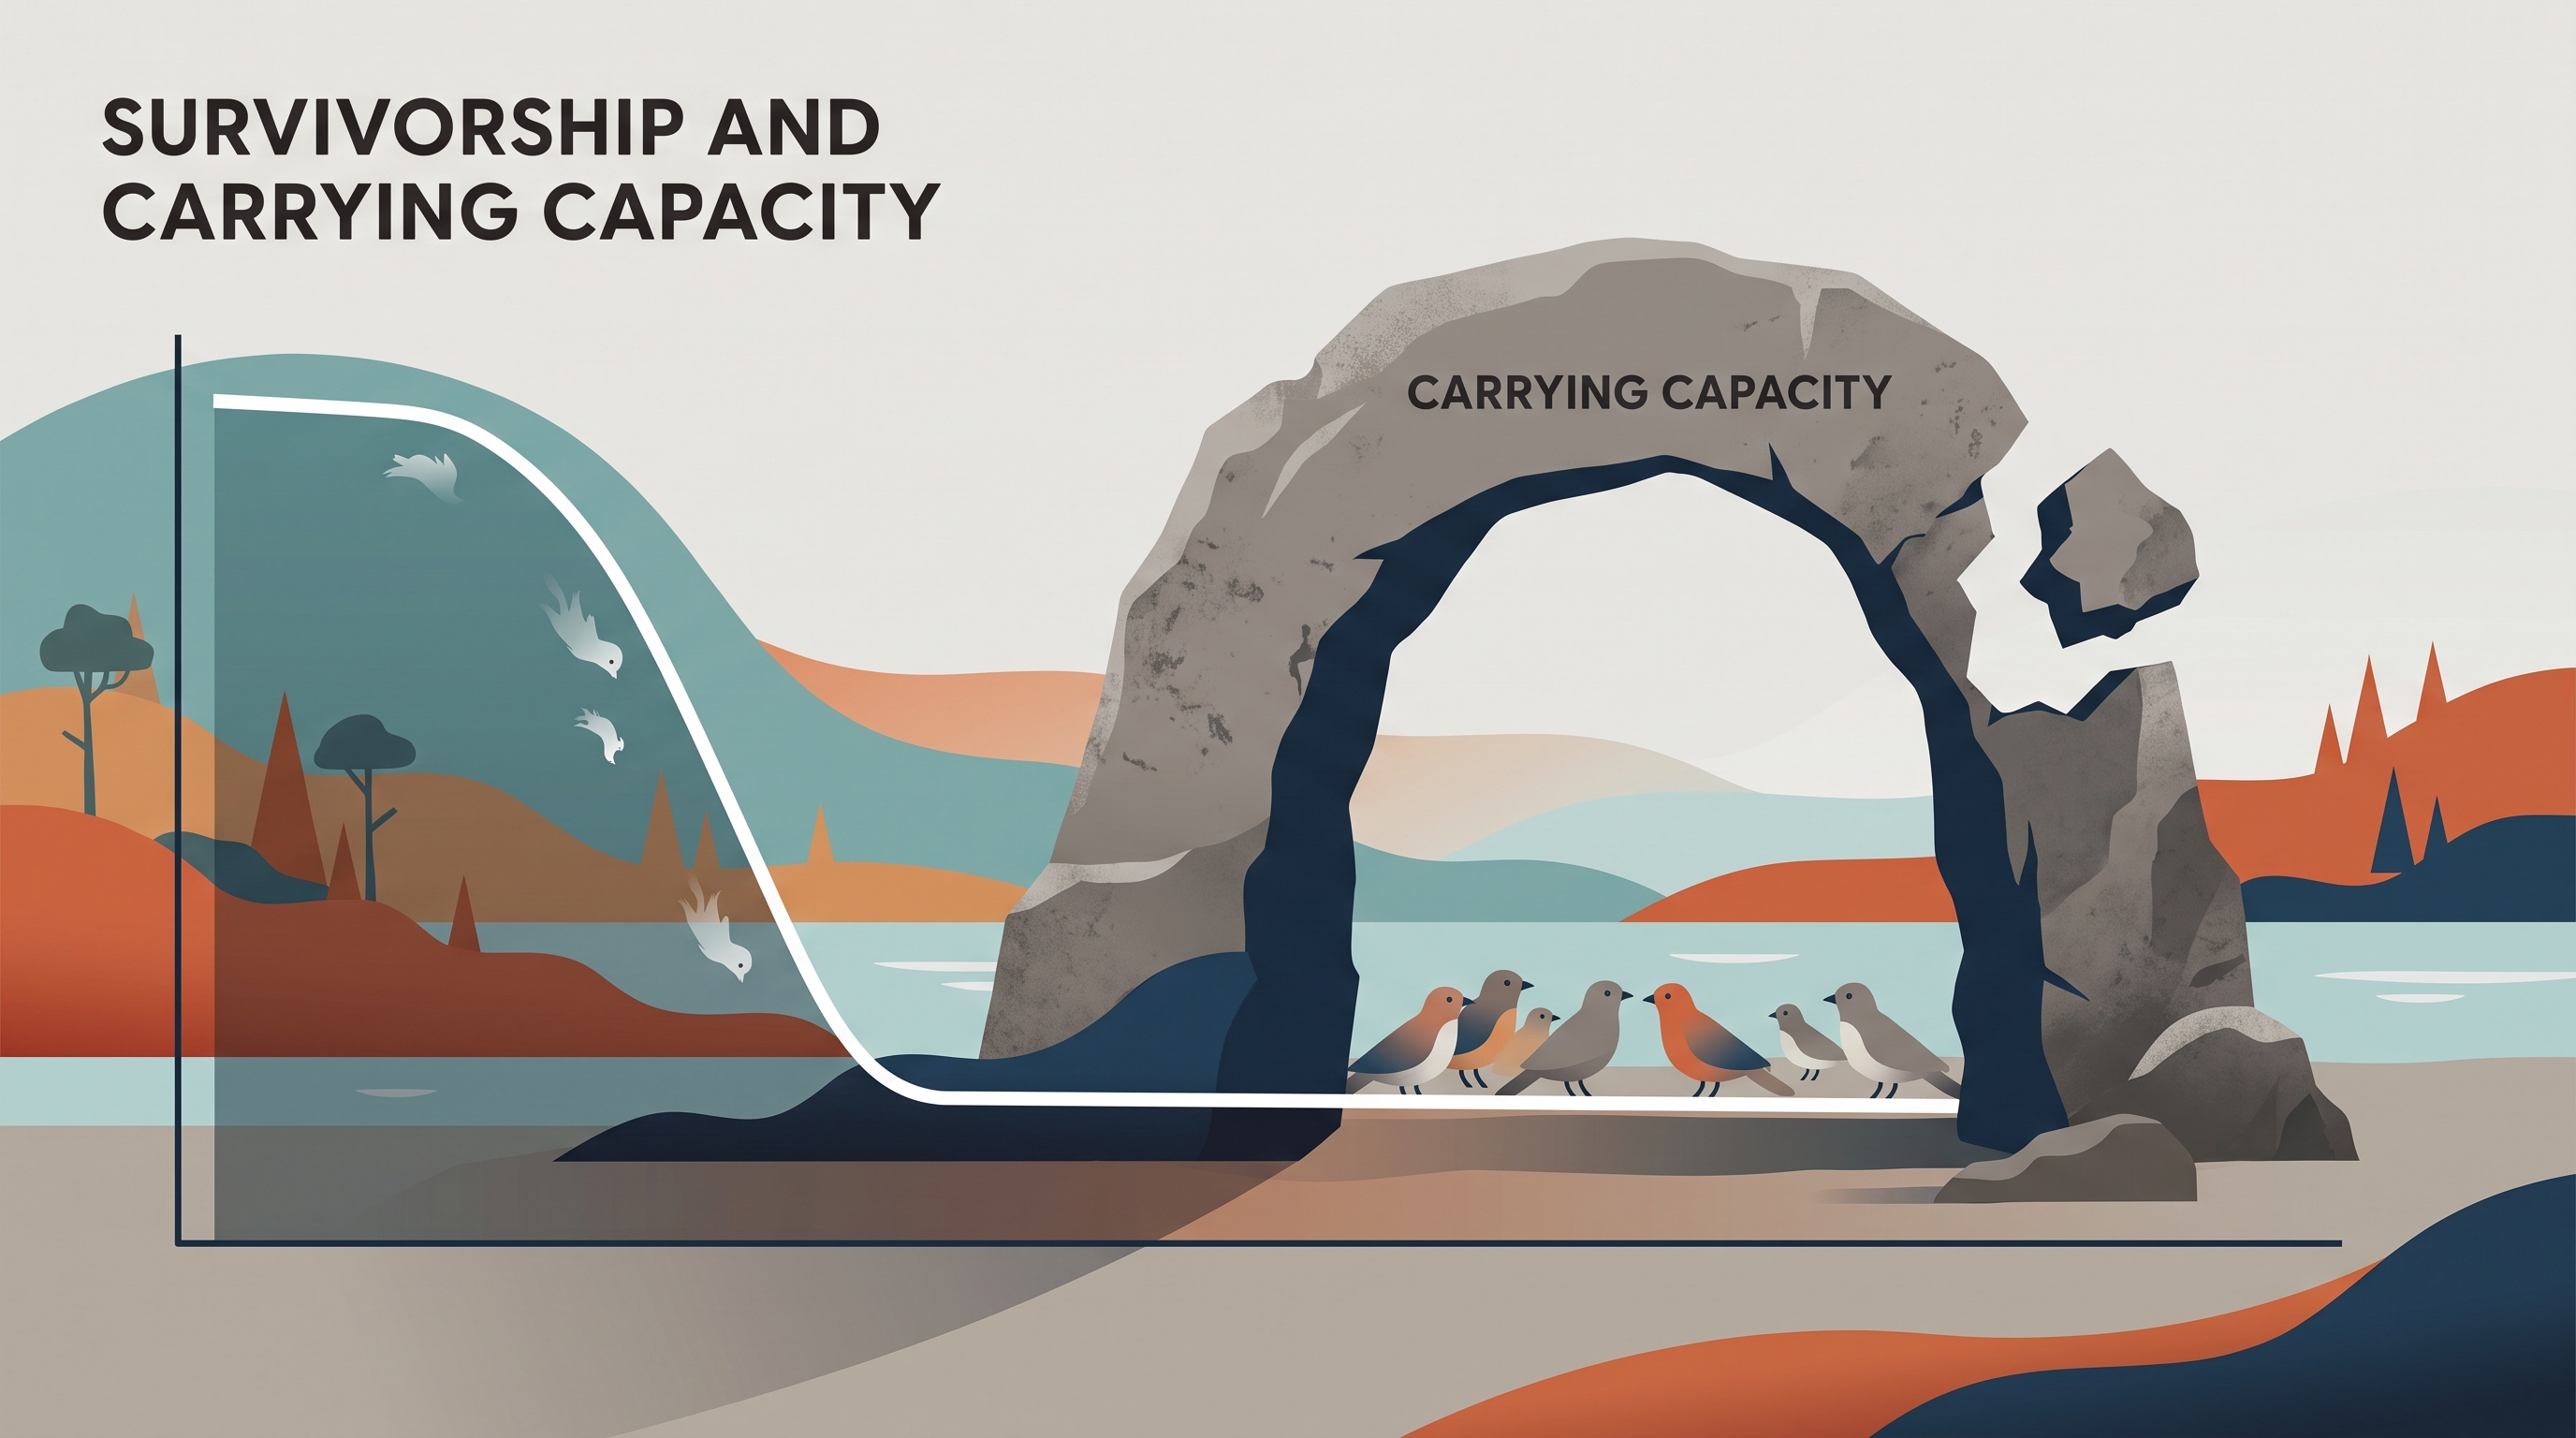
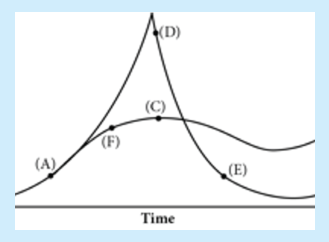
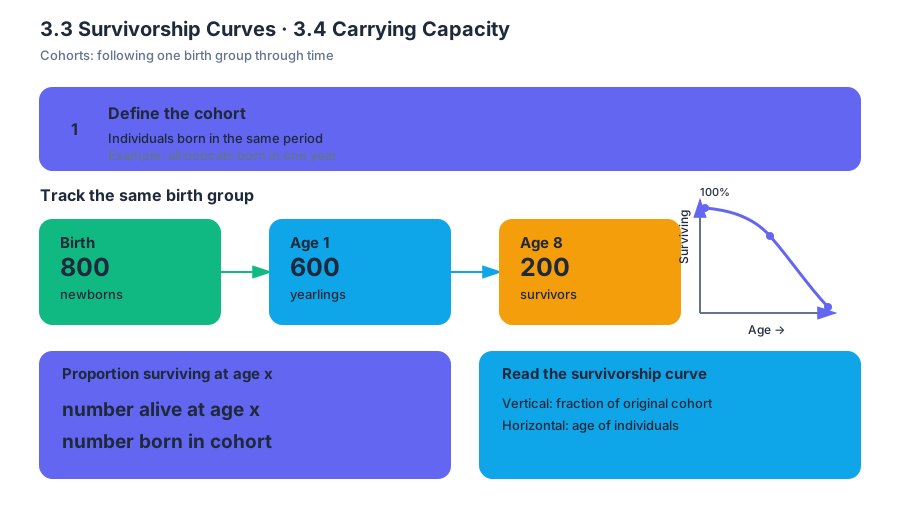
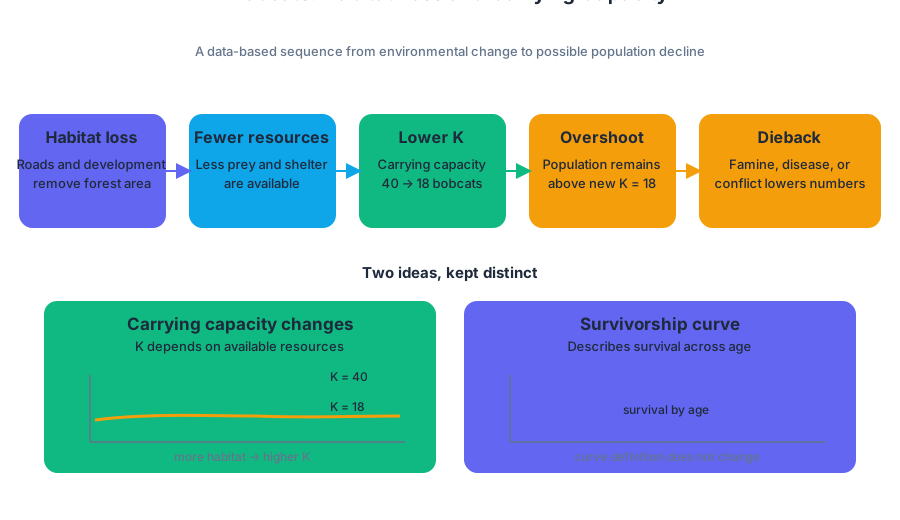
3.5 Population Growth and Resource Availability · 3.6 Age Structure Diagrams
Key concepts: Population growth · Resource availability · Carrying capacity · Finite resource base · Population growth rates · Age structure diagrams · Population age distribution · Stable and declining populations · Social and cultural factors · Population fluctuations
A population can expand rapidly when food, water, space, and other necessities are abundant—but no population can draw indefinitely from an unlimited supply. Resource availability connects the short-term rate of population growth to the longer-term limits imposed by a finite environment.
3.5 Population Growth and Resource Availability · 3.6 Age Structure Diagrams
A population can expand rapidly when food, water, space, and other necessities are abundant—but no population can draw indefinitely from an unlimited supply. Resource availability connects the short-term rate of population growth to the longer-term limits imposed by a finite environment.
3.5 Population Growth and Resource Availability
The resource base is the total amount of usable resources available to a population. It includes necessities such as nutrients, water, food, shelter, and space. Because these resources are limited and finite over all scales of time, population growth cannot remain exponential forever.
ERT-3.F.1: Population growth is limited by environmental factors, especially by available resources and space.
ERT-3.F.2: Resource availability and the total resource base are limited and finite over all scales of time.
When resources needed for reproduction and survival are abundant, population growth usually accelerates. As the resource base shrinks, competition increases; resources may be distributed unevenly, causing increased mortality, decreased fecundity—the ability to reproduce—or both. Growth may then decline to, or remain at or below, carrying capacity.
Worked example — a deer population: A protected valley begins with $200$ deer and plentiful vegetation. One year later, the population is $230$. The numerical change is
$$ \Delta N = 230 - 200 = 30 \text{ deer}. $$
The finite growth rate is
$$ \frac{\Delta N}{N_0} = \frac{30}{200} = 0.15, $$
or $15%$ per year. If drought reduces plant growth, the population may experience less food, lower birth rates, and higher death rates. Even if the valley’s physical area remains unchanged, its effective resource base has declined, so population growth can slow, stop, or become negative.
Population change should be analyzed with graphs and tables rather than guessed from a single value. A rising population may still be growing more slowly if the slope of its graph is decreasing. A temporary decline may represent dieback, a sharp population reduction caused by famine, disease, conflict, or another limiting factor, rather than a permanent disappearance.
The AP skill 6.B Mathematical Routines is assessed when you calculate and interpret quantities such as population change, growth rate, or percent change. The AP skill 5.C Data Analysis is assessed when you use a graph or table to identify a trend, compare time intervals, and draw a conclusion supported by the data.
Misconception check — “carrying capacity is a permanent number.” Carrying capacity is not automatically fixed. If rainfall, food production, habitat quality, technology, disease prevalence, or conflict changes, the resources available to the population can change as well. A population may therefore fluctuate around a changing limit.
3.6 Age Structure Diagrams
An age structure diagram represents the age distribution of a population. It commonly displays younger individuals at the bottom and older individuals at the top, with males on one side and females on the other. The diagram’s overall shape provides evidence about likely population growth.
EIN-1.A.1: Population growth rates can be interpreted from age structure diagrams by the shape of the structure.
EIN-1.A.2: A rapidly growing population will, as a rule, have a higher proportion of younger people compared to stable or declining populations.
A broad-based, triangular diagram indicates many young people who may soon enter reproductive ages. This age distribution generally signals a growing population. A more column-shaped diagram contains similar proportions across many age groups and suggests a relatively stable population. A narrower-based or top-heavy diagram contains fewer young people and is associated with a declining population.
Worked interpretation: Imagine three countries with the same total population. Country A has a very wide base, Country B has nearly vertical sides, and Country C has a narrow base with a larger older population. Country A is likely to grow fastest because a greater fraction of its population is young. Country B is likely to change slowly, while Country C may decline unless migration or a later increase in births changes the pattern.
Age structure does not determine population change by itself. Social and cultural factors—including access to education and health care, cultural expectations, economic conditions, family planning, and the age at which people have children—can influence birth rates and therefore reshape the diagram over time. Human populations also change through births, deaths, immigration, and emigration.
Misconception check — “a large young population is already growing at its maximum rate.” A youthful age structure indicates potential for continued growth, not a guaranteed growth rate. If resources are scarce or social conditions change, birth rates may fall and mortality may rise.
Retrieval Check
A town increases from $8{,}000$ to $8{,}240$ people in one year. Calculate its finite growth rate, then predict which age-structure shape would most strongly suggest continued rapid growth. Explain how a drought could alter both answers over several years. A complete response should calculate
$$ \frac{8{,}240-8{,}000}{8{,}000}\times 100 = 3% $$
and connect a broad youthful base with growth potential, while linking drought to reduced resource availability, lower fecundity, increased mortality, or dieback. This applies 5.C Data Analysis and 6.B Mathematical Routines.
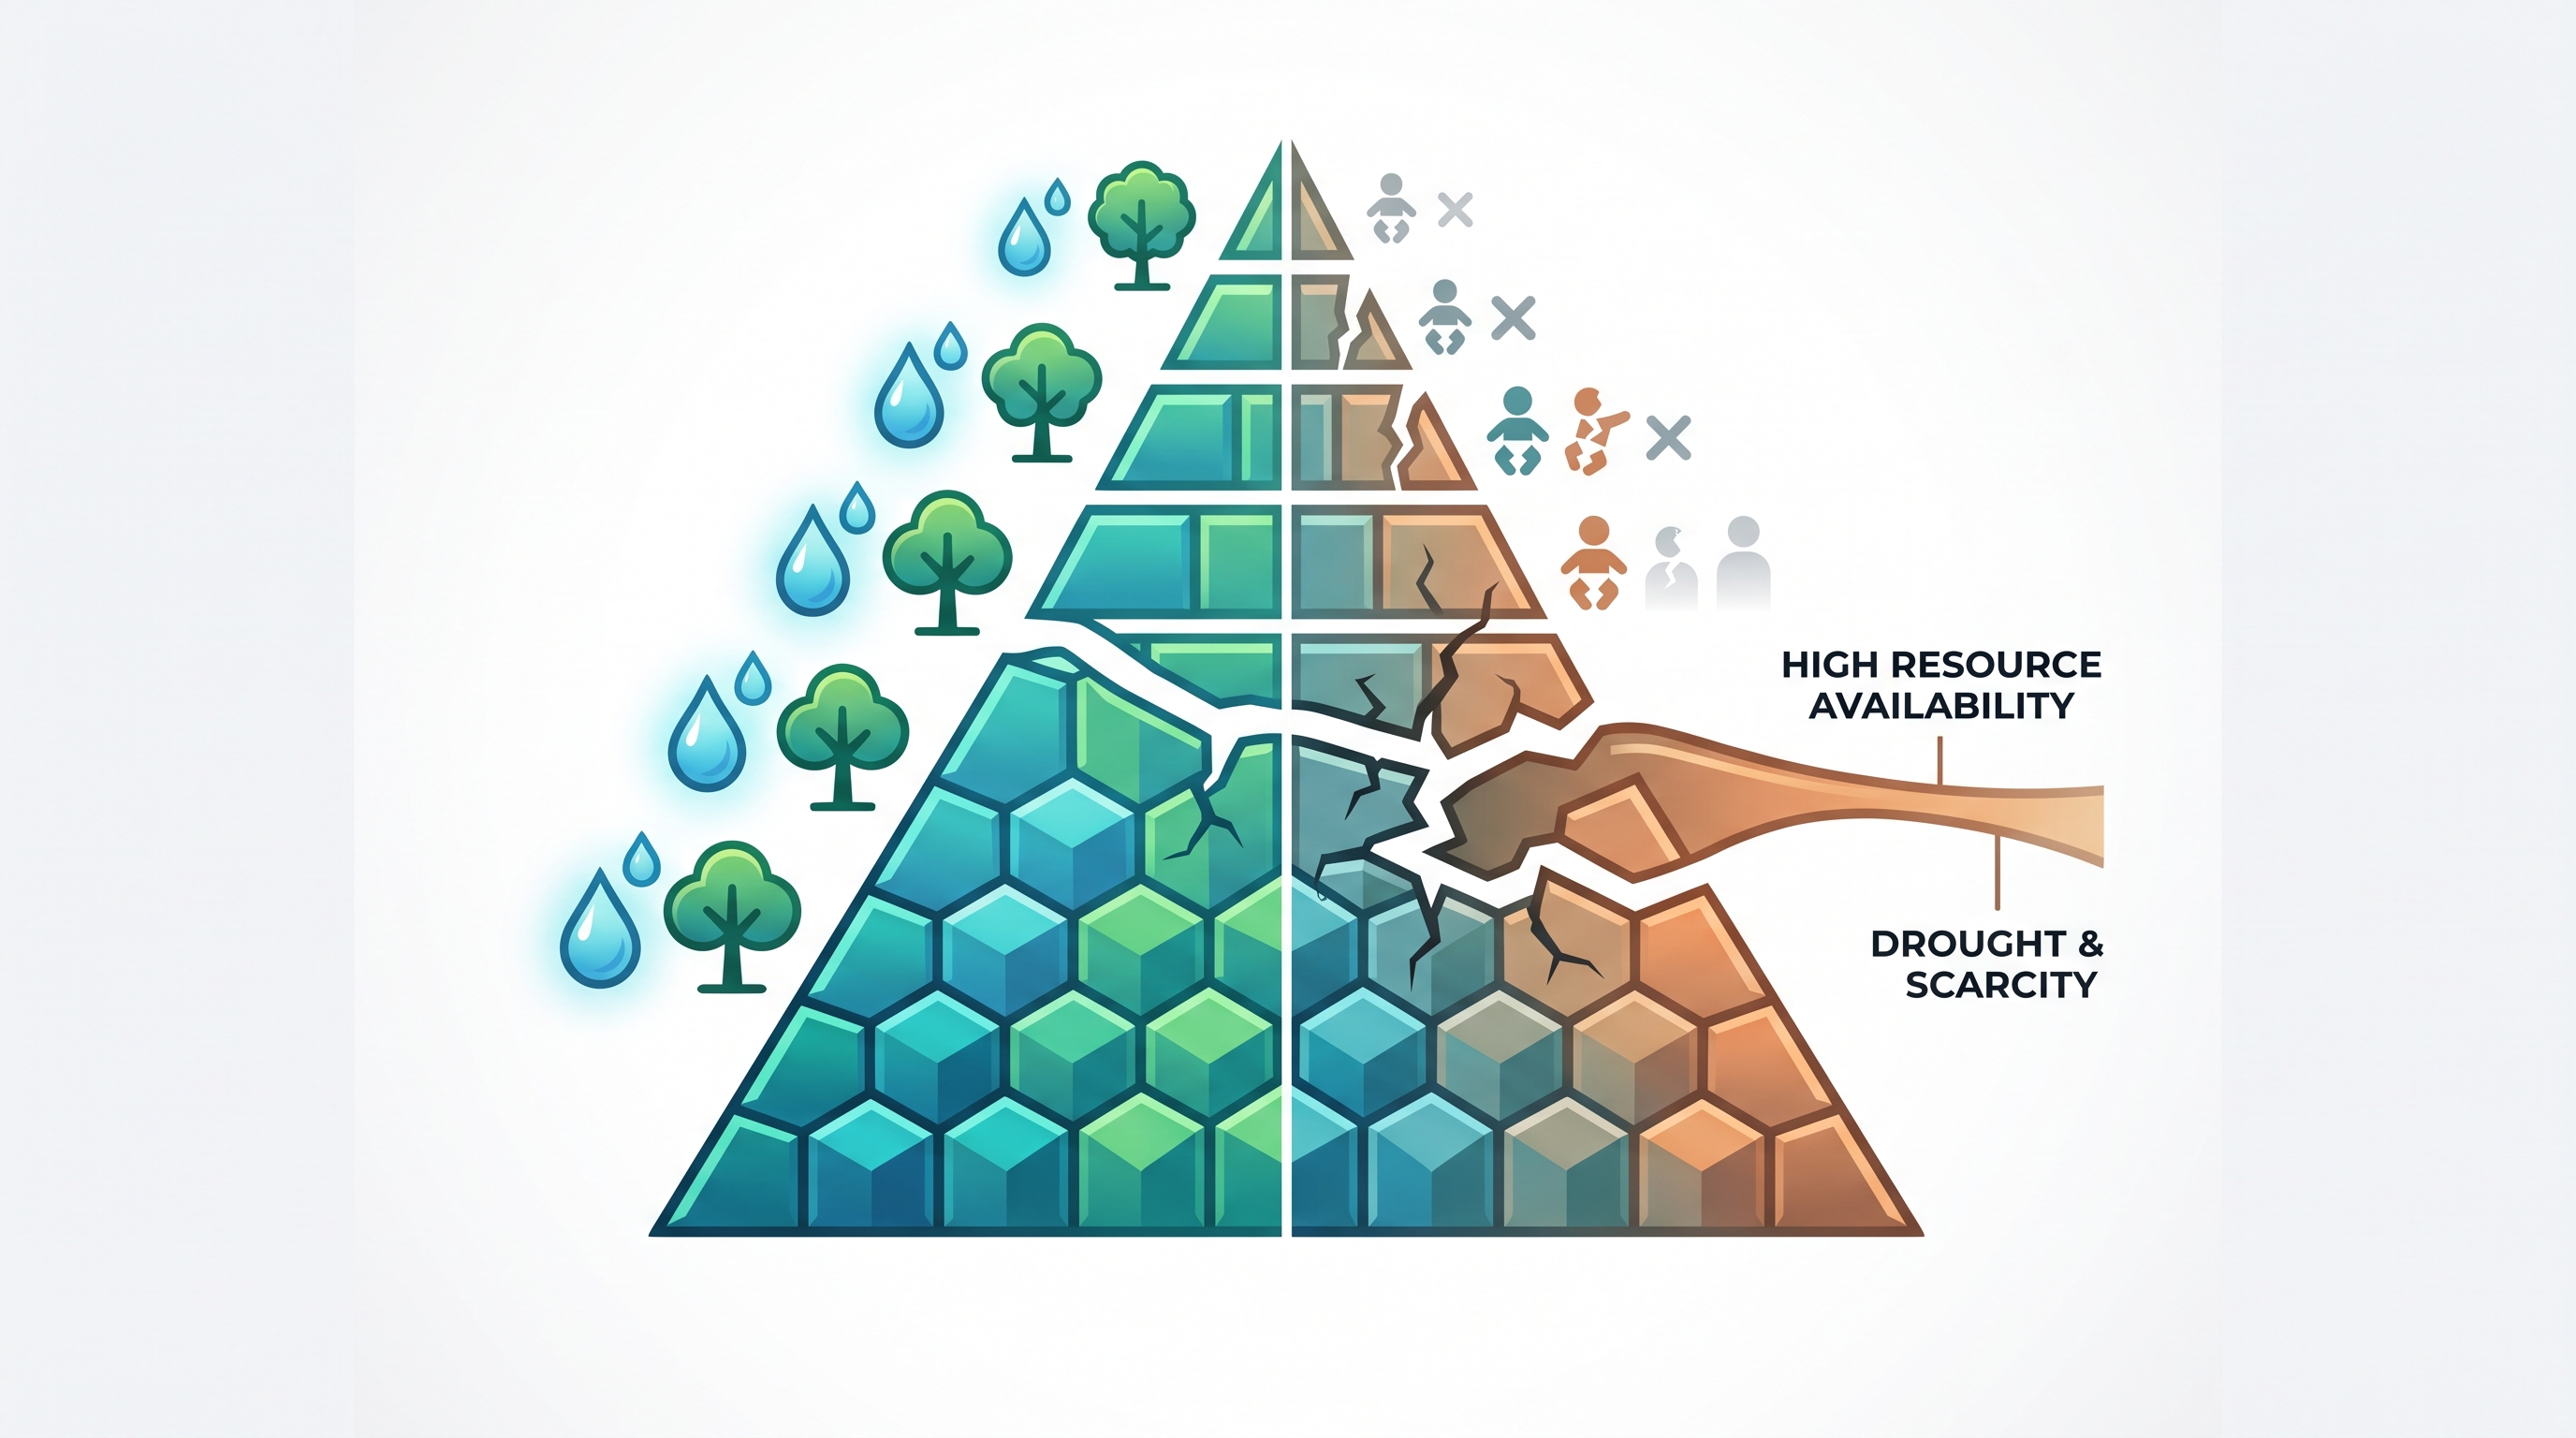
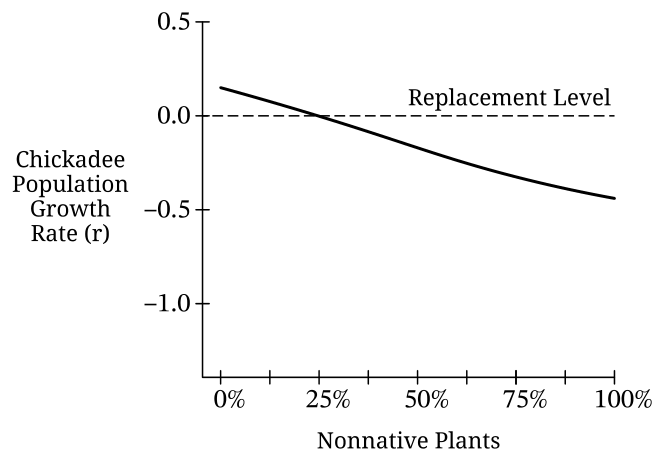
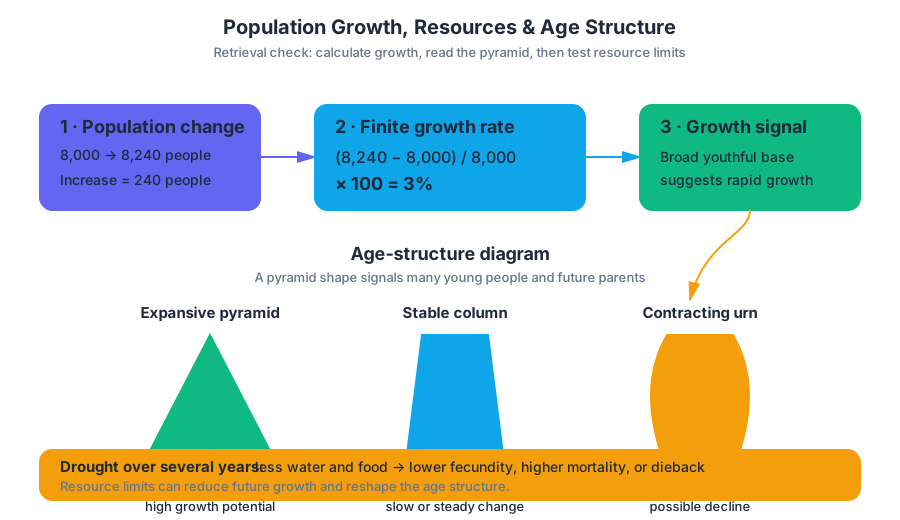
3.7 Total Fertility Rate · 3.8 Human Population Dynamics
Key concepts: Total fertility rate (TFR) · Human population dynamics · Birth rates and death rates · Immigration and emigration · Rate of natural increase (RNI) · Replacement-level fertility · Infant mortality rates · Population pyramids · Factors affecting fertility, including age at first child and education · Data analysis of population patterns and trends
A population can continue growing even after its total fertility rate has fallen because today’s large number of young people may still enter childbearing ages.
3.7 Total Fertility Rate · 3.8 Human Population Dynamics
A population can continue growing even after its total fertility rate has fallen because today’s large number of young people may still enter childbearing ages. Human population change therefore depends on more than births alone: it is the combined result of births, deaths, immigration, and emigration.
Total Fertility Rate and Its Drivers
Total fertility rate (TFR) is the average number of children a female is expected to have over her lifetime if current age-specific fertility rates remain constant. TFR describes reproductive patterns across a population; it is not the number of births occurring in one year and not the fertility of one individual.
EIN-1.B — Learning Objective: Explain factors that affect total fertility rate in human populations.
The EIN-1.B.1 factors affecting TFR include the age at which females have their first child, educational opportunities for females, access to family planning, and government acts and policies. When people have greater access to education and family planning, and when childbearing begins later, the average number of children often decreases because individuals have more control over the timing and number of births.
These factors interact rather than operate as isolated switches:
| Factor | How it can affect TFR |
|---|---|
| Age at first child | Earlier first births generally allow more potential childbearing years; later first births often reduce lifetime fertility. |
| Education | More educational opportunity can delay childbearing and expand employment choices. |
| Family planning | Contraception and reproductive-health services allow people to plan births. |
| Government policy | Laws, incentives, healthcare systems, and social programs can influence reproductive decisions. |
| Healthcare and nutrition | Better maternal care and nutrition can reduce infant mortality and alter fertility decisions over time. |
Replacement-level fertility is the fertility rate at which a population replaces itself from one generation to the next. Under EIN-1.B.2, fertility at replacement levels produces a relatively stable population when other factors, especially migration, are excluded. Replacement level is not a universal single number because survival rates and population conditions differ.
Under EIN-1.B.3, infant mortality is associated with whether mothers have access to good healthcare and nutrition. If infant mortality is high, families may have more children because some may not survive to adulthood; if healthcare and nutrition improve, infant mortality may decline, and fertility patterns may change over time.
Misconception check: A lower TFR does not automatically mean that the population immediately shrinks. Population age structure can delay the effect of changing fertility.
Human Population Dynamics
Human population dynamics describes how the size and structure of a human population change through time. The basic accounting relationship is:
$$ \Delta P = (B - D) + (I - E) $$
where $B$ is births, $D$ is deaths, $I$ is immigration, and $E$ is emigration. Births and immigration increase population size; deaths and emigration decrease it.
Birth and death rates respond to social and environmental conditions. Access to education, family planning, healthcare, and nutrition can affect birth rates, death rates, and infant mortality. Poor health conditions, inadequate nutrition, or limited medical access may increase death rates, while improved healthcare can reduce mortality even before fertility declines.
Rate of Natural Increase
The rate of natural increase (RNI) measures population growth or decline from births and deaths alone, excluding migration. Under EIN-1.C.4, RNI is calculated by subtracting the crude death rate from the crude birth rate and is typically expressed as a percentage:
$$ \text{RNI} = \text{crude birth rate} - \text{crude death rate} $$
If a country has a crude birth rate of $24$ births per $1{,}000$ people and a crude death rate of $9$ deaths per $1{,}000$ people:
$$ \text{RNI} = \frac{24-9}{1{,}000} \times 100 = 1.5% $$
A common estimate of population doubling time is the rule of $70$:
$$ \text{Doubling time} \approx \frac{70}{\text{annual growth rate expressed as a percentage}} $$
For an annual growth rate of $1.5%$:
$$ \text{Doubling time} \approx \frac{70}{1.5} \approx 46.7\text{ years} $$
This estimate assumes continued growth at approximately the same rate; it is not a guarantee.
EIN-1.C.1: Human population growth and decline are determined by the rates of birth, death, immigration, and emigration.
Reading Population Data
A population pyramid displays the proportions of young and old individuals. A broad base indicates a large proportion of young people and suggests potential future growth as those individuals reach reproductive ages. A more rectangular shape suggests a relatively even distribution across age groups, while a narrower base indicates fewer young people and possible future decline.
For Science Practice 5: Data Analysis, especially 5.A — Describe patterns and trends in data, identify the overall direction, compare groups or time periods, and support the statement with values from the graph or table. For example: “The TFR decreased from approximately $4.0$ to $2.1$ children per female while female educational access increased.” That response describes a pattern; merely saying “the graph changes” does not.
Environmental Significance
Human population growth has increased both the rate and the scale of environmental impacts. More people can increase demand for food, energy, water, land, and materials, although the environmental effect also depends on consumption patterns and technology. Sustainability can be tracked using indicators such as biological diversity, food production, and average global temperature.
Retrieval check: A region has a crude birth rate of $18$ per $1{,}000$ people, a crude death rate of $8$ per $1{,}000$, immigration of $3{,}000$ people, and emigration of $1{,}000$ people. Is its RNI calculated using migration? What is its RNI percentage, and which two population flows must be added to determine total population change?
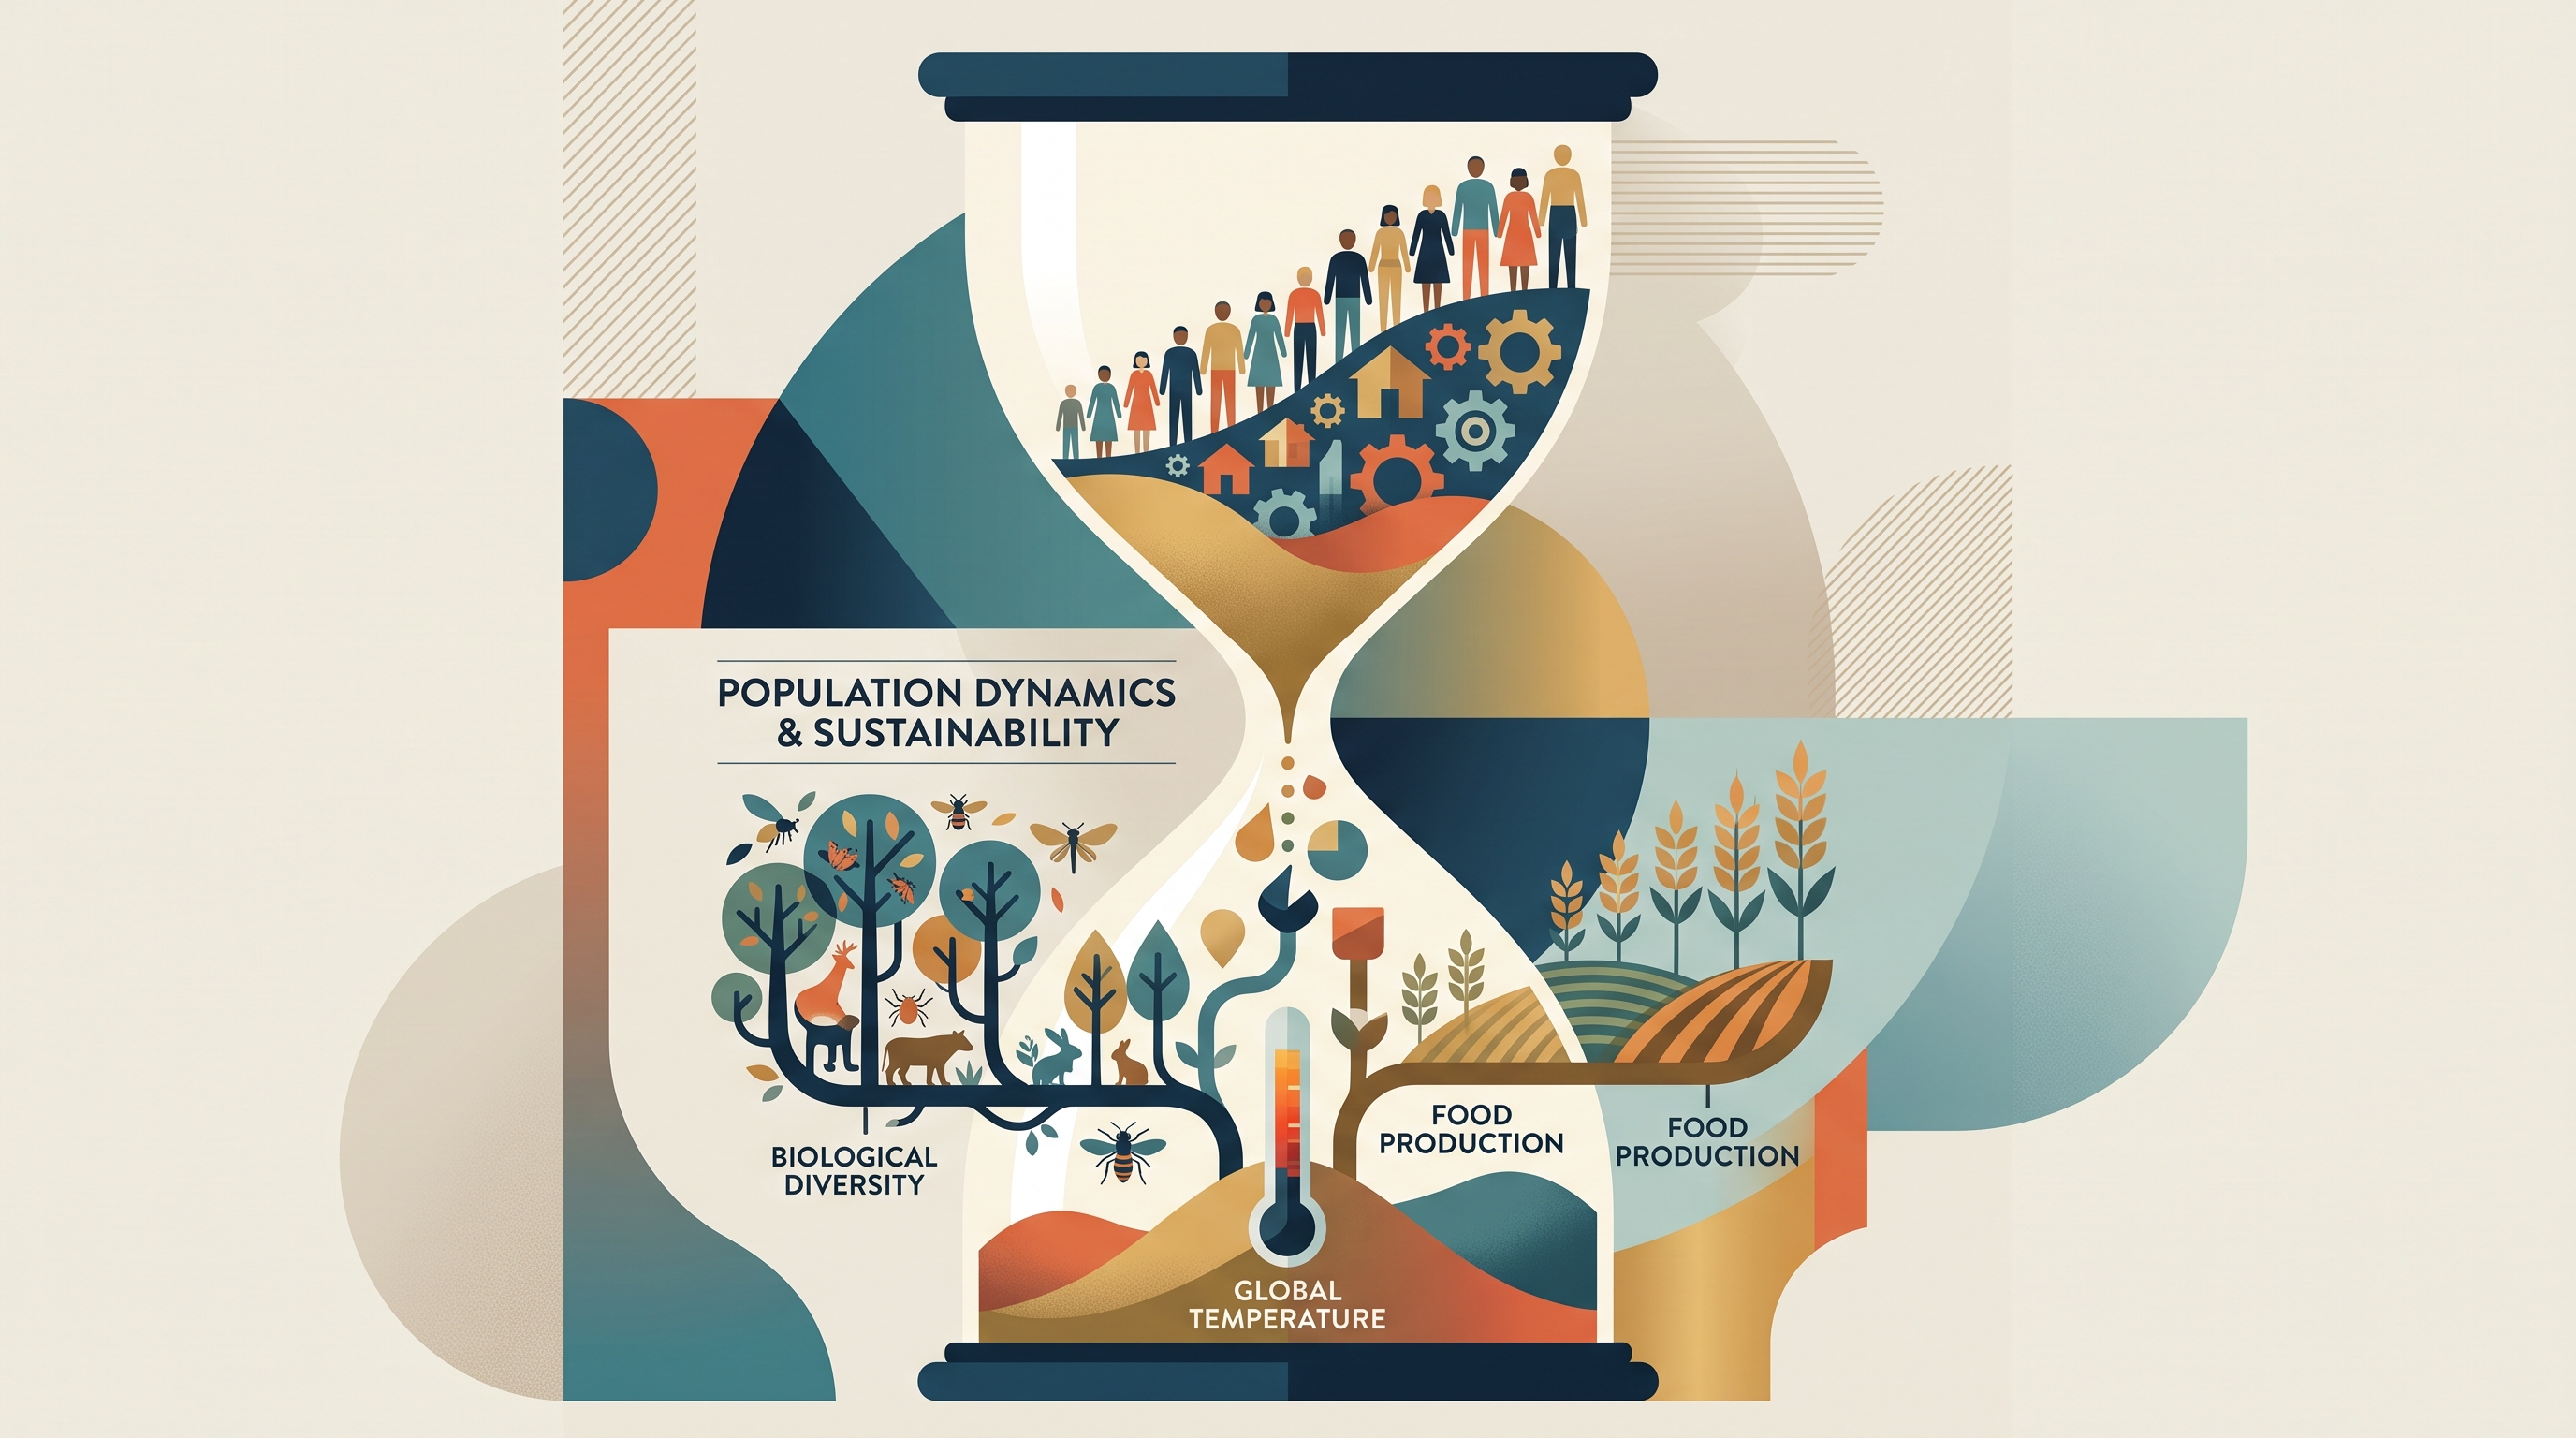
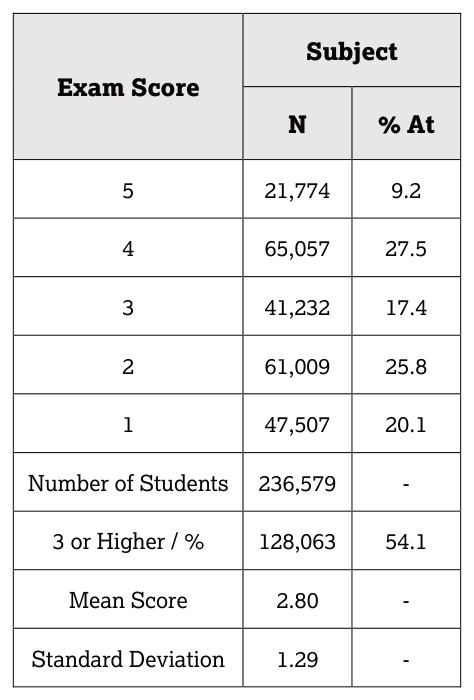
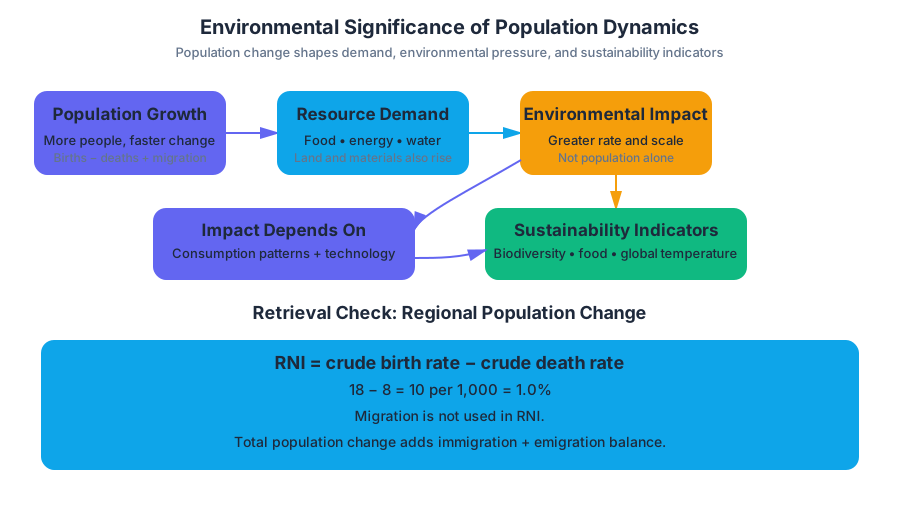
3.9 Demographic Transition
The demographic transition is the long-term shift from high birth and death rates to low birth and death rates as a society industrializes and gains access to improved sanitation, medicine, education, and economic opportunities.
3.9 Demographic Transition
The demographic transition is the long-term shift from high birth and death rates to low birth and death rates as a society industrializes and gains access to improved sanitation, medicine, education, and economic opportunities.
Imagine a country as a population “engine.” At first, the engine adds many people through high birth rates, but disease, famine, and poor sanitation remove many through high death rates. As living conditions improve, deaths decline before births do, producing rapid population growth; later, births also decline, and growth slows.
The four-stage model
The demographic transition model is a conceptual model, not a prediction that every country follows an identical path. It connects changes in crude birth rate (births per $1{,}000$ people per year), crude death rate (deaths per $1{,}000$ people per year), and natural increase rate (population change from births and deaths, excluding migration).
| Stage | Birth rate | Death rate | Population pattern | Typical conditions |
|---|---|---|---|---|
| 1. Preindustrial | High | High and variable | Slow growth or stability | Limited sanitation, frequent disease, high infant mortality |
| 2. Transitional | Remains high at first | Drops rapidly | Rapid growth | Improved food supply, sanitation, clean water, and medicine |
| 3. Industrial | Declines | Low | Growth slows | Urbanization, education, contraception, and increased cost of raising children |
| 4. Postindustrial | Low | Low | Stable or declining | High life expectancy, low fertility, and an older population |
In Stage 1, high mortality offsets high fertility. A population may remain nearly stable even when families have many children because many individuals die young. In Stage 2, mortality falls first, often because clean water, sewage treatment, vaccination, nutrition, and medical care improve; birth rates may remain high because cultural expectations and family decisions change more slowly.
During Stage 3, birth rates fall as families gain access to contraception and as women’s education, employment, and economic independence increase. Urban families may also choose fewer children because children are less economically necessary and housing, schooling, and health care are costly. In Stage 4, both rates are low, so a population can stabilize or decline if deaths exceed births.
Worked example: finding natural increase
Suppose a Stage 2 country records a crude birth rate of $35$ births per $1{,}000$ people and a crude death rate of $10$ deaths per $1{,}000$ people. Its natural increase is the difference between the two rates, but the denominator must remain $1{,}000$ because both original values are reported per $1{,}000$ people.
$$ \text{Natural increase rate}
\frac{35-10}{1{,}000}
\frac{25}{1{,}000}
0.025
2.5% $$
The population is therefore increasing naturally by $2.5%$ per year, before considering immigration or emigration. This is rapid growth: even if the birth rate later begins to decline, population momentum may continue because a large younger generation is entering reproductive age.
Key insight: In the demographic transition, death rates usually decline before birth rates. That gap is what creates the fastest population growth.
Applying the model to evidence
A graph showing a sharply declining death rate while the birth rate remains high indicates Stage 2, not Stage 3. A graph showing both rates low, with the birth rate below the death rate, suggests Stage 4 and possible natural decrease. Migration can alter total population size, but it does not change the natural increase rate itself.
Science Practice 1: Concept Application, Skill 1.C — Apply environmental concepts, processes, and models is the designated skill pairing for Topic 3.9 Demographic Transition. On an exam, applying this skill means using the model to interpret a graph, classify a country’s stage, predict a population trend, or connect a demographic change to environmental pressures such as resource demand, urban expansion, or waste production.
Misconception check
Misconception: “Every country must pass through the stages at the same speed.” The model describes a common pattern, but countries can move unevenly because of government policies, conflict, migration, access to health care, cultural practices, and economic conditions. A country may also have regions at different stages at the same time.
Misconception: “A low birth rate immediately means the population gets smaller.” Population size depends on both births and deaths, and population momentum can keep a population growing after fertility declines. A population begins natural decrease only when the death rate exceeds the birth rate; migration can then increase or decrease total population independently.
Retrieval check
A country’s birth rate is $14$ per $1{,}000$ and its death rate is $9$ per $1{,}000$. Calculate its natural increase rate and identify the most likely demographic-transition pattern.
$$ \frac{14-9}{1{,}000}
\frac{5}{1{,}000}
0.005
0.5% $$
A positive rate of $0.5%$ indicates natural growth, but slower growth than the worked Stage 2 example. If both rates are relatively low, the country is most consistent with Stage 3, where mortality is already low and fertility has begun to decline.
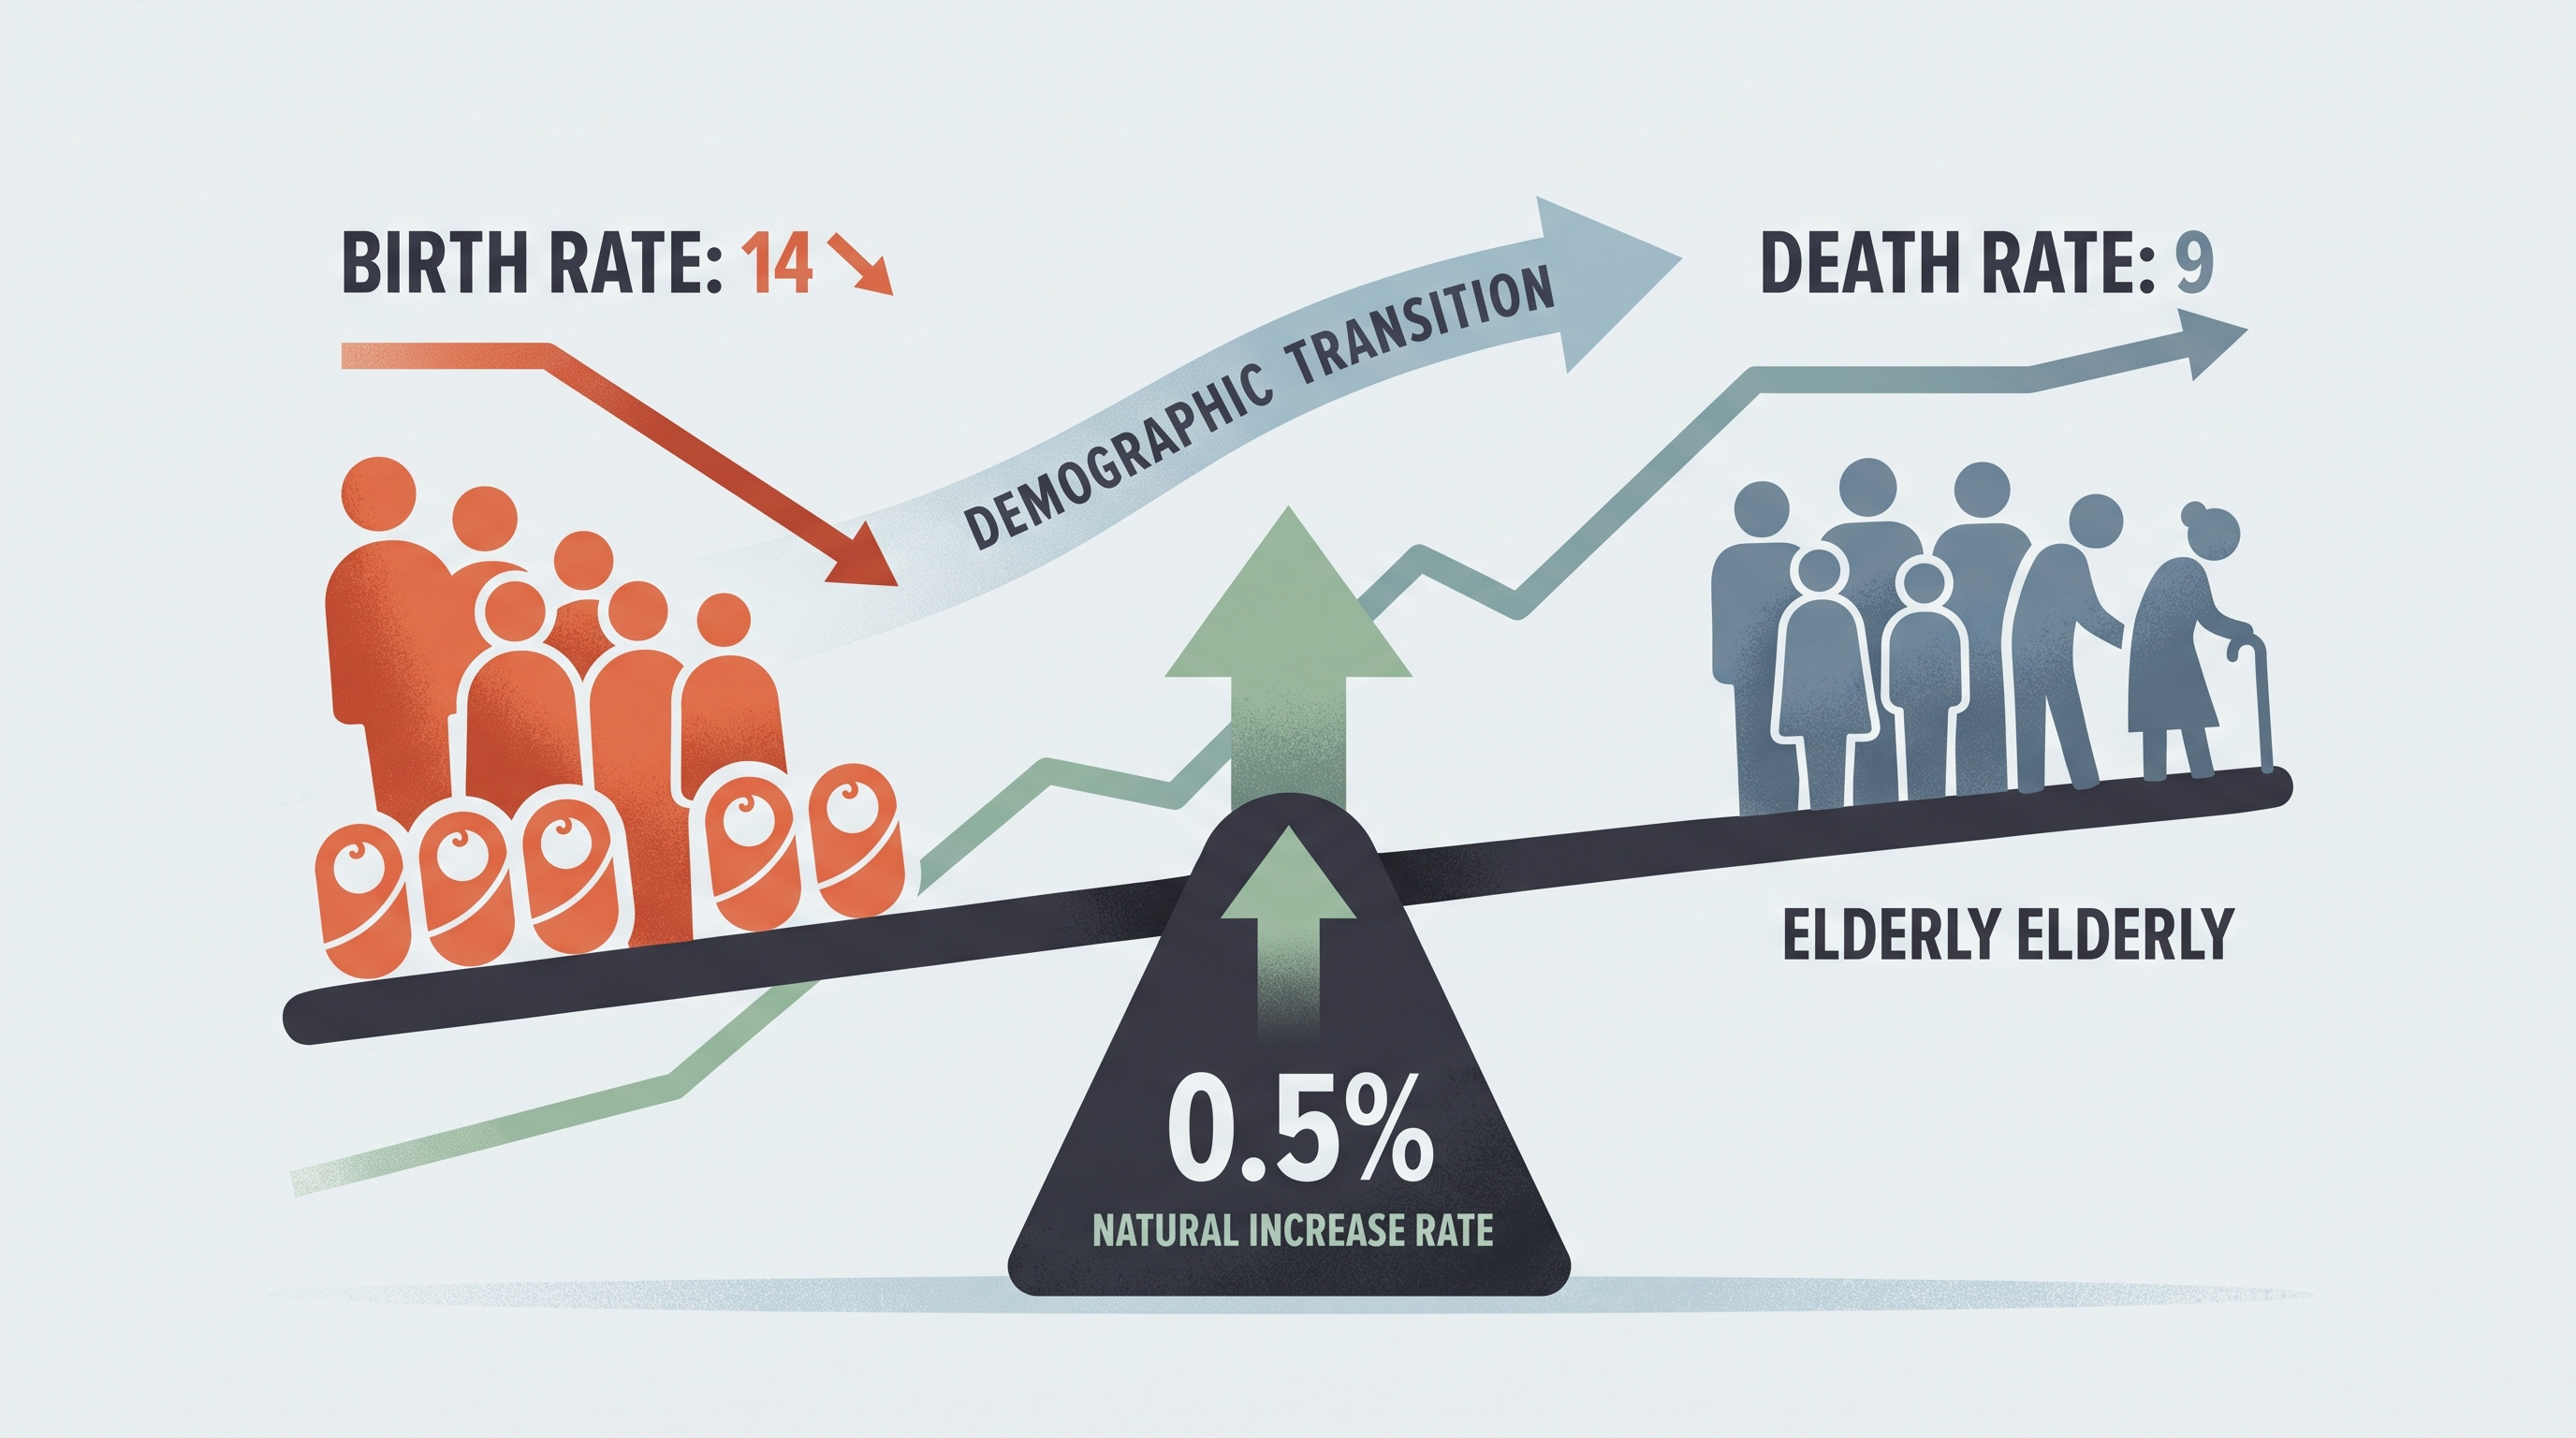
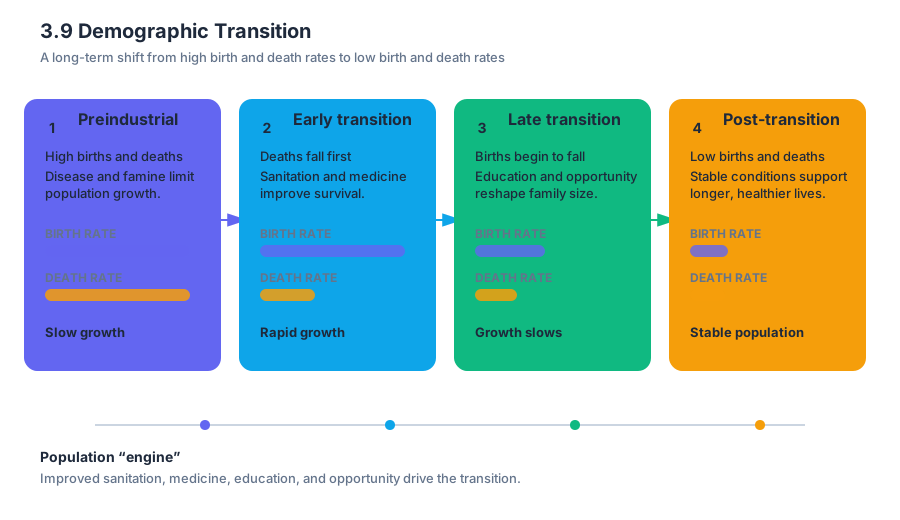
4.1 Plate Tectonics · 4.2 Soil Formation and Erosion
Key concepts: Plate tectonics · Global distribution of plate boundaries · Convergent, divergent, and transform plate boundaries · Using figures and maps to identify plate boundaries · Environmental issues related to plate boundaries · Soil formation during primary succession · Soil erosion · Effects of forested versus clear-cut areas · Land-use change and grazing · Cultural ecosystem services provided by mature forests
Plate tectonics describes the movement of rigid pieces of Earth’s lithosphere over the softer asthenosphere beneath them. That slow motion reshapes landscapes, creates hazards, and can even influence where ecosystems develop: the Serengeti National Park, for example, lies above a divergent plate boundary, where…
4.1 Plate Tectonics · 4.2 Soil Formation and Erosion
Plate tectonics describes the movement of rigid pieces of Earth’s lithosphere over the softer asthenosphere beneath them. That slow motion reshapes landscapes, creates hazards, and can even influence where ecosystems develop: the Serengeti National Park, for example, lies above a divergent plate boundary, where plates move apart.
Plate boundaries: three motions, three landscape patterns
A plate boundary is the zone where two tectonic plates interact. The direction of motion determines the boundary type and provides the fastest way to interpret a map or diagram.
| Boundary type | Relative plate motion | Common geological result | Environmental connection |
|---|---|---|---|
| Divergent | Plates move apart | Rift valleys, new crust, volcanic activity, earthquakes | Creates basins, elevated terrain, and changing drainage patterns |
| Convergent | Plates move toward one another | Subduction zones, trenches, volcanoes, mountains, powerful earthquakes | Produces volcanic soils, landslides, tsunamis, and altered habitats |
| Transform | Plates slide horizontally past one another | Frequent shallow earthquakes along faults | Causes sudden landscape disturbance and damage to infrastructure |
At a divergent boundary, rising magma fills the gap as crust separates. On continents, this process can form a rift valley; beneath oceans, it produces new seafloor. At a convergent boundary, one oceanic plate may be forced beneath another plate in subduction, or two continental plates may collide and build mountains. At a transform boundary, crust is neither created nor destroyed overall, but friction can cause earthquakes when plates suddenly slip.
Reading a plate-boundary map
Use the arrows, not the landscape name, as the primary evidence. Arrows pointing away from a line indicate a divergent boundary; arrows pointing toward one another indicate convergence; arrows moving parallel to the line in opposite directions indicate a transform boundary.
Worked interpretation — Serengeti National Park: A figure shows a long continental rift through East Africa. If the arrows on opposite sides point away from the rift, the boundary is divergent. The correct conclusion is not merely “there are volcanoes,” because volcanoes can occur at more than one boundary type; the decisive evidence is that the plates are separating.
Misconception check — “Every earthquake marks a convergent boundary.” Earthquakes occur at all three boundary types. Transform boundaries commonly produce shallow earthquakes from sideways fault motion, while convergent boundaries can produce earthquakes associated with subduction and collisions.
From tectonic motion to environmental problems
The AP skill ERT-4.A.5 asks you to explain how environmental events represented visually relate to broader environmental issues. A diagram of a rift is therefore not just a geology question: it can be connected to volcanic hazards, earthquake risk, habitat disruption, soil development, groundwater movement, and human settlement.
For example, a volcanic event may destroy existing vegetation but later add mineral-rich parent material. An earthquake may alter stream channels or trigger landslides, while a tsunami generated near a convergent boundary can transport sediment and pollutants far inland. The environmental effect depends on both the tectonic event and the vulnerability of the surrounding ecosystem or human community.
Soil begins with parent material
ERT-4.B.1: Soils are formed when parent material is weathered, transported, and deposited. Parent material may be bedrock, volcanic material, glacial sediment, or sediment moved by water, wind, or gravity.
Key idea: Soil is not simply “dirt.” It is a developing layer produced by the interaction of mineral material, organisms, water, air, and time.
Physical weathering breaks rock into smaller pieces without changing its chemical identity. Chemical weathering changes minerals through reactions with water, acids, or oxygen. Once material is loosened, erosion transports it; deposition places it somewhere new, where organisms and decomposing matter can help build soil.
Soil formation during primary succession
Primary succession begins on a surface without preexisting soil, such as newly exposed rock. Pioneer species—often lichens and certain microorganisms—colonize the surface. Lichens chemically and physically break down rock; when they die, their organic remains mix with mineral fragments, creating the first thin layer of soil.
As soil depth and water-holding capacity increase, grasses and small plants can establish. Their roots further weather the substrate, and their dead material adds organic matter. Later, shrubs and trees may form a mature forest, although the final community depends on climate, disturbance, and available species.
Misconception check — “Primary succession starts with grasses.” It starts before grasses can grow. Without soil, pioneer organisms must first contribute to weathering and organic-matter accumulation.
Vegetation, erosion, and experimental evidence
Vegetation is an environmental protection system. Roots hold soil particles in place, stems slow surface runoff, and leaf litter cushions raindrop impacts. Maintaining vegetation therefore reduces soil erosion, preserves soil fertility, decreases sediment entering streams, and helps maintain clearer aquatic habitat.
A sound experiment comparing a forested area with a clear-cut area could use land-cover treatment as the independent variable and measure a dependent variable such as mass of eroded sediment, runoff volume, or stream turbidity. Replicated plots with similar slope, soil, rainfall exposure, and area would improve validity; untreated or forested plots could serve as a control condition.
Worked design: Place identical sediment traps below several forested plots and several clear-cut plots. After the same storm, dry and weigh the collected sediment. If clear-cut plots produce more sediment, the evidence supports the hypothesis that removing vegetation increases erosion. A strong response identifies the variables and explains the mechanism—not merely that “clear-cutting is harmful.”
Interpreting land-use change and ecosystem services
When a graph shows land-use changes and grazing from $1700$ to $1950$, first identify the direction and timing of each trend. An increase in grazing or conversion of forest to pasture indicates greater vegetation removal and greater potential for soil exposure; if erosion rises afterward, the pattern supports—but by itself does not prove—a causal relationship.
A mature forest can provide a cultural ecosystem service, such as recreation, spiritual value, aesthetic enjoyment, education, or cultural identity. This differs from regulating services such as erosion control and water purification: cultural services are nonmaterial benefits people receive from ecosystems.
Retrieval check
A map shows plates moving away from a central continental valley, followed by a photograph of bare rock colonized by lichens. Identify the boundary type and explain the first step in soil formation. Answer: The boundary is divergent because the plates separate. Lichens weather the rock and add organic matter when they die, beginning soil formation during primary succession.
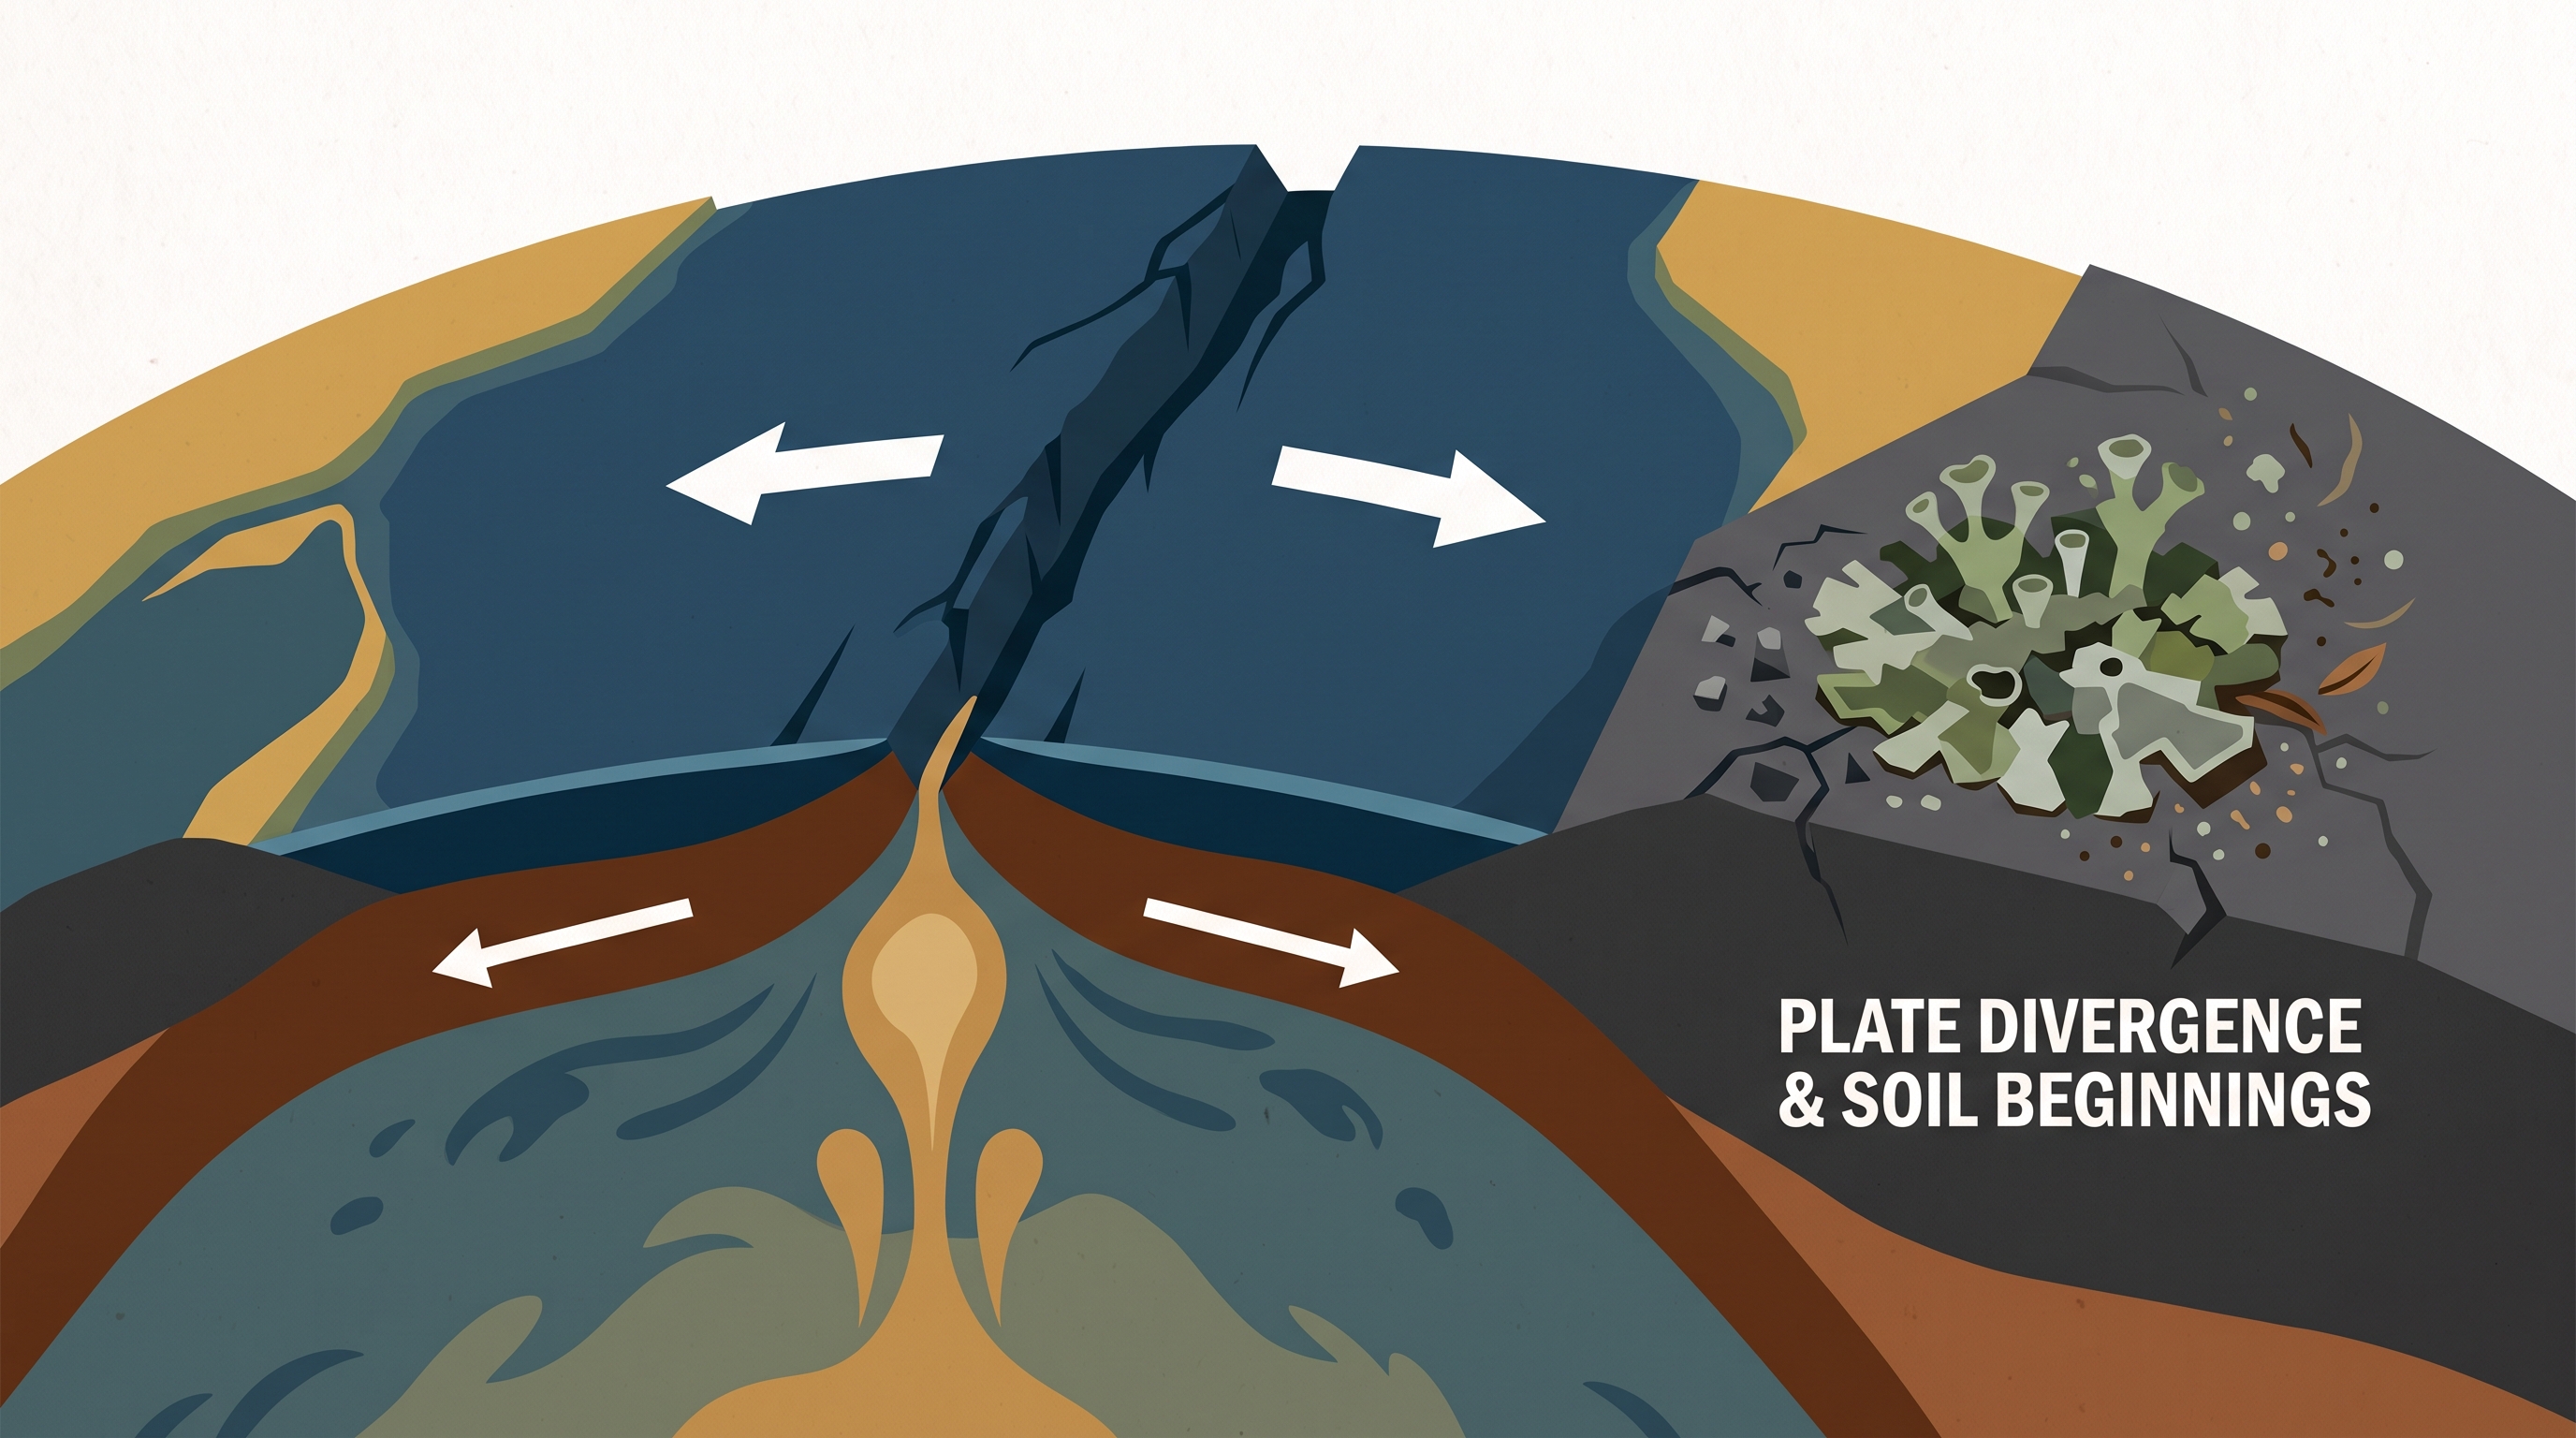
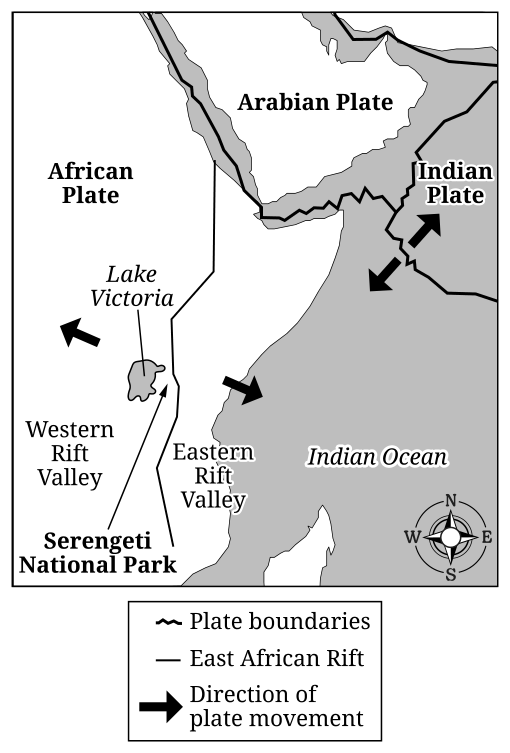
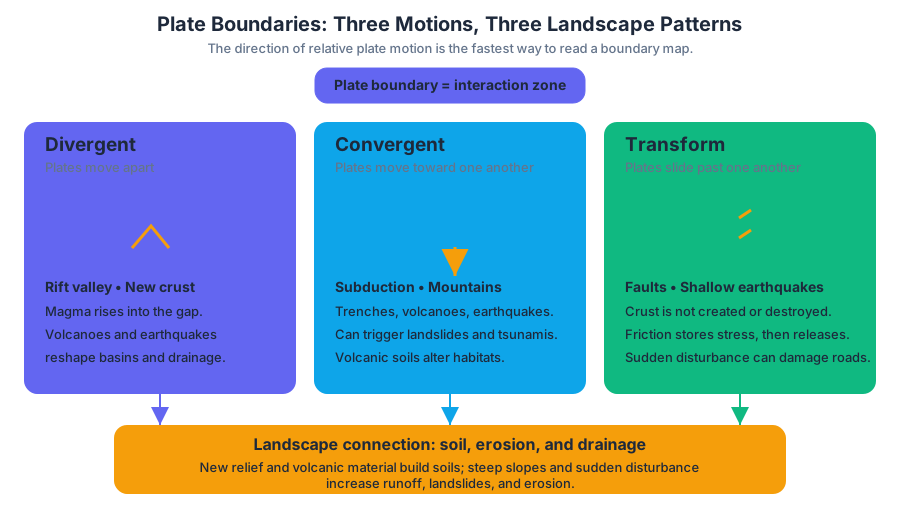
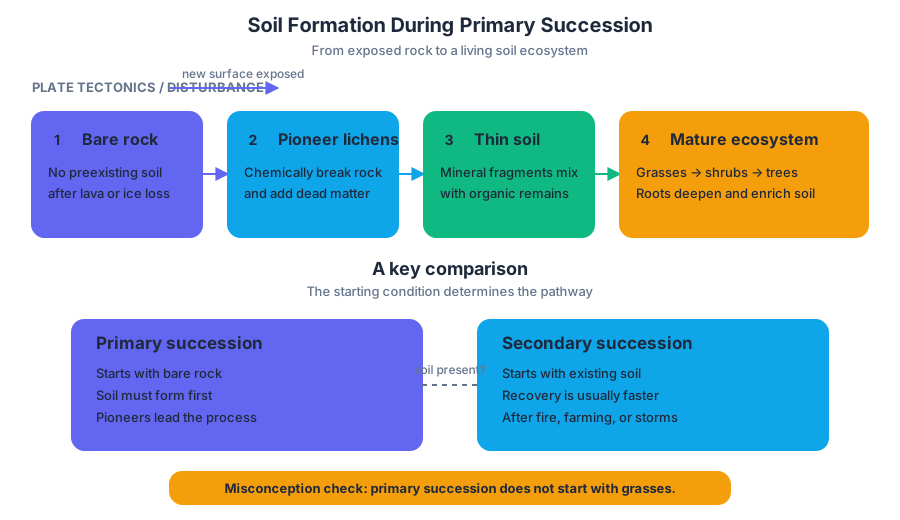
4.3 Soil Composition and Properties · 4.4 Earth’s Atmosphere
Key concepts: Soil horizons · Soil porosity, permeability, and fertility · Soil texture and composition · Clay, silt, and sand percentages · Loam · Chemical, physical, and biological soil testing methods · Atmospheric layers and temperature gradients · Thermal inversions · Scientific research methods and experimental variables · Interactions among Earth’s systems and balance over time
A handful of soil is a miniature water-management system: its particles determine how much water enters, how much remains available to plants, and how easily nutrients move.
4.3 Soil Composition and Properties · 4.4 Earth’s Atmosphere
A handful of soil is a miniature water-management system: its particles determine how much water enters, how much remains available to plants, and how easily nutrients move. Above that soil, Earth’s atmosphere is organized into layers whose temperature patterns control mixing, weather, and pollution.
Soil horizons: a vertical system
A soil horizon is a recognizable horizontal layer with its own material and properties. The particle size and composition of each horizon can change porosity—the fraction of pore space—and permeability—how readily water moves through connected pores. Together with nutrient content and water retention, these properties influence soil fertility.
A simplified soil profile can be read as a sequence from biologically active surface material toward partially weathered parent material:
| Horizon | Typical composition and role | Likely environmental effect |
|---|---|---|
| $O$ | Organic litter and decomposing material | Adds nutrients and improves water retention |
| $A$ | Mineral particles mixed with humus and organisms | Often supports roots; moderate fertility and infiltration |
| $E$ | A leached layer where water removes some clay, minerals, or organic matter | May have reduced fertility |
| $B$ | Material accumulated from upper layers, often including clay or minerals | Can hold water but may slow drainage |
| $C$ | Partially weathered parent material | Fewer organisms and less developed soil structure |
| $R$ | Consolidated bedrock | Very low porosity and permeability unless fractured |
These horizons do not behave identically. A clay-rich $B$ horizon may contain many very small pores and therefore retain water, but those pores may connect poorly, slowing infiltration. An organic-rich $O$ or $A$ horizon can increase fertility by storing nutrients and supporting decomposers.
Texture, water holding capacity, and fertility
Soil texture describes the relative percentages of sand, silt, and clay. Sand has the largest particles and usually creates larger pores, so water moves through it rapidly. Clay has the smallest particles, creating extensive surface area and high water retention, but often slower permeability. Silt has intermediate particle size and behavior.
A soil texture triangle classifies soil from its percentages of clay, silt, and sand. The three percentages must total $100%$. Loam is a blend of all three particle sizes that commonly balances drainage, water holding capacity, aeration, and nutrient retention; that balance allows it to support a variety of crops.
ERT-4.C.1: Water holding capacity—the total amount of water soil can hold—varies with different soil types. Water retention contributes to land productivity and fertility of soils.
Worked example: Suppose a field soil contains $40%$ sand, $40%$ silt, and $20%$ clay. The percentages sum to $100%$, so the sample can be located on a texture triangle. Compared with a nearly pure sand, it should retain more water; compared with a soil containing much more clay, it should generally allow faster drainage. Its suitability for crops depends not only on texture but also on organic matter, nutrients, and compaction.
Misconception check: High water-holding capacity does not automatically mean high fertility. A soil may retain water yet lack usable nutrients, oxygen, or suitable drainage.
Testing soil properties
Soil testing supports decisions such as irrigation and fertilizer requirements. Chemical methods measure properties such as nutrient availability or acidity; physical methods examine texture, water retention, compaction, infiltration, or drainage; biological methods examine living organisms or biological activity in the soil.
For an investigation, identify the research method, design, measurements, and variables before collecting data. For example, place equal soil masses in containers with either bare soil or vegetation covering. Add the same volume of water to each container and measure runoff amount and appearance. The independent variable is the covering treatment; runoff volume or turbidity is a dependent measurement.
If vegetation reduces runoff, the mechanism is increased interception by leaves and greater infiltration through roots and soil pores. A controlled comparison must keep soil type, container size, water volume, and slope consistent so that vegetation—not an uncontrolled difference—explains the result.
Earth’s atmospheric layers
Earth’s atmosphere is divided into the troposphere, stratosphere, mesosphere, thermosphere, and exosphere. These layers are identified primarily by changes in the temperature gradient with altitude, not simply by their distance from Earth’s surface.
The troposphere is the lowest layer and contains most atmospheric mass and nearly all weather. Temperature generally decreases with altitude. Above it, the stratosphere has a temperature pattern that generally increases with altitude because ozone absorbs ultraviolet radiation. The mesosphere again generally cools upward, while the thermosphere warms upward as sparse gases absorb high-energy radiation. The exosphere gradually merges with outer space.
Thermal inversions and system balance
A thermal inversion occurs when the normal atmospheric temperature gradient is altered or reversed, so relatively warm air lies above cooler air near the surface. The cooler, denser air cannot rise easily through the warmer layer, reducing vertical mixing and allowing pollutants to accumulate near the ground.
This illustrates ERT-4, the enduring understanding that Earth’s systems interact and can result in a state of balance over time: soil, vegetation, water, and air exchange matter and energy. A change in vegetation can alter infiltration and runoff; atmospheric stability can then influence how pollutants remain concentrated or disperse.
Skill connection — Scientific Experiments: The soil investigation applies ERT-4.C: describe similarities and differences between properties of different soil types. It also uses ERT-4.C.1, ERT-4.C.2, ERT-4.C.3, and ERT-4.C.4 by linking water holding capacity, horizon composition, testing methods, and texture classification to measurable outcomes.
Retrieval check: A soil sample is $70%$ sand, $20%$ silt, and $10%$ clay. Predict whether its permeability and water holding capacity are closer to those of a sandy soil or a clay-rich soil, and justify both predictions using particle size and pore structure. Then explain why a thermal inversion can increase surface-level air pollution without adding any new pollutant.
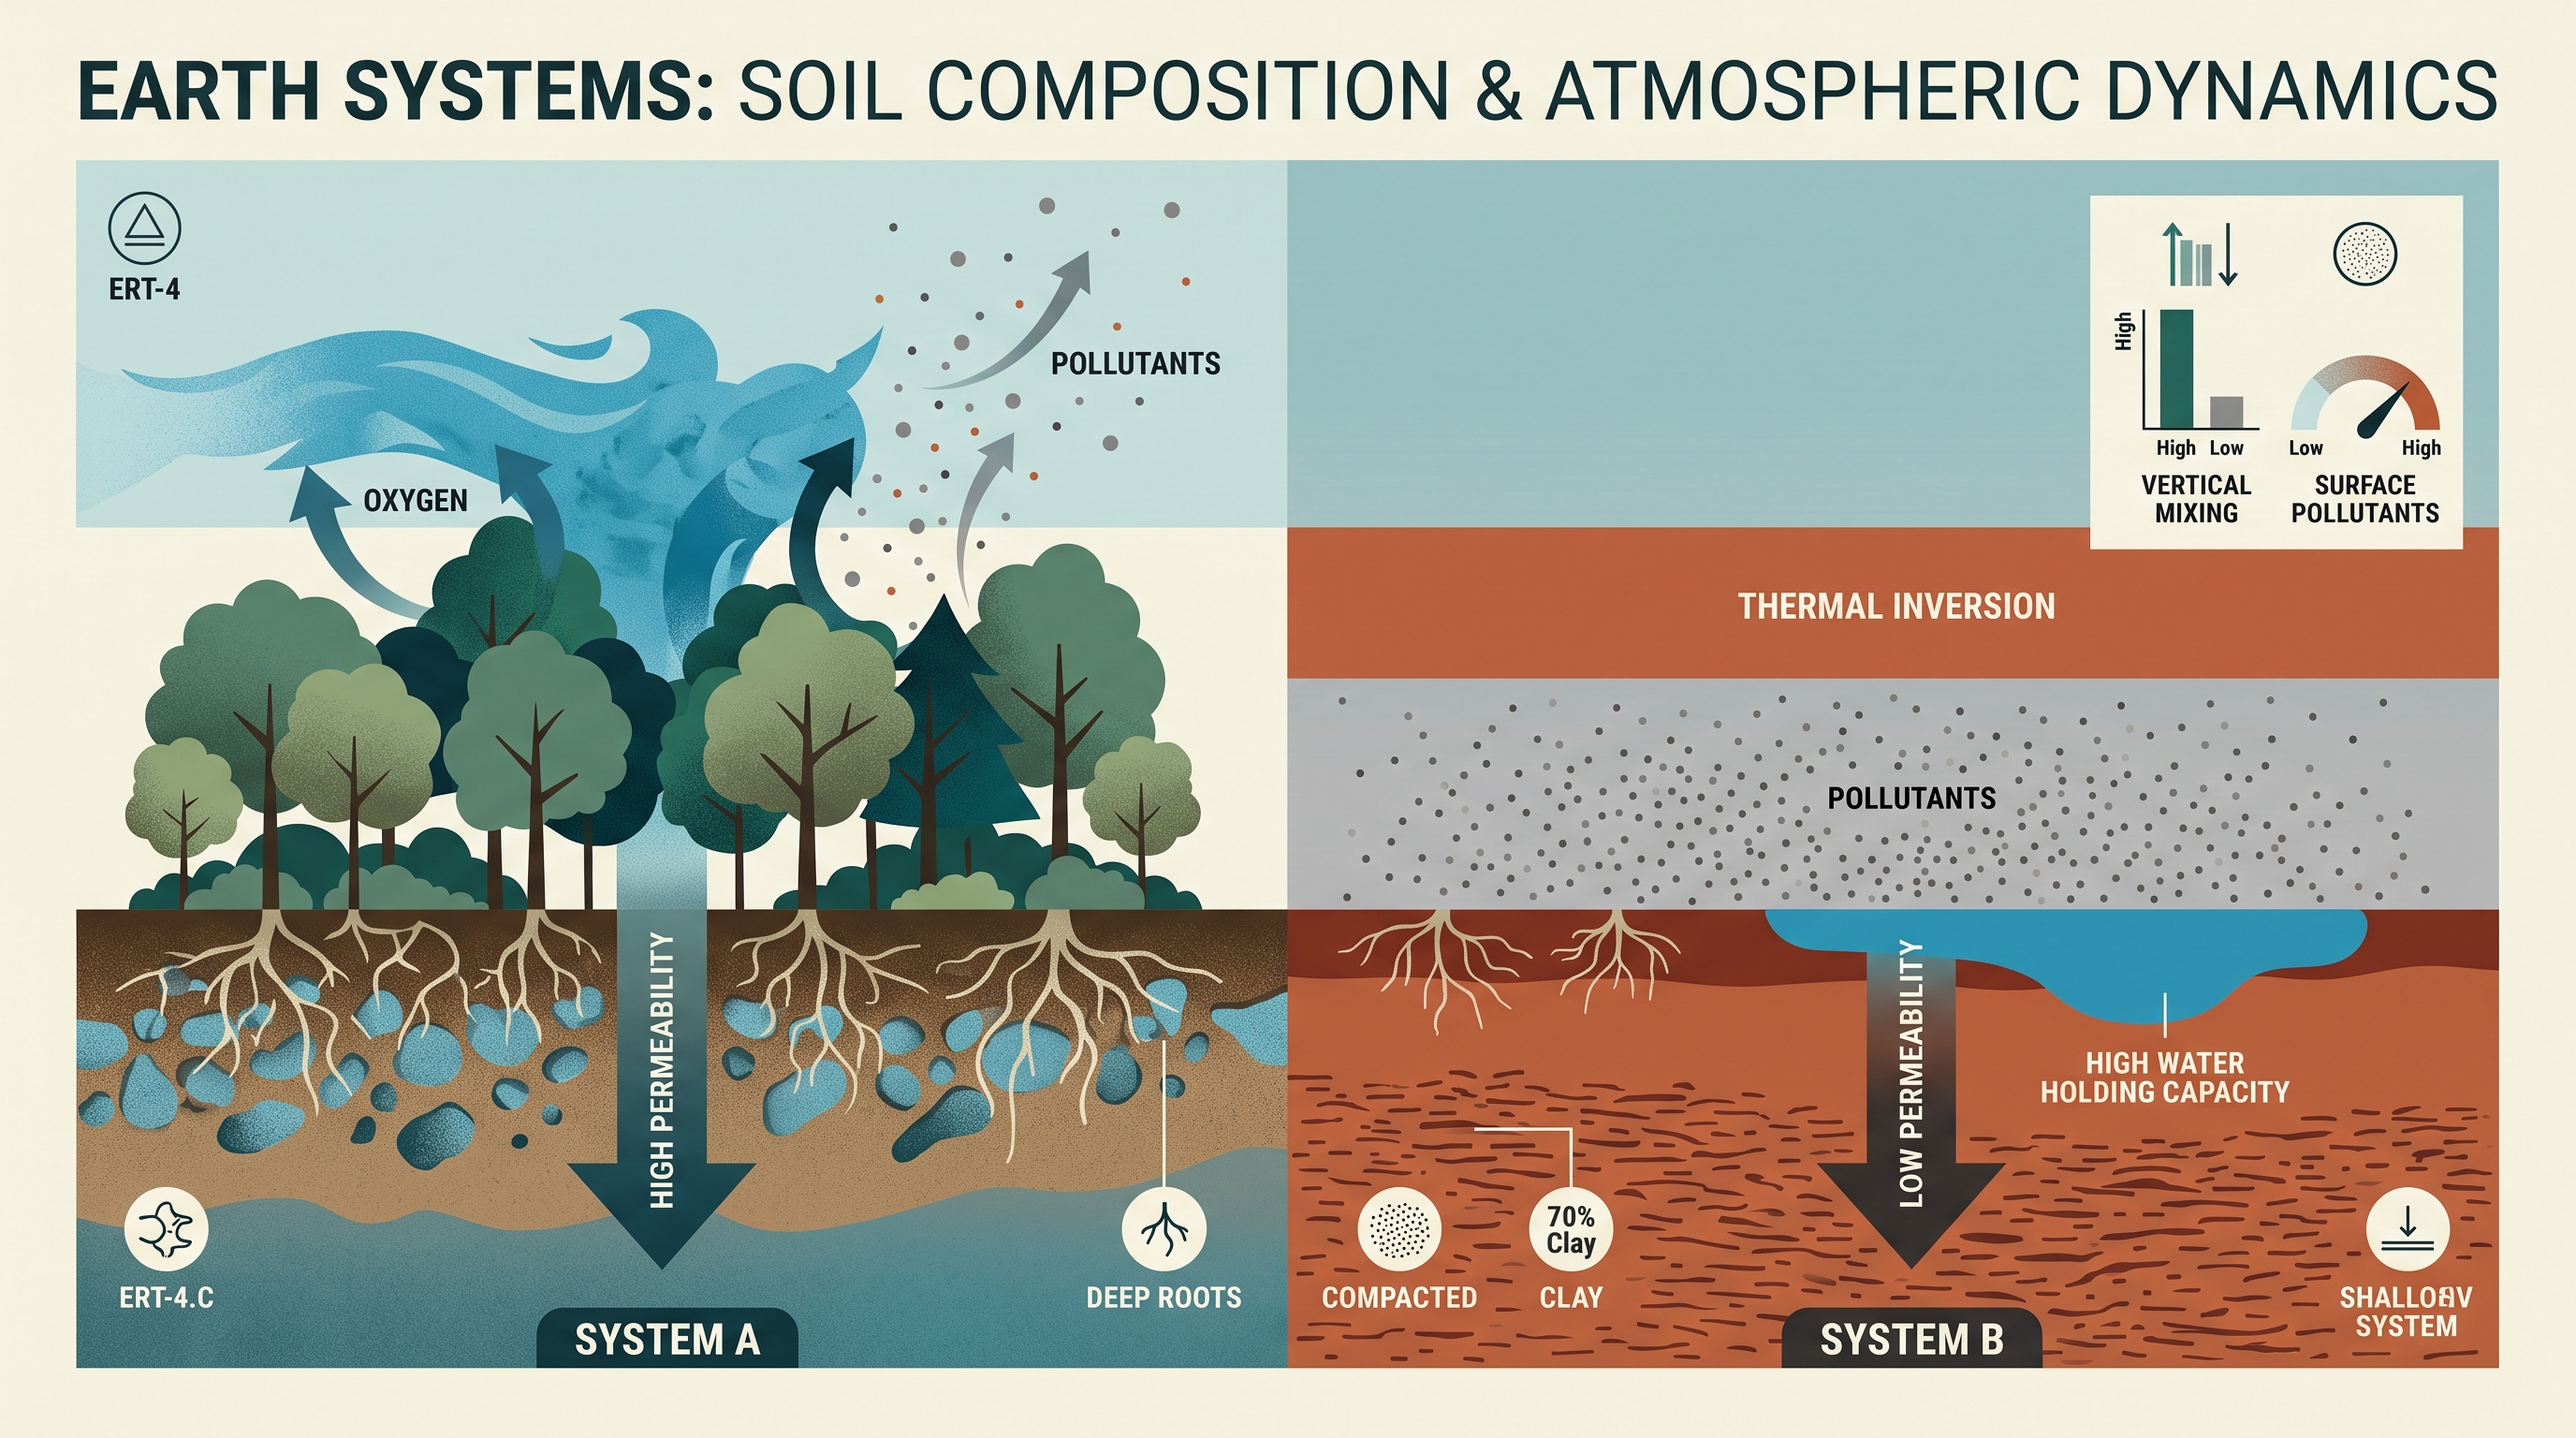
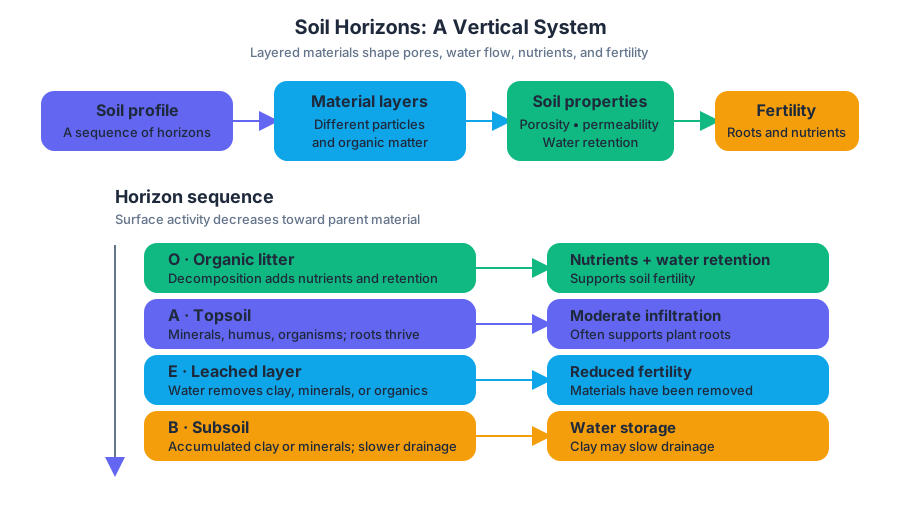
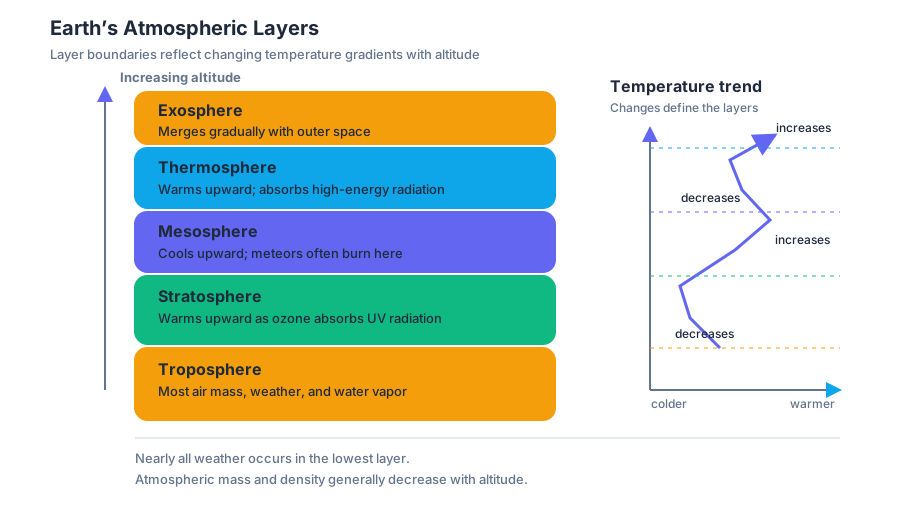
4.5 Global Wind Patterns · 4.6 Watersheds
Key concepts: Global wind patterns · Atmospheric circulation · Solar radiation · Density differences · Coriolis effect · Earth system interactions · Environmental factors · Rainfall patterns · Wind patterns · Earth system balance
Global wind patterns begin with an unevenly heated planet: the equator receives the most intense solar radiation, so air there warms, expands, and becomes less dense than surrounding air.
4.5 Global Wind Patterns · 4.6 Watersheds
Global wind patterns begin with an unevenly heated planet: the equator receives the most intense solar radiation, so air there warms, expands, and becomes less dense than surrounding air. That density contrast drives atmospheric circulation, while Earth’s rotation bends moving air through the Coriolis effect.
4.5 Global Wind Patterns
Atmospheric circulation is the large-scale movement of air caused primarily by unequal heating. Warm, less-dense air rises; cooler, denser air sinks. As air moves from regions of higher pressure toward regions of lower pressure, it produces wind.
ERT-4.E.1: Global wind patterns primarily result from the most intense solar radiation arriving at the equator, resulting in density differences and the Coriolis effect.
The causal chain is more important than memorizing isolated wind names:
The Coriolis effect is the apparent deflection of moving air caused by Earth’s rotation. Moving air bends to the right in the Northern Hemisphere and to the left in the Southern Hemisphere. The effect changes the direction of winds, but it does not provide the original energy that moves the air; solar radiation supplies that energy.
Misconception check — “The Coriolis effect makes air move.” It does not. Unequal solar heating creates density and pressure differences; the Coriolis effect then modifies the path of moving air. Winds near the equator are affected less strongly because rotational deflection is weakest there.
A worked atmospheric example
Imagine a broad equatorial region receiving stronger solar heating than nearby regions. The heated air expands and rises, leaving relatively lower pressure near the surface. Cooler, denser air from surrounding areas moves toward that low-pressure region; Earth’s rotation deflects the moving air, producing a curved global wind pattern rather than a perfectly straight flow.
If an environmental change alters heating, ocean temperature, or atmospheric pressure, the circulation pattern can shift. Because air movement influences the transport of moisture, environmental factors can produce global changes in rainfall and wind, with one region becoming wetter while another becomes drier.
ERT-4.E: Explain how environmental factors can result in atmospheric circulation.
Suggested Skill 2.B — Visual Representations: Explain relationships between different characteristics of environmental concepts, processes, or models represented visually, in theoretical and applied contexts.
On an exam, a strong visual explanation should identify the direction of movement, connect that movement to density or pressure differences, and then explain how the Coriolis effect changes the path. Naming a circulation cell or wind belt without explaining those relationships is incomplete.
4.6 Watersheds
A watershed is an area of land that drains water to a common outlet, such as a stream, lake, estuary, or ocean. Ridges and other high points form watershed boundaries; rainfall on opposite sides of a ridge may enter entirely different drainage systems.
ERT-4.F.1: A watershed is an area of land that drains to a common body of water.
Water moves through a watershed as precipitation, surface runoff, infiltration into soil, groundwater flow, and stream discharge. These pathways connect the atmosphere, geosphere, hydrosphere, and biosphere: rainfall becomes runoff, soil stores and filters some water, plants intercept and use water, and streams transport dissolved materials and sediments.
Worked watershed example
A town replaces a forested slope with roads, parking lots, and rooftops. During a storm, less water infiltrates into the ground and more water reaches the stream rapidly as surface runoff. The likely results are a higher peak stream discharge, increased erosion, greater transport of pollutants, and a higher risk of downstream flooding.
The watershed-scale solution is not merely to remove water faster. Vegetated areas, riparian buffers, wetlands, and permeable surfaces can slow runoff, encourage infiltration, trap sediment, and reduce the amount of polluted water entering the stream.
Misconception check — “A watershed is only the visible river.” The river is the channel receiving water; the watershed includes the entire surrounding land that supplies that water. A pollutant applied far uphill can affect a downstream water body because all connected drainage pathways belong to the same system.
Systems in balance
These topics show why Earth’s systems cannot be studied as isolated compartments. Solar energy drives atmospheric motion; atmospheric motion redistributes heat and moisture; rainfall enters watersheds; and watershed conditions influence ecosystems and human communities.
ERT-4 — Earth’s systems interact, resulting in a state of balance over time.
“Balance” does not mean that conditions remain perfectly constant. It means that interacting processes tend toward dynamic equilibrium: increased runoff may be followed by stream discharge, infiltration, evaporation, or storage, while altered heating can reorganize wind and rainfall patterns. A disturbance can therefore produce effects far from its original location.
Retrieval check
A diagram shows warmer, rising air over one region and cooler, sinking air over another. Identify the immediate driver of circulation, state the role of the Coriolis effect, and predict one watershed consequence if the resulting circulation increases rainfall over an urban basin.
Answer: Unequal heating creates density and pressure differences that drive air movement; the Coriolis effect deflects the moving air; increased rainfall over the urban basin can increase runoff, stream discharge, erosion, and flooding, especially where impervious surfaces limit infiltration.
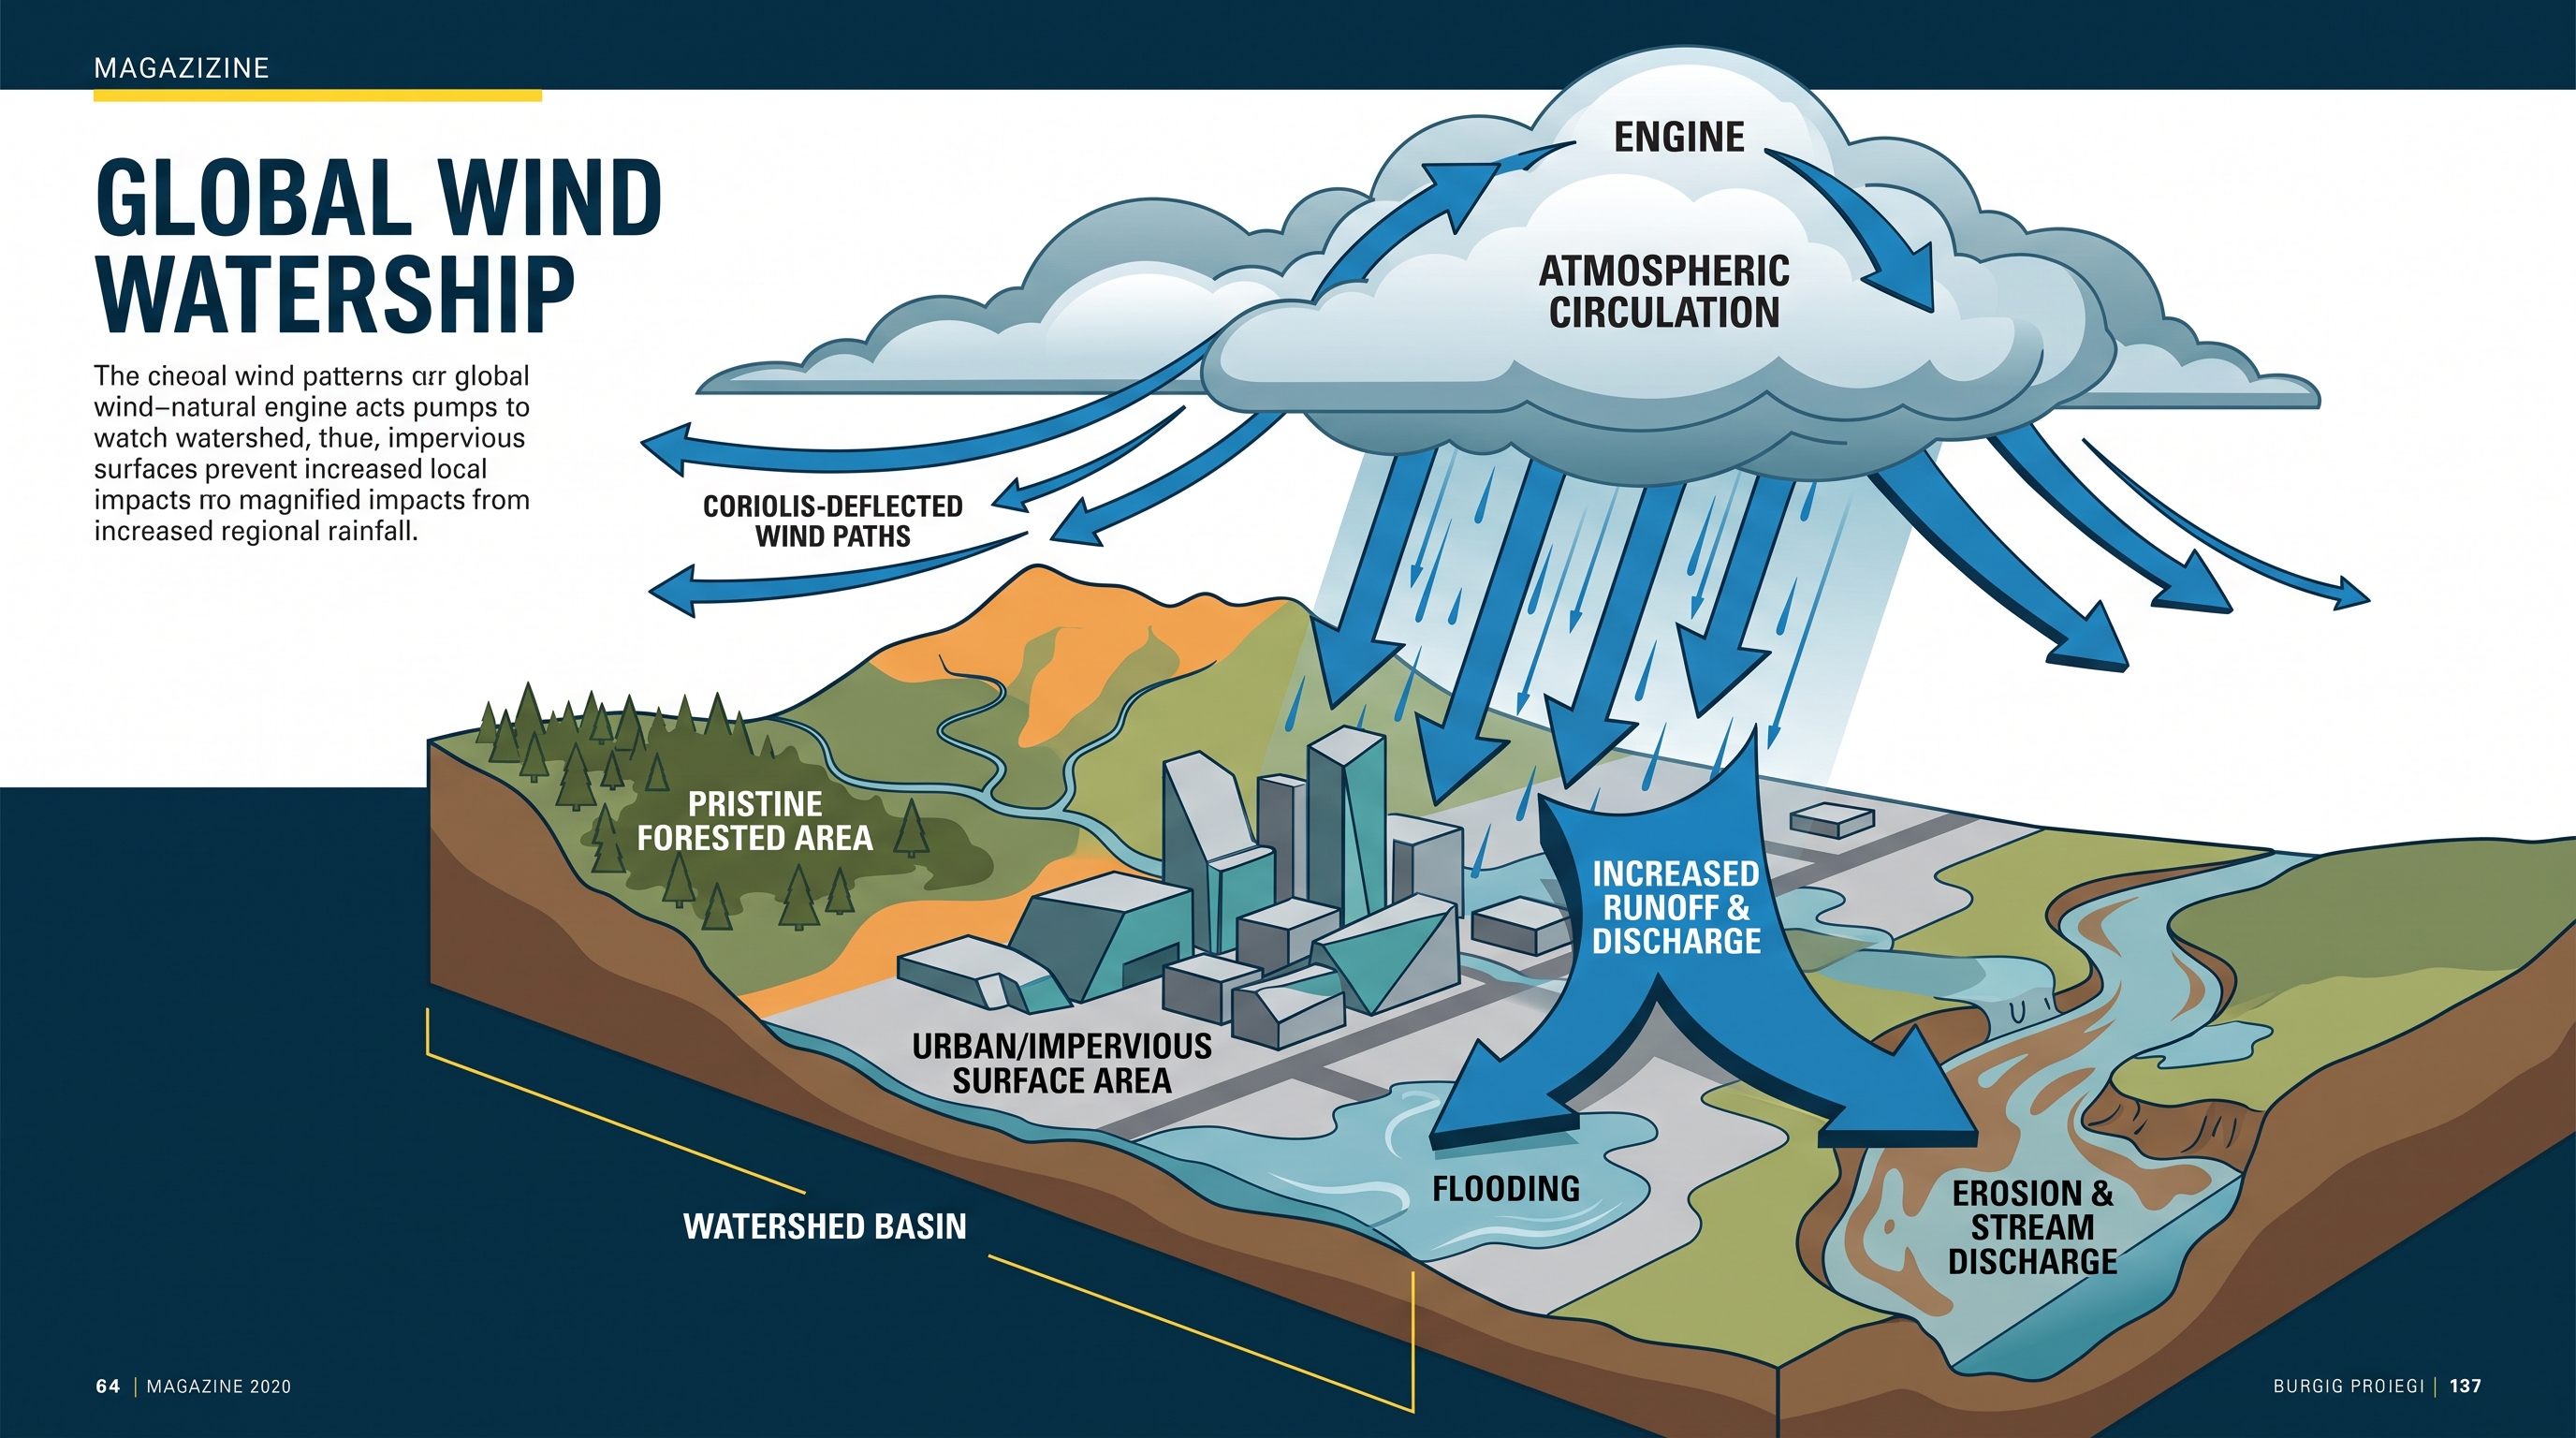
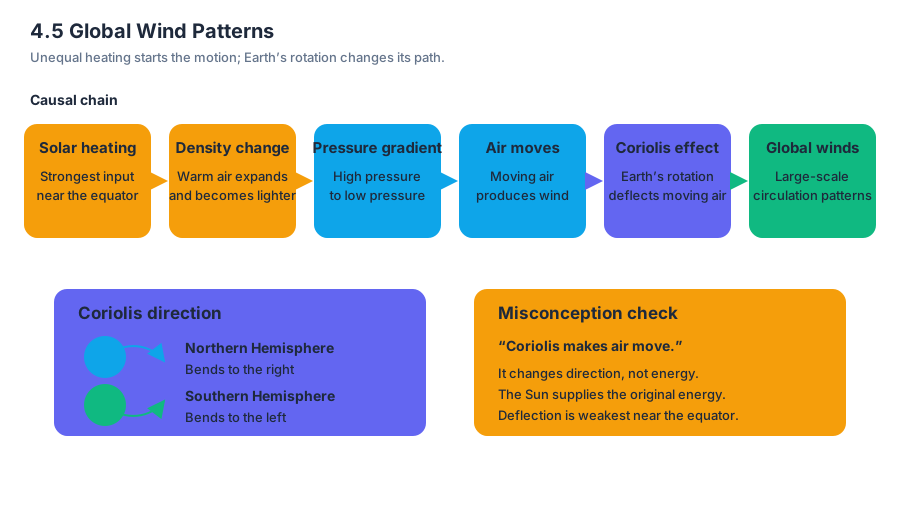
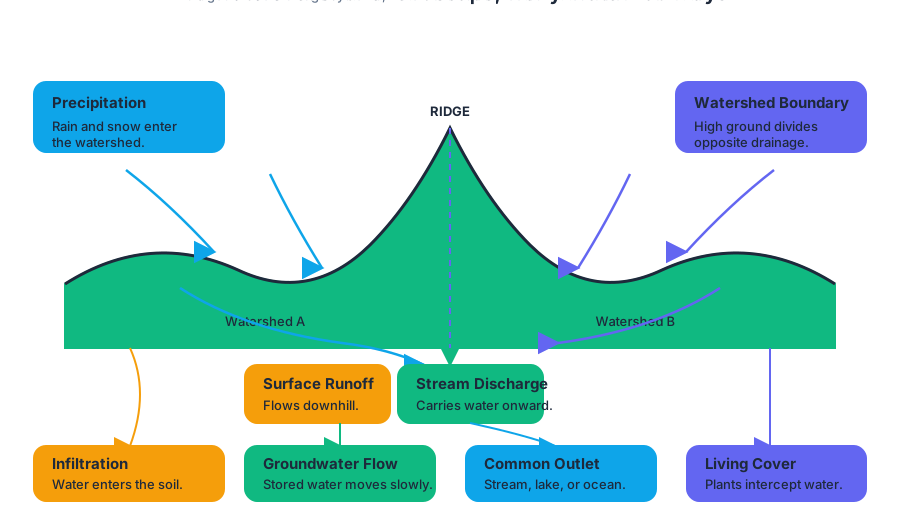
4.7 Solar Radiation and Earth’s Seasons · 4.8 Earth’s Geography and Climate
Key concepts: Incoming solar radiation (insolation) · Relationship between solar radiation, season, and latitude · Solar-ray angle and radiation intensity · Earth’s axial tilt and seasons · Earth’s geography · Weather and climate · Geologic factors affecting weather and climate · Geographic factors affecting weather and climate · Atmospheric circulation · Global wind patterns and equatorial solar radiation
Earth’s surface is heated unevenly because sunlight arrives at different angles, for different lengths of time, at different latitudes and seasons. That uneven heating drives temperature differences, while Earth’s landforms and geographic position reshape the resulting weather and climate.
4.7 Solar Radiation and Earth’s Seasons · 4.8 Earth’s Geography and Climate
Earth’s surface is heated unevenly because sunlight arrives at different angles, for different lengths of time, at different latitudes and seasons. That uneven heating drives temperature differences, while Earth’s landforms and geographic position reshape the resulting weather and climate.
Insolation: the energy arriving from the Sun
Insolation means incoming solar radiation—the Sun’s energy received by Earth. It is Earth’s main source of energy, and the amount received at a location depends primarily on latitude and season. This relationship is captured by ENG-2.A.1 under the enduring understanding ENG-2: most atmospheric processes are driven by energy input from the Sun.
The same beam of sunlight can warm two surfaces very differently. When rays strike nearly perpendicular to the surface, their energy is concentrated in a smaller area. When rays arrive at a low angle, the same energy spreads across a larger area and is therefore less intense per unit area.
This geometric effect explains why the highest solar radiation per unit area occurs near the equator and generally decreases toward the poles (ENG-2.A.2 and ENG-2.A.3). Earth’s curved shape causes equatorial surfaces to face incoming radiation more directly, while polar surfaces receive sunlight at a shallower angle.
Key relationship: A more direct solar angle concentrates energy; a lower solar angle spreads energy out.
Why Earth has seasons
Earth’s axis is tilted relative to its orbit around the Sun. This axial tilt causes both the seasons and changes in the number of daylight hours at a location, as required by ENG-2.A.5. Seasons are not caused primarily by Earth being much closer to or farther from the Sun.
When a hemisphere tilts toward the Sun, it receives more direct radiation and longer periods of daylight. The combination produces greater daily energy input and summer conditions. When that hemisphere tilts away from the Sun, it receives lower-angle radiation and shorter daylight, producing winter conditions. Therefore, a location receives its greatest solar radiation during its longest summer day and its least during its shortest winter day (ENG-2.A.4).
Worked example: Consider a city at $40^\circ$ north latitude. In its summer, the Northern Hemisphere tilts toward the Sun. The Sun appears higher in the sky, its rays strike the city more directly, and daylight lasts longer. In winter, the Sun’s rays arrive at a lower angle and daylight is shorter, so the city receives less solar energy per day. The explanation uses three linked observations: axial tilt → solar angle and day length → seasonal insolation.
From uneven heating to atmospheric circulation
Unequal insolation creates temperature differences across Earth’s surface. Air warmed more strongly near the equator expands, becomes less dense, and rises; cooler, denser air sinks elsewhere. These density differences establish pressure differences and help produce large-scale atmospheric circulation. Global wind patterns primarily originate from the intense solar radiation received near the equator, with Earth’s rotation and the Coriolis effect modifying the flow (ERT-4.E.1).
The required learning objective ENG-2.A, “Explain how the sun’s energy affects the Earth’s surface,” is therefore not merely about temperature. It requires tracing energy from sunlight to uneven surface heating, then to differences in air density, pressure, and atmospheric movement. When interpreting a circulation diagram, apply Suggested Skill 2.B: Visual Representations by explaining how the visual characteristics—such as latitude, arrows, temperature zones, or rising air—relate to one another.
Geography and geology reshape climate
Solar energy establishes broad patterns, but Earth’s geography determines how those patterns are expressed locally. Geologic factors include the physical structure of Earth’s surface, especially topography—the arrangement and elevation of landforms. Mountains, mountain ranges, plateaus, valleys, and elevation can redirect air, alter precipitation, and change temperature.
As moist air encounters a mountain range, the terrain forces the air upward. This process, called orographic lifting, causes the air to expand and cool. Cooling can produce condensation, clouds, and precipitation on the windward side of the mountain. After losing moisture, the air descends on the leeward side, warms, and becomes drier. The resulting dry region is a rain shadow.
Elevation also affects temperature. Air pressure generally decreases with altitude, so rising air expands and cools. Consequently, a high-elevation location can be much cooler than a low-elevation location at the same latitude. A mountain range may therefore create a cool, wet slope on one side and a warmer, drier landscape on the other.
Weather versus climate
Weather is the short-term state of the atmosphere, such as today’s temperature, wind, cloud cover, or precipitation. Climate is the long-term pattern of atmospheric conditions in a region, including typical temperature, precipitation, and seasonal variation over many years.
Both are influenced by solar energy and geography, but they operate on different time scales. Uneven insolation helps establish a region’s climate, while mountains, elevation, nearby water, and latitude modify it. Weather is the day-to-day expression of those conditions, plus short-term atmospheric changes.
Misconception check: “It is unusually cold today, so the climate must be getting colder” confuses weather with climate. A single cold day is weather; climate describes long-term patterns and trends.
Retrieval check
A mountain community lies on the windward side of a range at high elevation. Explain why it might be cooler and wetter than a nearby lowland community on the leeward side. A complete explanation should connect solar angle or elevation to temperature, then identify orographic lifting, cooling, precipitation, descending air, and the rain-shadow effect.
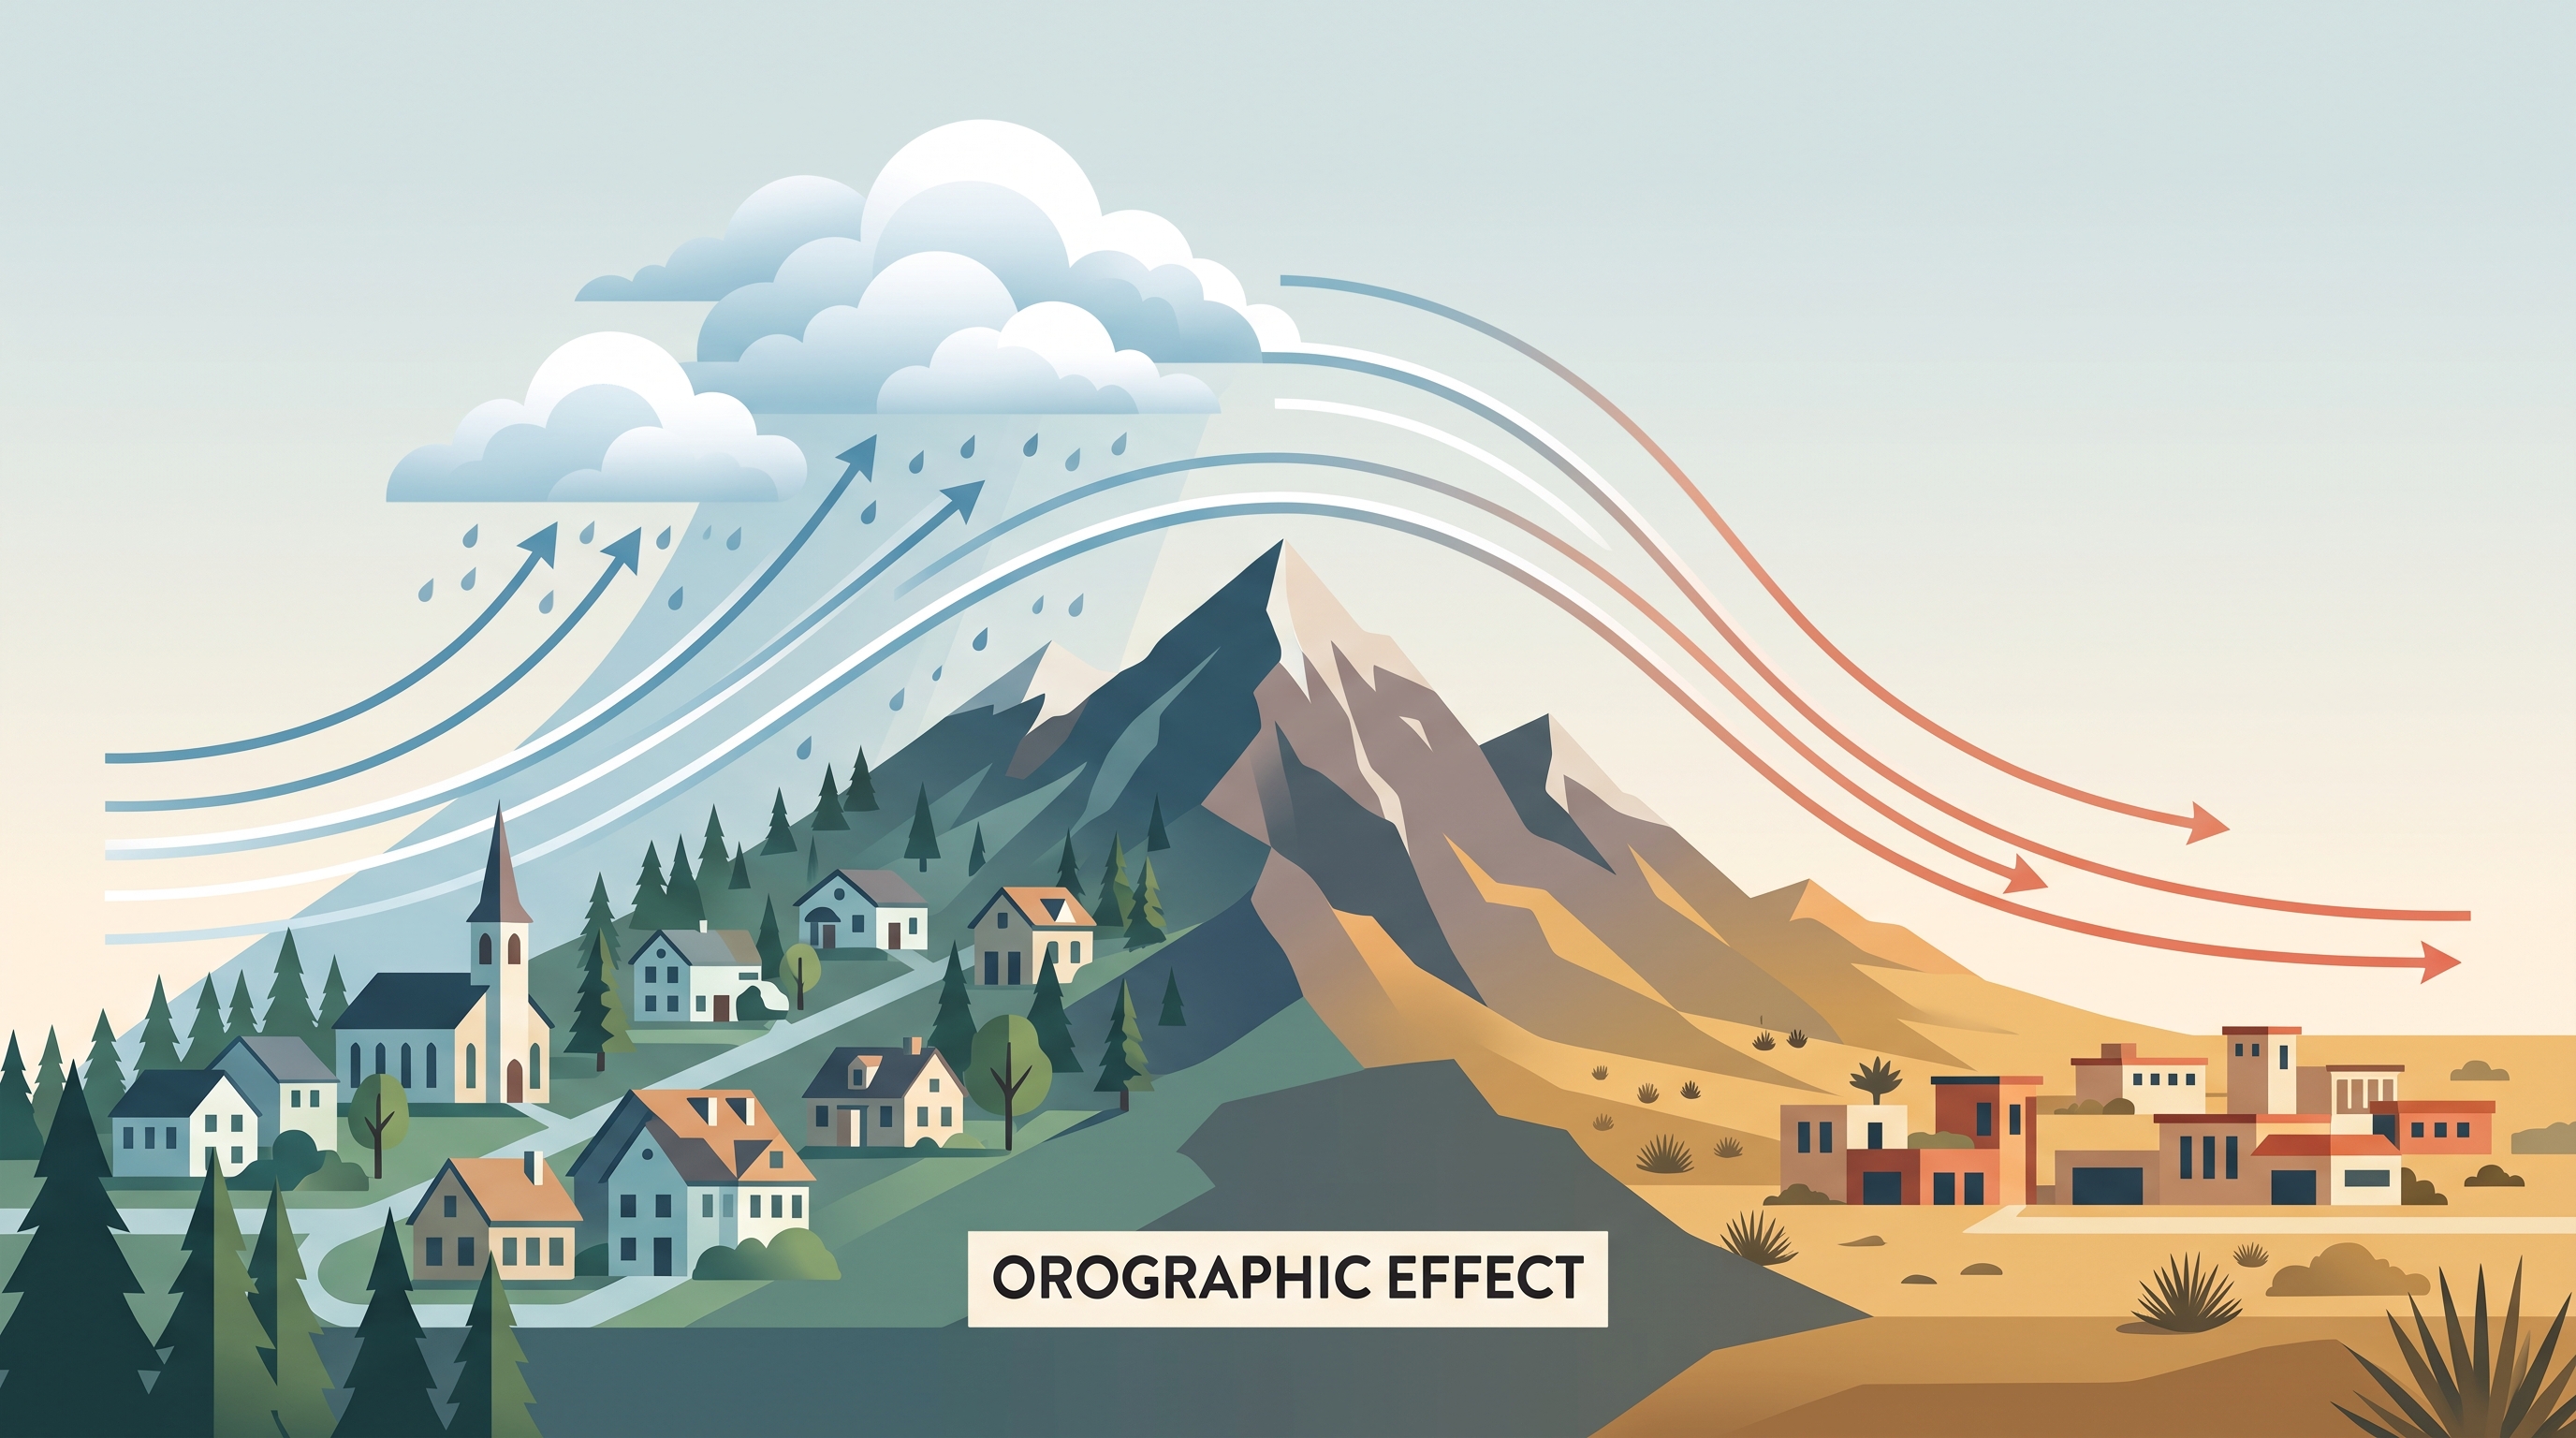
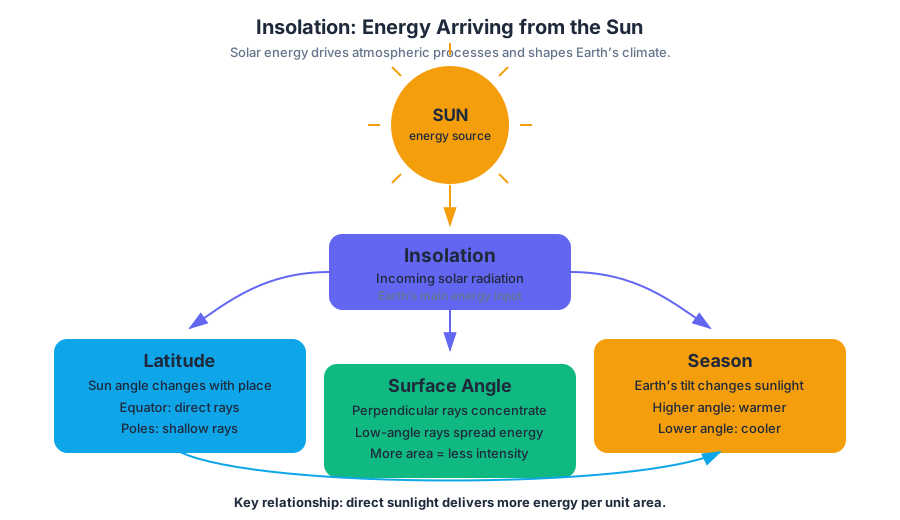
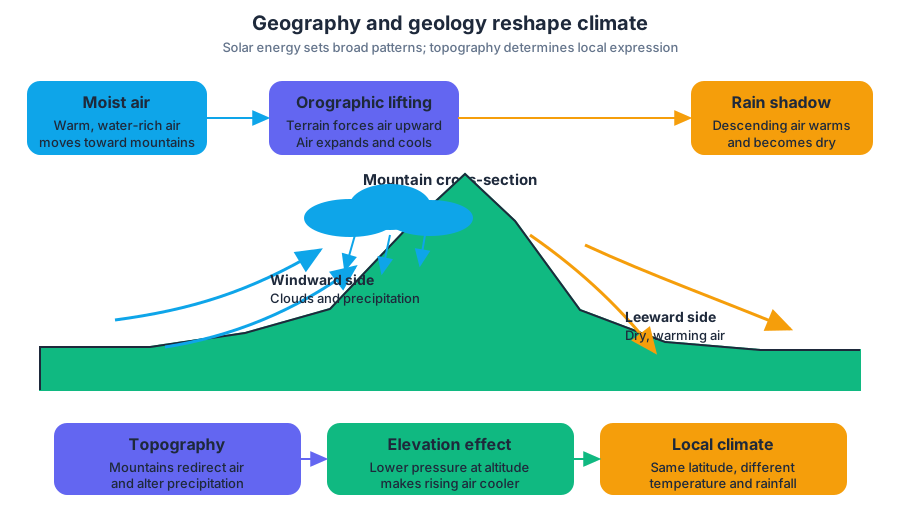
4.9 El Niño and La Niña
Every few years, the tropical Pacific Ocean changes the way it stores and releases heat, rearranging rainfall, fisheries, storms, and drought risk across much of the planet.
4.9 El Niño and La Niña
Every few years, the tropical Pacific Ocean changes the way it stores and releases heat, rearranging rainfall, fisheries, storms, and drought risk across much of the planet. These linked ocean–atmosphere patterns are called El Niño and La Niña, together forming the El Niño–Southern Oscillation, or ENSO.
Learning objective ERT-1.I: Explain how El Niño and La Niña affect global climate.
Essential knowledge ERT-1.I.1: El Niño and La Niña result from changes in ocean circulation and atmospheric conditions in the tropical Pacific Ocean, producing global effects on temperature and precipitation.
The normal Pacific pattern
Under neutral, or typical, conditions, easterly trade winds push warm surface water westward from the coast of South America toward Indonesia and Australia. Warm water piles up in the western Pacific, where it promotes evaporation, cloud formation, and heavy rainfall.
At the same time, cold, nutrient-rich water rises near the western coast of South America. This process, called upwelling, supports highly productive marine food webs and major fisheries. The boundary between warm surface water and colder deep water—the thermocline—is relatively shallow in the eastern Pacific and deeper in the west.
El Niño: weakened winds, warmer eastern Pacific
During El Niño, the trade winds weaken or may temporarily reverse. Warm surface water moves eastward across the tropical Pacific, causing sea-surface temperatures to rise near the coasts of Peru and Ecuador.
Because the warm surface layer becomes deeper in the eastern Pacific, the thermocline sinks there. Upwelling is reduced, so fewer nutrients reach surface waters. Phytoplankton productivity declines, followed by declines in fish populations and the seabirds, marine mammals, and fishing communities that depend on them.
The displaced warm water also changes atmospheric convection—the rising of warm, moist air. Rainfall increases over parts of the eastern and central Pacific, while Indonesia and Australia may experience drought. El Niño can also shift atmospheric circulation far beyond the Pacific, changing the probability of floods, droughts, altered storm tracks, and unusually warm conditions in distant regions.
La Niña: stronger winds, cooler eastern Pacific
During La Niña, the trade winds become stronger than usual. They push even more warm water toward the western Pacific and strengthen cold-water upwelling along the South American coast.
The eastern tropical Pacific therefore becomes cooler, the thermocline remains shallower, and nutrient delivery to surface waters increases. Fisheries may benefit from this greater nutrient supply, although the ecological and economic result depends on the species involved and on the intensity and duration of the event.
La Niña commonly produces a broad pattern opposite to El Niño: wetter conditions in parts of Indonesia and Australia and drier conditions in portions of the eastern Pacific. Its remote effects can include shifts in temperature, precipitation, and storm activity in other regions.
One mechanism, many consequences
| Condition | Trade winds | Eastern-Pacific surface water | Upwelling near South America | Typical biological effect |
|---|---|---|---|---|
| Neutral | Typical strength | Relatively cool | Typical | Sustained nutrient supply |
| El Niño | Weakened | Warmer | Reduced | Lower marine productivity |
| La Niña | Strengthened | Cooler | Enhanced | Often higher marine productivity |
Worked example: Suppose a monitoring station records unusually warm surface water near Peru, declining nutrient concentrations, and a sharp drop in anchovy abundance. The strongest explanation is El Niño. The causal chain is:
$$ \text{weaker trade winds} \rightarrow \text{eastward movement of warm water} \rightarrow \text{deeper thermocline} \rightarrow \text{less upwelling} \rightarrow \text{fewer nutrients} \rightarrow \text{lower primary productivity} \rightarrow \text{reduced fish abundance} $$
The evidence does not prove that every regional weather event was caused by El Niño. ENSO changes probabilities and large-scale patterns; local geography, seasonal circulation, and other climate processes also influence actual weather.
Misconception check
Misconception: “El Niño means the entire planet becomes warmer, while La Niña means the entire planet becomes colder.” Neither event produces a uniform global temperature pattern. El Niño often raises the global average temperature temporarily because heat moves from the ocean into the atmosphere, but some locations can become cooler or wetter. La Niña can temporarily suppress the global average temperature while producing severe heat, drought, or flooding in particular regions.
AP science practices in this topic
- Science Practice 1: Concept Application — Use the trade-wind, thermocline, and upwelling mechanism to predict ecological consequences.
- Science Practice 2: Visual Representations — Interpret cross sections, circulation diagrams, and maps of sea-surface temperature.
- Science Practice 5: Data Analysis — Identify anomalies by comparing observed temperature, rainfall, or fish-abundance data with long-term averages.
- Science Practice 7: Environmental Solutions — Justify adaptive responses such as flexible fishery management, drought planning, or water-storage strategies.
Retrieval check: A graph shows cooler-than-average eastern-Pacific water, unusually strong easterly trade winds, and increased nutrient concentrations near South America. Identify the ENSO phase and explain the two-step mechanism linking the wind pattern to marine productivity.
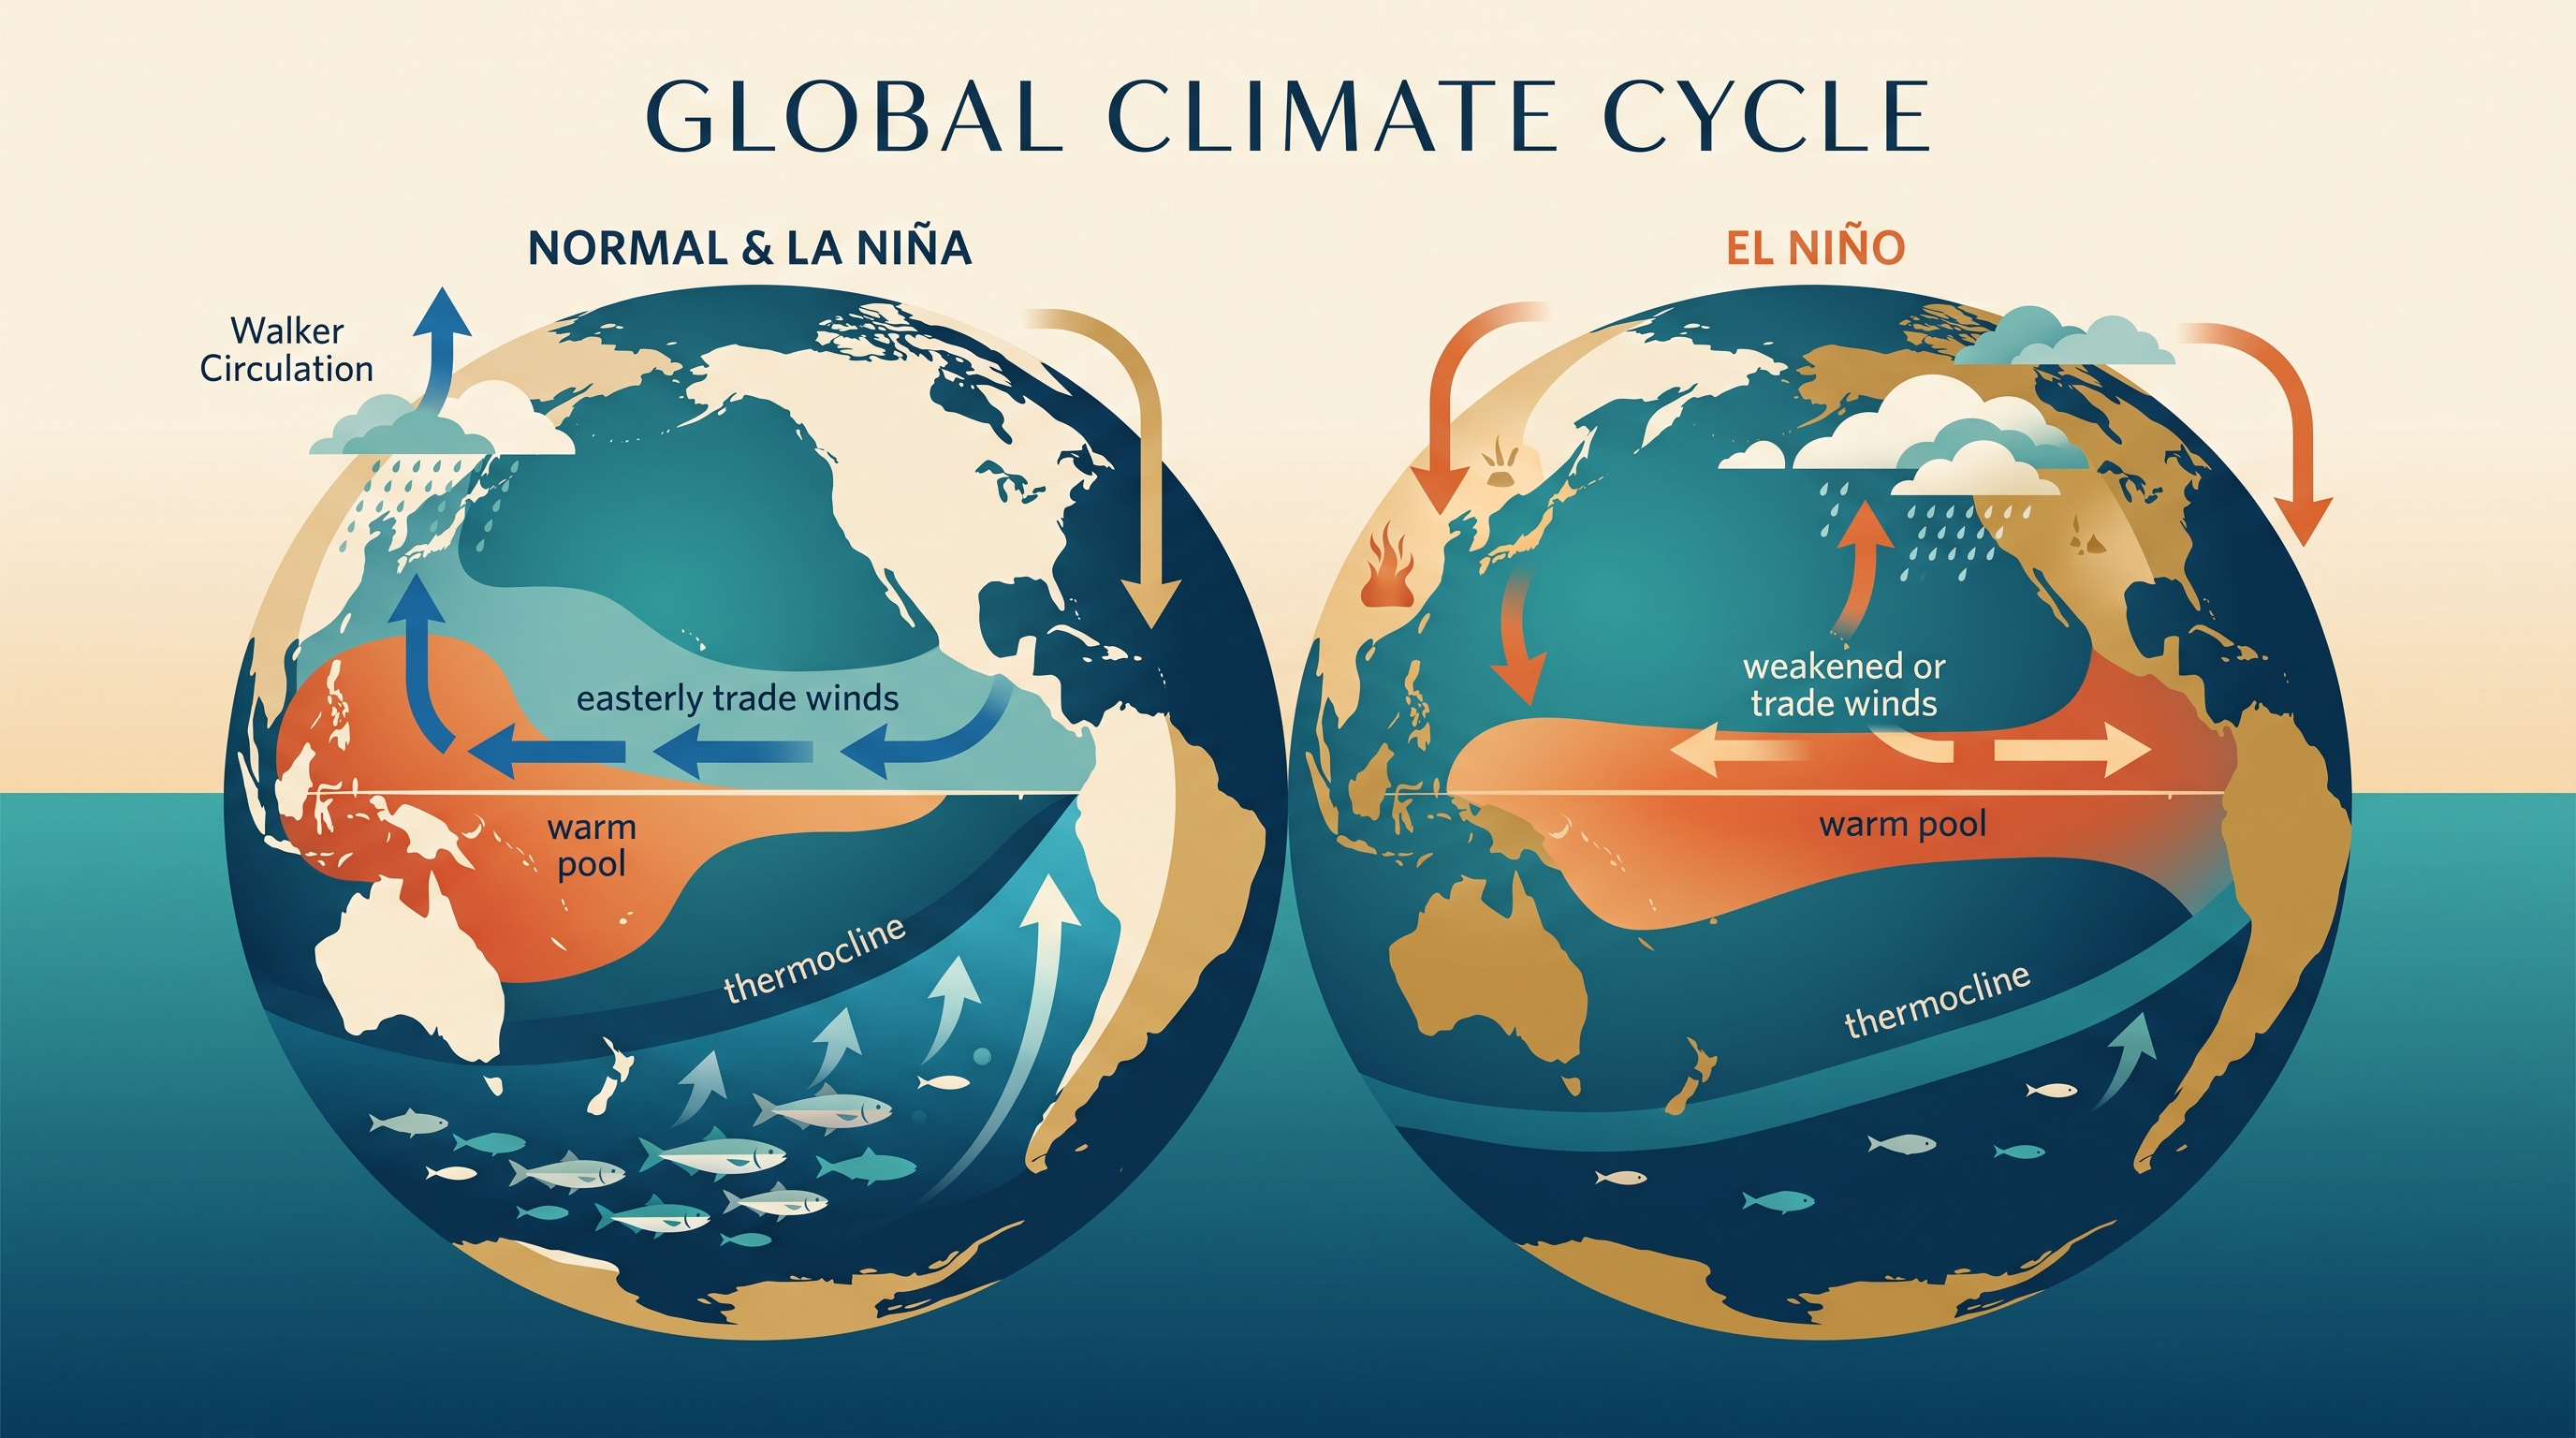
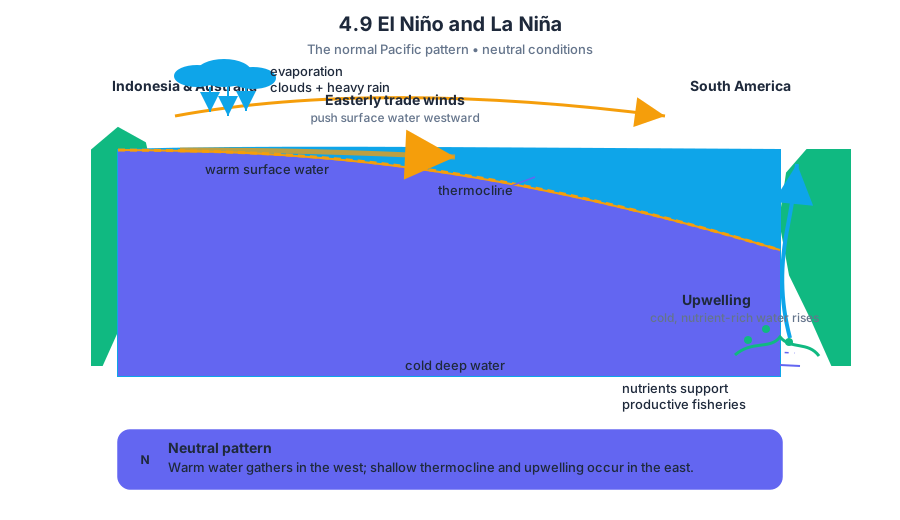
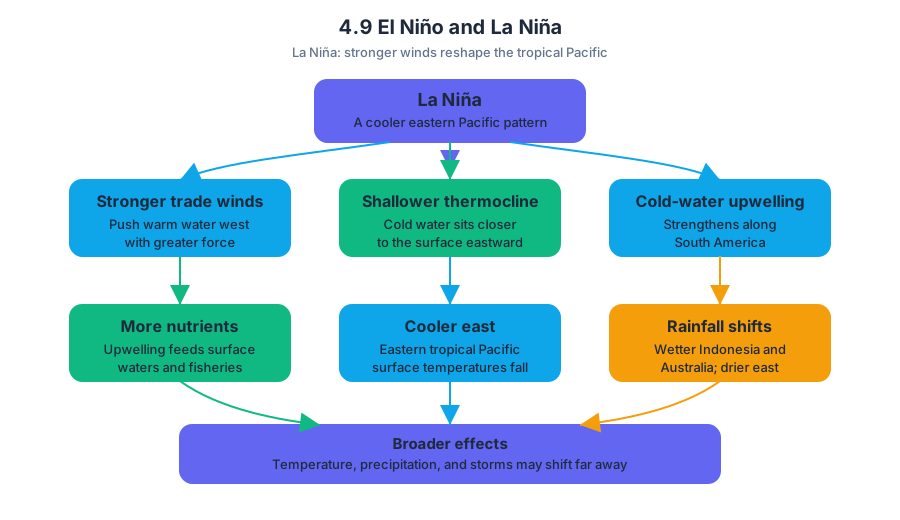
5.1 The Tragedy of the Commons · 5.2 Clearcutting
Key concepts: Tragedy of the commons · Shared/common resources · Individual self-interest and resource depletion · Overfishing · Clearcutting · Human impacts on natural systems · Sustainability · Case studies and solution evaluation · Quantitative data analysis · Aquatic food-chain effects of invasive species
A fishery can collapse even when every fisher is making a decision that seems economically reasonable: catch one more fish before someone else does. This conflict between individual self-interest and the common good is the tragedy of the commons.
5.1 The Tragedy of the Commons · 5.2 Clearcutting
A fishery can collapse even when every fisher is making a decision that seems economically reasonable: catch one more fish before someone else does. This conflict between individual self-interest and the common good is the tragedy of the commons.
The tragedy of the commons
A shared or common resource is a resource that many people can access and use, such as a fishery, a grazing pasture, a forest, or clean groundwater. The tragedy occurs when individuals acting in their own interests collectively deplete that resource.
Tragedy of the commons: Individuals use a shared resource for personal benefit rather than protecting the common good, causing the resource to be depleted or destroyed.
The logic is straightforward. A fisher receives the full profit from catching an additional fish, while the reduction in the fish population is spread across every fisher who depends on the fishery. Each person therefore has an incentive to increase extraction, even though the combined result is resource depletion.
The blue pike illustrates this process. Blue pike were commercially fished from the late $1800$s. Because the fishery was treated as an accessible shared resource, fishers could increase catches to maximize profit. The population eventually crashed in $1958$, and blue pike were declared extinct in $1970$.
The key environmental explanation is not simply “too many fish were caught.” A complete explanation connects unregulated or poorly regulated access, individual profit-seeking, and collective depletion: commercial fishers benefited from catching blue pike, but the fishery as a whole lost the ability to replenish itself.
Worked case: diagnosing the problem and evaluating a solution
Suppose a lake’s blue pike catch rises for several decades while recorded population size falls. By $1958$, catches suddenly drop because few mature fish remain. The environmental change is a population collapse caused by overfishing; the underlying mechanism is that repeated individual harvest exceeded the population’s reproductive replacement.
A possible solution is to limit access through fishing licenses, seasonal closures, catch quotas, or protected breeding areas. These policies can preserve the shared resource, but evaluation must consider stakeholders: fishers may lose short-term income, consumers may face higher prices, and local communities may gain a more stable fishery over the long term.
Aquaculture may reduce pressure on wild fisheries, but it is not automatically sustainable. High-density fish farming can promote disease transmission, and escaped fish may compete or breed with wild populations. A strong environmental solution therefore evaluates both its intended benefit and its unintended effects.
Human activities alter natural systems
Clearcutting is the removal of most or all trees from an area at one time. It changes a natural system by eliminating vegetation, simplifying habitat, exposing soil, increasing erosion, and altering water movement through the ecosystem.
Clearcutting also connects land use to downstream effects. Without tree roots and leaf litter to hold soil, rainfall can produce more surface runoff and carry sediment into streams. The resulting turbidity can reduce aquatic habitat quality, while the loss of forest structure removes food and shelter for terrestrial organisms.
Mining, clearcutting, irrigation, and other agricultural practices similarly alter natural systems, although the mechanisms differ. Mining removes or disturbs land and can expose pollutants; clearcutting removes forest biomass and habitat; irrigation diverts freshwater and can reduce water available to rivers, wetlands, and other users.
Food-web consequences: Asian carp
Human-caused changes can propagate through food webs rather than stopping at the first affected organism. In the Great Lakes food chain, Asian carp can consume algae that would otherwise support zooplankton. If zooplankton decline, less food is available for organisms such as other fish.
This is a trophic-chain effect:
$$ \text{Asian carp increase} \rightarrow \text{algae decrease} \rightarrow \text{zooplankton decrease} \rightarrow \text{less food for other fish} $$
The important reasoning move is to identify the direction of each relationship. Asian carp do not necessarily harm other fish by directly attacking them; they can reduce the food supply at a lower trophic level, indirectly affecting organisms higher in the food chain.
AP skill connections
This topic primarily develops Science Practice 7: Environmental Solutions, especially 7.B, 7.C, 7.D, 7.E, and 7.F. Use 7.B to identify the environmental problem, such as overfishing, habitat loss, erosion, or invasive-species competition; use 7.C to propose a feasible solution; and use 7.D to justify why the solution addresses the mechanism causing the problem.
Use 7.E to describe likely environmental impacts of a proposed action and 7.F to evaluate the solution by considering effectiveness, limitations, and stakeholder interests. The topic also connects to 1.B: Explain environmental concepts, processes, and models, 6.B: Apply mathematical routines, and 6.C: Represent and interpret data when quantitative catch, population, runoff, or food-web data are provided.
Misconception check
Misconception: “The tragedy of the commons means that all shared resources must be destroyed.” Not necessarily. The tragedy arises when access and use are not effectively managed relative to the resource’s rate of replacement. Enforceable quotas, protected areas, monitoring, and community management can align individual decisions with long-term resource sustainability.
Retrieval and interpretation check
A commercial fishery shows increasing harvest, declining population size, and extinction several years later. Identify the concept, name the behavior driving it, and propose one management response. Then explain why a decline in zooplankton could reduce fish populations even if the fish are not directly caught.
Answer: This is the tragedy of the commons: fishers act in their own economic interests and collectively deplete a shared resource. A quota or seasonal closure could reduce harvest and allow reproduction. Fewer zooplankton means less food for fish that depend on them, producing an indirect food-web effect.
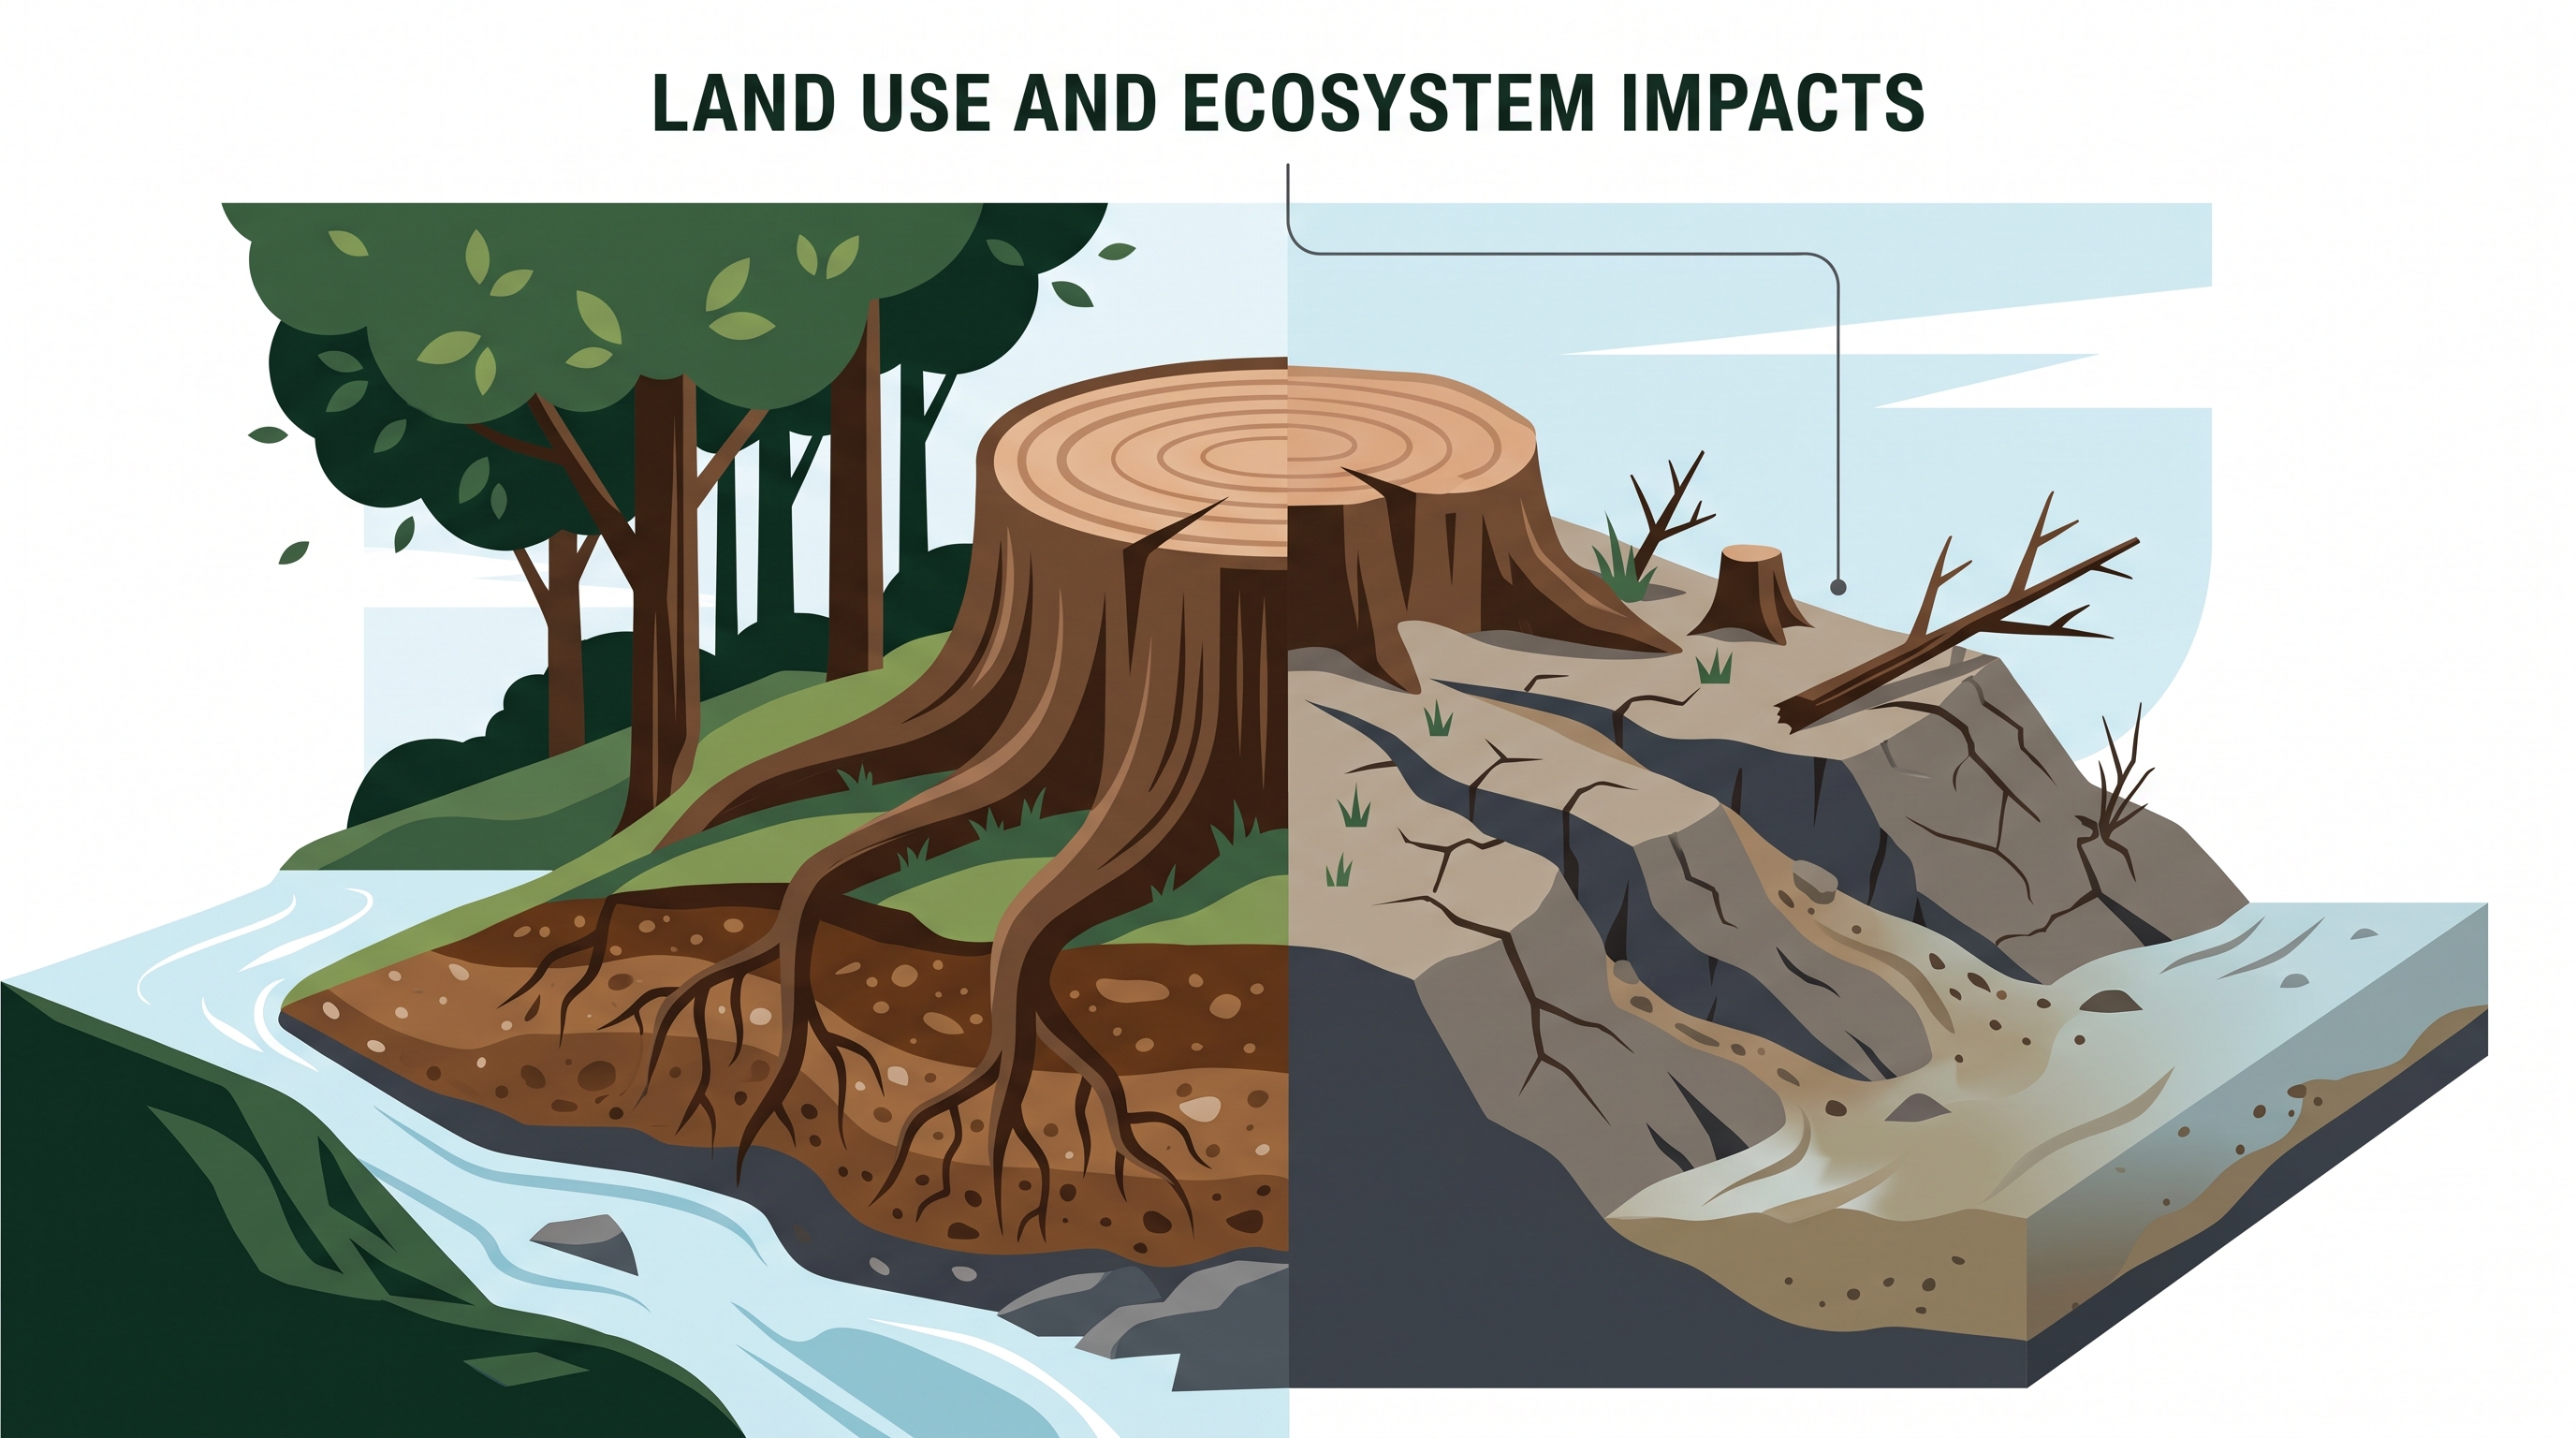
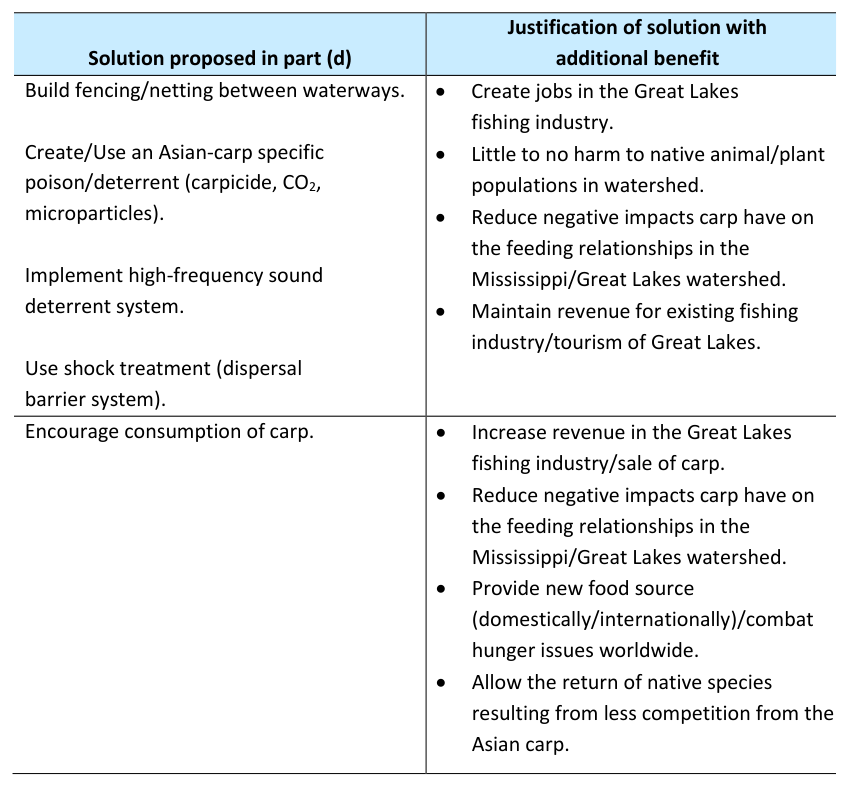
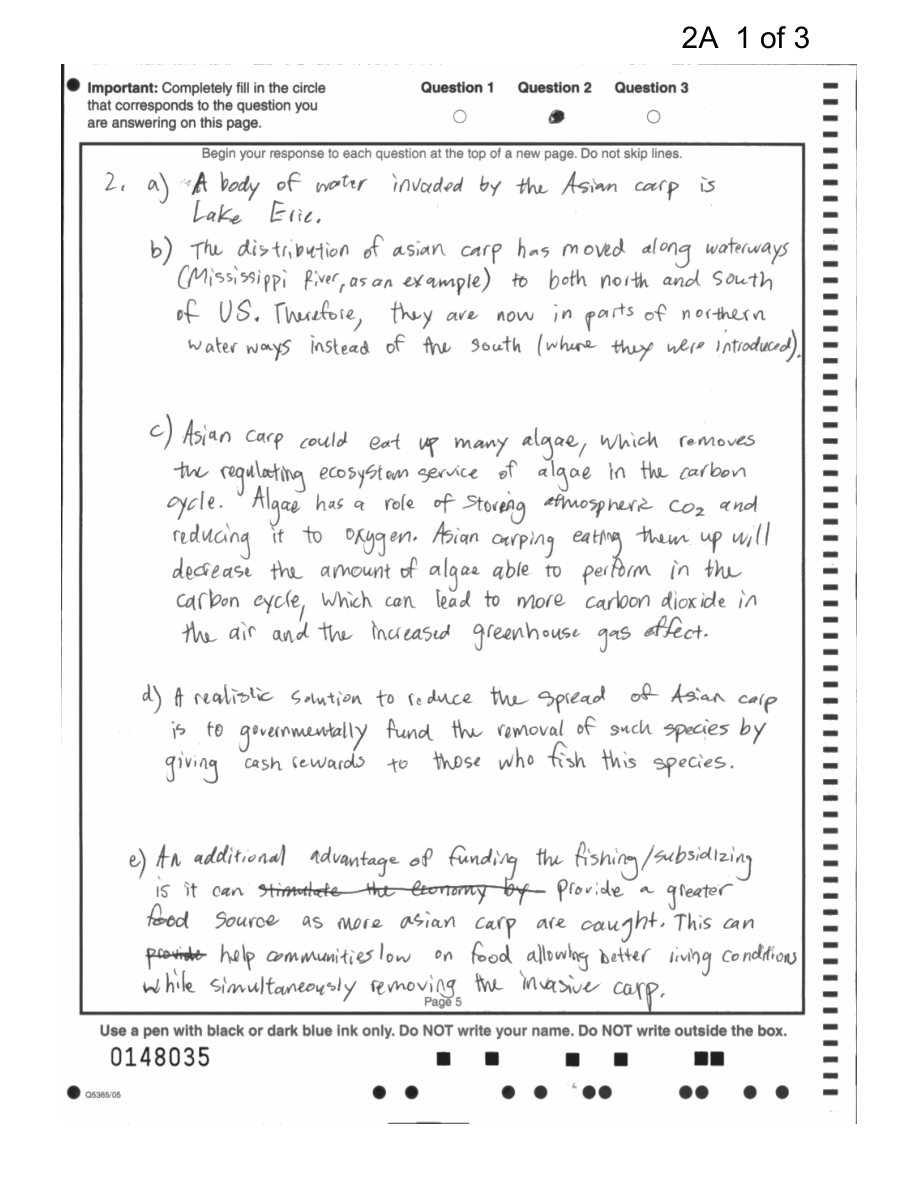
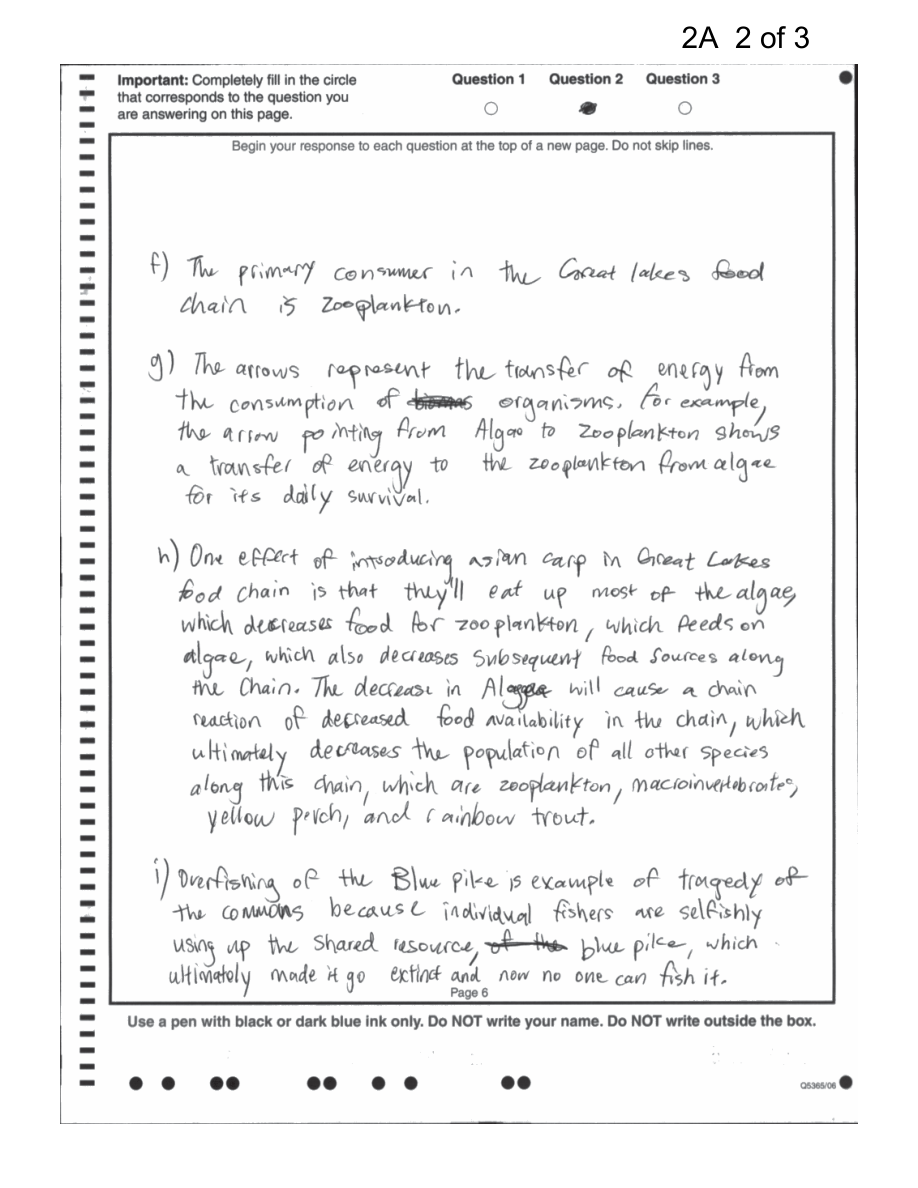
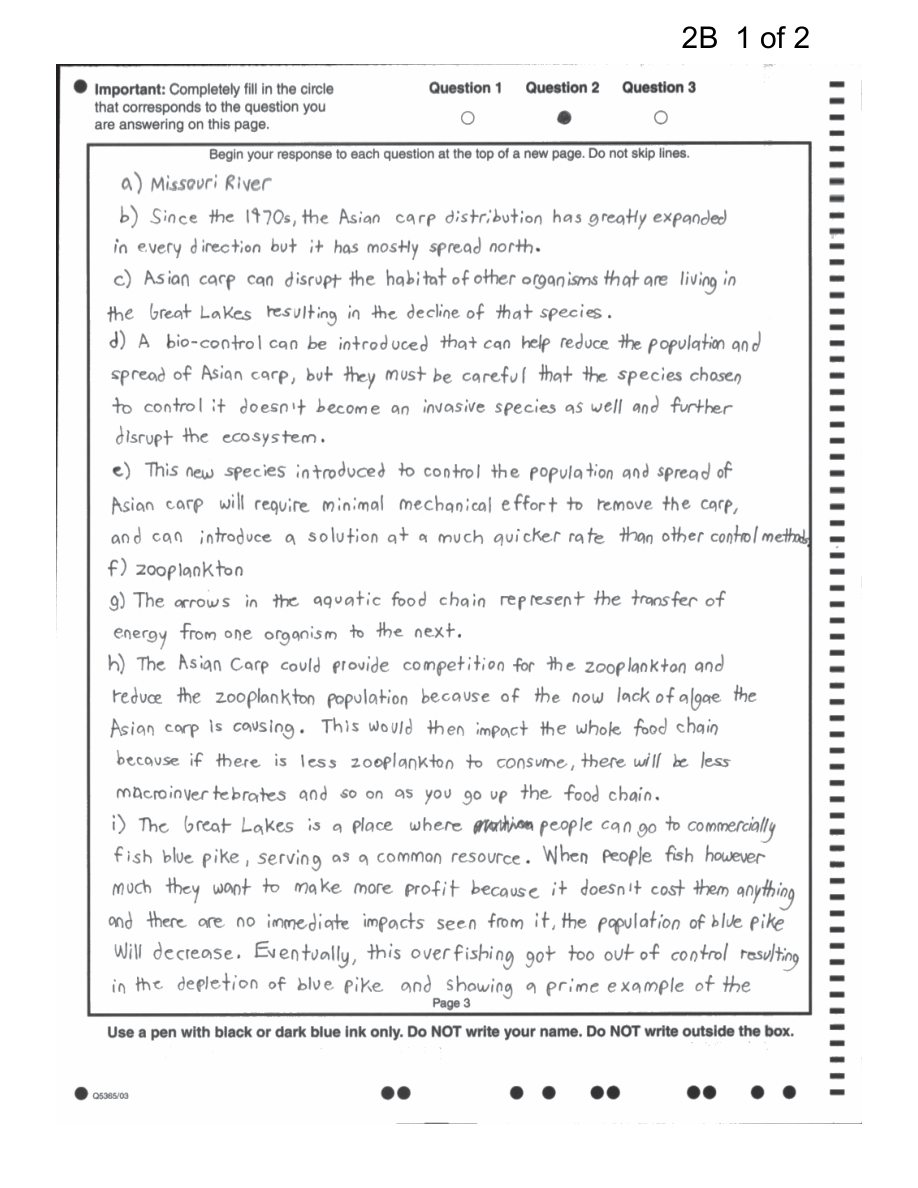
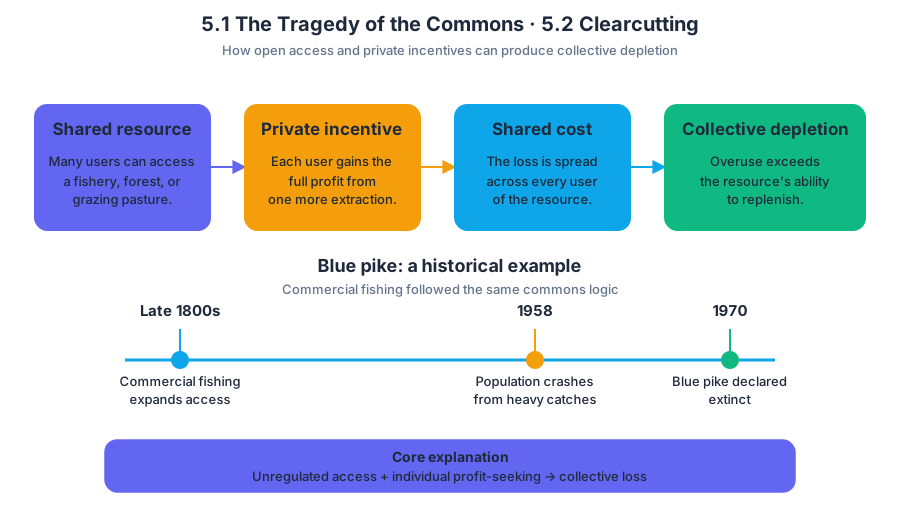
5.3 The Green Revolution · 5.4 Impacts of Agricultural Practices
Key concepts: Green Revolution agricultural strategies · Mechanization · Genetically modified organisms (GMOs) · Fertilization and soil fertility management · Irrigation and aquifer use · Pesticide use · Overgrazing and livestock management · Salinization and soil degradation · Free-range livestock systems
A single field can produce far more food than it once did—but only by redirecting energy, water, nutrients, and technology into the agricultural system. The Green Revolution was this broad shift toward agricultural strategies designed to increase food production, including mechanization, genetically modified…
5.3 The Green Revolution · 5.4 Impacts of Agricultural Practices
A single field can produce far more food than it once did—but only by redirecting energy, water, nutrients, and technology into the agricultural system. The Green Revolution was this broad shift toward agricultural strategies designed to increase food production, including mechanization, genetically modified organisms (GMOs), fertilization, irrigation, and pesticide use. Its central trade-off is simple: higher yields can improve food security, while the same strategies can damage soil, water, and ecosystems when poorly managed.
The Green Revolution: more food through intensified inputs
EIN-2.C — “Describe changes in agricultural practices.” The required knowledge is anchored by EIN-2.C.1, which identifies the Green Revolution as a shift toward new strategies and practices with both positive and negative results. These strategies include mechanization, GMOs, fertilization, irrigation, and pesticides.
Mechanization replaces some human or animal labor with machines such as tractors, harvesters, and irrigation pumps. Mechanized farming can cultivate large areas quickly and efficiently, but it also increases dependence on fossil fuels, can compact soil under heavy machinery, and may encourage large-scale monoculture—fields planted with one crop over extensive areas.
Genetically modified organisms (GMOs) are organisms whose genetic material has been altered to produce desired traits, such as pest resistance or tolerance to drought. A pest-resistant crop may reduce insecticide applications, but the environmental result depends on how the crop is used: repeated planting of one resistant variety can reduce genetic diversity and select for resistant pests.
Fertilization adds nutrients—especially nitrogen, phosphorus, and potassium—to increase plant growth. Fertilizers can correct nutrient deficiencies and raise yields, but excess nutrients can run off fields into streams and lakes, where they may contribute to eutrophication. Irrigation supplies water when precipitation is insufficient, but overuse can deplete aquifers or leave salts behind in soil. Pesticides suppress organisms that damage crops, yet may also harm nontarget organisms, contaminate water, or select for pesticide-resistant pests.
Worked example: evaluating one intensified farm
A wheat farm adopts a diesel-powered combine, a pest-resistant wheat variety, synthetic fertilizer, groundwater irrigation, and an insecticide. In the short term, harvests increase because machines reduce labor constraints, the crop suffers less insect damage, nutrients are readily available, and water stress is reduced. The environmental assessment must then follow each input: diesel adds air pollution and greenhouse-gas emissions, fertilizer may cause nutrient runoff, irrigation can lower the aquifer, and pesticide use can select for resistant insects.
The correct conclusion is not “the Green Revolution is beneficial” or “the Green Revolution is harmful.” Its effects depend on the balance between increased production and the environmental costs of the inputs. This is an AP Science Practice 1.A, “Describe environmental concepts and processes,” and 1.B, “Explain environmental concepts and processes,” task because a strong response identifies both the practice and its mechanism.
Agricultural impacts: when land and water are pushed beyond recovery
EIN-2.D — “Explain the environmental impacts of agricultural practices.” Agriculture changes ecosystems by altering vegetation cover, soil structure, nutrient availability, and water movement. Several impacts are especially important because they can create feedback loops: damaged soil produces less vegetation, which exposes more soil to erosion, causing still greater loss of productivity.
Overgrazing occurs when livestock populations exceed the land’s capacity to regenerate vegetation. As grazing removes plant cover, raindrops strike bare soil directly and runoff increases. Hoof traffic also causes soil compaction, reducing pore space and limiting infiltration. The combined result is more erosion, less plant growth, and reduced pasture productivity.
Salinization occurs when irrigation water containing dissolved salts enters soil, the water evaporates, and the salts remain behind. Over time, salt concentrations can become toxic to plants. Thus, irrigation may increase crop production initially while gradually making the soil less productive if salts are not removed.
Overuse of irrigation can also severely deplete aquifers. The Ogallala Aquifer in the central United States demonstrates this problem: groundwater withdrawal for agriculture can exceed the rate at which precipitation replenishes the aquifer. An aquifer is therefore not automatically a renewable resource on a human time scale; its renewability depends on recharge and withdrawal rates.
Soil fertility management and livestock systems
Farmers can improve soil fertility through crop rotation, which alternates crops so that one crop does not continually remove the same nutrients or support the same pests. Adding green manure—plant material grown and incorporated into soil—and adding limestone can also improve soil conditions. These practices illustrate management that maintains production by restoring soil resources rather than only increasing external inputs.
Free-range livestock systems may improve pasture soils because manure returns nutrients to the ground. However, “free-range” does not mean impact-free: high animal density can still produce runoff, erosion, and overgrazing. These systems require more land and may increase consumer costs, and free-range meat is not necessarily antibiotic-free.
Misconception check: “GMOs, fertilizers, or free-range systems are inherently good or bad.” Environmental science evaluates the mechanism, scale, and management of a practice—not its label alone.
Reasoning tools for this topic
Use 2.A, “Describe characteristics of a model or representation,” to trace water, nutrients, or energy through a farm; 2.B, “Describe patterns and trends,” to interpret declining aquifer levels or increasing soil salinity; and 2.C, “Explain relationships between variables,” to connect livestock density with vegetation loss and erosion. Use 5.A, “Perform mathematical calculations,” when comparing groundwater withdrawal with recharge, and 6.A, “Analyze environmental problems,” and 6.B, “Refine solutions,” when weighing yield against environmental damage. A defensible recommendation uses 7.A, “Justify a claim with evidence,” by linking a proposed practice to measurable environmental outcomes.
Retrieval check
A pasture supports plant regrowth only when livestock density remains below its regenerative capacity. If livestock numbers rise, vegetation declines, soil becomes compacted, and runoff increases. If an irrigated field becomes increasingly salty after repeated watering, identify the process and explain why evaporation worsens it. Answer: the process is salinization; evaporation removes water but leaves dissolved salts in the soil.
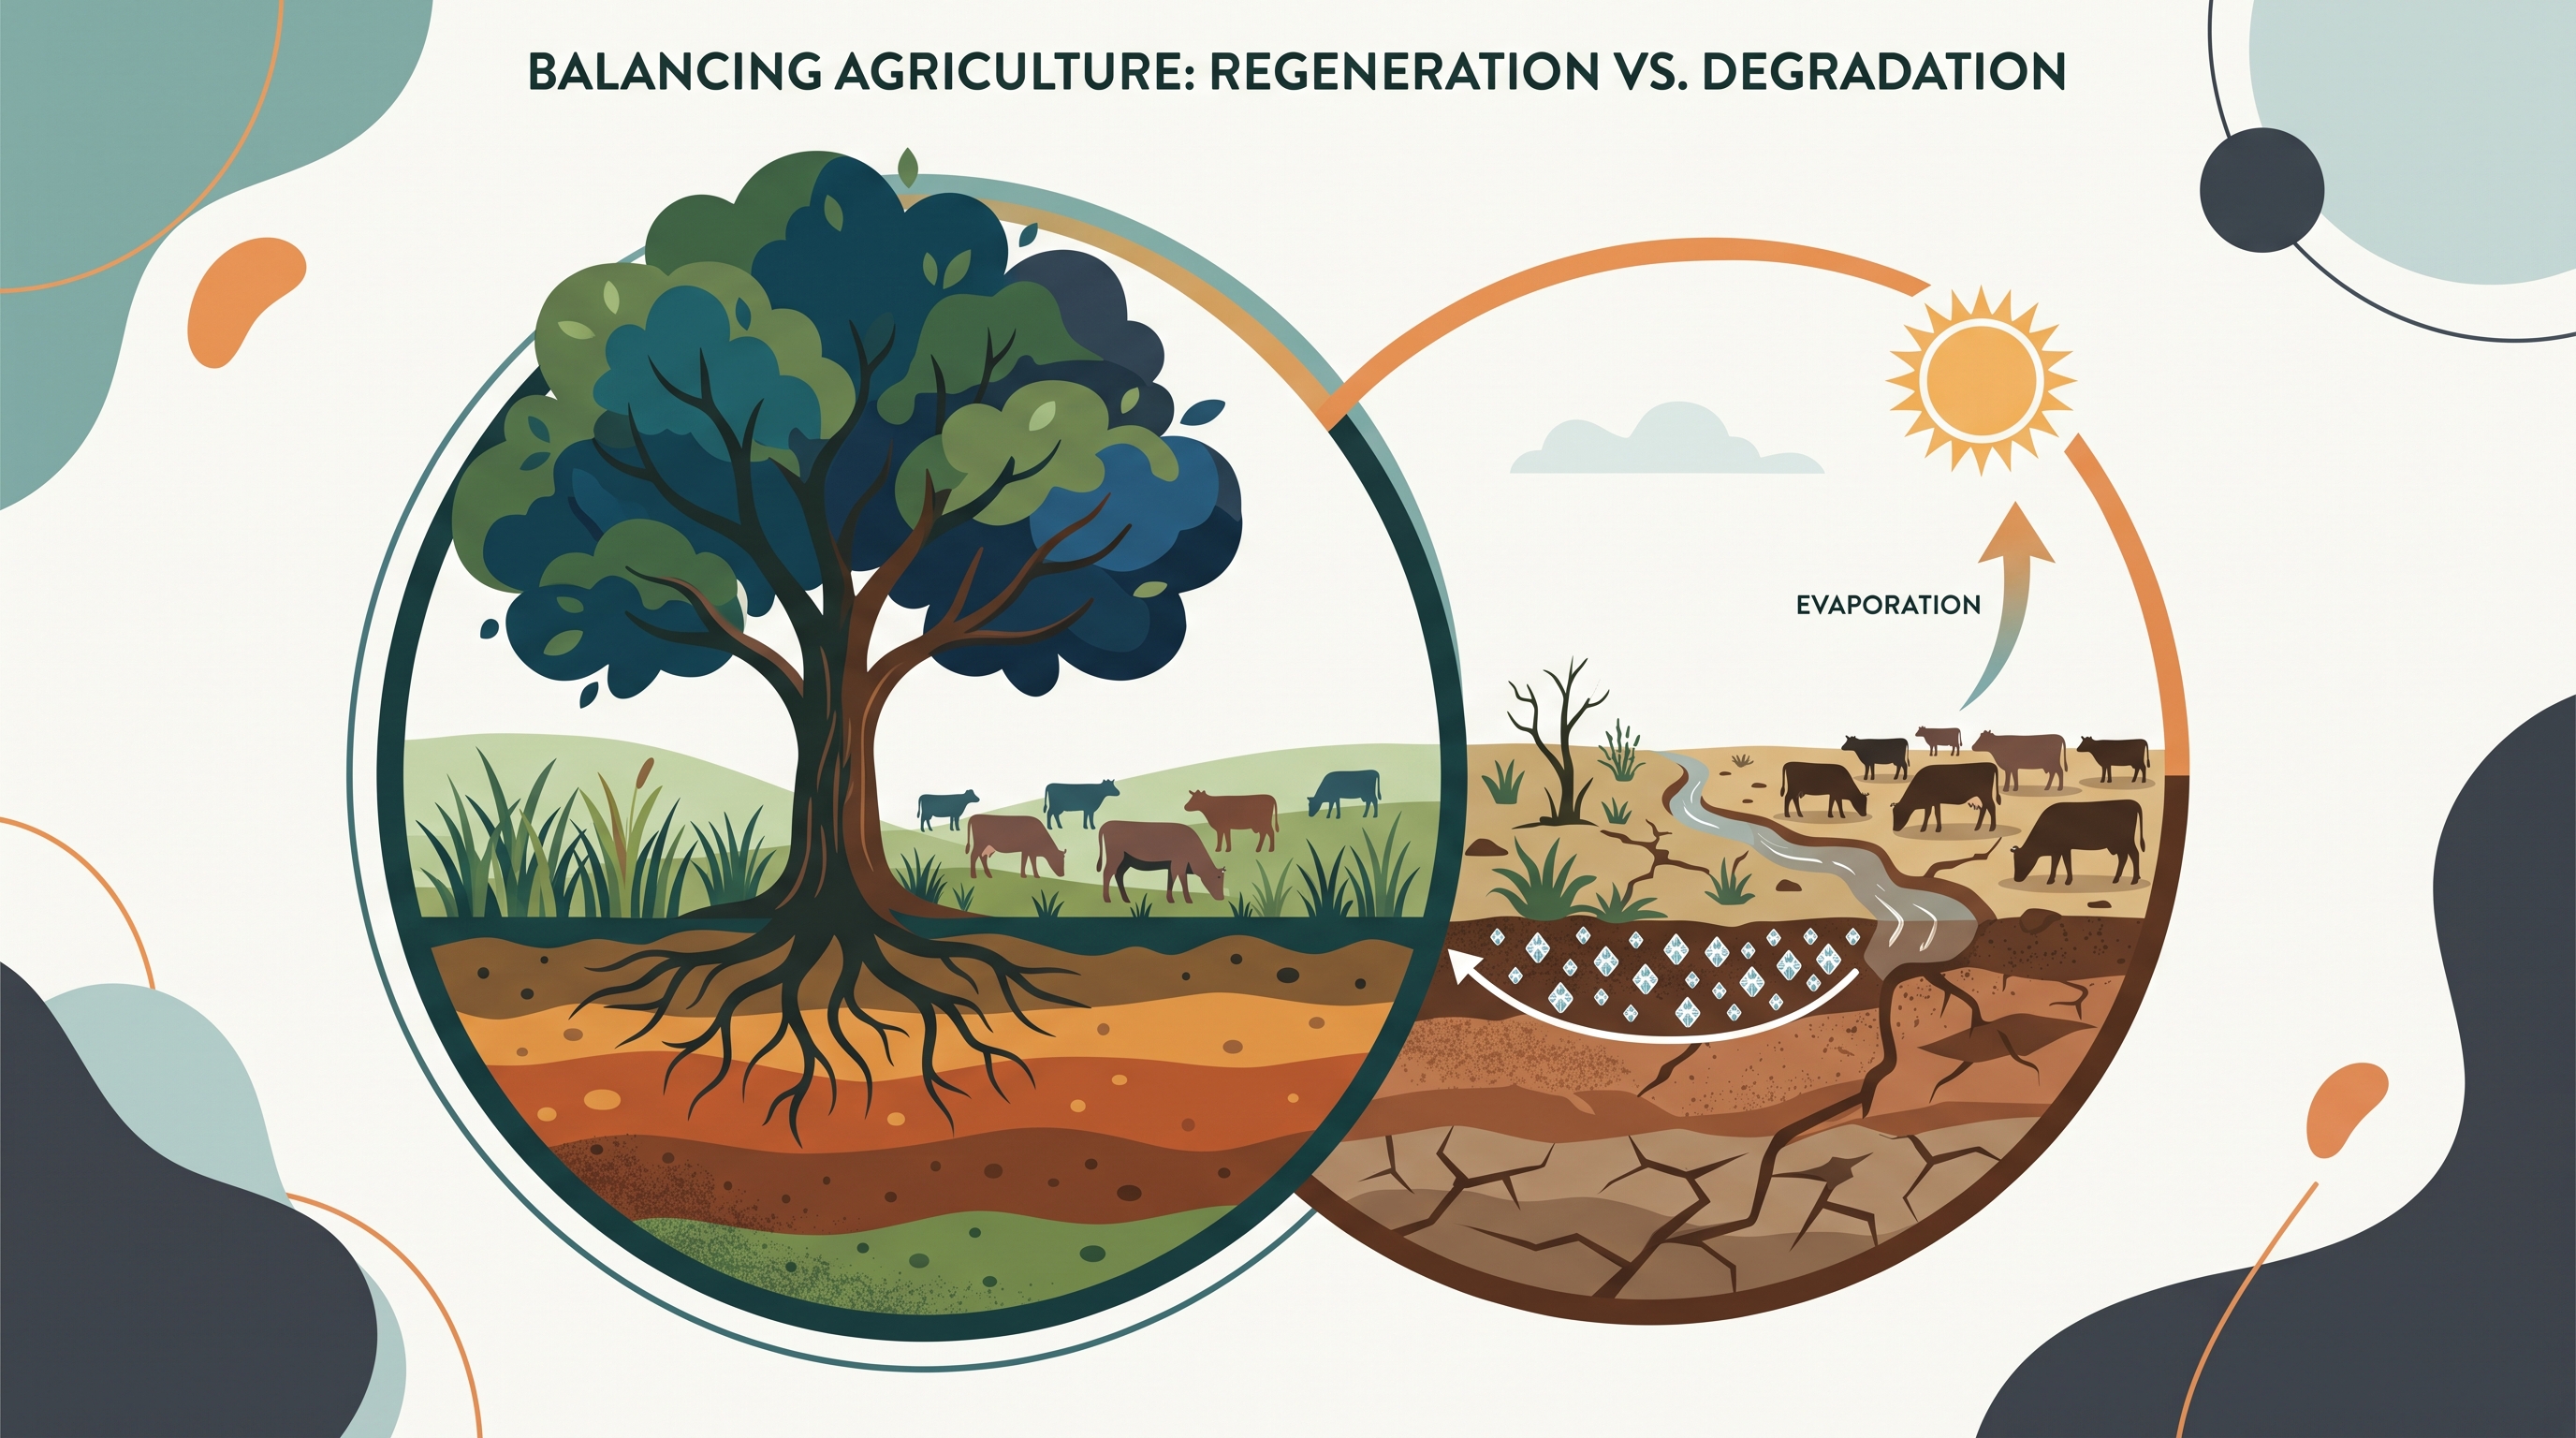
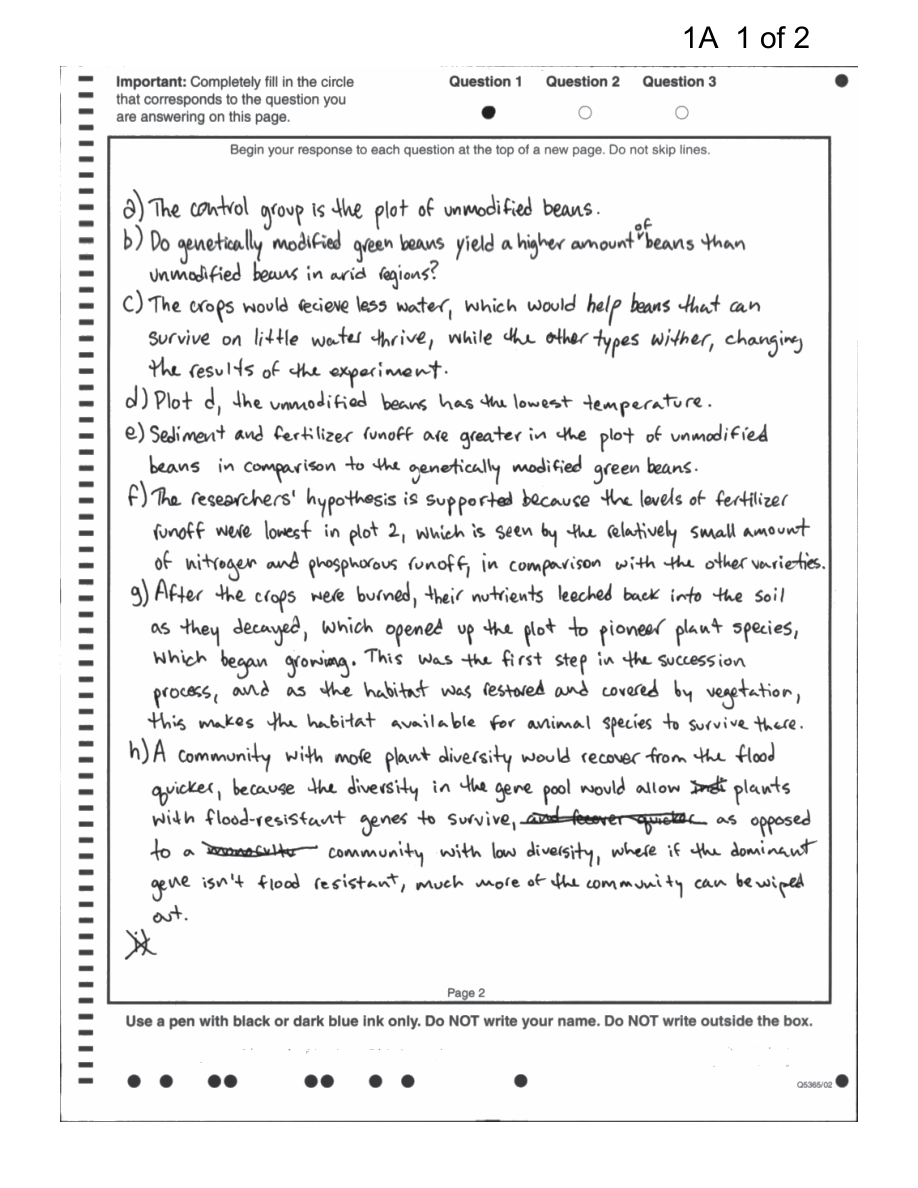
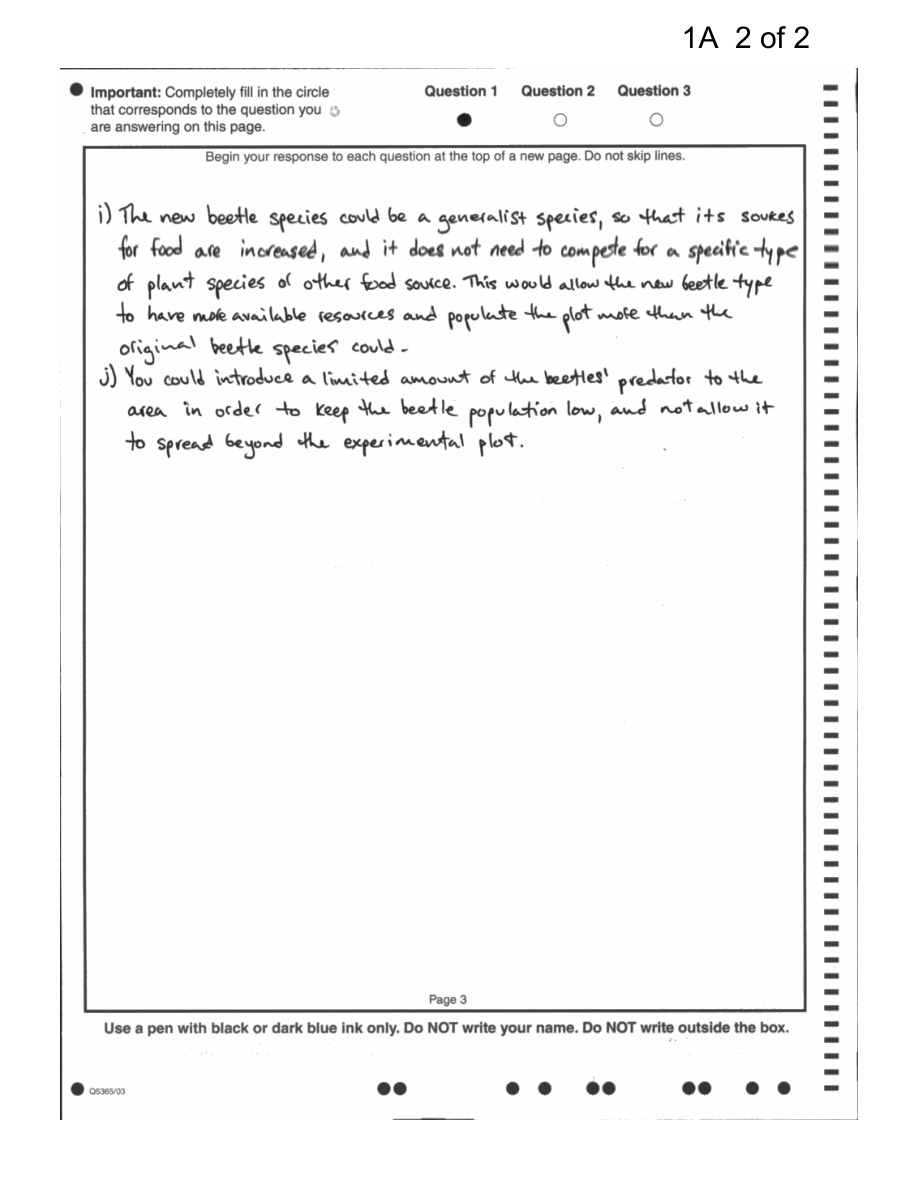
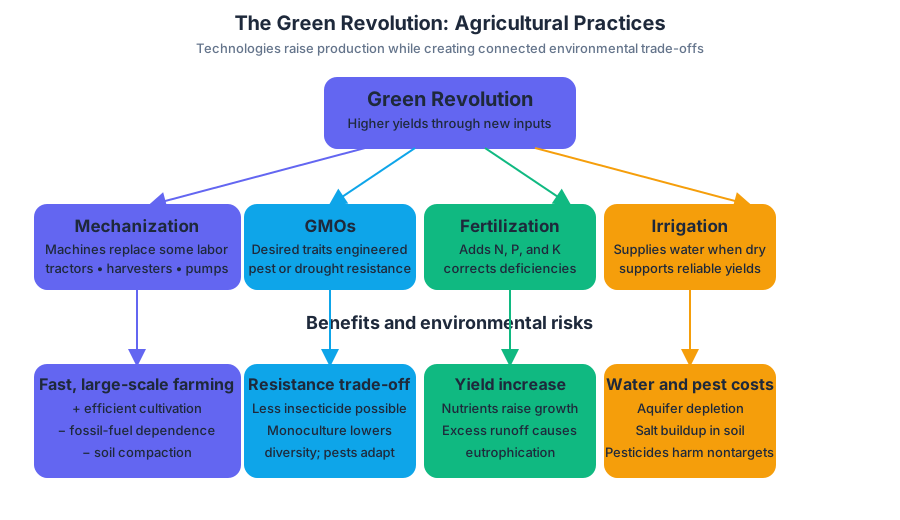
5.5 Irrigation Methods · 5.6 Pest Control Methods
Key concepts: Irrigation-method evaluation · Pest-control methods · Physical pest control through trapping · Genetically modified pest-resistant crops · Advantages, disadvantages, and unintended consequences of solutions · Nutrient cycling through decomposition · Community resilience and biodiversity · Ecological succession after disturbance · Population and community changes after introduction of a new species · Nutrient and sediment runoff comparisons between crop plots
How can a farm increase crop production without simply transferring its problems into the soil, water, or surrounding ecosystem? Irrigation and pest control are environmental solutions because they address immediate agricultural limits—but every solution can create new effects elsewhere.
5.5 Irrigation Methods · 5.6 Pest Control Methods
How can a farm increase crop production without simply transferring its problems into the soil, water, or surrounding ecosystem? Irrigation and pest control are environmental solutions because they address immediate agricultural limits—but every solution can create new effects elsewhere.
Irrigation: delivering water, moving consequences
Irrigation is the artificial application of water to crops. It can stabilize yields during dry periods, support food production in regions with seasonal rainfall, and make otherwise dry land productive. However, irrigation changes the movement of water and dissolved substances through an agricultural system.
The most important evaluation question is not simply “Does irrigation add water?” but “Where does the water go next?” Water may infiltrate into soil, evaporate, be taken up by plants, or run off the plot. As it moves, it can carry dissolved fertilizer nutrients and eroded sediment into neighboring plots, streams, lakes, or groundwater.
A useful comparison is:
| Irrigation outcome | Potential advantage | Potential disadvantage or unintended consequence |
|---|---|---|
| More water reaches crop roots | Increased plant growth and yield | Excess water can cause waterlogging and reduce oxygen around roots |
| Water moves through soil | Can supply plants and transport nutrients | May carry nitrate into groundwater or surface water |
| Runoff leaves a field | Can remove excess water | Can transport sediment and nutrients into waterways |
| Repeated application in dry regions | Makes farming possible | Evaporation can concentrate salts, causing soil salinization |
Worked example — comparing two plots. Suppose Plot A receives more irrigation than Plot B, while fertilizer amount, crop type, and soil are held constant. If Plot A produces greater runoff, that runoff may carry more dissolved nutrients and sediment into a nearby plot. The strongest conclusion is not that irrigation is always harmful; it is that excess irrigation can increase nutrient movement and erosion when water leaves the soil faster than the soil and plants can retain it.
To analyze such an investigation, identify the independent variable—the factor deliberately changed, such as irrigation amount—and the dependent variable, such as runoff volume, nitrate concentration, sediment mass, or crop yield. A control plot receives the standard condition; a constant, such as fertilizer quantity, is not the control group.
Pest-control methods: removing pests without creating a larger problem
Pest-control methods include physical removal, biological controls, chemical pesticides, and genetically engineered crops. A sound environmental evaluation compares effectiveness with effects on non-target organisms, soil and water quality, human health, resistance evolution, and biodiversity.
Physical pest control through trapping removes insects without applying a chemical across the entire field. Traps may attract, capture, or physically block a target insect. This approach can reduce pesticide exposure and protect some beneficial organisms, but it may require frequent labor, work only for particular pests, and fail when insect populations are large or widely dispersed.
Some crops are genetically modified so that they are naturally resistant to particular pests. Such crops may reduce the need for broad-spectrum pesticide applications, lowering pesticide runoff and exposure. Possible disadvantages include evolution of resistant pest populations, effects on non-target organisms, reduced genetic diversity if one crop variety dominates, and ecological effects that depend on the specific engineered trait and local environment.
Worked comparison — unmodified and genetically modified plots. Imagine unmodified plants and pest-resistant genetically modified plants grown in separate plots. If the modified plot has fewer insects and requires less pesticide, it may show lower pesticide-related runoff. But soil temperature, nutrient runoff, and sediment runoff must still be measured rather than assumed. A difference in soil temperature could affect decomposition, microbial activity, and water loss; a difference in nutrient or sediment runoff could reflect changes in plant cover, root structure, irrigation, or fertilizer movement—not automatically the genetic modification itself.
Disturbance, decomposition, and ecological recovery
When crops are buried after harvest, decomposers break down the organic material. The nutrients formerly contained in plant tissues return to the soil, renewing soil materials and contributing to nutrient cycling. This process can improve soil fertility, although decomposition does not mean that nutrients can never leach away; heavy irrigation or rainfall may still move them beyond the root zone.
Communities also respond to disturbances such as burning, floods, or the introduction of a new species. A community with greater plant diversity may recover more quickly after flooding because different plants perform different roles: some hold soil with roots, some slow water, some tolerate saturation, and others recolonize exposed ground. More species can therefore provide ecological “backup,” increasing resilience.
Introducing a new beetle species can alter competition, predation, disease transmission, and crop damage. The new beetle may spread rapidly if it lacks local predators or finds abundant food; existing beetles may decline if the newcomer uses the same resources. Planting additional preferred host plants could divert beetles from valuable crops, but it might also increase the beetle population—an example of why proposed solutions require evidence and careful consequence analysis.
AP skills in action
This topic emphasizes 7.C Describe disadvantages, advantages, or unintended consequences for potential solutions: evaluate irrigation, traps, or pest-resistant crops across multiple environmental effects. It also uses 7.E Make a claim that proposes a solution to an environmental problem in an applied context: propose a realistic pest-control method and connect it to the specific mechanism reducing spread or damage.
Data-based investigations additionally draw on 5.E Explain what the data implies or illustrates and 4 Scientific Experiments. A complete claim states the direction of change, cites the measured evidence, and explains the ecological mechanism.
Misconception check: Genetically modified pest-resistant crops are not automatically environmentally harmless, and irrigation is not automatically destructive. The correct evaluation depends on the trait, method, dose, location, controls, and measured outcomes.
Retrieval check: A field receives extra irrigation and shows higher nitrate and sediment runoff. Name the changed variable, identify one likely transport mechanism, and propose one pest- or water-management solution whose advantage and unintended consequence you could test.
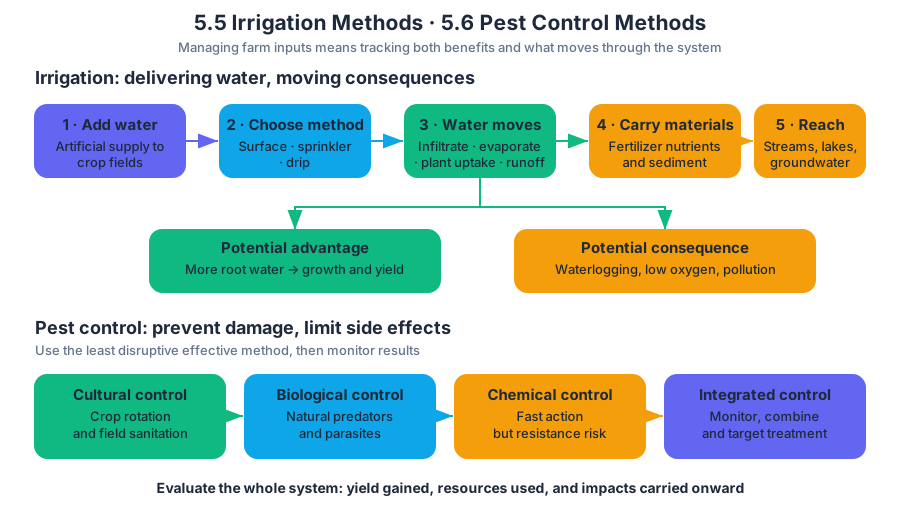
5.7 Meat Production Methods · 5.8 Impacts of Overfishing
Key concepts: Concentrated animal feeding operations (CAFOs) and feedlots · Pasture-based meat production · Rotational grazing · Free-range grazing · Economic efficiency and consumer costs of CAFOs · Environmental benefits and drawbacks of different meat-production methods · Effects of reducing ruminant meat consumption · Greenhouse-gas emissions from livestock, including CO2, CH4, and N2O · Freshwater conservation and reduced reliance on antibiotics and growth hormones · Feed-quality improvements and precision-farming technologies
A kilogram of protein does not have the same environmental cost in every food system: meat production generally requires more land, water, and energy than plant-based protein, but the method used to raise animals strongly changes the outcome.
5.7 Meat Production Methods · 5.8 Impacts of Overfishing
A kilogram of protein does not have the same environmental cost in every food system: meat production generally requires more land, water, and energy than plant-based protein, but the method used to raise animals strongly changes the outcome.
Two production pathways
EIN-2.H — Identify different methods of meat production. The two broad approaches are high-intensity systems, such as feedlots and concentrated animal feeding operations (CAFOs), and pasture-based systems, including rotational grazing and free-range grazing.
CAFOs and feedlots concentrate animals in confined spaces and commonly provide grain- and soy-based feed. Because many animals can be raised near one another, these systems can be economically efficient: large-scale production can lower the cost paid by consumers. The tradeoff is a high concentration of manure, which can contaminate nearby waterways if it is not properly managed.
Pasture-based systems allow animals to feed on grass. In free-range grazing, animals move through available pasture without being kept continuously in a confined feeding area. In rotational grazing, livestock are moved among pasture sections so that one area can recover while another is being used.
Comparing environmental benefits and drawbacks
EIN-2.I — Describe the benefits and drawbacks of different methods of meat production. Meat production is resource-intensive and increases nutrient pollution and greenhouse-gas emissions, including methane. However, environmental impacts vary with the livestock species and the production practices used.
| Method | Potential benefits | Potential drawbacks |
|---|---|---|
| CAFOs/feedlots | Economically efficient; lower consumer costs; concentrated production | Manure concentration can contaminate waterways; grain and soy feed require land, water, and energy |
| Pasture-based grazing | Manure can return nutrients to soil; animals feed on grass | Requires more land; can cost consumers more; dense herds can cause runoff, erosion, and compaction |
| Rotational grazing | Recovery periods can reduce pressure on vegetation and help mitigate overgrazing | Still requires careful management; excessive stocking can exceed the land’s capacity |
| Free-range grazing | Uses pasture rather than continuous confinement | High animal density can degrade soil and vegetation; poorly managed grazing can increase runoff and erosion |
A useful way to compare systems is to follow the movement of nutrients. In a well-managed pasture, manure adds nutrients to soil where plants can use them. In a CAFO, the same waste is concentrated in a smaller area; if storage or application is inadequate, rainfall can carry nutrients into waterways, producing nutrient pollution.
Overgrazing and desertification
Overgrazing occurs when the livestock population exceeds the land’s carrying capacity—the largest population the area can support without long-term damage. Vegetation declines, soil becomes compacted and eroded, soil fertility decreases, biodiversity is reduced, and carbon storage can fall.
In arid and semi-arid regions, persistent overgrazing can contribute to desertification, the degradation of productive land toward desert-like conditions. Restoration, soil conservation, and improved grazing practices—including rotational grazing—can help reverse or limit these effects.
Key distinction: Rotational grazing is not automatically sustainable. It is a management strategy that can reduce damage only when herd size, recovery time, and pasture conditions remain within the land’s carrying capacity.
Worked example: choosing a lower-impact strategy
A ranch is experiencing bare soil and declining grass cover. The owner divides the pasture into four sections and moves cattle between them, allowing unused sections to recover. This is rotational grazing. The environmental reasoning is: lower continuous grazing pressure allows vegetation to regrow; stronger vegetation protects soil from erosion; healthier soil can retain nutrients and store more carbon.
If the owner instead increases the herd until all four sections remain heavily grazed, the system can still produce overgrazing. The label “rotational” does not remove the limiting factor: the livestock population must remain at or below the pasture’s carrying capacity.
Reducing ruminant-meat consumption
EIN-2.I.6 identifies several possible benefits of consuming less meat, especially meat from ruminants such as cattle and sheep. Reduced consumption can lower emissions of carbon dioxide, methane, and nitrous oxide; conserve freshwater resources; and reduce reliance on antibiotics and growth hormones.
The climate connection is not a single-gas problem. A change in production or consumption can affect several gases simultaneously: livestock systems are associated with carbon dioxide, methane, and nitrous oxide emissions, represented as $CO_2$, $CH_4$, and $N_2O$.
Technology—and an important caveat
Improved feed quality can reduce environmental impacts by helping animals obtain more usable nutrition from their feed. Precision-farming technologies can also improve the targeting and efficiency of resource use, reducing waste in production systems.
The benefit of eating less meat is not identical everywhere. It depends on the production method being replaced and on what happens to land no longer used for livestock. Land that is restored to natural vegetation may provide different environmental benefits from land converted to another intensive use.
Misconception check: “Pasture-based meat is always environmentally harmless” and “CAFOs are always environmentally worse” are both oversimplifications. Each system has benefits and drawbacks; management, livestock type, resource use, waste handling, and later land management determine the magnitude of the impact.
AP skill connection: Environmental Solutions
The suggested skill is Environmental Solutions (Science Practice 7). A strong response does more than name a preferred meat-production method: it identifies the environmental problem, explains the mechanism, proposes a strategy such as rotational grazing or improved feed quality, and evaluates tradeoffs such as land requirements, consumer cost, nutrient pollution, and greenhouse-gas emissions.
Retrieval check: Why can rotational grazing reduce environmental damage, and why might it fail? A complete answer should mention pasture recovery and reduced continuous pressure, then explain that excessive herd size can still exceed carrying capacity and cause erosion, compaction, reduced fertility, biodiversity loss, and desertification.
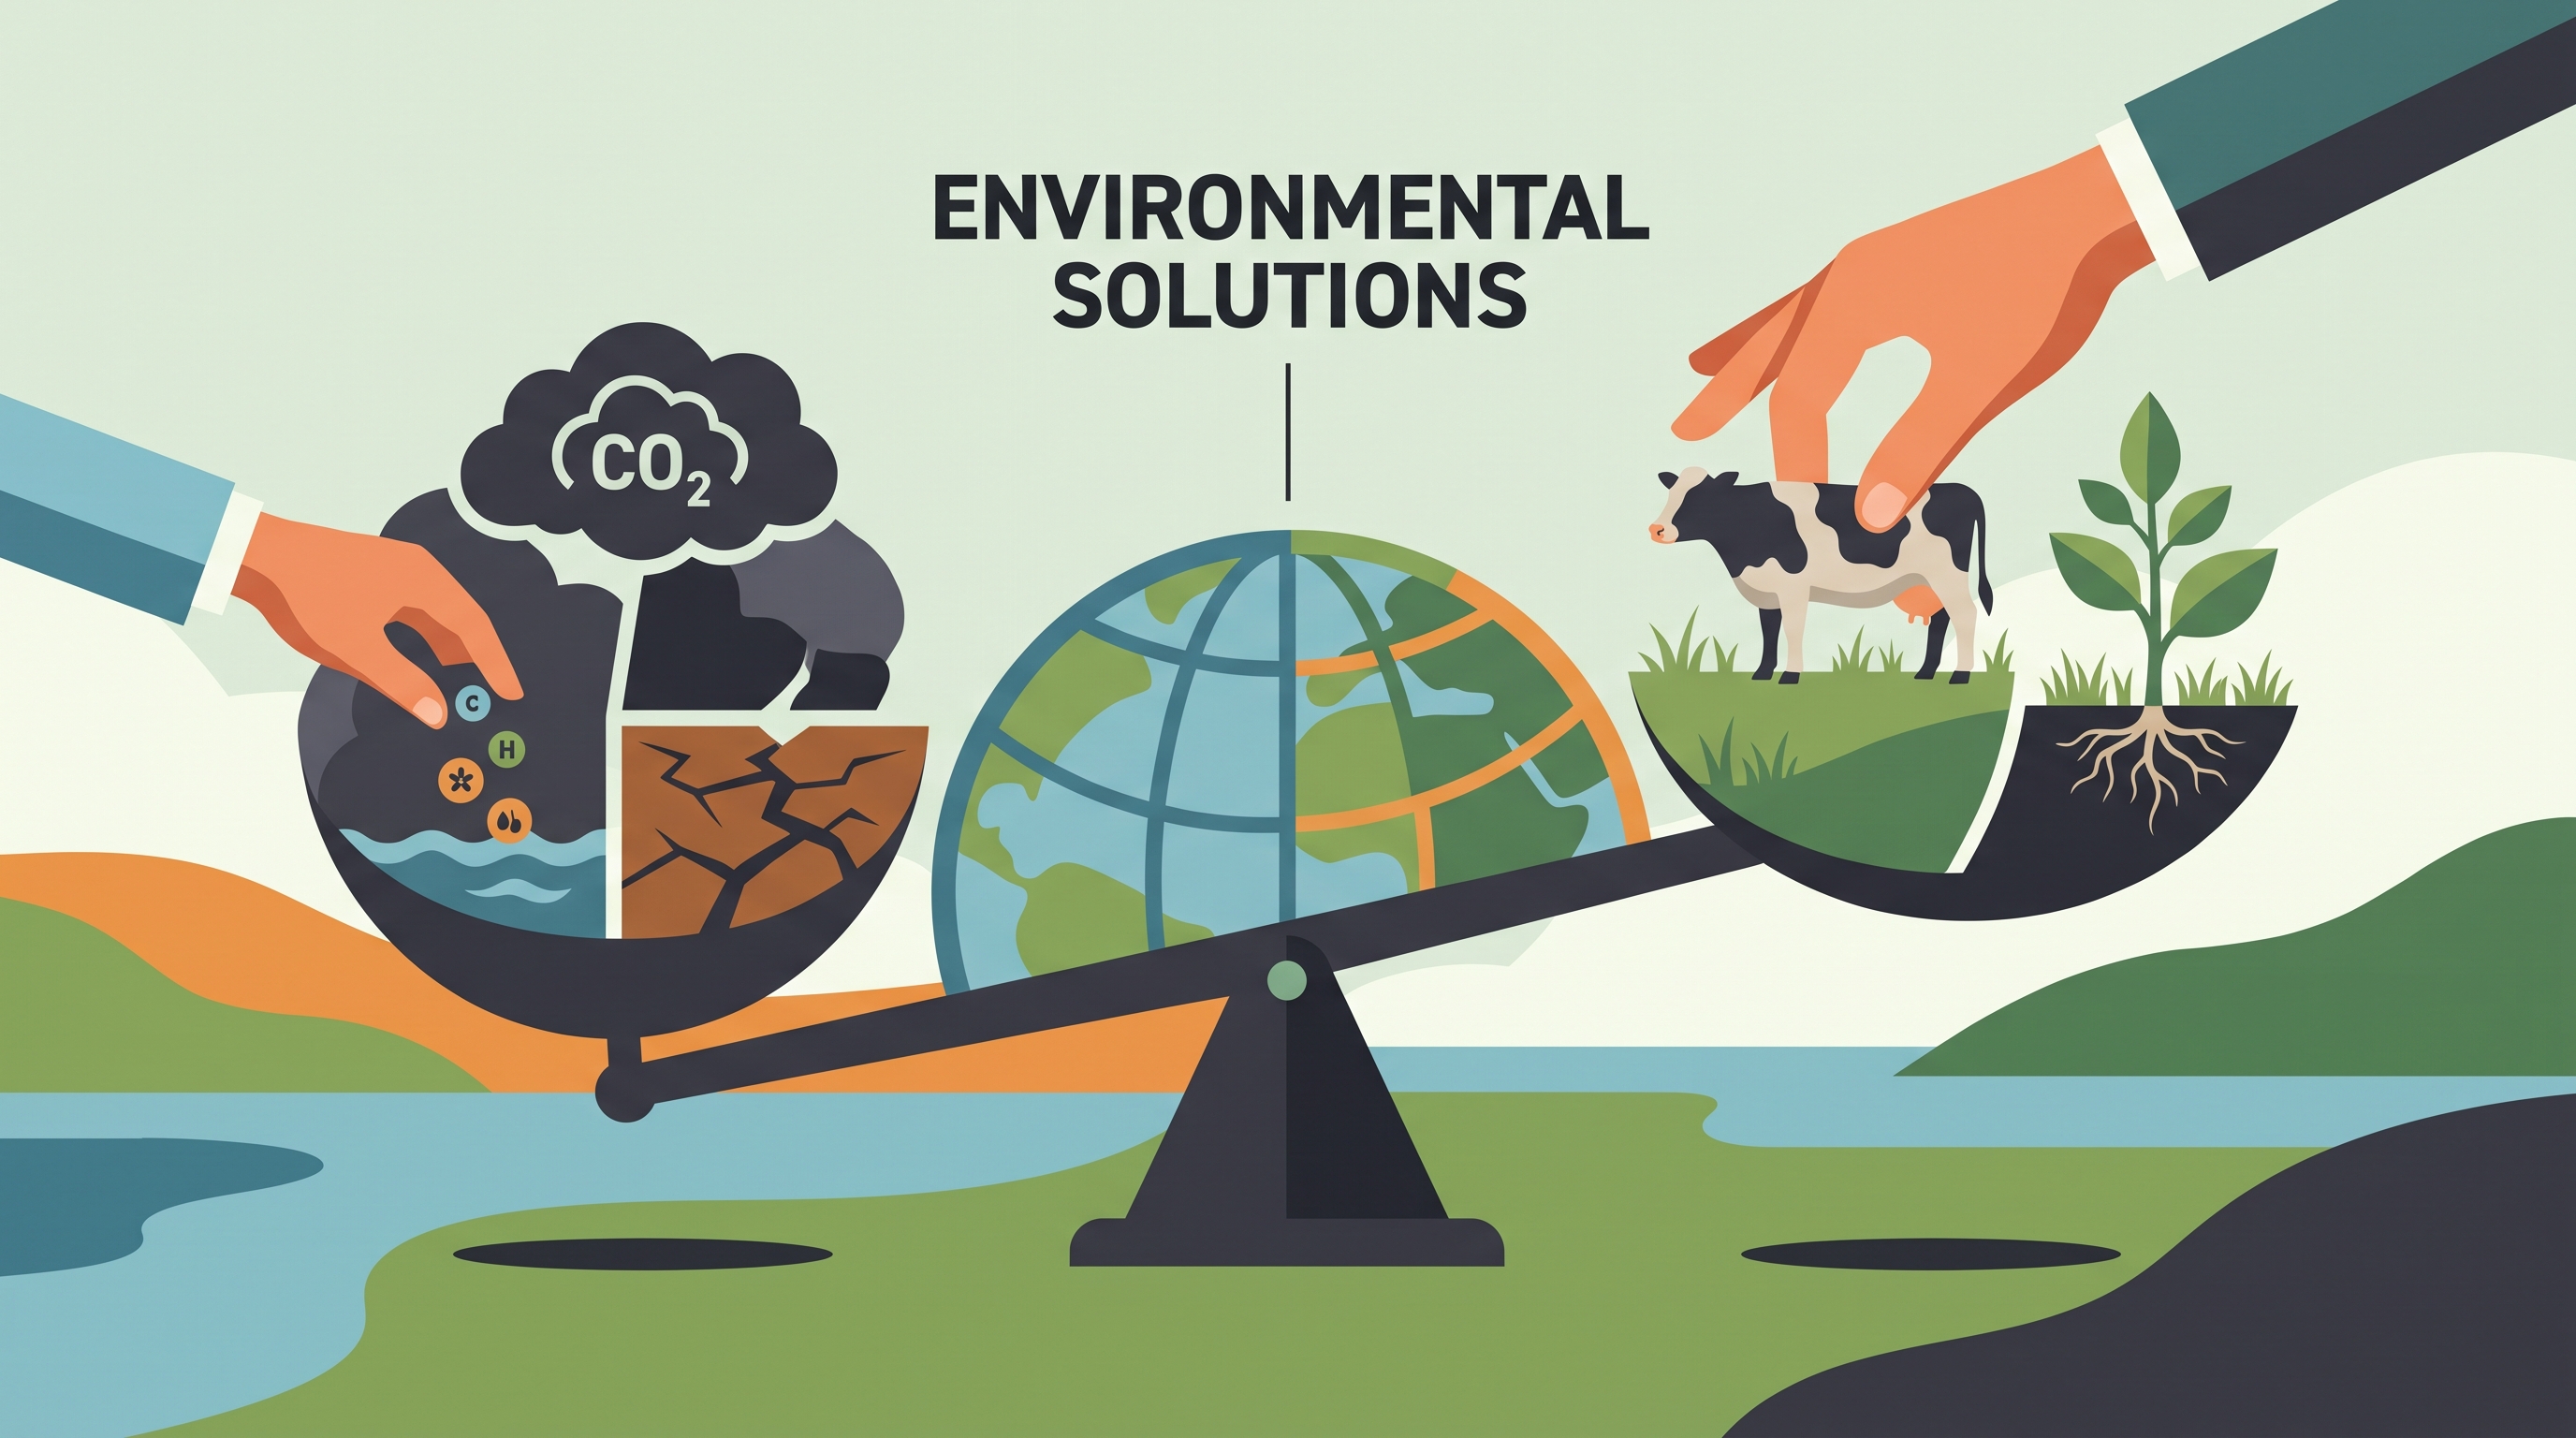
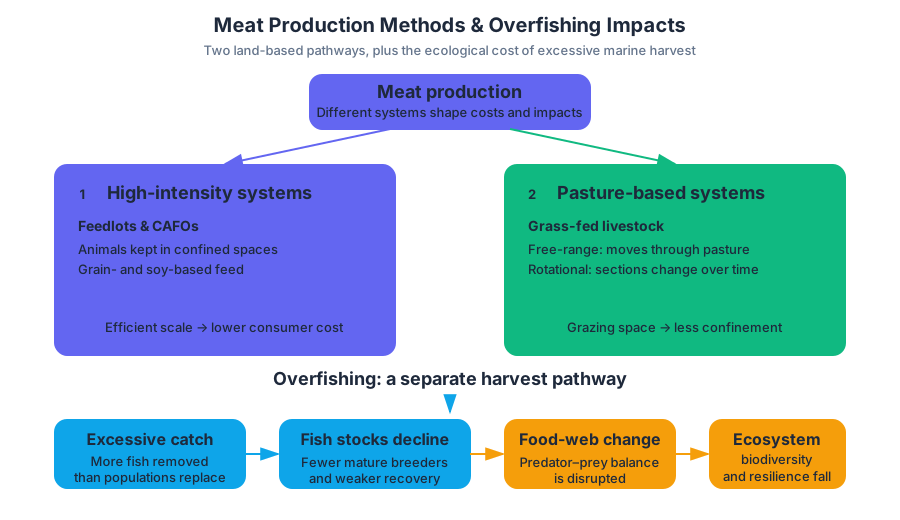
5.9 Impacts of Mining · 5.10 Impacts of Urbanization
Key concepts: Trophic levels · Demographic transition · Climate · Urbanization · Geothermal energy
Mining and urbanization reshape landscapes by moving enormous amounts of rock, soil, water, and energy through human systems. The environmental question is not simply whether these activities are “good” or “bad,” but how their benefits, risks, and long-term costs are distributed across ecosystems and communities.
5.9 Impacts of Mining · 5.10 Impacts of Urbanization
Mining and urbanization reshape landscapes by moving enormous amounts of rock, soil, water, and energy through human systems. The environmental question is not simply whether these activities are “good” or “bad,” but how their benefits, risks, and long-term costs are distributed across ecosystems and communities.
5.9 Impacts of Mining
Mining extracts concentrated deposits of useful geological resources such as coal, metals, petroleum, and minerals. Surface mining removes vegetation, topsoil, and overburden—the rock and soil above a deposit—while subsurface mining reaches deposits through shafts and tunnels.
Mining can produce employment and materials for construction, transportation, electricity generation, and technology. However, the same process can cause habitat loss, soil erosion, sedimentation, groundwater disruption, and contamination from waste rock and tailings, the crushed material left after valuable minerals are separated from ore.
A particularly important pathway is acid mine drainage. When sulfide-containing minerals are exposed to oxygen and water, sulfuric acid can form. The acidic water may dissolve toxic metals, carrying substances such as iron, lead, or mercury into streams. The result can be lower aquatic biodiversity, reduced water quality, and long-term pollution even after a mine closes.
$$ \text{sulfide minerals} + O_2 + H_2O \rightarrow \text{acidic drainage} + \text{dissolved metals} $$
Worked example — a mine-stream food web: Suppose a surface mine removes forest above a stream. Sediment covers aquatic plants and insect habitat, while metal-contaminated runoff enters the water. Aquatic plants occupy a lower trophic level, meaning a feeding position in an ecosystem; insect larvae that eat the plants occupy the next level; fish that eat the larvae occupy a higher level; and a heron that eats the fish occupies an even higher level.
Only a fraction of the energy stored at one trophic level becomes biomass at the next, often approximated by the 10% rule. Thus, habitat loss at the producer level can reduce energy available to every higher consumer. If a persistent metal is also transferred through the food web, its concentration may increase at higher trophic levels through biomagnification, exposing fish-eating birds and mammals to the greatest risk.
Misconception check — “higher trophic levels contain more energy.” They do not. Higher levels generally contain less available energy and biomass, although persistent pollutants can become more concentrated in organisms at those levels. Mining therefore affects food webs both by removing habitat and by altering the movement of matter through the ecosystem.
5.10 Impacts of Urbanization
Urbanization is the growth of cities as people and infrastructure become concentrated in urban areas. It often replaces permeable soil and vegetation with roads, rooftops, parking lots, and buildings. These impervious surfaces increase stormwater runoff, carrying oil, metals, nutrients, sediment, and pathogens into waterways.
Urban areas also modify local climate. Concrete and asphalt absorb solar energy and release it slowly, producing the urban heat-island effect: cities are often warmer than surrounding rural areas. Tall buildings can reduce wind movement, while energy use and vehicle emissions add heat and air pollutants. Vegetation, shade trees, reflective roofs, green roofs, and public transportation can reduce these effects.
The connection between population change and urban growth becomes clearer through the demographic transition—the shift from high birth and death rates to low birth and death rates as a society develops.
| Stage | Birth rate | Death rate | Population and urban pattern |
|---|---|---|---|
| Preindustrial | High | High and variable | Slow growth; mostly rural |
| Transitional | Remains high, then declines | Declines rapidly | Rapid population growth; migration toward cities accelerates |
| Industrial | Declines | Low | Growth slows; urban population expands |
| Postindustrial | Low | Low | Stable or declining population; highly urbanized |
During the transitional stage, improved sanitation, medicine, and food supply can lower death rates before families reduce birth rates. Population growth therefore accelerates, and rural-to-urban migration increases demand for housing, water, electricity, transportation, and waste treatment. If infrastructure cannot keep pace, informal settlements, contaminated water, traffic pollution, and flood risk may increase.
Worked example — urban flooding: A city replaces a wetland and nearby fields with a housing development. Rainwater that once infiltrated the soil now runs rapidly across pavement into a stream. The lost wetland no longer stores floodwater or traps sediment, so downstream flooding and turbidity increase. Restoring wetlands, installing permeable pavement, planting urban trees, and constructing rain gardens can reduce runoff while improving local climate conditions.
Geothermal Energy in Urban and Mining Regions
Geothermal energy uses heat from Earth’s interior. Wells can bring hot water or steam to the surface to drive a turbine and generate electricity; lower-temperature geothermal systems can directly heat buildings or use heat pumps to move heat between buildings and the ground.
Geothermal power provides a relatively reliable renewable energy source with low operational greenhouse-gas emissions and a small land footprint compared with some large energy facilities. It can support urban electricity or district heating, especially where hot groundwater or accessible underground heat is available.
Its limitations are location, drilling cost, induced seismic activity, subsidence, and the possible release of dissolved gases or minerals in geothermal fluids. Poorly managed fluids can also contaminate groundwater. In a mining region, geothermal development may reuse energy infrastructure or provide an alternative to fossil-fuel electricity, but it does not automatically repair mining damage or eliminate the need for careful environmental assessment.
Science-practice connection: These topics use Science Practice 1: Concept Explanation when linking mining to acid drainage or urbanization to runoff; Science Practice 2: Visual Representations when interpreting food webs, demographic-transition graphs, or land-use diagrams; Science Practice 5: Data Analysis when evaluating pollution or population trends; Science Practice 6: Mathematical Routines when calculating percent change or energy transfer; and Science Practice 7: Environmental Solutions when comparing reclamation, green infrastructure, public transit, or geothermal energy.
Retrieval check: A city’s population is growing rapidly, pavement is expanding, and a nearby mine releases metal-contaminated runoff. Name one demographic process, one urban-climate or runoff effect, one trophic-level consequence, and one limitation of geothermal energy that planners should evaluate.
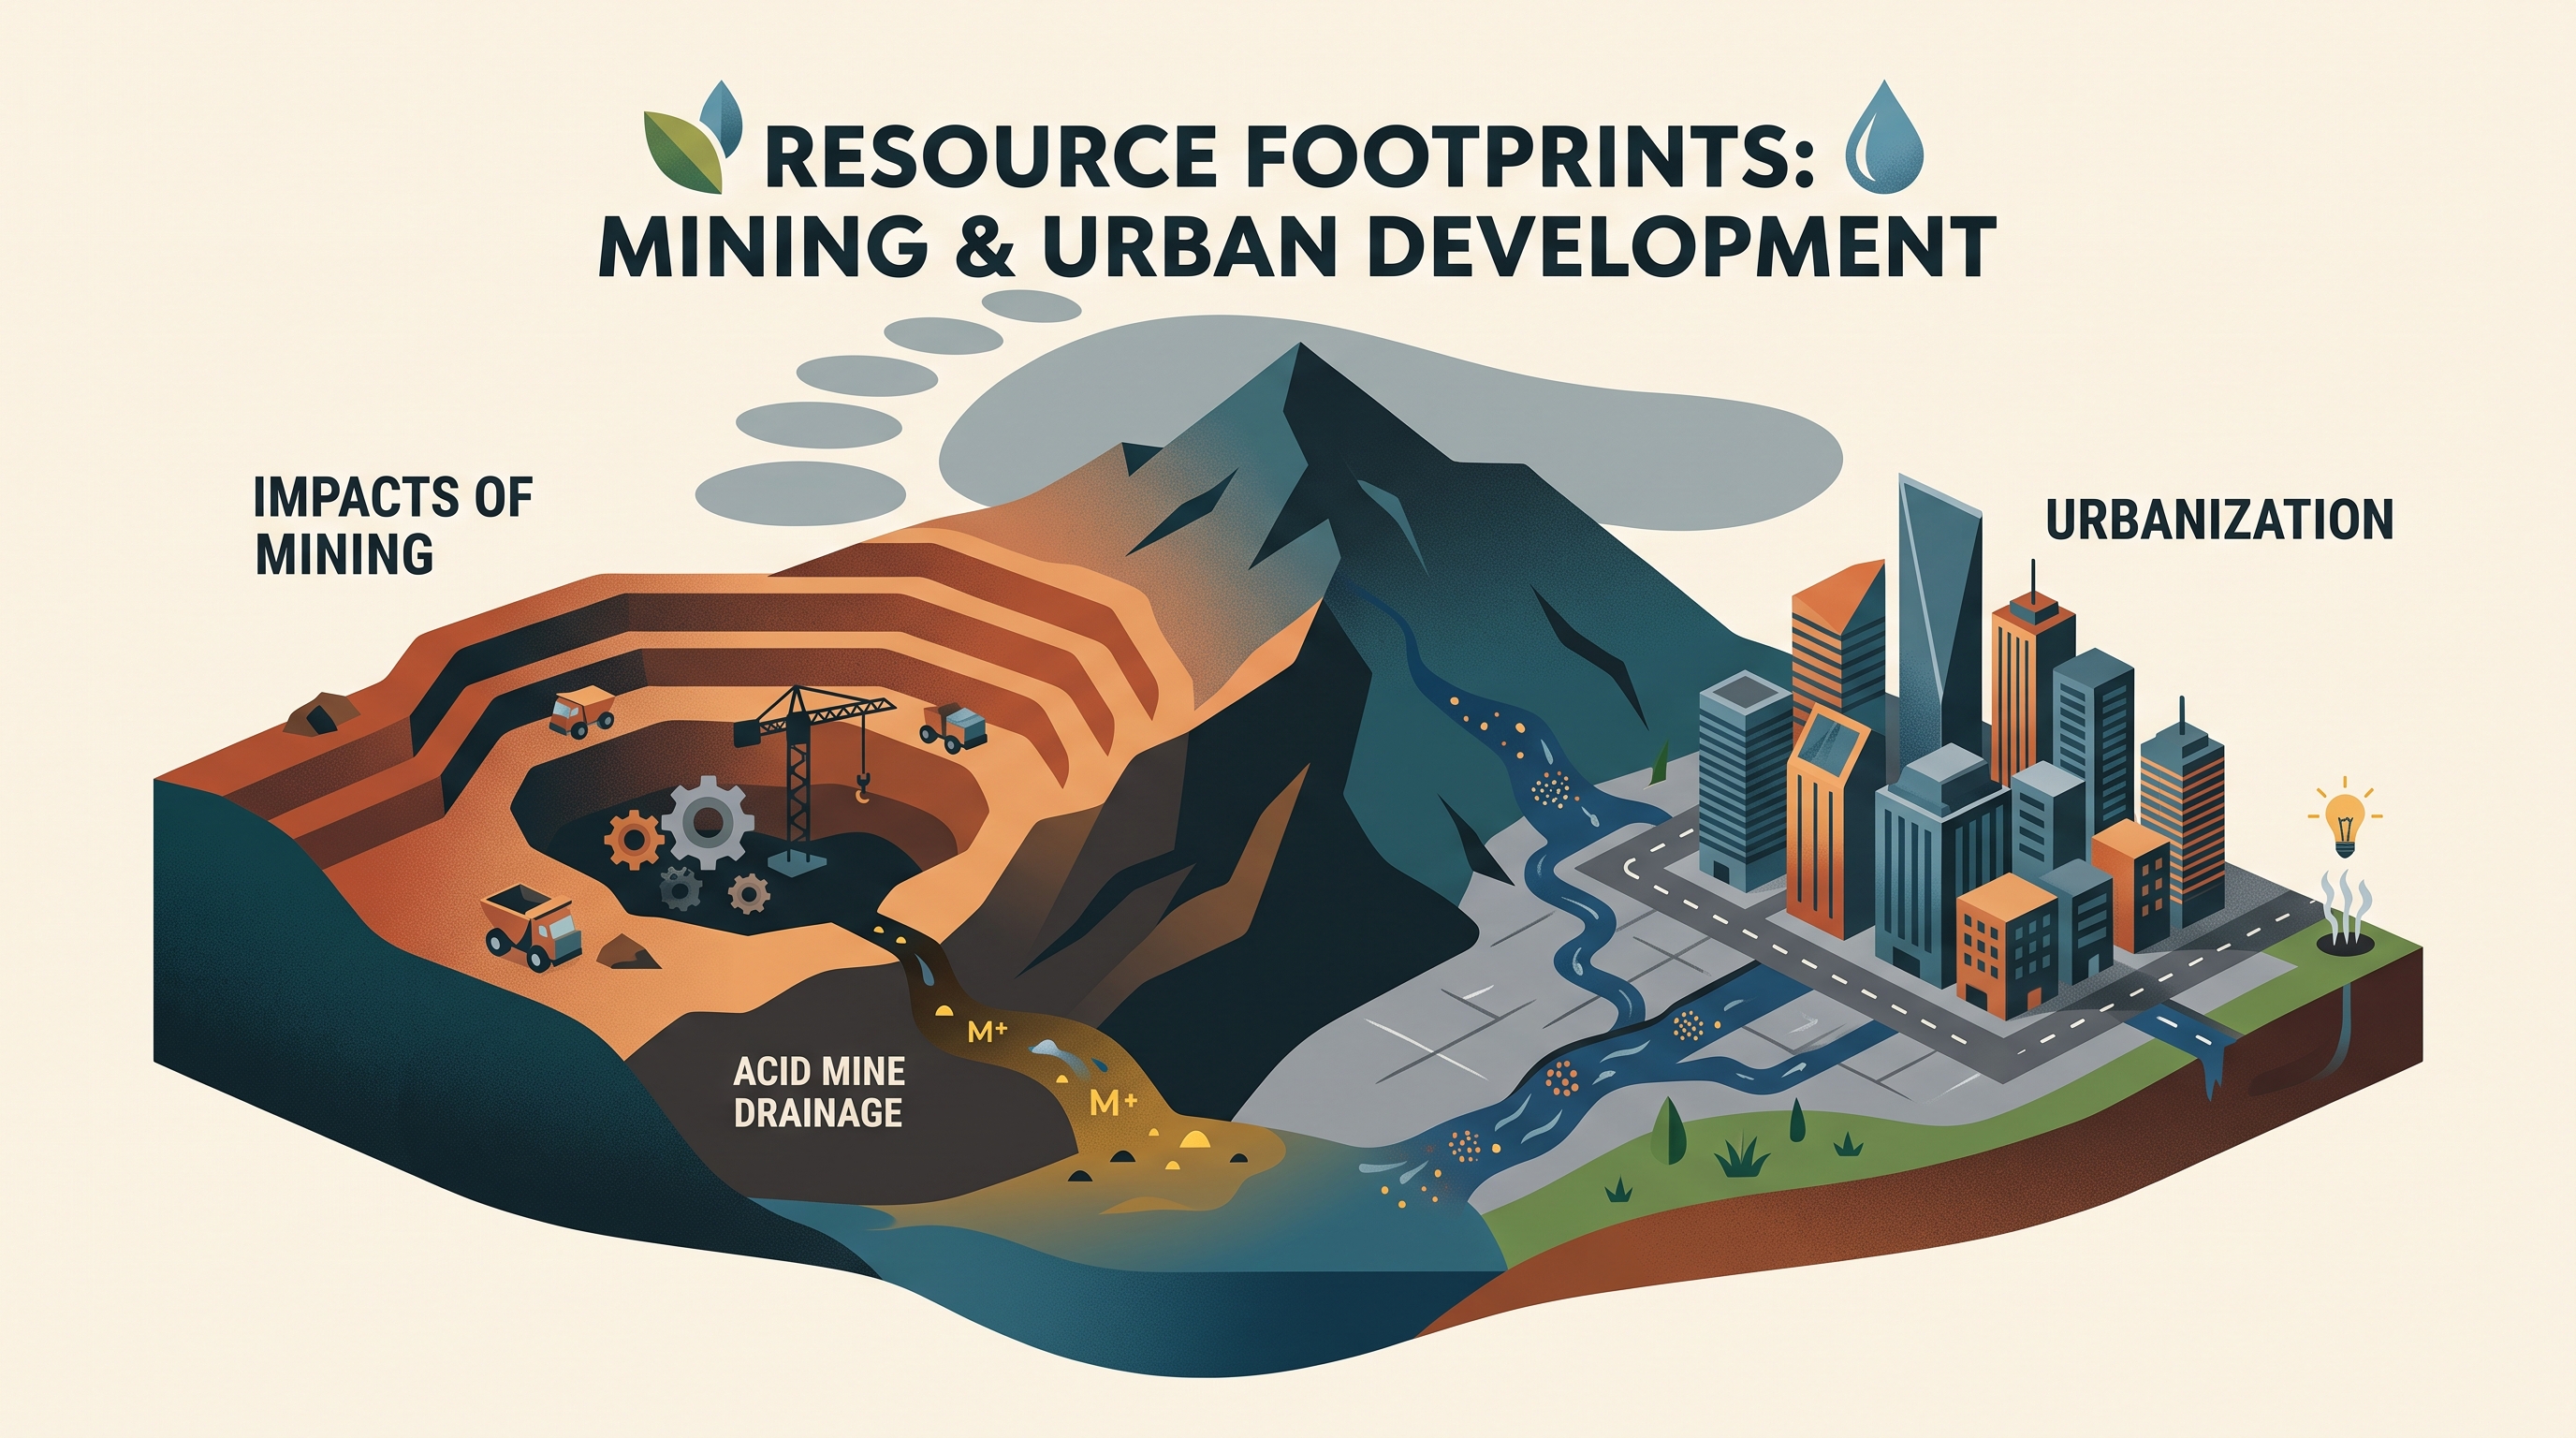
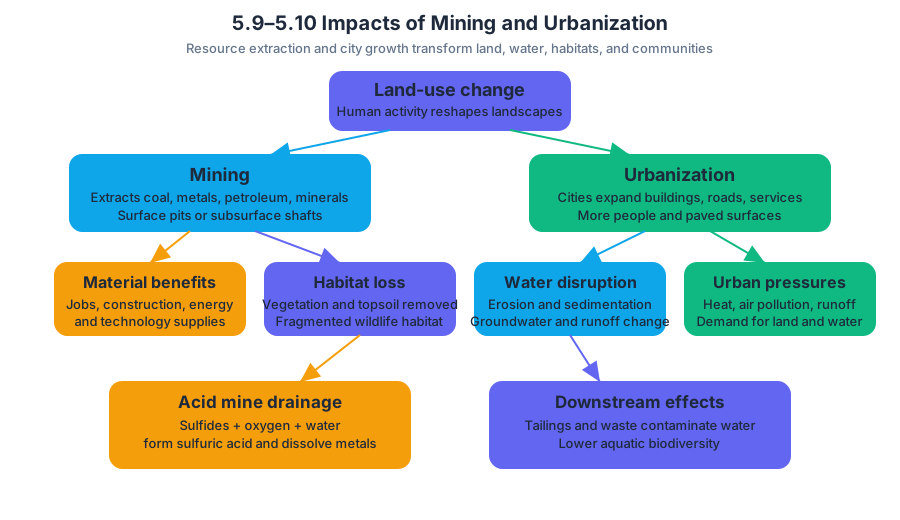
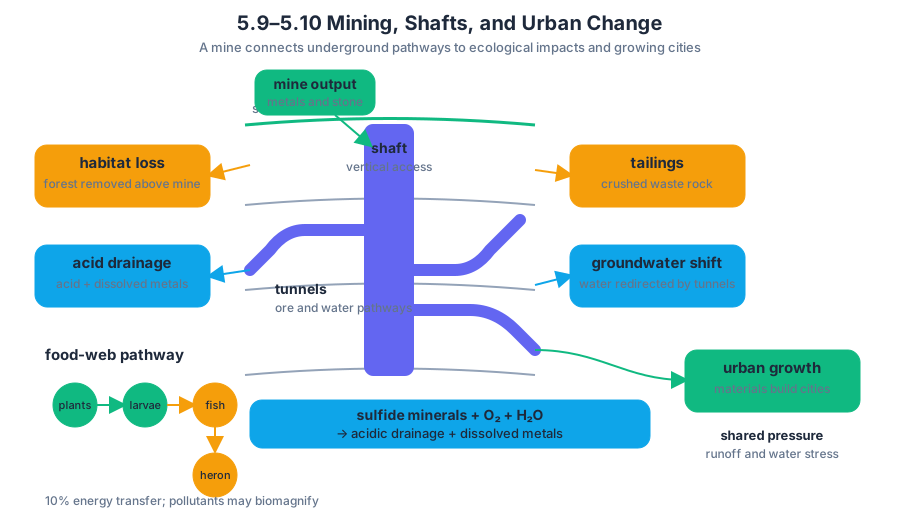
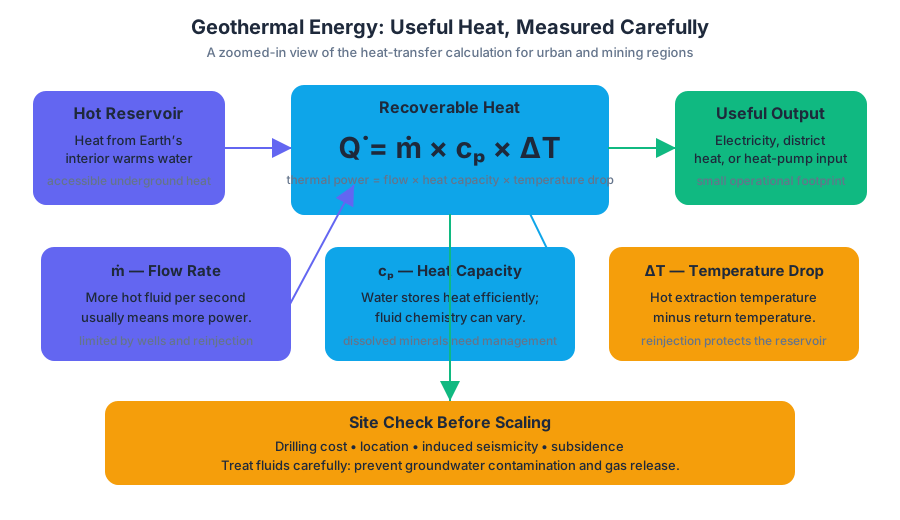
5.11 Ecological Footprints · 5.12 Introduction to Sustainability
Key concepts: Ecological footprints · Human use of natural resources · Natural-system alteration · Resource demands and waste production · Individual and societal environmental impacts · Land and water use · Climate impacts · Introduction to sustainability · Impacts of urbanization
Every meal, building, trip, and manufactured object depends on natural resources—and using those resources alters natural systems. An ecological footprint estimates the resource demands and waste production associated with an individual or society, including demands on land and water.
5.11 Ecological Footprints · 5.12 Introduction to Sustainability
Every meal, building, trip, and manufactured object depends on natural resources—and using those resources alters natural systems. An ecological footprint estimates the resource demands and waste production associated with an individual or society, including demands on land and water.
From resource use to environmental impact
Natural systems supply materials and absorb some wastes. When human demand exceeds the ability of those systems to regenerate resources or process wastes, the system is altered. The alteration may involve habitat conversion, reduced water availability, soil degradation, atmospheric pollution, or increased greenhouse-gas emissions.
An ecological footprint therefore does not simply count how much someone buys. It connects consumption to the productive land and water needed to provide resources and to handle associated waste. A society with high material and energy use generally places greater demands on natural systems than a society with lower per-person consumption, although total population also affects the overall impact.
Ecological footprint: A measure of the resource demands and waste production associated with an individual or a society, including the land and water use required to support those demands.
The footprint idea is especially useful because environmental impacts are often hidden. A city may occupy a relatively small physical area while depending on distant agricultural land, water supplies, forests, mines, and energy systems. Its ecological footprint can therefore be much larger than the area visible on a map.
Worked example: comparing two households
Suppose Household A frequently purchases resource-intensive foods, drives long distances, uses substantial electricity, and discards most household waste. Household B uses less electricity, travels fewer miles, purchases fewer resource-intensive goods, and produces less waste. Household A will tend to have a larger ecological footprint because its lifestyle requires greater resource extraction, more supporting land and water use, and greater waste processing.
The reasoning chain is:
- Human activity: Household A consumes more goods, transportation fuel, and electricity.
- Resource demand: More energy, raw materials, land, and water are required to support that consumption.
- Waste production: More discarded materials and emissions are generated.
- Natural-system alteration: Extraction, production, disposal, and emissions place greater pressure on ecosystems.
- Environmental consequence: The household contributes more to cumulative impacts, including climate-related impacts when energy use releases greenhouse gases.
This comparison does not mean that one household alone determines environmental conditions. Individual choices accumulate across communities and societies, while infrastructure, income, technology, and access to alternatives influence the choices people can make.
Land, water, and climate connections
Land and water use are central to ecological footprints. Food production requires productive land and freshwater; housing and transportation occupy or transform land; manufacturing requires water and raw materials; and waste disposal requires space and management. These demands can compete with the needs of other species and with the ability of ecosystems to maintain their functions.
Energy use adds another pathway. When fossil fuels are burned to provide electricity, transportation, or industrial heat, greenhouse gases are released. Thus, an ecological footprint is connected to climate-related environmental impacts through the resource and energy demands that accompany human consumption.
Named misconception — “A small city has a small footprint.” Physical area and ecological footprint are different measurements. A densely built city may cover little land but depend on extensive external land and water systems for food, energy, materials, and waste management.
5.12 Sustainability
Sustainability means humans living on Earth and using resources without depleting those resources for future generations. The definition adds a time dimension: a practice is not sustainable merely because it meets present needs if it undermines the ability of future people to meet theirs.
CED Essential Knowledge STB-1.A.1: Sustainability refers to humans living on Earth and their use of resources without depletion of the resources for future generations.
Sustainability requires examining both benefits and limits: how much land and water a practice uses, how much waste it produces, whether natural systems can recover, and whether environmental burdens and benefits are distributed fairly. It is therefore broader than “using less.” A durable solution must meet human needs while maintaining the natural systems that provide resources and absorb wastes.
Urbanization illustrates why this balance matters. Concentrating people and infrastructure can increase demand for energy, materials, land, and water, but planning decisions determine how large those demands become and how much waste is generated. The relevant sustainability question is not whether urbanization exists, but whether human settlements operate within environmental limits over time.
Misconception check: Sustainability does not mean eliminating all human resource use. Humans must use resources; sustainability means using them without depleting the systems and supplies needed by future generations.
Retrieval check
A community reduces household waste but expands water-intensive consumption and electricity use from fossil fuels. Has its ecological footprint necessarily decreased? Explain using resource demands, waste production, land and water use, and the connection between energy use and climate-related environmental impacts.
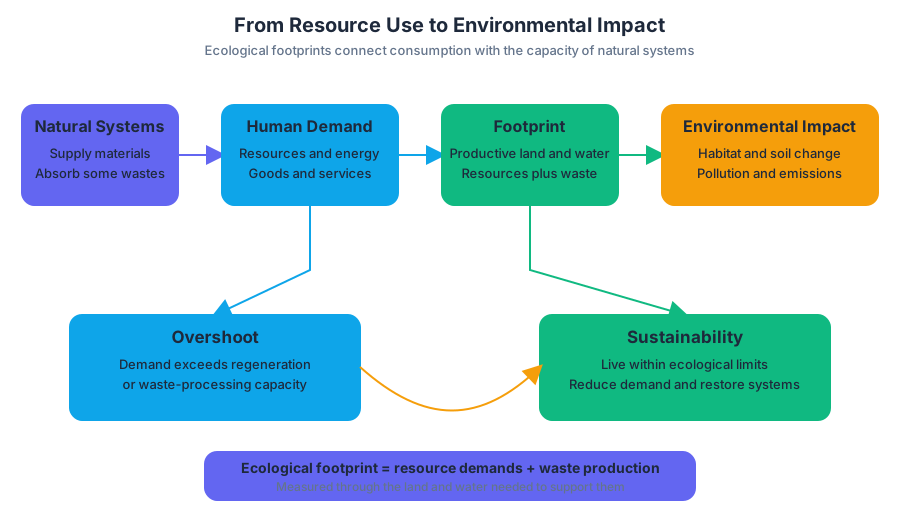
5.13 Methods to Reduce Urban Runoff · 5.14 Integrated Pest Management
Key concepts: Methods to reduce urban runoff · Permeable pavement · Planting trees · Increased use of public transportation · Integrated pest management (IPM) · Combining methods to control pest species · Minimizing disruption to human health and the environment · Advantages and drawbacks of IPM
Urban runoff increases when rain falls on hard, impervious surfaces and cannot soak into the ground. Two powerful environmental solutions address this problem from different directions: redesigning human infrastructure to manage water, and combining pest-control methods to reduce harm to people and ecosystems.
5.13 Methods to Reduce Urban Runoff · 5.14 Integrated Pest Management
Urban runoff increases when rain falls on hard, impervious surfaces and cannot soak into the ground. Two powerful environmental solutions address this problem from different directions: redesigning human infrastructure to manage water, and combining pest-control methods to reduce harm to people and ecosystems.
5.13 Methods to Reduce Urban Runoff
Urban runoff is water from rain or melting snow that flows across streets, roofs, parking lots, and other surfaces instead of infiltrating into soil. Traditional pavement accelerates this flow because water cannot pass through it easily. The result can include heavier stormwater flows, erosion, transport of pollutants, and greater pressure on drainage systems.
Replacing traditional pavement with permeable pavement can help mitigate urban runoff by allowing more water to pass through the surface and enter the ground.
Permeable pavement does not make rainfall disappear. Instead, it changes the pathway: rather than sending most precipitation immediately into a storm drain, the surface allows some water to move downward. This can reduce the volume and speed of surface flow, especially when permeable areas are combined with soil and vegetation that can absorb water.
Planting trees is another method for reducing urban runoff. Tree canopies intercept rainfall before it reaches the ground, while roots and surrounding soil help increase infiltration. Trees therefore affect both the amount of water reaching pavement and the movement of water through the soil.
A broader urban strategy is increasing the use of public transportation. Public transportation can reduce the number of individual vehicles and the amount of land devoted to roads and parking. Because roads and parking areas are impervious surfaces, reducing the need to expand them can reduce runoff and related environmental impacts. A related planning idea is building up, not out: compact development can limit the spread of pavement across previously undeveloped land.
Worked example: redesigning a neighborhood
Suppose a neighborhood floods after intense storms. Planners replace a conventional parking area with permeable pavement, plant trees along the streets, and improve bus service so fewer residents need separate cars. The strongest explanation is not that one action “solves flooding”; rather, each action changes a different part of the runoff system:
- Permeable pavement increases the opportunity for infiltration.
- Trees intercept rainfall and help water enter soil.
- Public transportation can reduce pressure to construct additional roads and parking areas.
- Compact development limits the conversion of open land into impervious surface.
Under AP Skill 7.D: Environmental Solutions, the evidence must support a potential solution. A strong response would identify a measurable outcome—such as reduced runoff volume or lower peak flow after storms—then compare data from before and after the intervention, or compare treated and untreated areas. The solution is supported when the observed evidence matches the proposed mechanism.
Misconception check: “Planting trees prevents all urban flooding.”
Correction: Trees can reduce runoff, but their effect depends on rainfall intensity, soil conditions, tree coverage, and the amount of impervious surface remaining.
5.14 Integrated Pest Management
Integrated pest management (IPM) is a combination of methods used to effectively control pest species while minimizing disruption to human health and the environment. Instead of depending on one control method—especially repeated conventional pesticide use—IPM combines approaches and selects them according to the pest problem and available evidence.
The central trade-off is practical: IPM can have advantages compared with conventional pest control because it is designed to reduce unwanted environmental and health effects, but it can also be complex and expensive. Effective implementation may require monitoring, identifying the pest accurately, evaluating multiple control options, and coordinating several methods rather than applying one immediate treatment.
Worked example: a crop pest outbreak
A vegetable farm discovers that a pest species is damaging leaves. A conventional response might apply a pesticide immediately. An IPM response first gathers evidence about the pest and the extent of damage, then combines suitable control methods—for example, physical removal, biological control, habitat changes, or carefully limited chemical treatment when needed.
The reasoning is important: IPM does not mean “never use pesticides.” It means that pest control is treated as a decision problem in which several methods are combined to control the pest effectively while minimizing disruption to human health and the environment.
Misconception check: “IPM is simply organic pest control.”
Correction: IPM is a strategy for combining methods and reducing harm; it is not defined by whether every method is organic or chemical-free.
The CED identifier STB-1.D.1 connects this topic to the use of integrated pest management. When evaluating an IPM proposal, explain both sides of the solution: identify the environmental or health advantage, and acknowledge that monitoring and coordination can make IPM more complex and expensive than a single conventional treatment.
Retrieval check
A city proposes permeable pavement, street trees, expanded bus service, and an IPM program for municipal gardens. Identify one mechanism by which each runoff strategy reduces environmental impact, then explain why IPM is described as a combination of methods rather than a single treatment. Finally, name one type of evidence that could be used under AP Skill 7.D: Environmental Solutions to evaluate whether the runoff plan worked.
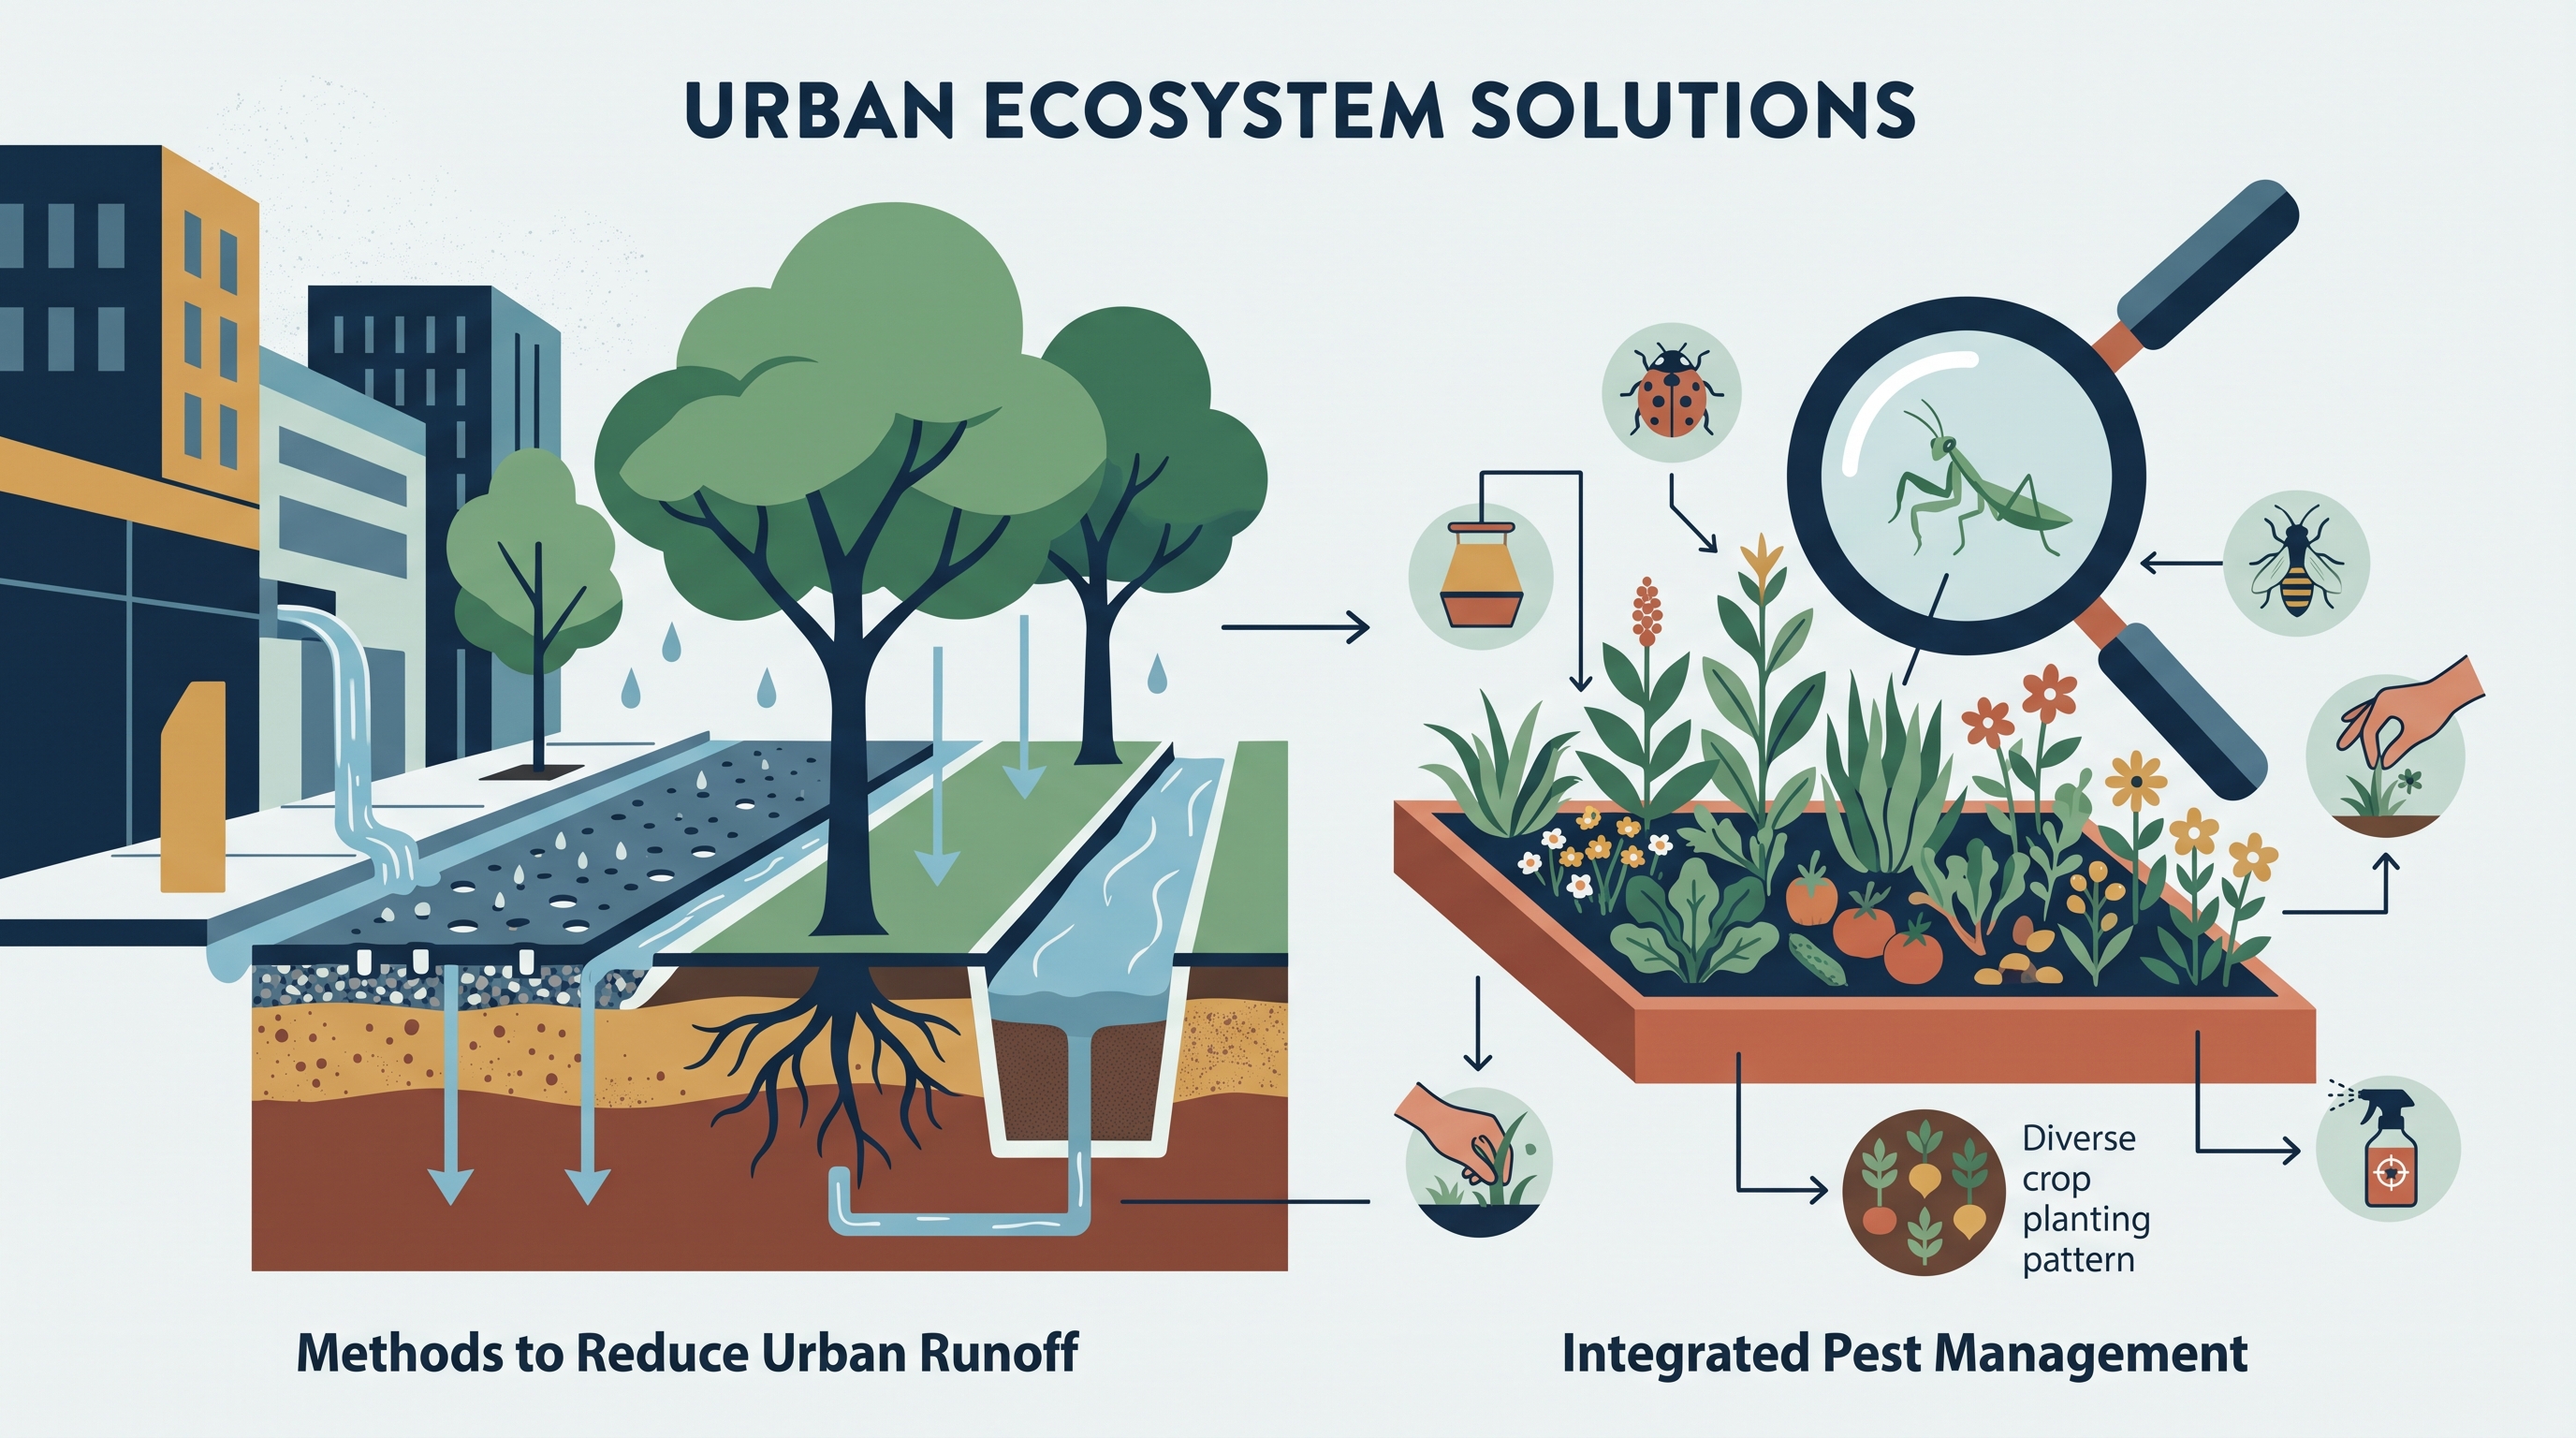
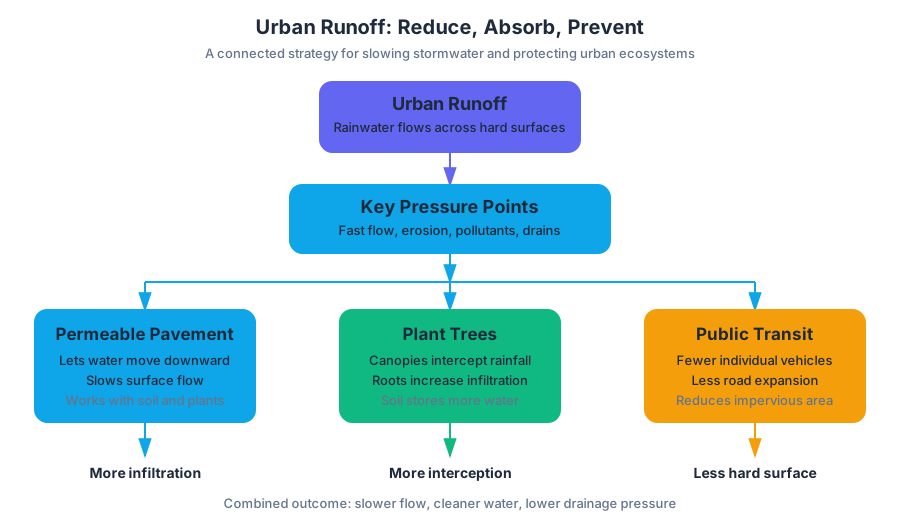
5.15 Sustainable Agriculture · 5.16 Aquaculture
Key concepts: Sustainable agriculture · Aquaculture · Sustainable farming techniques · Soil integrity · Land degradation · Plant agriculture · Livestock agriculture · Interactions
Agriculture is sustainable when it produces food while maintaining the soil, water, and ecological systems that future production depends on. The central question is practical: How can farming supply food without exhausting the land that grows it?
5.15 Sustainable Agriculture · 5.16 Aquaculture
Agriculture is sustainable when it produces food while maintaining the soil, water, and ecological systems that future production depends on. The central question is practical: How can farming supply food without exhausting the land that grows it?
Sustainable agriculture: farming without spending the soil
Sustainable agriculture uses farming methods that maintain soil integrity—the soil’s ability to support plant growth, store water, cycle nutrients, and resist erosion—and prevent land degradation, the long-term decline of land quality. A farm may produce a large harvest in one year yet be unsustainable if it removes topsoil, depletes nutrients, increases erosion, or contaminates nearby water.
For plant agriculture, standard sustainable techniques include:
- Crop rotation: changing the crop grown in a field across seasons can interrupt pest cycles and prevent repeated depletion of the same nutrients.
- Perennial plants: plants that live for multiple years keep roots in the soil longer, reducing erosion and improving soil structure.
- Terracing: shaping steep land into level steps slows water flow and reduces soil loss.
- Contour plowing or contour farming: plowing across a slope rather than straight up and down creates ridges that slow runoff.
- No-till farming: planting without repeatedly turning the soil leaves residues and soil structure in place, reducing erosion.
- Cover crops: crops planted between harvests protect bare soil, absorb nutrients, and add organic matter when they decompose.
These techniques are not simply “natural” alternatives to conventional farming. Their environmental value comes from the mechanism they change: slower runoff, stronger root systems, less exposed soil, improved nutrient retention, or reduced disturbance.
Livestock and soil integrity
Livestock agriculture can also be managed sustainably. Rotational grazing moves animals among pasture areas so vegetation has time to recover; this limits overgrazing, protects plant roots, and reduces soil compaction and erosion. Responsible manure management stores or applies manure in ways that prevent nutrient-rich runoff from entering streams, where nitrogen and phosphorus can contribute to eutrophication.
Livestock therefore connects soil management to ecosystem interactions: poorly managed animals can remove vegetation, compact soil, increase sedimentation, and add nutrients or biological contaminants to water, while well-managed grazing and manure systems can reduce those pressures.
Worked example: choosing a soil-conservation solution
A farmer cultivates a steep field where heavy rain carries muddy water into a stream. The farmer wants to maintain crop production while preventing land degradation. Contour farming is a defensible solution because furrows that follow the land’s contour interrupt the downhill movement of water, reducing runoff speed and soil erosion. Terracing or switching some acreage to perennial plants could serve the same goal through different mechanisms.
A strong environmental-solution claim follows the chain:
Practice → environmental mechanism → desired outcome
For example: The farmer should use contour farming because the horizontal furrows slow water moving downslope, reducing topsoil loss and sediment entering the stream.
AP Science Practice 7.E — Make a claim that proposes a solution to an environmental problem in an applied context. A claim earns strength when it names a specific practice and explains why that practice addresses the stated environmental problem.
5.16 Aquaculture
Aquaculture is the controlled cultivation of aquatic organisms, such as fish, shellfish, or aquatic plants, for food or other uses. It can reduce pressure on some wild populations by producing organisms in ponds, tanks, cages, or managed coastal areas, but its environmental outcome depends on how the system is designed and operated.
Potential advantages include a more predictable food supply and reduced harvesting of wild organisms. Potential disadvantages include waste and excess nutrients released into surrounding water, disease transmission, escape of farmed organisms, habitat damage, and resource use for feed or energy. A closed or carefully monitored system can limit some impacts; poorly managed aquaculture can concentrate them.
AP Science Practice 7.C — Describe advantages, disadvantages, or trade-offs of environmental solutions. For aquaculture, avoid labeling the practice automatically “good” or “bad.” Compare the benefit of producing food with the possible costs to water quality, biodiversity, habitat, and nearby ecosystems.
Misconception check
Misconception: “Any farming technique called sustainable prevents every environmental problem.” Correction: sustainability is context-dependent. No-till farming may reduce erosion, but a farm can still face nutrient loss or water scarcity. Aquaculture may reduce pressure on wild fisheries, but it can still create localized pollution or disease risks. The correct answer identifies the specific environmental pressure and the mechanism that addresses it.
Retrieval check
A field on a steep slope is losing topsoil, while an aquaculture facility is releasing nutrient-rich water. Name one sustainable farming technique for the field and explain its soil-conservation mechanism. Then state one advantage and one disadvantage of aquaculture, identifying the ecosystem affected in each case.
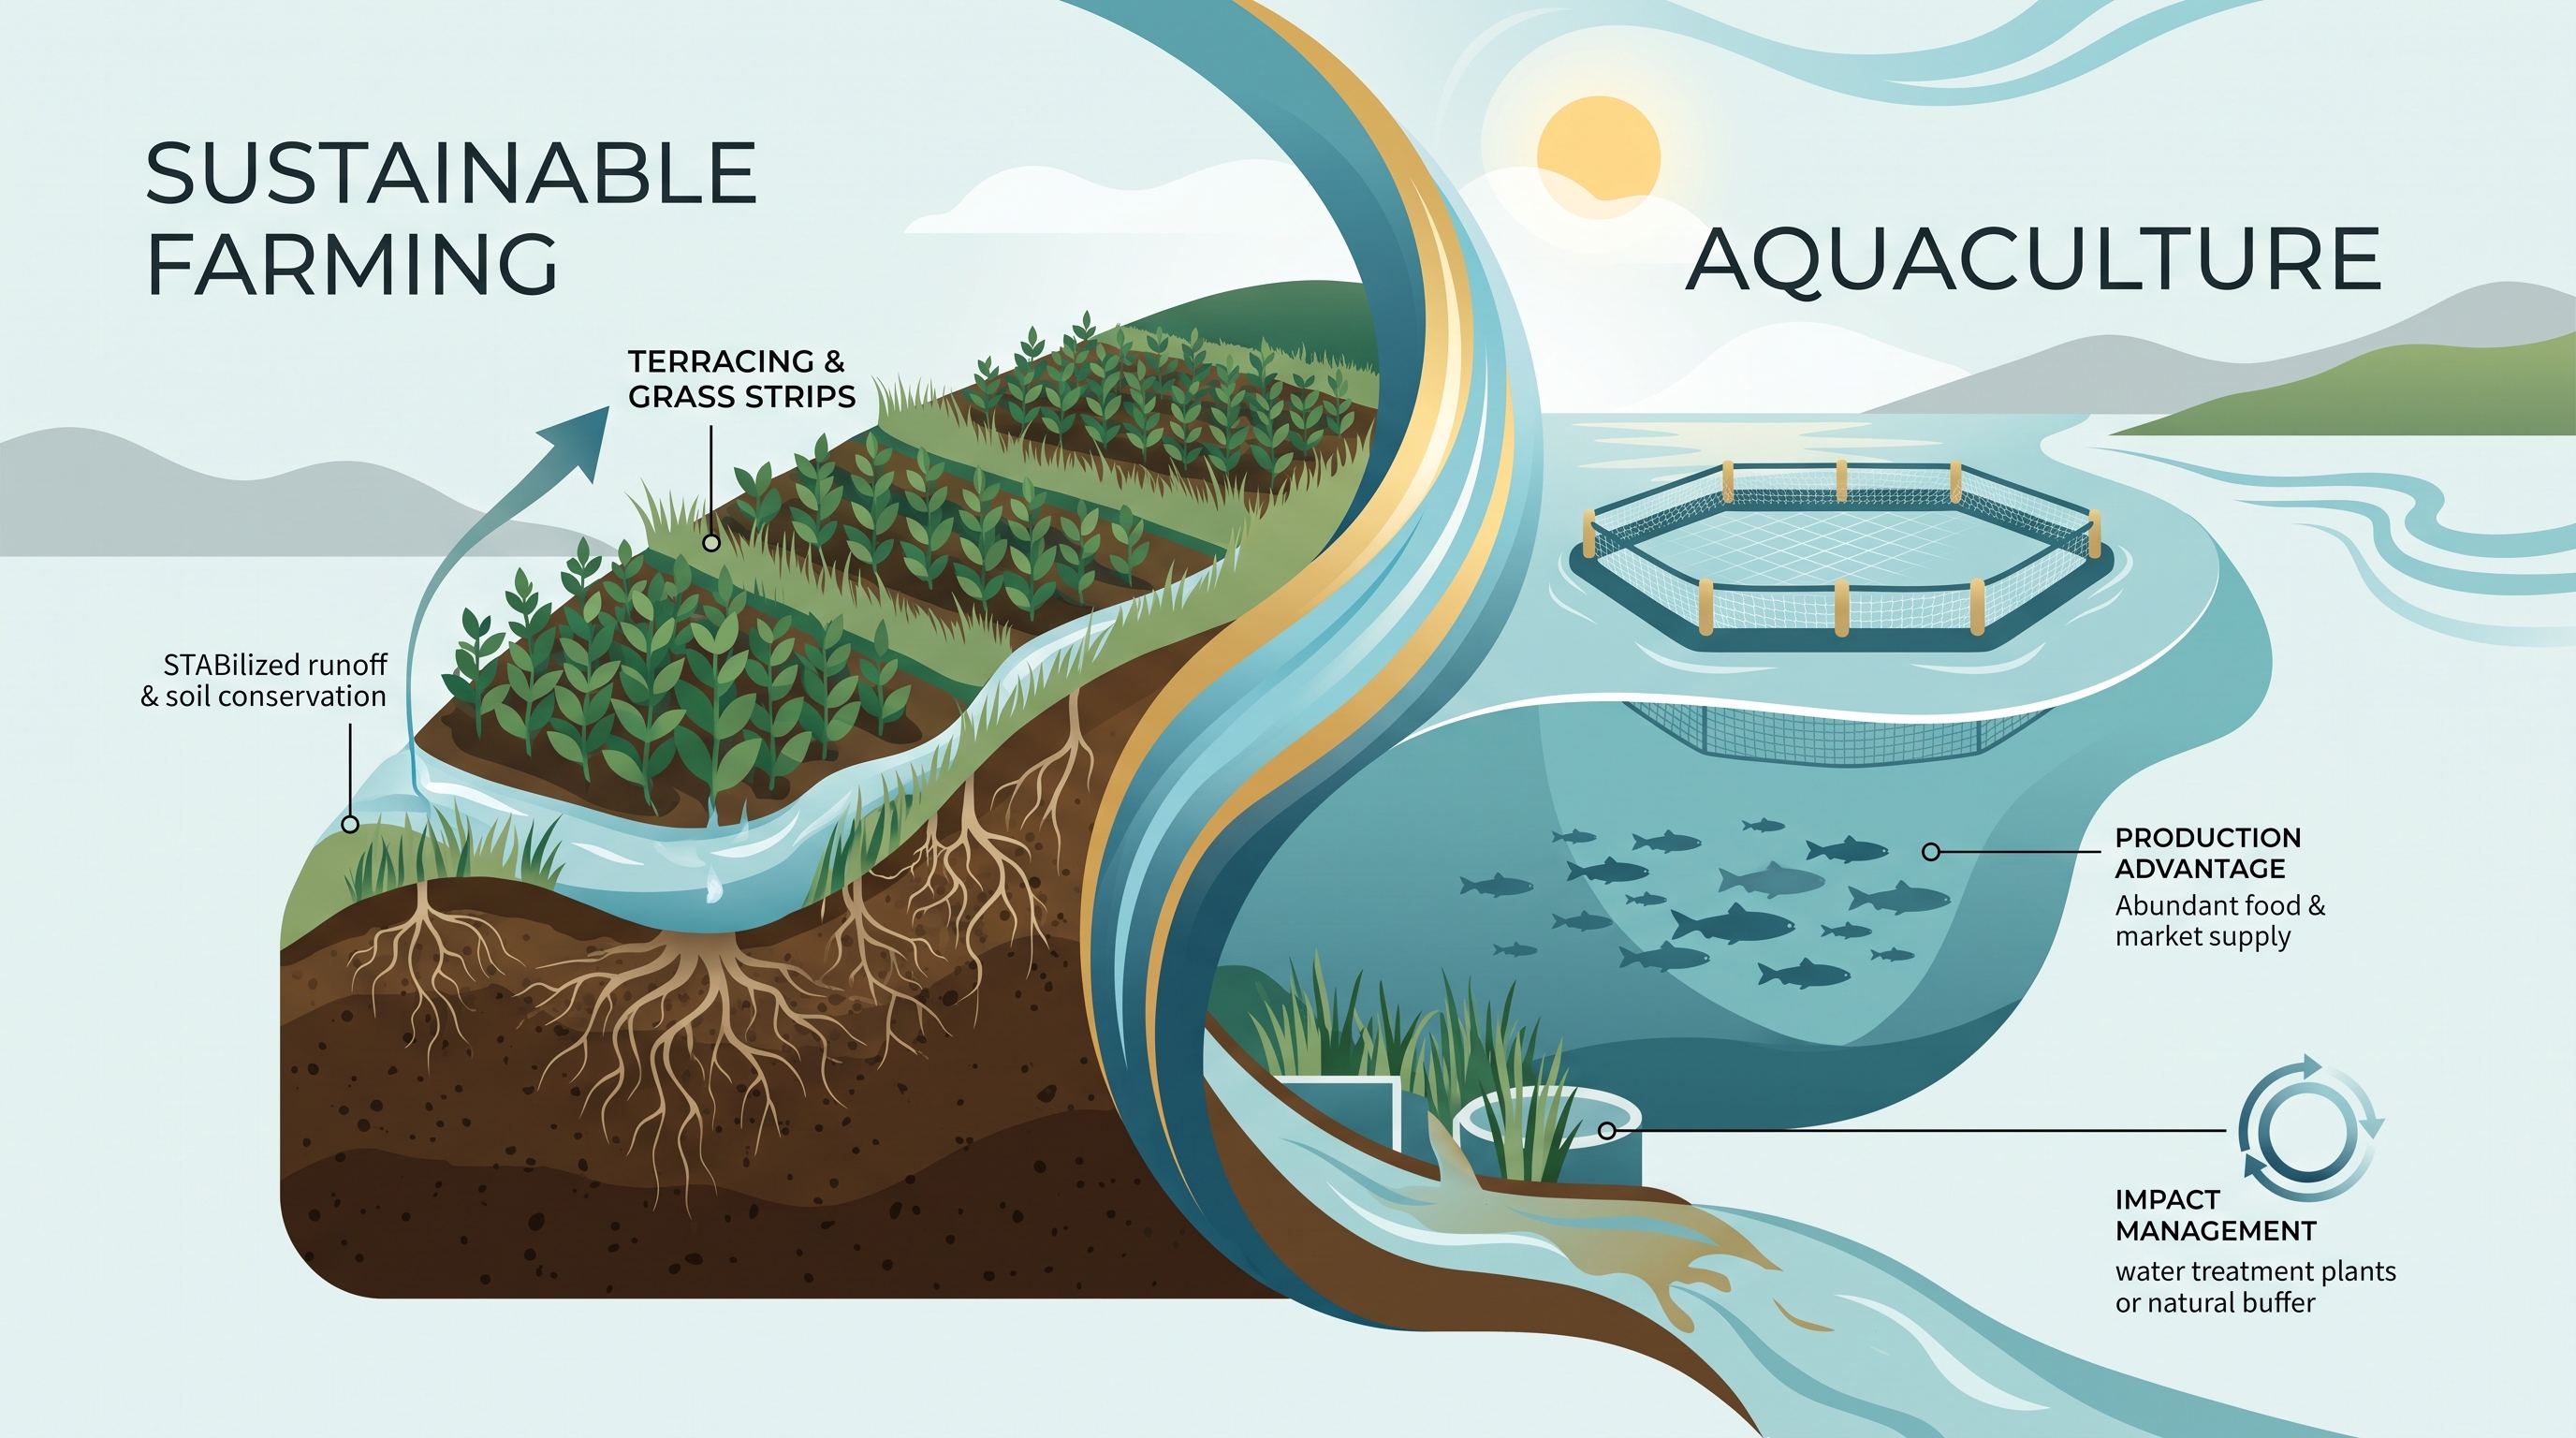
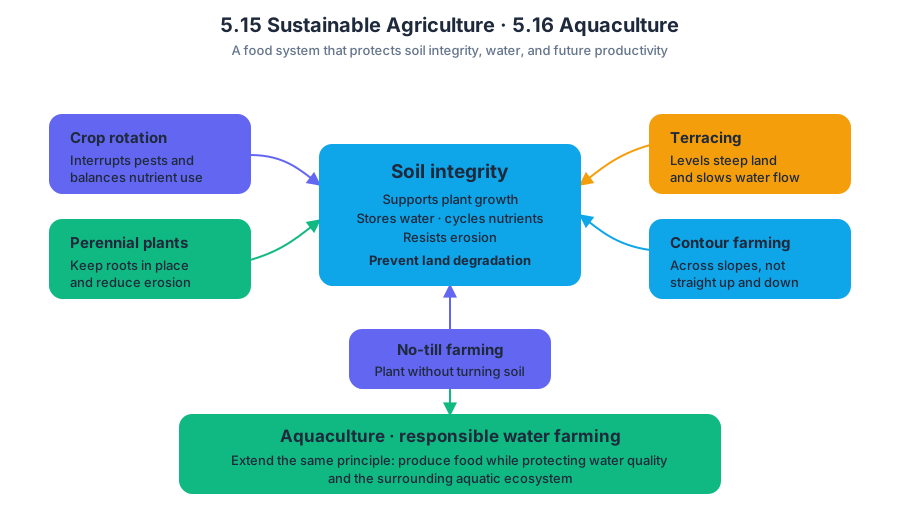
5.17 Sustainable Forestry
Key concepts: Sustainable forestry · Sustainability
A forest can produce timber indefinitely only when harvesting does not permanently reduce the forest’s ability to regenerate, support biodiversity, protect soil, and regulate water.
5.17 Sustainable Forestry
A forest can produce timber indefinitely only when harvesting does not permanently reduce the forest’s ability to regenerate, support biodiversity, protect soil, and regulate water. Sustainable forestry is the management of forest resources so that present use does not compromise the ecological functions and resource availability needed by future generations.
Sustainability means meeting human needs while maintaining the long-term health and functioning of environmental systems.
From forest harvest to forest management
A forest is more than a warehouse of wood. It stores carbon, moderates local temperature, intercepts rainfall, reduces soil erosion, provides wildlife habitat, and supports economic activity. Sustainable forestry therefore asks two linked questions: How much wood can be removed? and What ecological conditions must remain afterward?
A useful management target is sustainable yield: harvesting wood at a rate that does not exceed the forest’s long-term rate of regrowth. If a forest grows an average of $4{,}000\ \text{m}^3$ of usable timber per year, a harvest of approximately $4{,}000\ \text{m}^3\text{ year}^{-1}$ could be sustainable only if soil fertility, species composition, age structure, and habitat conditions are also maintained. Harvesting $7{,}000\ \text{m}^3\text{ year}^{-1}$ would create a deficit of $3{,}000\ \text{m}^3$ each year.
Misconception check — “Sustainable yield means the harvest can equal average growth everywhere.” Average growth is not enough. A forest may regrow timber rapidly while losing old-growth habitat, increasing erosion, or becoming dominated by a few commercially valuable species. Sustainable forestry evaluates both production and ecosystem health.
Management practices and their trade-offs
Different harvesting methods create different ecological effects. Selective cutting removes individual trees or small groups, leaving much of the canopy intact. It can reduce visual disturbance and preserve habitat structure, but repeated removal of the largest trees may alter species composition and damage remaining trees during logging.
Clearcutting removes most or all trees from an area. It is efficient and can promote an even-aged forest of shade-intolerant species, but it exposes soil, increases runoff and erosion, releases stored carbon, and removes habitat. Its effects depend on the size of the cut, slope, soil conditions, buffer zones, and whether the area is successfully regenerated.
Reforestation replaces trees after harvest or disturbance. Afforestation establishes trees where forest has not recently existed. Both can restore carbon storage and habitat, but planting a single fast-growing species does not automatically recreate the biodiversity or ecological functions of a natural forest.
Forest managers may retain riparian buffers, which are strips of vegetation beside streams. These buffers stabilize stream banks, filter sediment and nutrients, shade water to maintain cooler temperatures, and provide movement corridors for organisms. Leaving standing dead trees and fallen logs can also preserve nesting sites, decomposer habitat, and nutrient cycling.
Disturbance, fire, and forest resilience
Fire is a natural disturbance in many forest ecosystems. Some fires remove accumulated leaf litter and dense undergrowth without killing mature, fire-adapted trees. Prescribed burns—carefully planned fires set under controlled conditions—can reduce fuel loads and lower the intensity of later wildfires.
Brush removal can serve a similar purpose by reducing small trees, shrubs, and other combustible vegetation. These practices can protect communities and maintain fire-dependent ecosystems, but poorly timed or excessively intense burning can increase particulate pollution, damage soil organisms, and destroy habitat.
After a wildfire, secondary succession usually occurs because soil, nutrients, seeds, roots, or surviving organisms remain. Grasses and herbaceous plants often colonize first, followed by shrubs and young trees. The speed and direction of recovery depend on fire intensity, moisture, seed sources, temperature, and subsequent human disturbance.
Worked example: choosing a sustainable plan
A watershed contains a mature forest on steep slopes above a drinking-water reservoir. Managers propose either a large clearcut or smaller selective harvests with riparian buffers, replanting, and prescribed burns. The second plan better protects the reservoir because maintaining canopy cover and streamside vegetation reduces erosion and sediment delivery, while prescribed burns reduce the accumulation of combustible material.
The strongest justification connects the practice to a mechanism: riparian buffers reduce sediment runoff; lower sediment inputs maintain reservoir capacity and water quality. A complete evaluation would also monitor tree regeneration, species diversity, stream turbidity, wildfire risk, and timber yield over time rather than judging success from the number of trees planted immediately after harvest.
This reasoning uses Learning Objective 5.17.A and the associated Essential Knowledge statements for Topic 5.17: forest management must balance resource use with the maintenance of ecosystem processes and long-term sustainability. It also connects to the sustainability Big Idea because a forestry decision affects energy and carbon storage, Earth-system processes, and species–environment interactions simultaneously.
AP science practices in action
- Science Practice 1: Concept Application — Apply sustainable-yield and succession concepts to explain why a management practice changes erosion, habitat, or regeneration.
- Science Practice 2: Visual Representations — Interpret a map showing harvest areas, slopes, streams, and buffers; use the spatial pattern to predict runoff or habitat fragmentation.
- Science Practice 3: Questions and Methods — Design an investigation comparing turbidity upstream and downstream of a logged area, identifying the independent variable, dependent variable, controls, and repeated trials.
- Science Practice 4: Representing and Describing Data — Graph annual timber growth, harvest volume, or post-fire vegetation recovery and describe trends accurately.
- Science Practice 5: Statistical Tests and Data Analysis — Compare mean turbidity or seedling survival between managed and unmanaged plots while considering variation and sample size.
- Science Practice 6: Mathematical Routines — Calculate percent change, growth–harvest differences, or timber yield using clearly labeled units.
- Science Practice 7: Environmental Solutions — Propose a forestry plan and justify how it reduces environmental harm while meeting a human need.
Retrieval check: A forest grows $500\ \text{m}^3\text{ year}^{-1}$, but logging removes $650\ \text{m}^3\text{ year}^{-1}$. Is the harvest sustainable based on yield alone? Name one additional ecological indicator that should be monitored. Answer: No; the harvest exceeds measured regrowth by $150\ \text{m}^3\text{ year}^{-1}$. Possible indicators include soil erosion, stream turbidity, tree-species diversity, regeneration success, carbon storage, or wildlife habitat.
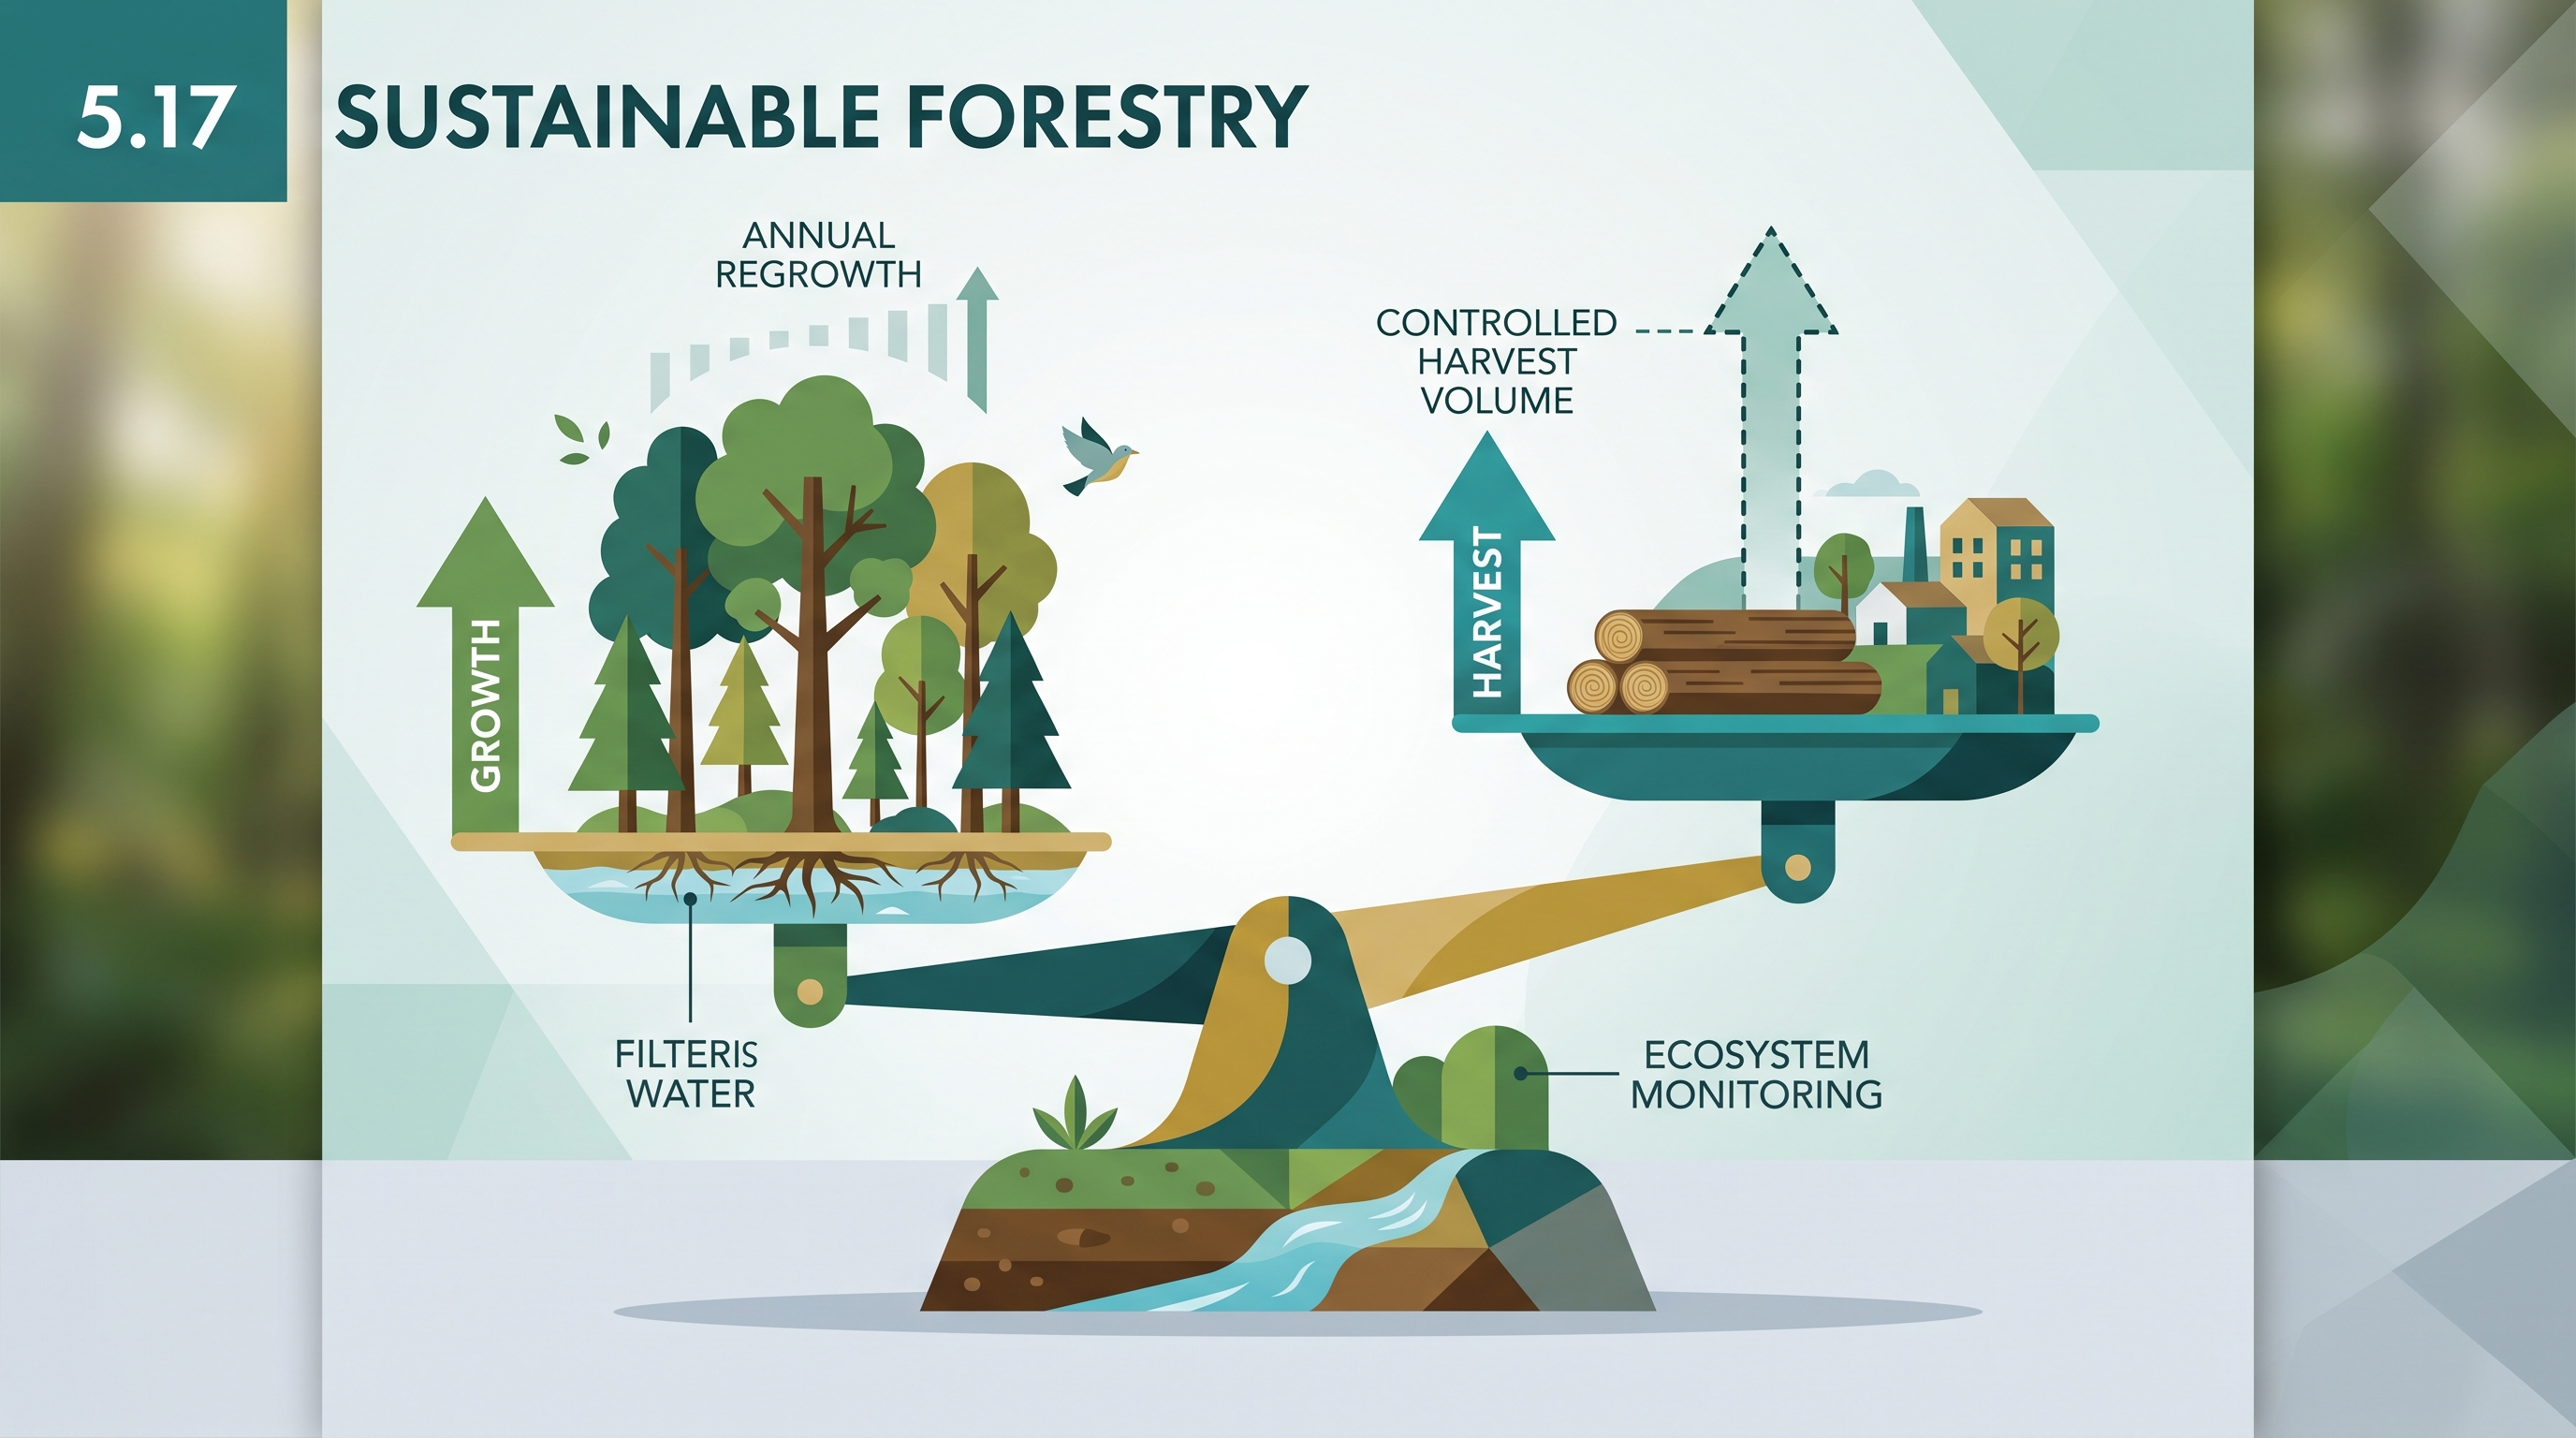
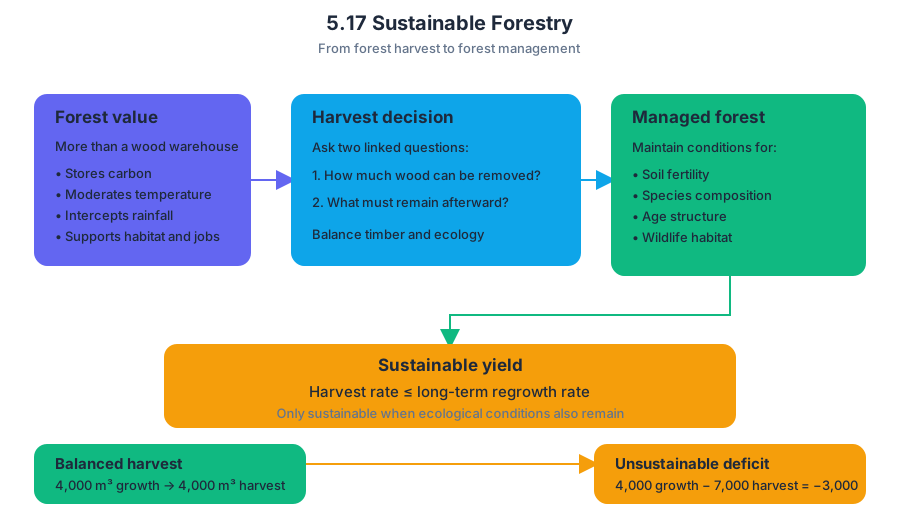
6.1 Renewable and Nonrenewable Resources · 6.2 Global Energy Consumption
Key concepts: Renewable energy resources · Nonrenewable energy resources · Regional distribution of natural energy resources · Global energy consumption · Nuclear power · Biomass energy · Wind energy · Hydroelectric power and dams · Hydrogen fuel cells · Environmental consequences of energy use
Every energy source transforms stored or moving energy into forms humans can use, but the crucial distinction is whether nature replaces the resource on a human timescale.
6.1 Renewable and Nonrenewable Resources · 6.2 Global Energy Consumption
Every energy source transforms stored or moving energy into forms humans can use, but the crucial distinction is whether nature replaces the resource on a human timescale.
Renewable versus nonrenewable resources
A renewable energy resource is replenished naturally quickly enough to be used repeatedly, such as sunlight, wind, flowing water, geothermal heat, and biomass. A nonrenewable energy resource exists in a fixed amount—or is replaced so slowly that its supply is effectively fixed for human societies—including coal, petroleum, natural gas, and uranium used for nuclear power.
The distinction describes the resource stock, not whether using the resource has environmental impacts. A renewable resource can still be depleted locally or used faster than it is replenished. For example, a forest can provide renewable biomass, but harvesting trees faster than they regrow converts a renewable supply into a declining one.
Key distinction: “Renewable” means replenished naturally; it does not mean unlimited, pollution-free, or automatically sustainable.
Energy resources are also unevenly distributed. A region’s supply depends partly on its geologic history: the processes that formed and buried organic matter, concentrated minerals, shaped groundwater systems, or created favorable conditions for geothermal heat. Sunlight, wind, and flowing water likewise vary with climate, topography, and geography. Therefore, a resource may be abundant globally but unavailable or expensive in a particular region.
Humans use a mixture of energy sources
Modern societies obtain energy from many sources rather than one universal fuel. Electricity, transportation, heating, and industrial processes may rely on different combinations of fossil fuels, nuclear power, biomass, hydroelectricity, wind, solar energy, and geothermal energy.
A useful way to compare sources is to ask four questions:
- How is the energy captured or released?
- Can the resource be replenished?
- Where is it available?
- What environmental and social consequences accompany its use?
For example, a wind turbine uses the kinetic energy—the energy of motion—of moving air. A hydroelectric dam converts water stored at elevation into moving water and then electricity. The dam can provide reliable electricity and flood control, but it can also inundate land, disrupt river habitats, alter sediment movement, and displace human communities.
Global energy consumption
Global energy consumption is the amount of energy used by people worldwide over a specified time. Consumption is not the same as energy production: energy may be produced in one location, transported, and consumed elsewhere. Total consumption can rise because of population growth, increased industrial activity, transportation demand, or greater energy use per person.
When comparing countries, total energy use and per-capita energy use answer different questions. A large population may have high total consumption but relatively low consumption per person, while a smaller, wealthier population may use more energy per person.
Worked calculation: Suppose Region A uses $900$ petajoules of energy annually and has a population of $30$ million people. Its per-capita consumption is
$$ \frac{900\ \text{petajoules}}{30\ \text{million people}}
30\ \text{gigajoules per person} $$
because $1$ petajoule equals $1{,}000$ gigajoules. Always convert units before comparing regions.
Energy sources produce trade-offs
No energy source has only positive or only negative consequences. Nuclear power generation is nonrenewable because uranium is finite. Nuclear plants produce large amounts of electricity without directly burning fossil fuels, but they can cause thermal pollution when heated cooling water enters an aquatic system and can generate hazardous solid radioactive waste that requires secure long-term management.
Biomass energy comes from recently living organic material, such as wood or crop residues. Burning biomass produces heat that can be used directly or converted into electricity. Its consequences depend on how the biomass is obtained: managed regrowth may support a renewable supply, whereas unsustainable harvesting can cause habitat loss, soil degradation, and increased atmospheric pollution.
Energy-resource processes may also release hydrogen sulfide, a toxic gas with a rotten-egg odor. This is especially associated with some underground and geothermal processes. The example illustrates why evaluating an energy source requires examining its entire process—not merely the electricity produced at the end.
Misconception check and retrieval
Misconception: “Renewable energy has no environmental cost.”
Correction: Renewable sources reduce dependence on finite fuels, but dams alter rivers, biomass combustion releases pollutants, wind facilities occupy land, and every energy system requires materials and infrastructure.
Retrieval check: Why is nuclear power classified as nonrenewable even though a nuclear plant does not burn coal or natural gas? Name one environmental benefit and two possible drawbacks of a hydroelectric dam.
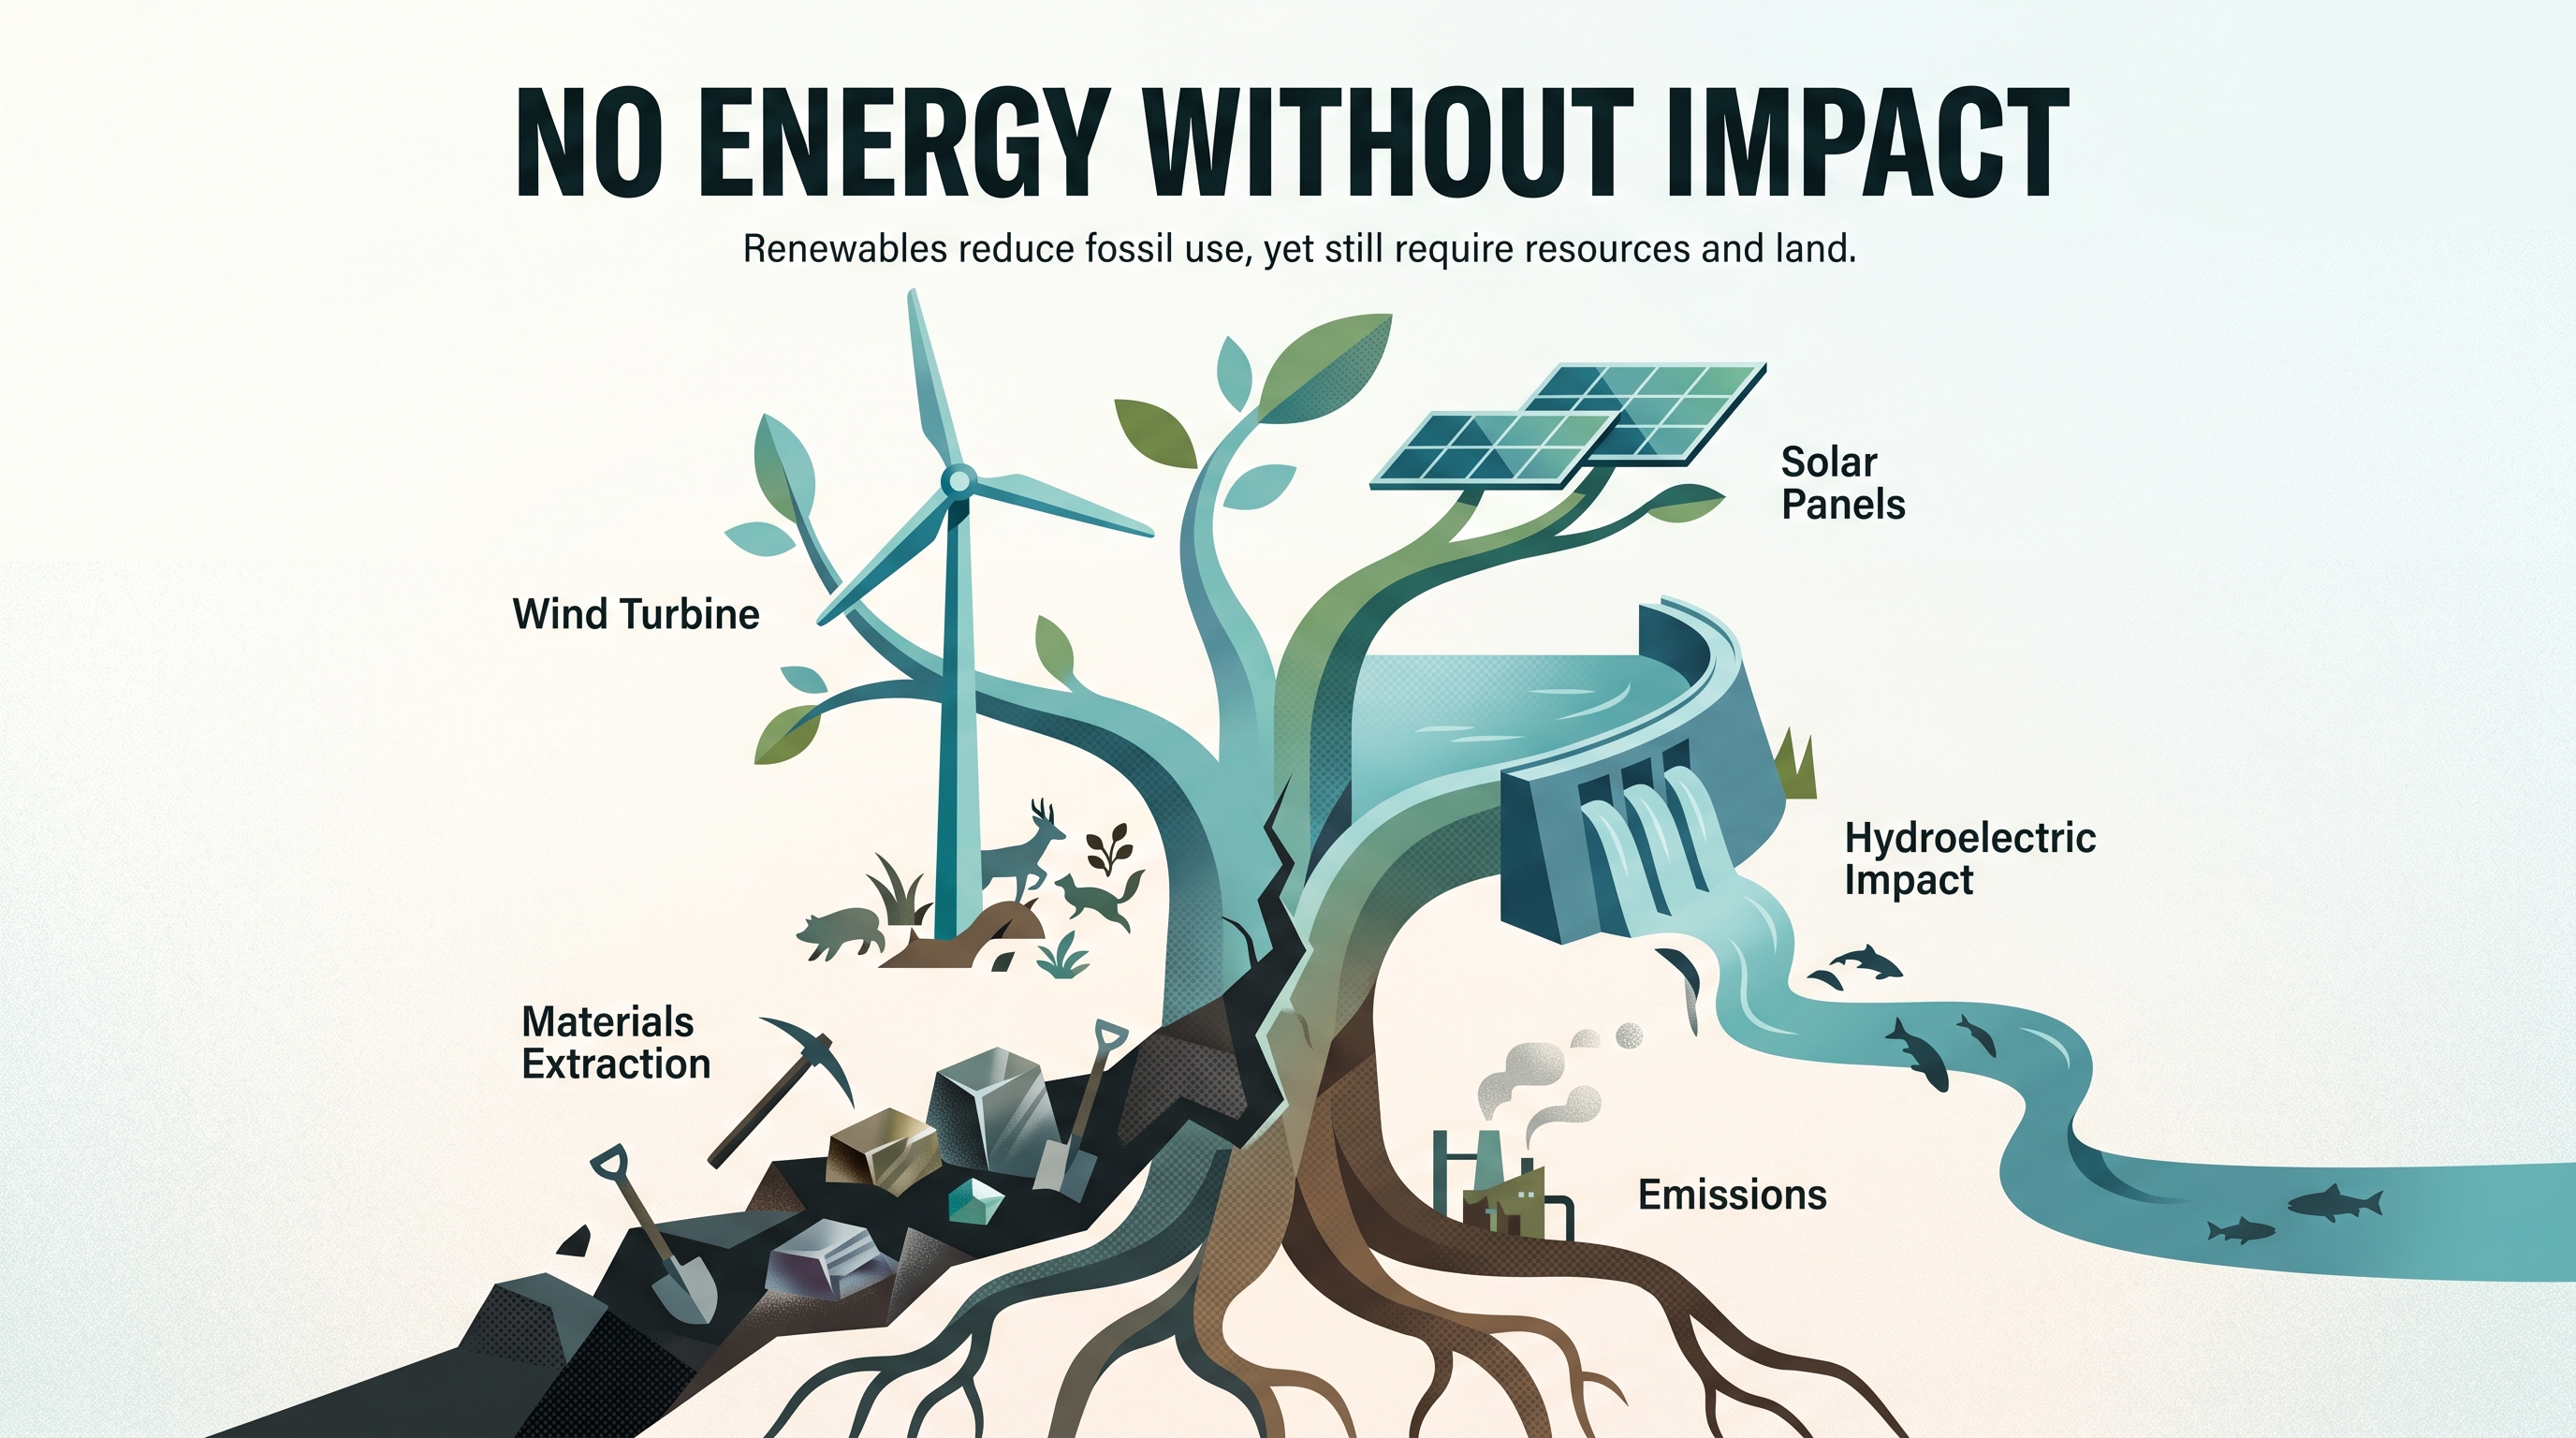

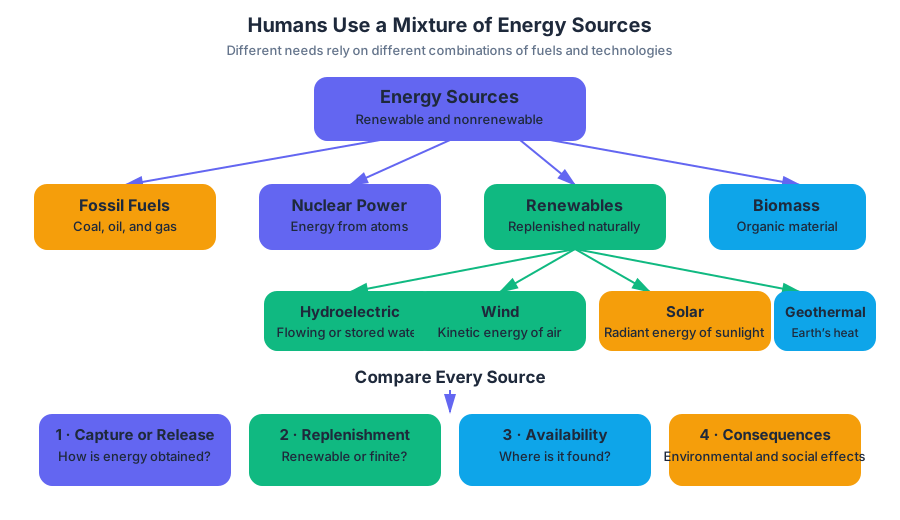
6.3 Fuel Types and Uses · 6.4 Distribution of Natural Energy Resources
Key concepts: Energy resources and consumption · Fuel types and their uses · Coal formation and quality · Natural gas · Crude oil and tar sands · Fossil-fuel refining · Nuclear fission · Distribution and availability of natural energy resources · Environmental consequences of energy use
A fuel’s usefulness depends on more than how much energy it contains: its physical form, chemical composition, location, accessibility, and environmental cost determine whether people can realistically use it for heating, transportation, or electricity.
6.3 Fuel Types and Uses · 6.4 Distribution of Natural Energy Resources
A fuel’s usefulness depends on more than how much energy it contains: its physical form, chemical composition, location, accessibility, and environmental cost determine whether people can realistically use it for heating, transportation, or electricity.
From raw resource to useful energy
Biomass fuels come from recently living organic material. Wood and charcoal are widely used where they are accessible, while peat—partially decomposed organic material—can also be burned. Fossil fuels formed from ancient organic matter and include coal, natural gas, and crude oil.
A fuel may be burned directly for heat, used to produce steam that turns a generator, or processed into a specialized fuel. Cogeneration is especially efficient because one fuel source produces both useful heat and electricity instead of releasing the heat as waste.
| Raw resource | Important characteristic | Typical use |
|---|---|---|
| Wood or charcoal | Accessible biomass fuel | Heating and cooking |
| Peat | Partially decomposed organic matter | Burned for fuel |
| Coal | Solid fossil fuel with variable carbon content | Electricity and industrial heat |
| Natural gas | Mostly methane; cleanest fossil fuel | Heating, electricity, and industry |
| Crude oil | Liquid mixture of hydrocarbons | Refined into transportation fuels and other products |
| Tar sands | Clay, sand, water, and bitumen | Source of crude oil after extraction and processing |
Coal quality: burial changes the fuel
Coal develops as buried organic material experiences increasing heat, pressure, and depth of burial. These conditions remove water and other volatile substances and generally increase the coal’s carbon concentration and energy content.
The major fuel coal types form an approximate progression:
$$ \text{lignite} \rightarrow \text{bituminous} \rightarrow \text{anthracite} $$
Lignite is relatively soft, has lower carbon content, and produces less energy per unit mass than higher-grade coal. Bituminous coal is more carbon-rich and widely used. Anthracite is harder and has the highest carbon content of these three types, so it generally burns more efficiently and with less smoke.
Misconception check — “All coal has the same quality.” Coal is not a single uniform fuel. A coal’s formation conditions influence its carbon content, energy yield, moisture content, and pollutant emissions. Higher quality does not mean zero environmental impact; extracting and burning coal still disturb land and release pollutants and carbon dioxide.
Natural gas, crude oil, and tar sands
Natural gas is composed mostly of methane, $CH_4$, and is considered the cleanest fossil fuel because burning it usually produces less carbon dioxide and fewer conventional air pollutants per unit of energy than coal or oil. “Cleanest fossil fuel” does not mean “clean energy”: methane itself is a powerful greenhouse gas if it leaks before combustion.
Crude oil is a mixture of hydrocarbons that must be separated and processed. Tar sands, also called oil sands, contain clay, sand, water, and bitumen, a thick petroleum-containing substance. Recovering crude oil from tar sands requires extraction and processing, which can disturb land and demand substantial energy and water.
Refining matches fuels to jobs
Raw fossil fuels rarely go directly into every machine. Fossil-fuel refining separates and chemically modifies crude materials into fuels with properties suited to particular uses—for example, gasoline and diesel for motor vehicles, jet fuel for aircraft, and other petroleum products for industry.
A useful way to visualize refining is as a sorting-and-customizing process:
$$ \text{crude oil} \rightarrow \text{separation} \rightarrow \text{specialized fuels} \rightarrow \text{transportation, heating, or electricity} $$
Worked example: A town receives crude oil but has no refinery. It cannot simply substitute the crude oil directly into gasoline engines. The oil must first be refined into a fuel with the correct volatility and combustion properties. If the town instead receives natural gas through a pipeline, it may use methane directly for heating or electricity, but only if pipeline infrastructure and supply are available.
Location controls energy choices
Energy resources are unevenly distributed. Coal deposits, oil fields, natural-gas reserves, uranium ores, sunlight, moving water, and strong winds occur in different places and at different concentrations. Therefore, availability and distribution influence how and where resources are used: a resource that is abundant locally may be cheaper and more politically attractive than one that must be imported.
Energy demand rises as human use of energy increases. A growing population, expanding industry, transportation, heating, cooling, and electricity access can all raise demand. Distribution creates trade-offs: extraction may occur far from consumers, requiring pipelines, railways, ships, transmission lines, or fuel-processing facilities.
Nuclear energy also depends on resource distribution and specialized infrastructure. In a reactor, uranium-235 in fuel rods undergoes nuclear fission when struck by a neutron, splitting into smaller parts and releasing energy. The resource’s location matters, but so do reactor construction, fuel processing, safety systems, and waste management.
AP skill lens
This topic is commonly assessed through the official science practices Science Practice 1: Concept Application, when connecting fuel properties to uses; Science Practice 2: Visual Representations, when interpreting resource-distribution maps or process diagrams; Science Practice 5: Data Analysis, when comparing energy production and demand; Science Practice 6: Mathematical Routines, when calculating energy output or percentage change; and Science Practice 7: Environmental Solutions, when evaluating cogeneration, fuel switching, or infrastructure choices.
Retrieval check: Explain why anthracite generally has greater energy content than lignite, identify the main component of natural gas, and give one reason a region might use a locally available fuel even when another fuel has lower emissions.
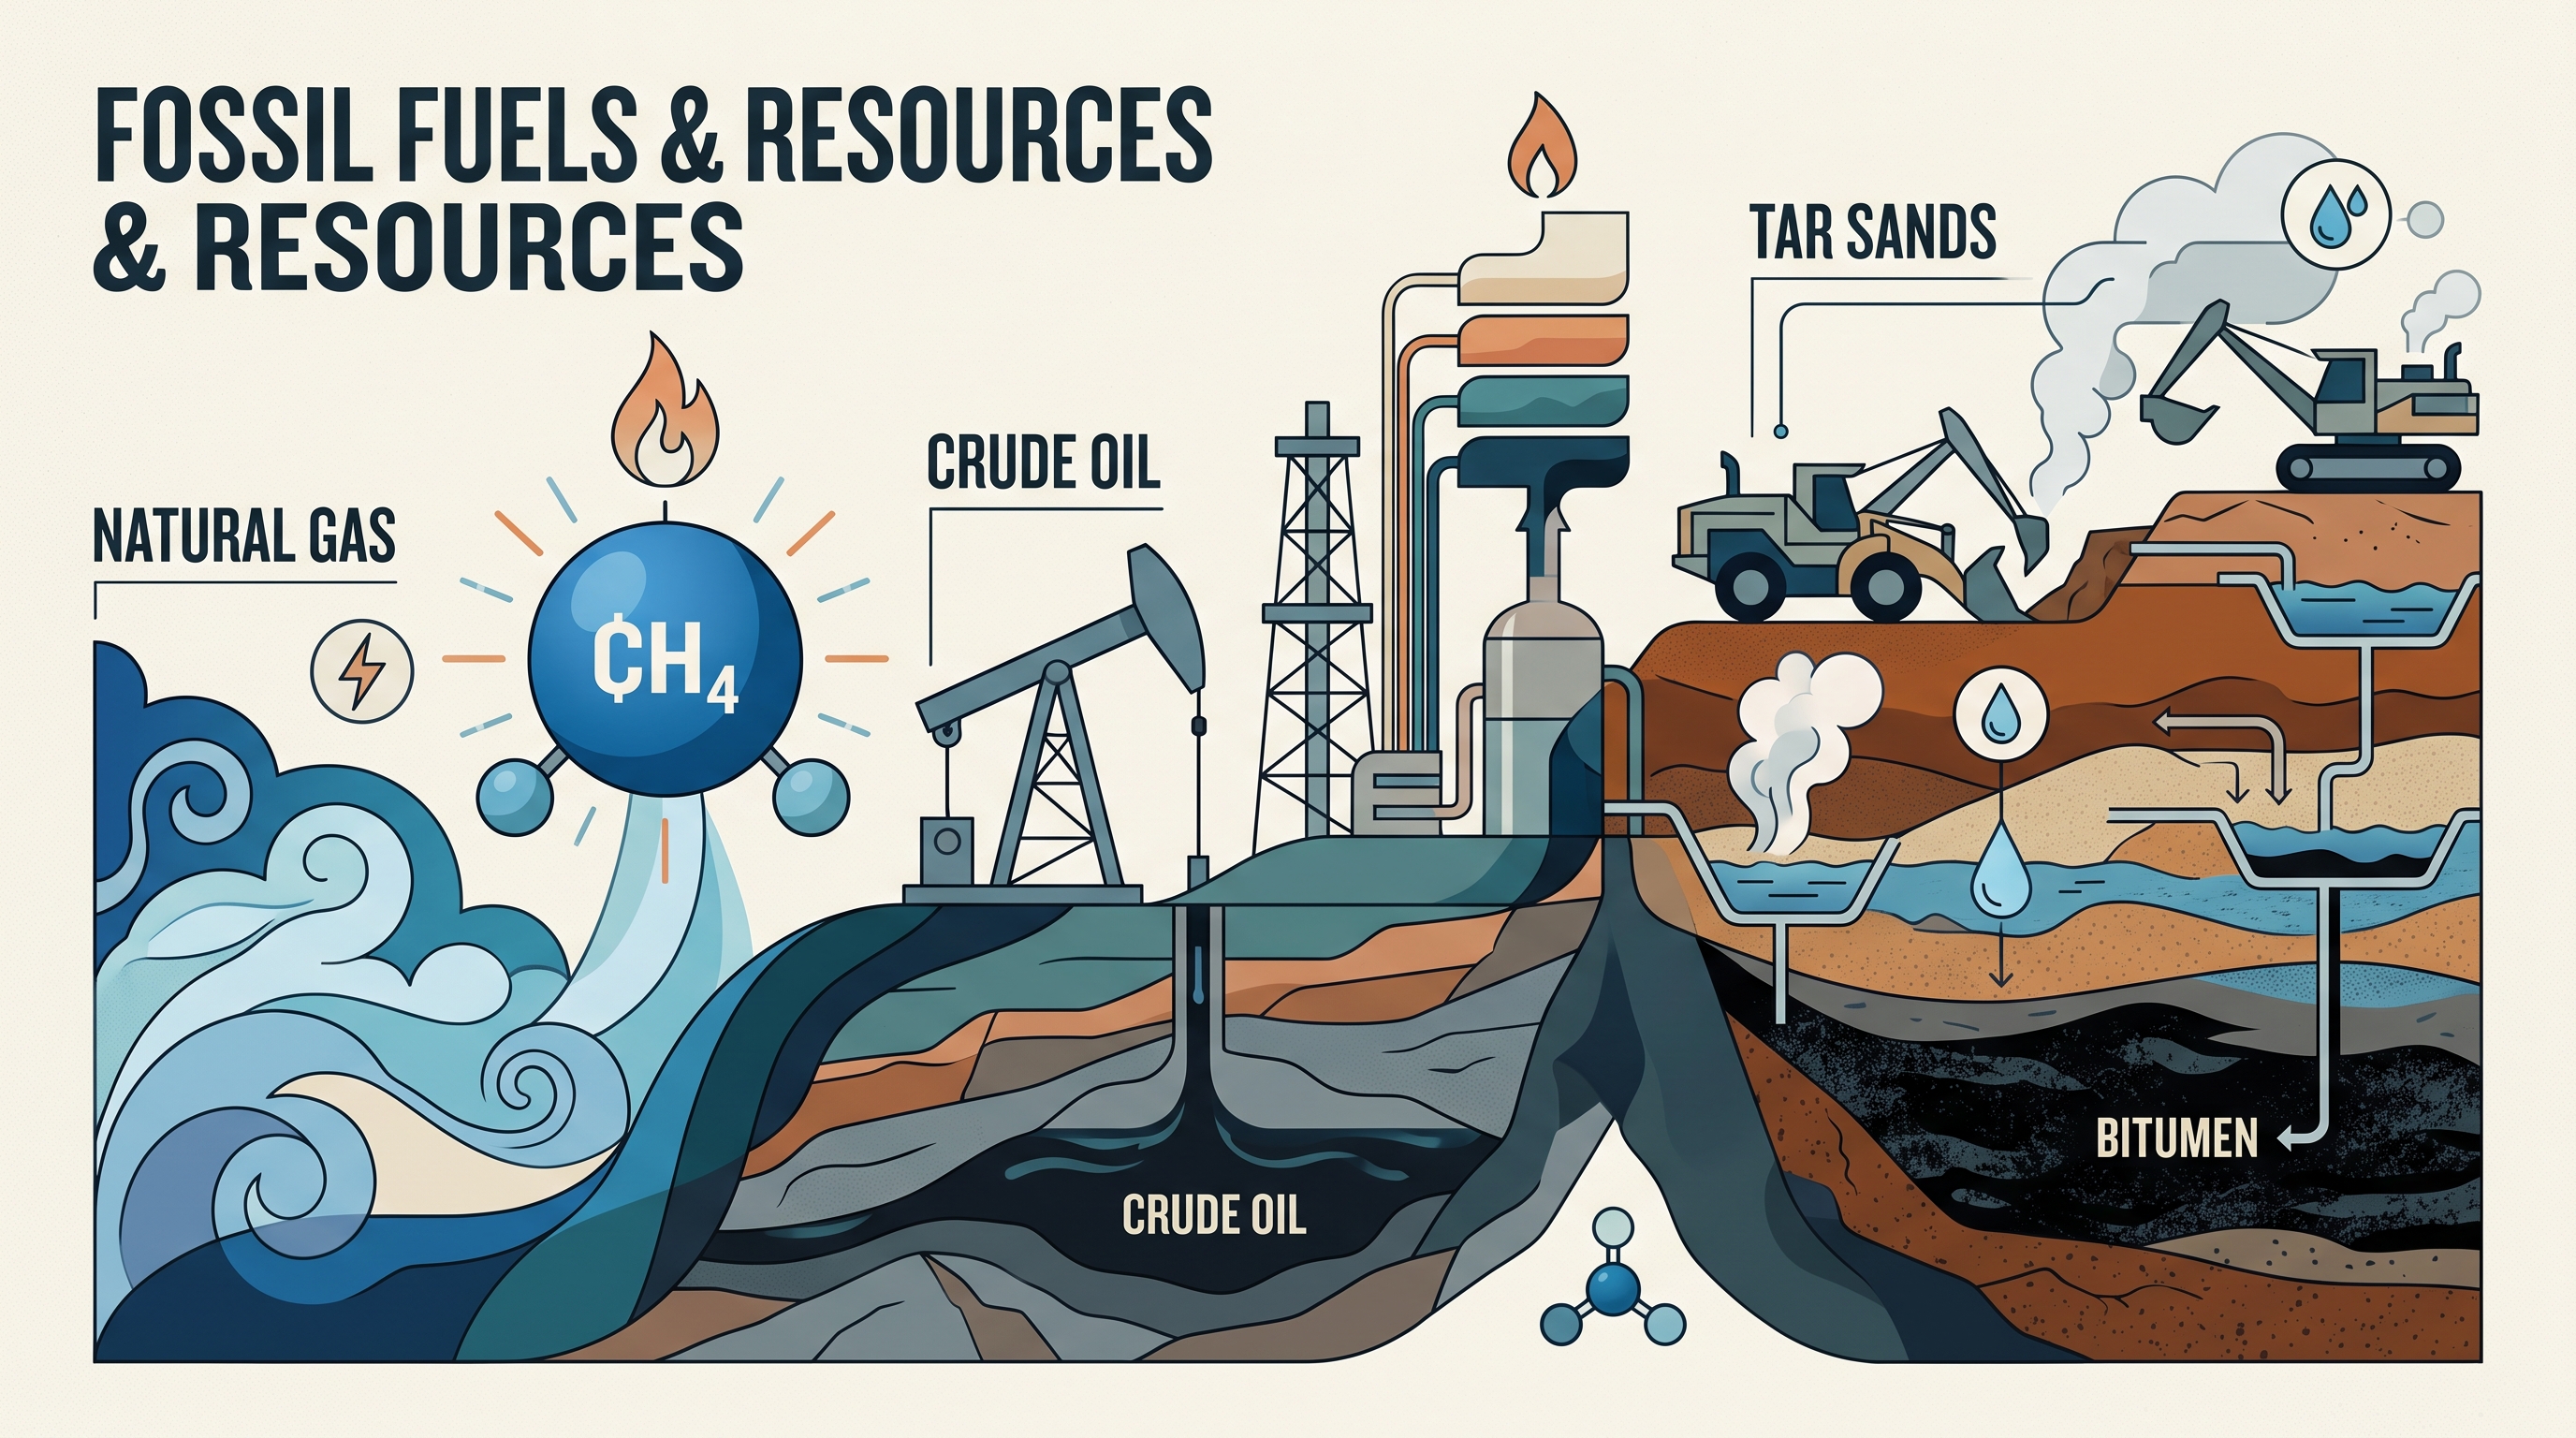
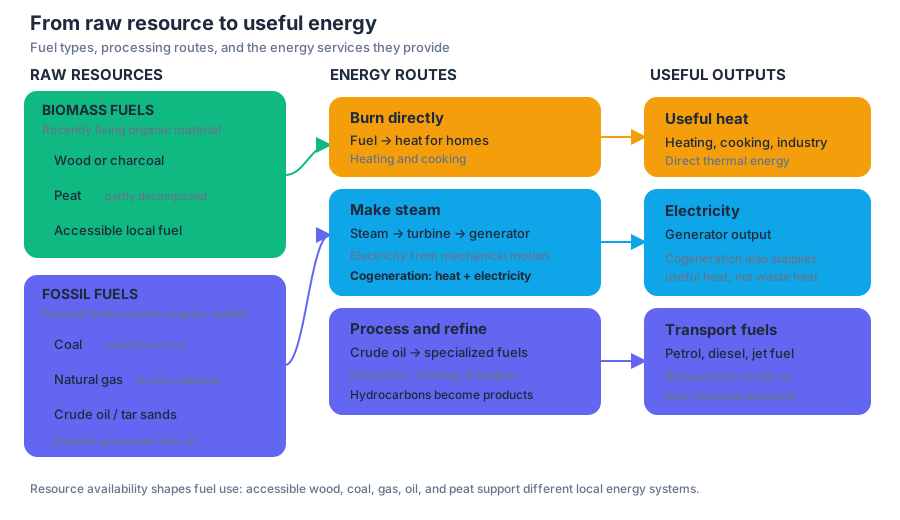
6.5 Fossil Fuels · 6.6 Nuclear Power
Key concepts: Fossil-fuel combustion for electricity generation · Environmental impacts of fossil-fuel extraction and use · Surface mining and land-use changes · Fracking-related groundwater contamination and volatile organic compounds · Thermal pollution from power plants · Nuclear power and uranium-235 fuel · Electricity-generation calculations using percentages · Environmental impacts of burning fossil fuels · Ocean acidification · Coal and U.S. energy-consumption trends
Fossil-fuel power plants convert the chemical energy of coal, oil, or natural gas into electricity by burning the fuel, while nuclear plants release energy by splitting atomic nuclei.
6.5 Fossil Fuels · 6.6 Nuclear Power
Fossil-fuel power plants convert the chemical energy of coal, oil, or natural gas into electricity by burning the fuel, while nuclear plants release energy by splitting atomic nuclei. Both systems ultimately use heat to make steam, but their environmental impacts begin with very different fuel sources and processes.
Fossil-fuel combustion: from fuel to electricity
Combustion is a chemical reaction in which a fuel reacts with oxygen and releases energy. For a hydrocarbon fuel, the products include carbon dioxide and water. A simplified example is:
$$ \text{hydrocarbon fuel} + O_2 \rightarrow CO_2 + H_2O + \text{energy} $$
In a fossil-fuel power plant, the released energy follows a four-step pathway:
$$ \text{chemical energy} \rightarrow \text{thermal energy} \rightarrow \text{mechanical energy} \rightarrow \text{electrical energy} $$
- Fossil fuel burns in a boiler.
- The heat converts liquid water into high-pressure steam.
- The steam spins a turbine.
- The turbine turns a generator, producing electricity.
This required mechanism is identified by ENG-3.E.1, which describes combustion as a reaction between fossil fuel and oxygen that yields carbon dioxide and water while releasing energy. ENG-3.E.2 identifies the heat–steam–turbine–generator sequence, and ENG-3.E.3 emphasizes that humans use multiple extraction methods to obtain fossil fuels.
Environmental costs occur before, during, and after combustion
The environmental impact of fossil fuels is not limited to smoke from a power plant. Extraction can disturb land and pollute water; processing and transport can release pollutants; and combustion can produce air pollution and greenhouse-gas emissions.
| Stage | Environmental problem | Mechanism |
|---|---|---|
| Extraction | Land disturbance and deforestation | Mining, drilling, and access roads remove or fragment habitat |
| Hydraulic fracturing | Groundwater contamination | Fluids, methane, or chemicals may enter groundwater through faulty wells or pathways |
| Oil and gas production | Volatile organic compounds (VOCs) | Vapors escape during drilling, processing, storage, or transport |
| Combustion | Air pollution | Burning produces pollutants in addition to carbon dioxide |
| Combustion | Greenhouse-gas emissions | Carbon dioxide strengthens the greenhouse effect |
| Combustion | Ocean acidification | Atmospheric carbon dioxide dissolves into seawater and forms acids |
ENG-3.F, the learning objective for this topic, requires describing the effects of fossil fuels on the environment. ENG-3.F.1 specifically identifies hydraulic fracturing, or fracking, as a process that can cause groundwater contamination and release VOCs. A strong explanation names both the pollutant and the pathway by which it reaches an environmental system.
Surface mining and land-use change
Surface mining removes soil and rock above a shallow fossil-fuel deposit. This can strip vegetation, destroy habitat, compact soil, increase erosion, and expose pollutants that enter nearby streams. The central environmental issue is land disturbance: the landscape is physically altered before the fuel ever reaches a furnace.
Worked example: A coal mine removes vegetation from a hillside. Without roots to hold soil in place, rainfall carries sediment into a stream. The sediment increases turbidity, reduces light penetration, and may cover aquatic habitat. The complete evidence chain is:
$$ \text{surface mining} \rightarrow \text{vegetation removal} \rightarrow \text{erosion} \rightarrow \text{sediment in water} \rightarrow \text{reduced water quality} $$
Thermal pollution
Thermal pollution occurs when a power plant releases heated cooling water into a river, lake, or coastal waterway. Warmer water holds less dissolved oxygen, so aquatic organisms may experience oxygen stress even when no toxic chemical has been added.
A complete explanation connects temperature, oxygen, and organisms: heated discharge raises water temperature; warmer water has lower dissolved-oxygen capacity; fish and aquatic invertebrates have less oxygen available for respiration; and sensitive organisms may be harmed or killed. Thermal pollution therefore lowers water quality through a physical change in temperature.
Misconception check: Thermal pollution is not “hot water poisoning organisms directly” only. Its major AP mechanism is that warmer water contains less dissolved oxygen, while organisms may also experience increased metabolic oxygen demand.
Nuclear power and uranium-235
Nuclear power plants use a fissile isotope such as uranium-235 rather than a fossil fuel such as methane. In fission, uranium-235 nuclei split into smaller nuclei and release energy. Uranium fuel is stored in fuel rods; the heat produced by fission boils water, and the resulting steam turns a turbine connected to a generator.
Nuclear power avoids direct carbon dioxide emissions from combustion during electricity generation, but it has environmental concerns of its own. These include radioactive waste requiring secure long-term storage, the possibility of radioactive release after an accident, uranium mining impacts, and thermal pollution from cooling-water discharge.
Nuclear-electricity calculation
To calculate electricity generated by nuclear power, multiply total commercial electricity generation by the nuclear percentage:
$$\left(4.1 \times 10^{12}\ \text{kWh}\right)(18.9%)$$
Convert the percentage to a decimal:
$$18.9% = 0.189$$
Then multiply:
$$\left(4.1 \times 10^{12}\right)(0.189)=7.749 \times 10^{11}\ \text{kWh}$$
The answer is therefore $7.749 \times 10^{11}\ \text{kWh}$. The most common error is multiplying by $18.9$ instead of $0.189$, which makes the result $100$ times too large.
Reading energy-consumption evidence
When interpreting an energy graph, first identify the largest source at the requested year by comparing the plotted values. For coal, describe the pattern over the entire interval rather than naming only the starting and ending values: note whether consumption rises, falls, fluctuates, or changes most sharply during a particular period.
A data-based explanation for declining coal use might connect the graph to increased use of natural gas, renewable technologies, energy-efficiency improvements, or air-pollution controls. The graph establishes the pattern; environmental knowledge supplies a plausible mechanism. Do not claim that a trend proves one cause unless the data directly support that conclusion.
AP science practices in action
This topic most directly exercises Science Practice 1: Concept Explanation, when explaining combustion, fission, or thermal pollution; Science Practice 5: Data Analysis, when identifying the highest energy source or describing coal-consumption trends; Science Practice 6: Mathematical Routines, when calculating nuclear electricity; and Science Practice 7: Environmental Solutions, when proposing controls such as wastewater cooling systems, mine reclamation, or reduced fossil-fuel combustion.
Retrieval check
A coal plant releases cooling water into a river, and fish mortality increases downstream. Identify the pollutant, explain the mechanism, and name one likely water-quality change. Then calculate the nuclear generation from $5.0 \times 10^{12}\ \text{kWh}$ of total electricity if nuclear power supplies $20%$.
Answer: The pollutant is excess heat. Heated water lowers dissolved-oxygen concentration, stressing or killing fish; water quality decreases. The nuclear generation is:
$$\left(5.0 \times 10^{12}\ \text{kWh}\right)(0.20)=1.0 \times 10^{12}\ \text{kWh}$$
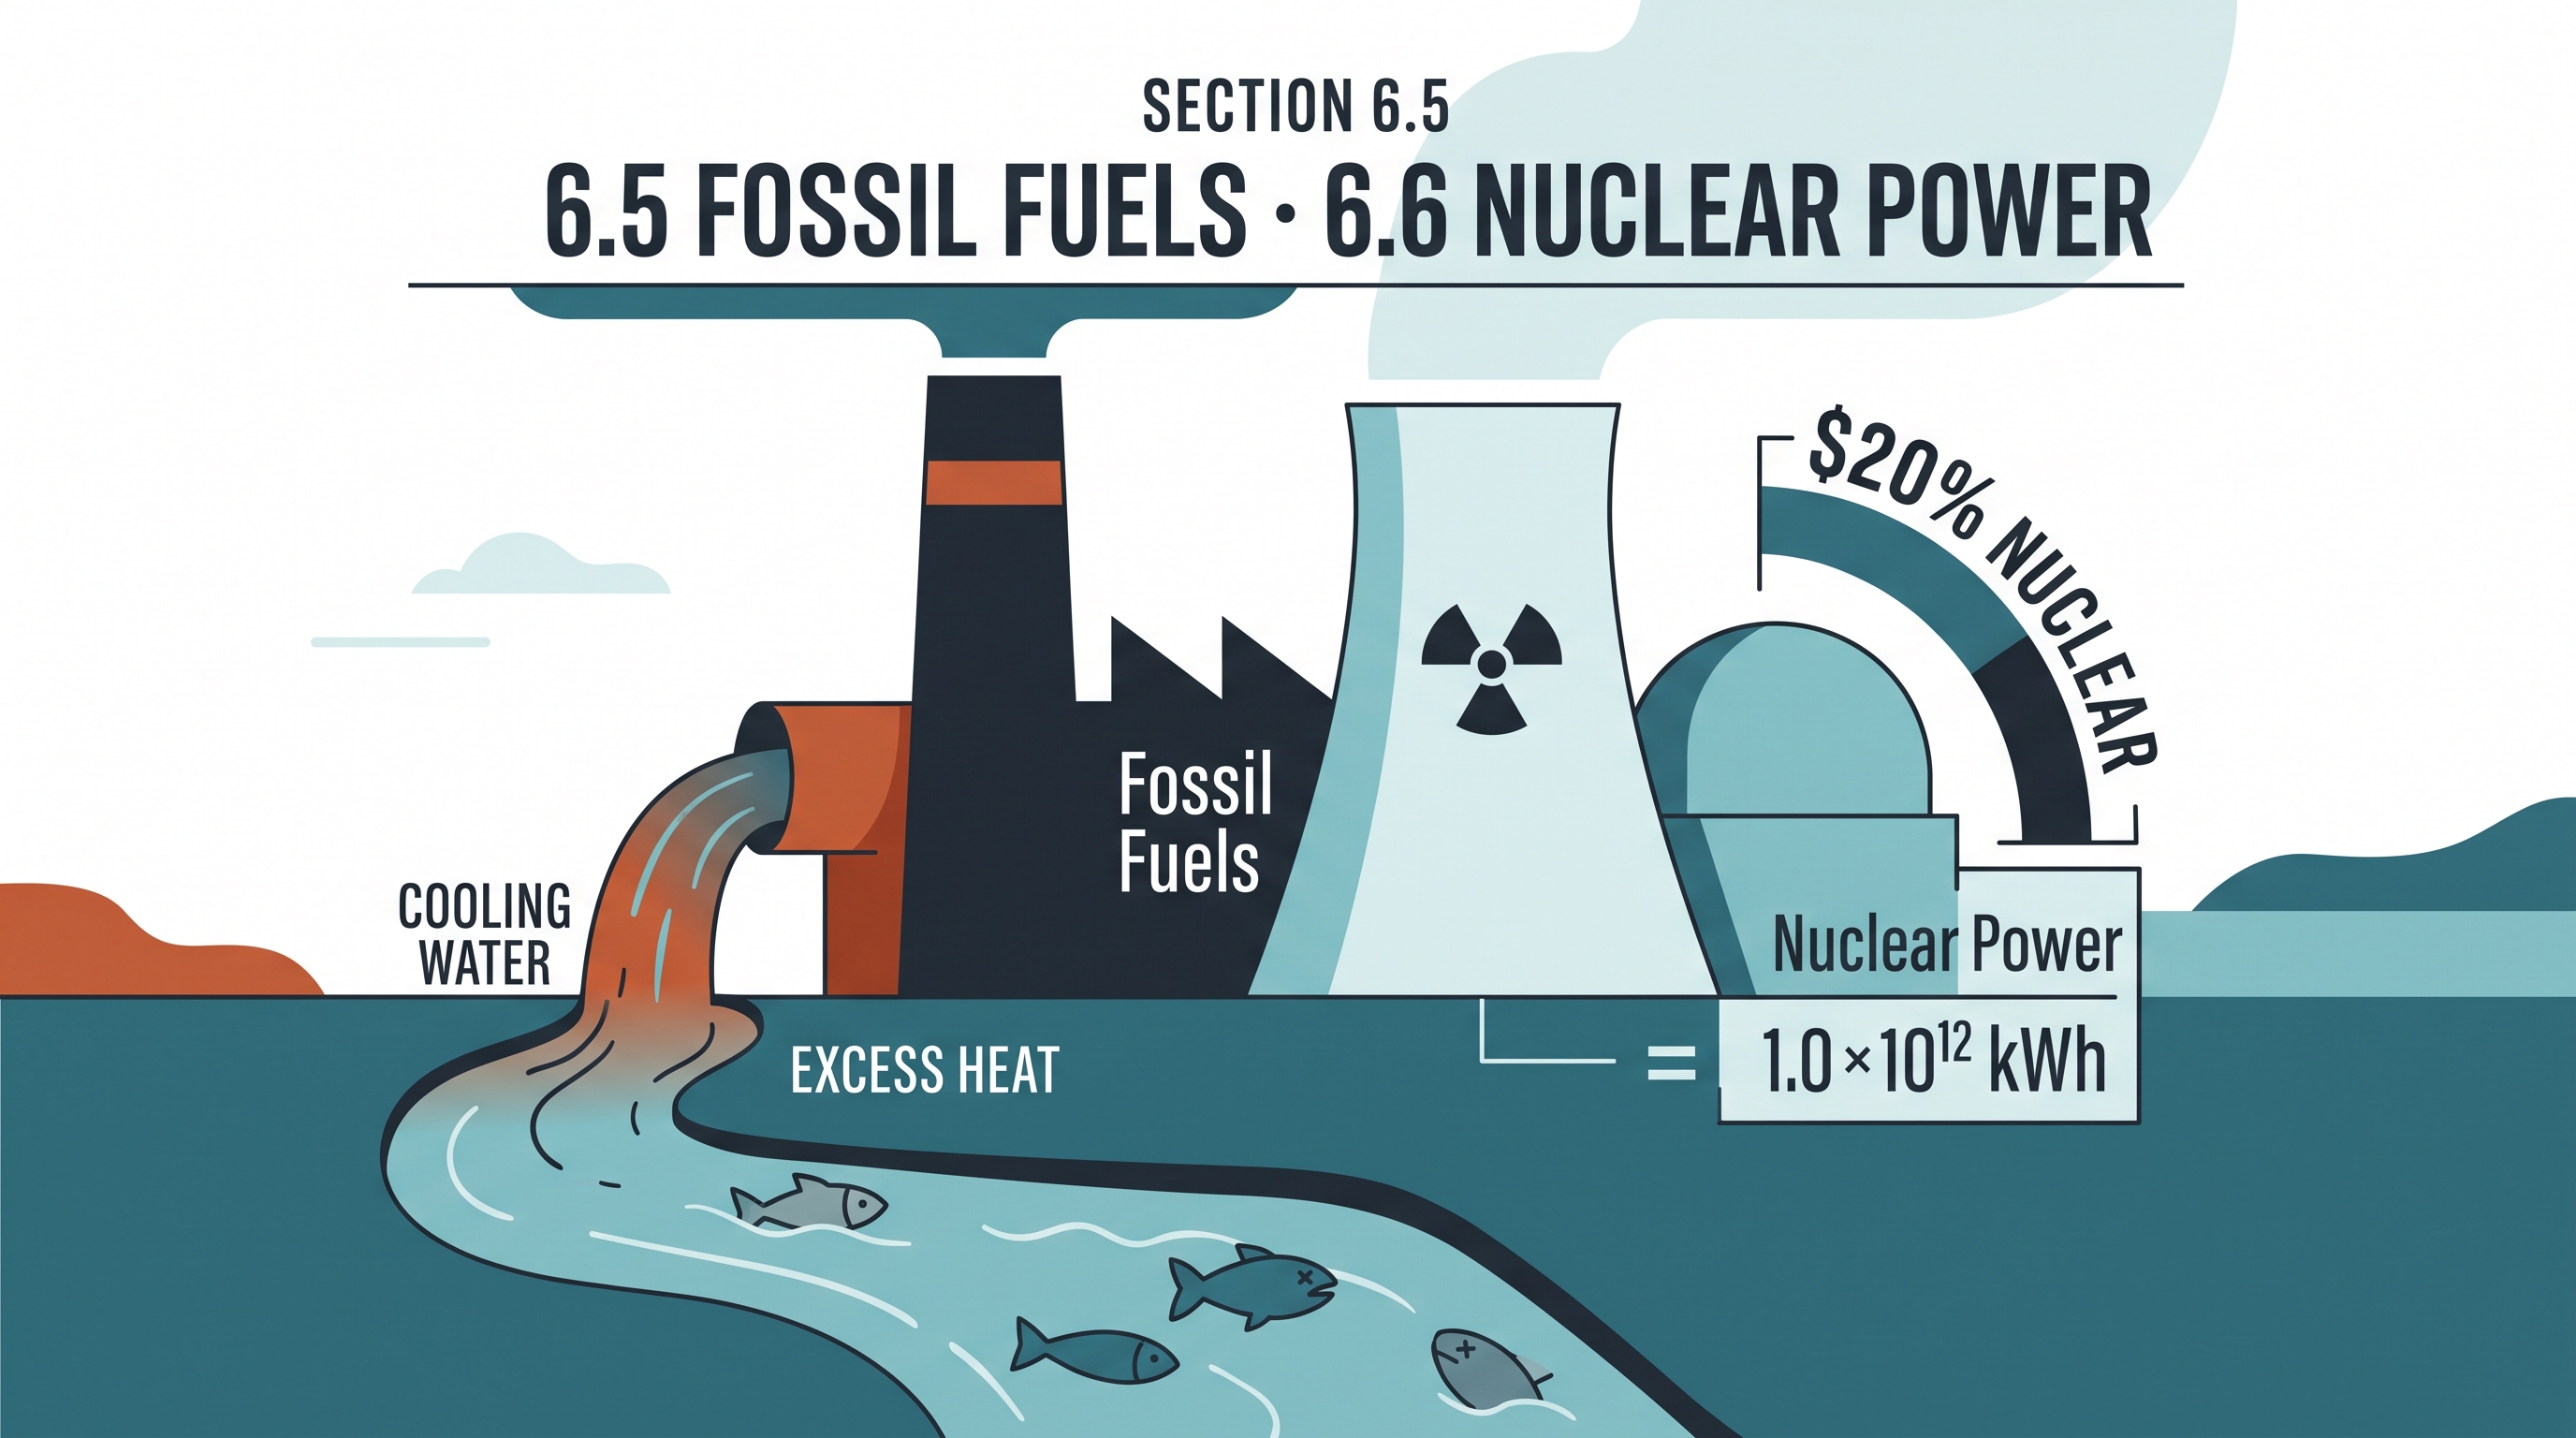
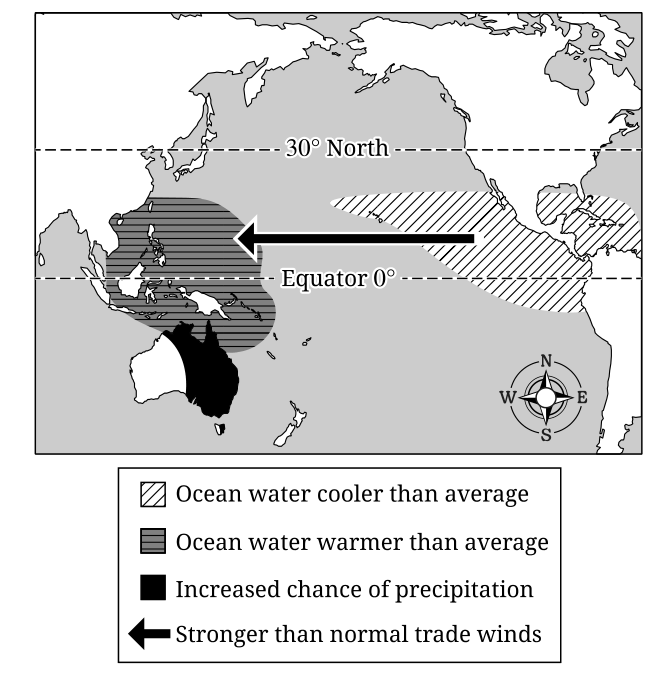
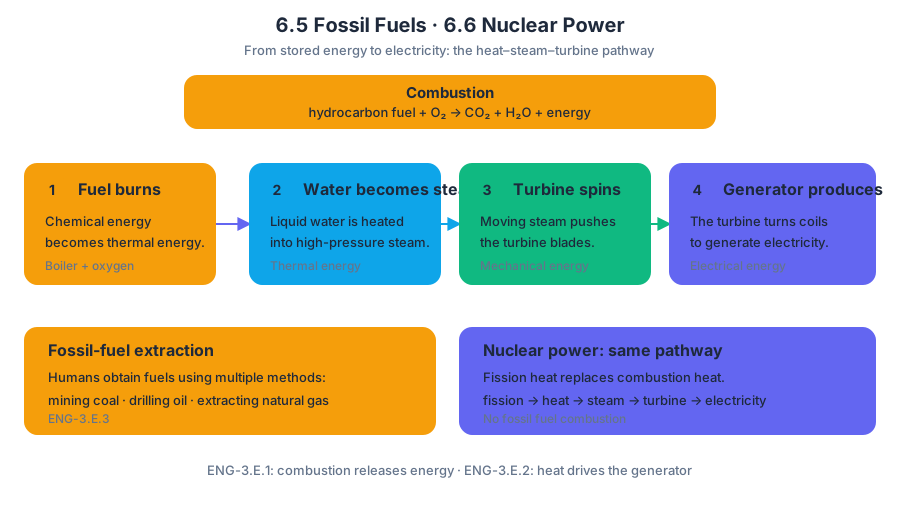
6.7 Energy from Biomass · 6.8 Solar Energy
Key concepts: Biomass energy · Environmental consequences of overharvesting trees for fuel · Ethanol as a biomass-based gasoline fuel · Carbon emissions from burning biomass fuels · Solar energy · Photovoltaic systems · Active solar energy systems · Availability of sunlight as a limitation · Environmental benefits and impacts of solar energy · Energy use producing positive and negative consequences
A forest can become a fuel tank—but if people remove trees faster than the ecosystem replaces them, the “renewable” fuel source can produce lasting damage.
6.7 Energy from Biomass · 6.8 Solar Energy
A forest can become a fuel tank—but if people remove trees faster than the ecosystem replaces them, the “renewable” fuel source can produce lasting damage. Biomass and solar energy both originate from the Sun, yet they transform solar energy in very different ways and carry different environmental trade-offs.
6.7 Energy from Biomass
Biomass energy is energy obtained from recently living biological material, such as trees, crop residues, or other plant matter. Burning biomass releases stored chemical energy as heat, which can be used directly for cooking and heating or converted into electricity.
ENG-3.I.1 — Burning of biomass produces heat for energy.
The central advantage of biomass is that plants capture atmospheric carbon dioxide during photosynthesis and store carbon in their tissues. When biomass is burned, carbon returns to the atmosphere as carbon dioxide. If new plants replace the harvested material, some of that carbon may later be removed from the atmosphere again.
That carbon cycle does not make every biomass system environmentally harmless. Overharvesting trees for fuel can cause deforestation, which is the conversion or removal of forest cover, and habitat loss, which reduces the space and resources available to organisms. Soil erosion, reduced biodiversity, disrupted water cycling, and declining carbon storage can persist long after the fuel has been burned.
Misconception check: “Biomass is renewable, so using it has no environmental cost.”
Correction: Biomass is renewable only when its biological source is replenished at a rate comparable to its removal. A forest harvested faster than it regrows is being depleted.
Biomass can also become a liquid transportation fuel. Ethanol is an alcohol fuel produced from plant material, commonly from crops containing sugars or starches. It can be blended with gasoline or used as a gasoline substitute.
Burning ethanol releases carbon dioxide, but that carbon was recently removed from the atmosphere by the plants used to make the ethanol. Therefore, combustion of ethanol does not introduce additional carbon into the atmosphere in the same way that burning fossil fuels does, because fossil fuels release carbon that has remained stored underground for very long periods.
The comparison must include the entire production system. Growing, harvesting, processing, and transporting biomass require energy. Ethanol can therefore have a low energy return on energy investment, meaning the energy obtained from the fuel is not much greater than the energy required to produce it. Land used for fuel crops may also compete with food production or natural habitat.
Worked example: comparing two biomass choices
A community can either collect fallen branches from a managed forest or cut mature trees for fuel. The first option removes material that is already available while preserving most living vegetation. The second may produce more fuel immediately, but repeated harvesting reduces forest structure, wildlife habitat, and future carbon storage.
A strong environmental analysis would therefore identify both sides: biomass combustion supplies heat and can recycle recently captured carbon, but unsustainable harvesting can cause deforestation and habitat loss. The better choice depends on harvest rate, regrowth, land use, and the energy required to process the fuel.
6.8 Solar Energy
Solar energy uses radiation from the Sun as an energy source. Solar technologies generally have low environmental impacts during operation because they do not require combustion and therefore do not directly produce air pollutants or combustion-related carbon dioxide while generating electricity or heat.
ENG-3.J.1 — Photovoltaic solar cells capture light energy from the sun and transform it directly into electrical energy. Their use is limited by the availability of sunlight.
A photovoltaic system uses solar cells to produce electricity directly from incoming light. The electricity can power devices immediately, enter an electrical grid, or charge batteries for later use.
The key limitation is intermittency: photovoltaic output decreases during cloud cover and falls to zero at night. Solar systems therefore often require energy storage, backup generation, transmission connections, or changes in electricity demand to provide dependable power at all times.
ENG-3.J.2 — Active solar energy systems use solar energy to heat a liquid through mechanical and electric equipment to collect and store the energy captured from the sun.
An active solar energy system uses equipment such as pumps, pipes, collectors, and storage tanks. Sunlight heats a liquid, and mechanical or electrical components circulate that liquid so its thermal energy can be stored or used for water and space heating.
Solar energy is generally clean during operation, but it is not impact-free across its entire life cycle. Solar systems can have high initial costs, and large installations require land. In desert environments, extensive solar facilities may disrupt habitats, fragment wildlife movement, or disturb fragile soils and biological communities.
Misconception check: “Solar panels work only when they produce electricity.”
Correction: A panel can still receive sunlight but produce less electricity when sunlight is weak, the panel is shaded, or its angle is unfavorable. Solar availability is a resource constraint, not simply an on-or-off switch.
Retrieval check
A town replaces gasoline with ethanol and installs photovoltaic panels. Identify one reason ethanol can avoid adding fossil carbon to the atmosphere, one environmental consequence of overharvesting trees for biomass, and one limitation of photovoltaic energy. A complete response should connect ethanol to recently cycled plant carbon, overharvesting to deforestation or habitat loss, and photovoltaic output to sunlight availability.
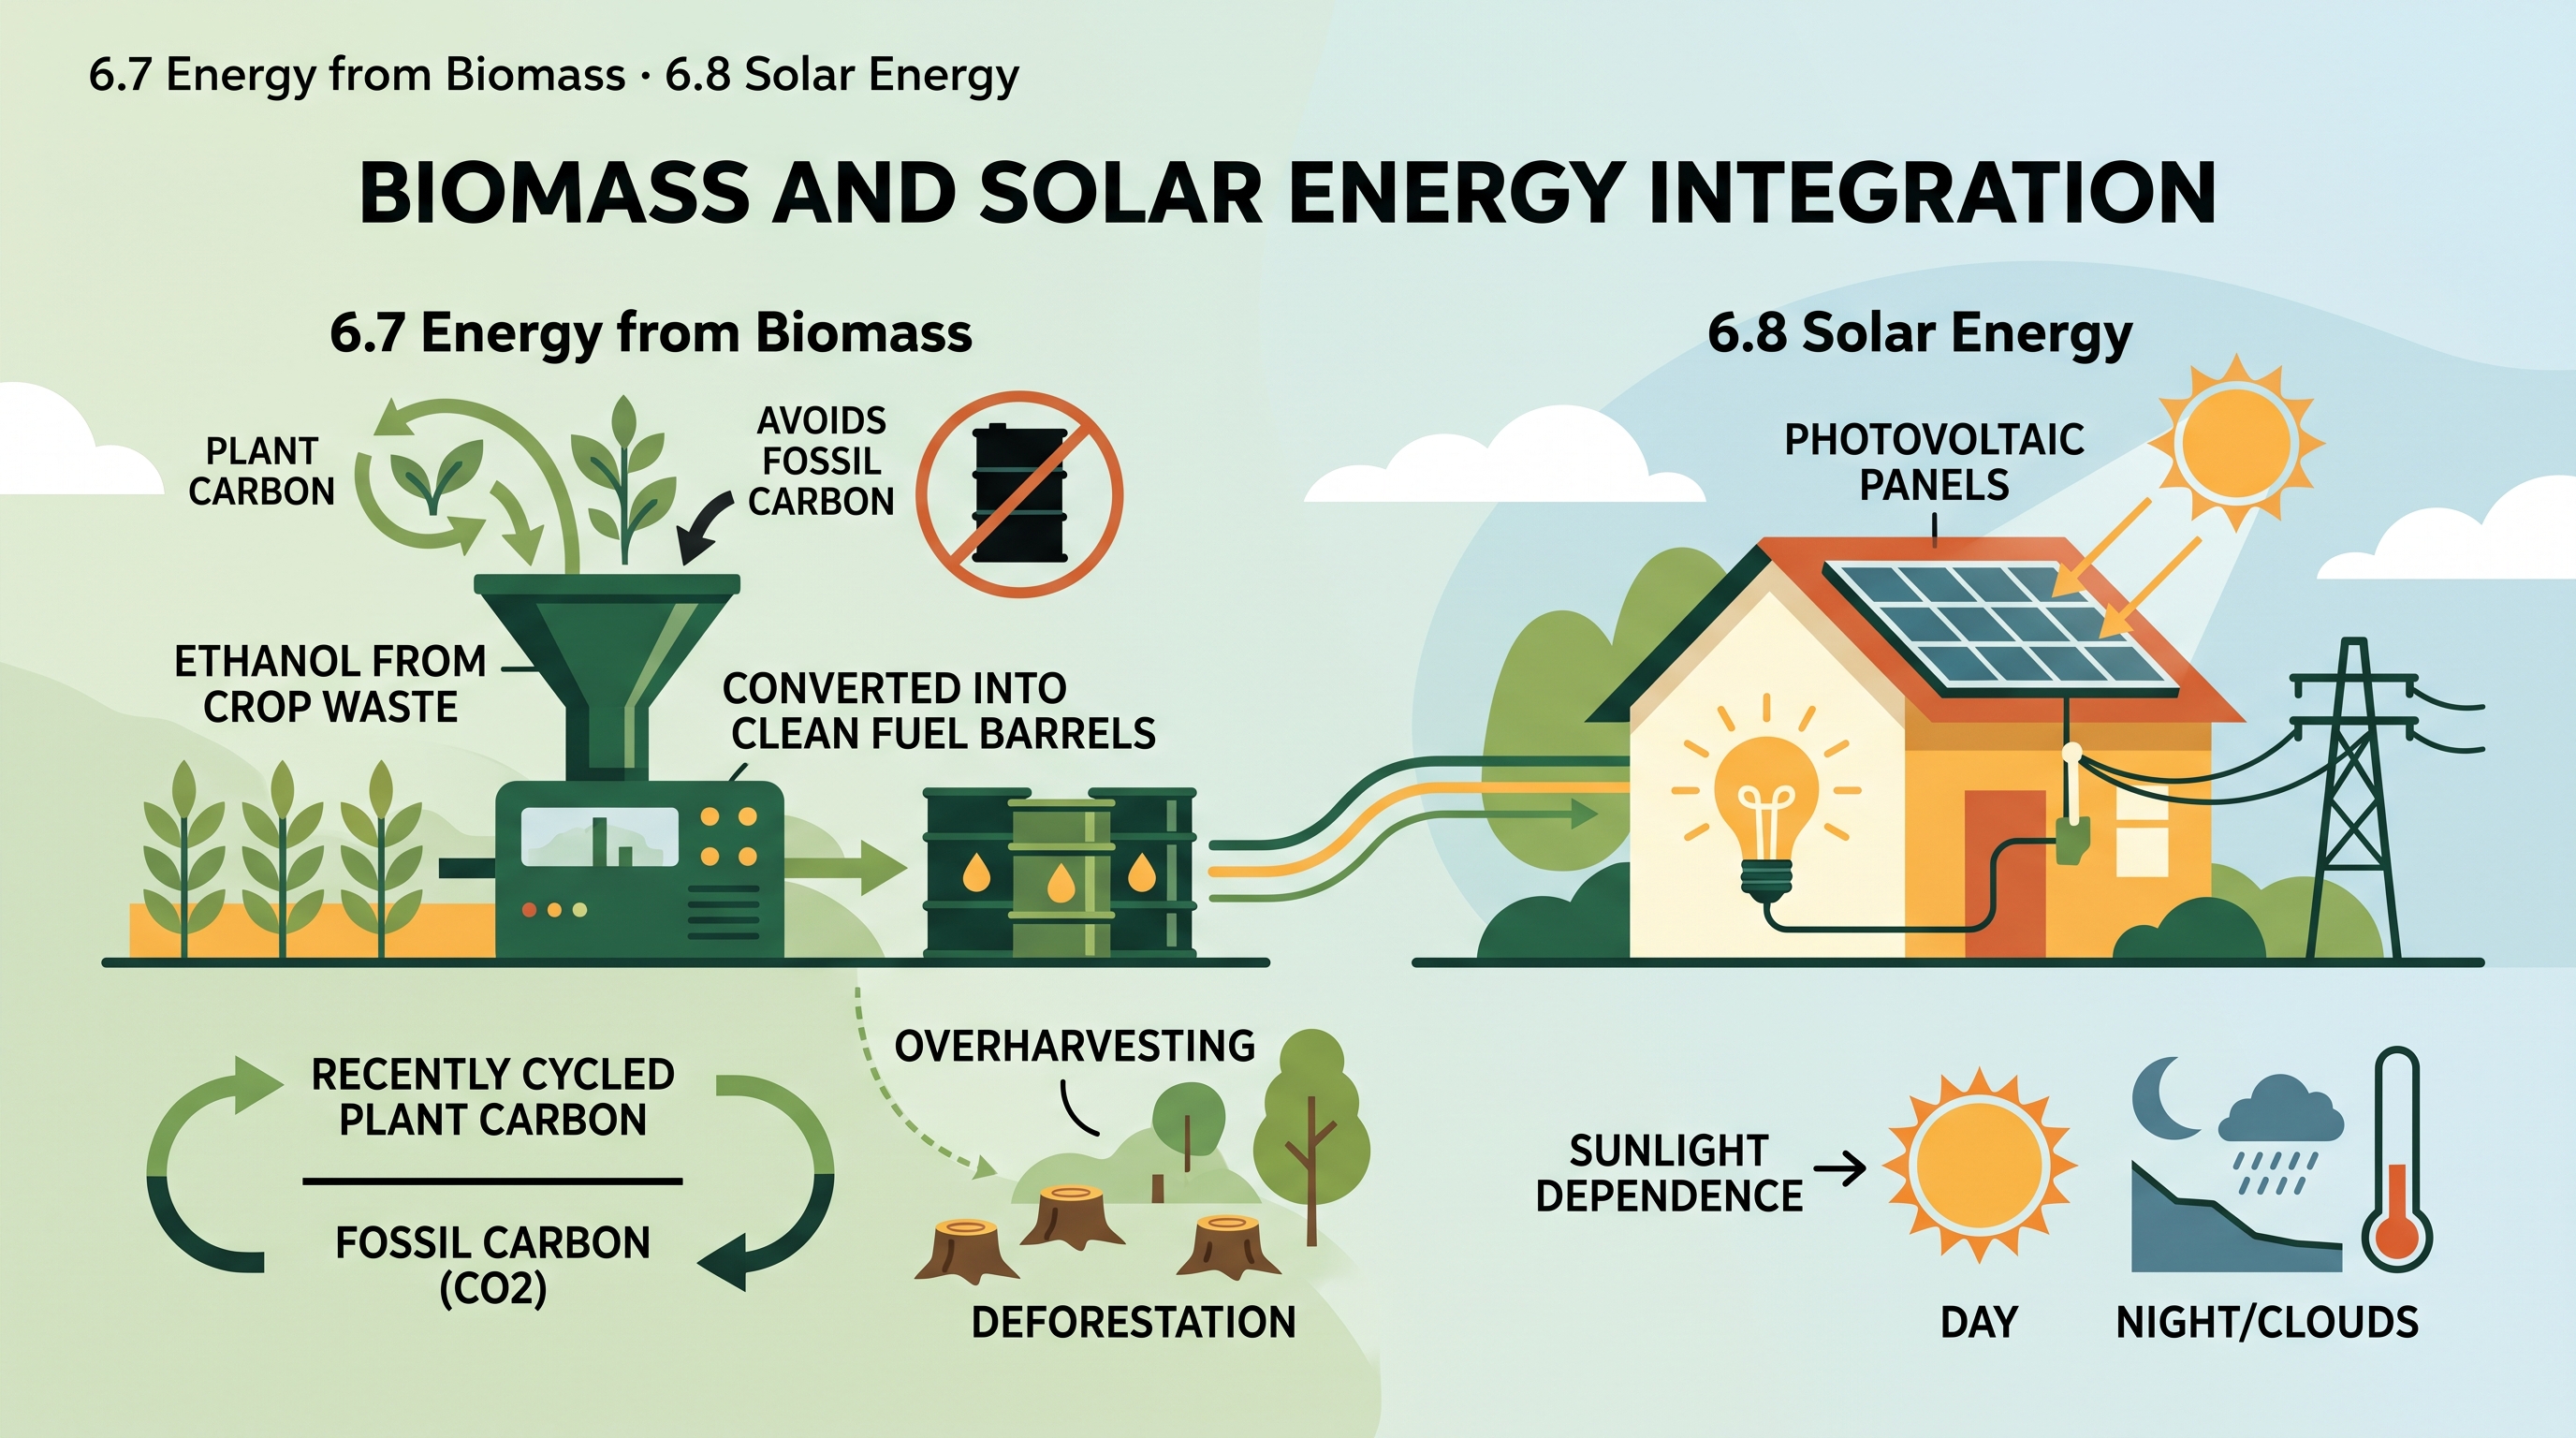
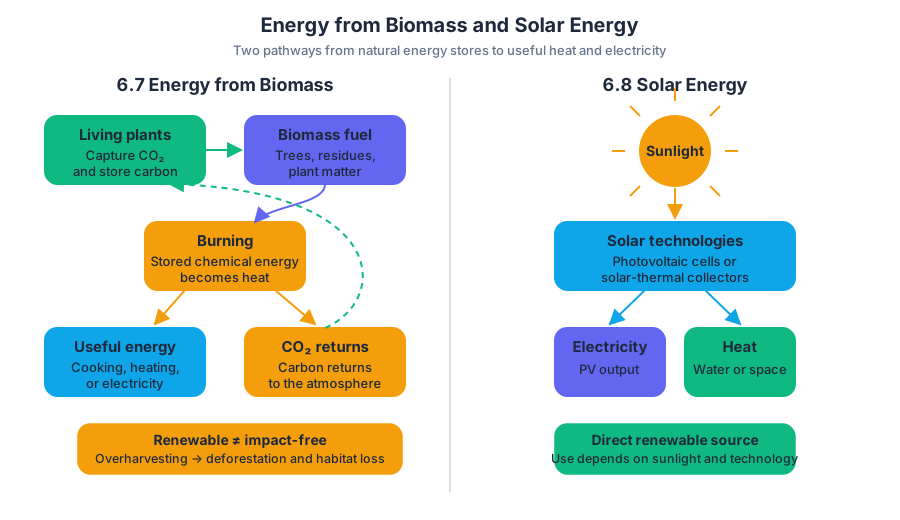
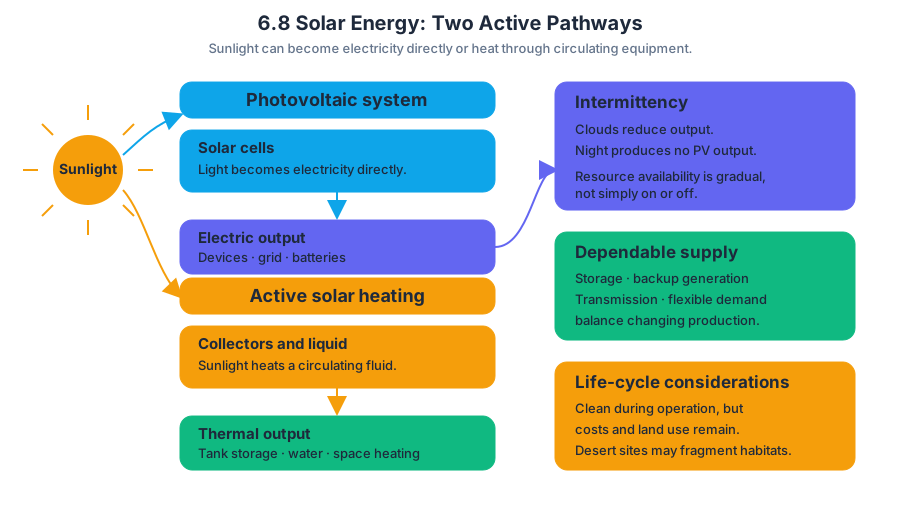
6.9 Hydroelectric Power · 6.10 Geothermal Energy
Key concepts: Hydroelectric power generation · Dams and reservoirs · River turbines · Tidal energy · Environmental effects of hydroelectricity · Geothermal energy generation · Geothermal energy accessibility and cost · Hydrogen sulfide release · Thermal energy from Earth · Turbines and electricity generation
Both hydroelectric and geothermal systems generate electricity by turning a turbine—a rotating machine connected to an electric generator—but they draw energy from different natural flows: hydroelectricity uses moving water, while geothermal energy uses heat stored inside Earth.
6.9 Hydroelectric Power · 6.10 Geothermal Energy
Both hydroelectric and geothermal systems generate electricity by turning a turbine—a rotating machine connected to an electric generator—but they draw energy from different natural flows: hydroelectricity uses moving water, while geothermal energy uses heat stored inside Earth.
Hydroelectric power: turning water movement into electricity
Hydroelectric power is electricity generated when moving or falling water spins a turbine. The turbine transfers mechanical energy to a generator, which converts that motion into electrical energy.
Under ENG-3.L, “Describe the use of hydroelectricity in power generation,” the required mechanisms are identified in ENG-3.L.1 and ENG-3.L.2:
- Dams and reservoirs: A dam built across a river blocks or regulates the river’s flow. Water collects behind it in a reservoir, and water released through an outlet moves rapidly through turbines.
- River turbines: Turbines can be placed directly in smaller rivers. Flowing water turns the turbine without requiring a large reservoir.
- Tidal energy: Tidal flows can also turn turbines. Here, the moving water comes from the regular rise, fall, and movement of ocean tides rather than from river discharge.
Worked example — a reservoir system: A dam stores water high above a downstream turbine. When operators release water, gravity causes it to flow downhill through the turbine. The turbine rotates, the generator produces electricity, and the water continues downstream. The key energy conversion is approximately:
$$ \text{gravitational potential energy} \rightarrow \text{kinetic energy of water} \rightarrow \text{mechanical energy of turbine} \rightarrow \text{electrical energy} $$
A small “run-of-river” installation follows the same central principle but uses the river’s existing current. It may reduce the need for a large reservoir, although the amount of electricity produced depends strongly on the river’s flow rate.
Environmental trade-offs
Under ENG-3.M, “Describe the effects of the use of hydroelectricity in power generation on the environment,” ENG-3.M.1 requires a balanced description. Hydroelectric power generation does not produce air pollution or waste during electricity generation, but construction can be expensive and dams can cause the loss of or change in habitats.
The environmental effects occur mainly because a dam changes the river system:
| Benefit | Environmental or economic cost |
|---|---|
| Electricity generation does not directly produce air pollution or waste | Construction of dams and power plants can be expensive |
| Reservoirs can regulate water flow | Flooding upstream areas can eliminate or alter terrestrial and aquatic habitats |
| Flowing water provides a renewable energy source | Altered river flow can change downstream habitats and ecological conditions |
Misconception check — “Hydroelectric power has no environmental impact.” The correct claim is narrower: hydroelectric electricity generation does not generate air pollution or waste in the way many fuel-burning systems do. The dam itself can substantially alter habitats, so “no air pollution” does not mean “no environmental effects.”
Geothermal energy: using Earth’s internal heat
Geothermal energy is energy obtained from heat stored in Earth’s interior. Much of this internal heat results from radioactive decay, and it can be used to heat underground water until the water becomes steam.
The generation pathway in ENG-3.N, “Describe the use of geothermal energy in power generation,” is specified by ENG-3.N.1:
$$ \text{Earth’s internal heat} \rightarrow \text{heated underground water} \rightarrow \text{steam} \rightarrow \text{turbine rotation} \rightarrow \text{electricity} $$
A geothermal facility brings steam—or hot water that is converted into steam—to the surface. The steam drives an electric generator. Unlike hydroelectricity, the immediate energy source is not water’s motion caused by gravity; it is thermal energy from Earth.
Limits and environmental effects
Under ENG-3.O, “Describe the effects of the use of geothermal energy in power generation on the environment,” ENG-3.O.1 emphasizes two important limitations: accessing geothermal energy can be prohibitively expensive, and geothermal resources are not easily accessible in many parts of the world.
Geothermal energy therefore has a geographic and economic constraint. A region may contain substantial underground heat, yet drilling deeply enough to reach usable hot water or steam may cost too much for electricity production to be practical.
Geothermal facilities can also release hydrogen sulfide, a gas associated with a rotten-egg odor and environmental and health concerns at elevated concentrations. Thus, geothermal energy is not automatically impact-free simply because it does not rely on combustion.
Misconception check — “Geothermal energy is available everywhere.” Earth is hot inside, but usable geothermal energy is not equally accessible in every location. The relevant question is whether heat can be reached and transferred to water economically, not merely whether Earth’s interior contains heat.
AP skill connection and retrieval check
This topic most directly develops Science Practice 1: Concept Explanation, especially Skill 1.A: Describe environmental concepts and processes. A strong response names the energy source, explains how that source turns a turbine, and identifies a specific environmental or economic consequence rather than offering a vague claim such as “it is sustainable.”
Retrieval check: A proposed power site has a fast-flowing river but no suitable underground steam reservoir. Which energy technology is directly supported by the site, and what turbine process would generate electricity? Then name one environmental effect that could result if a dam and reservoir were constructed.
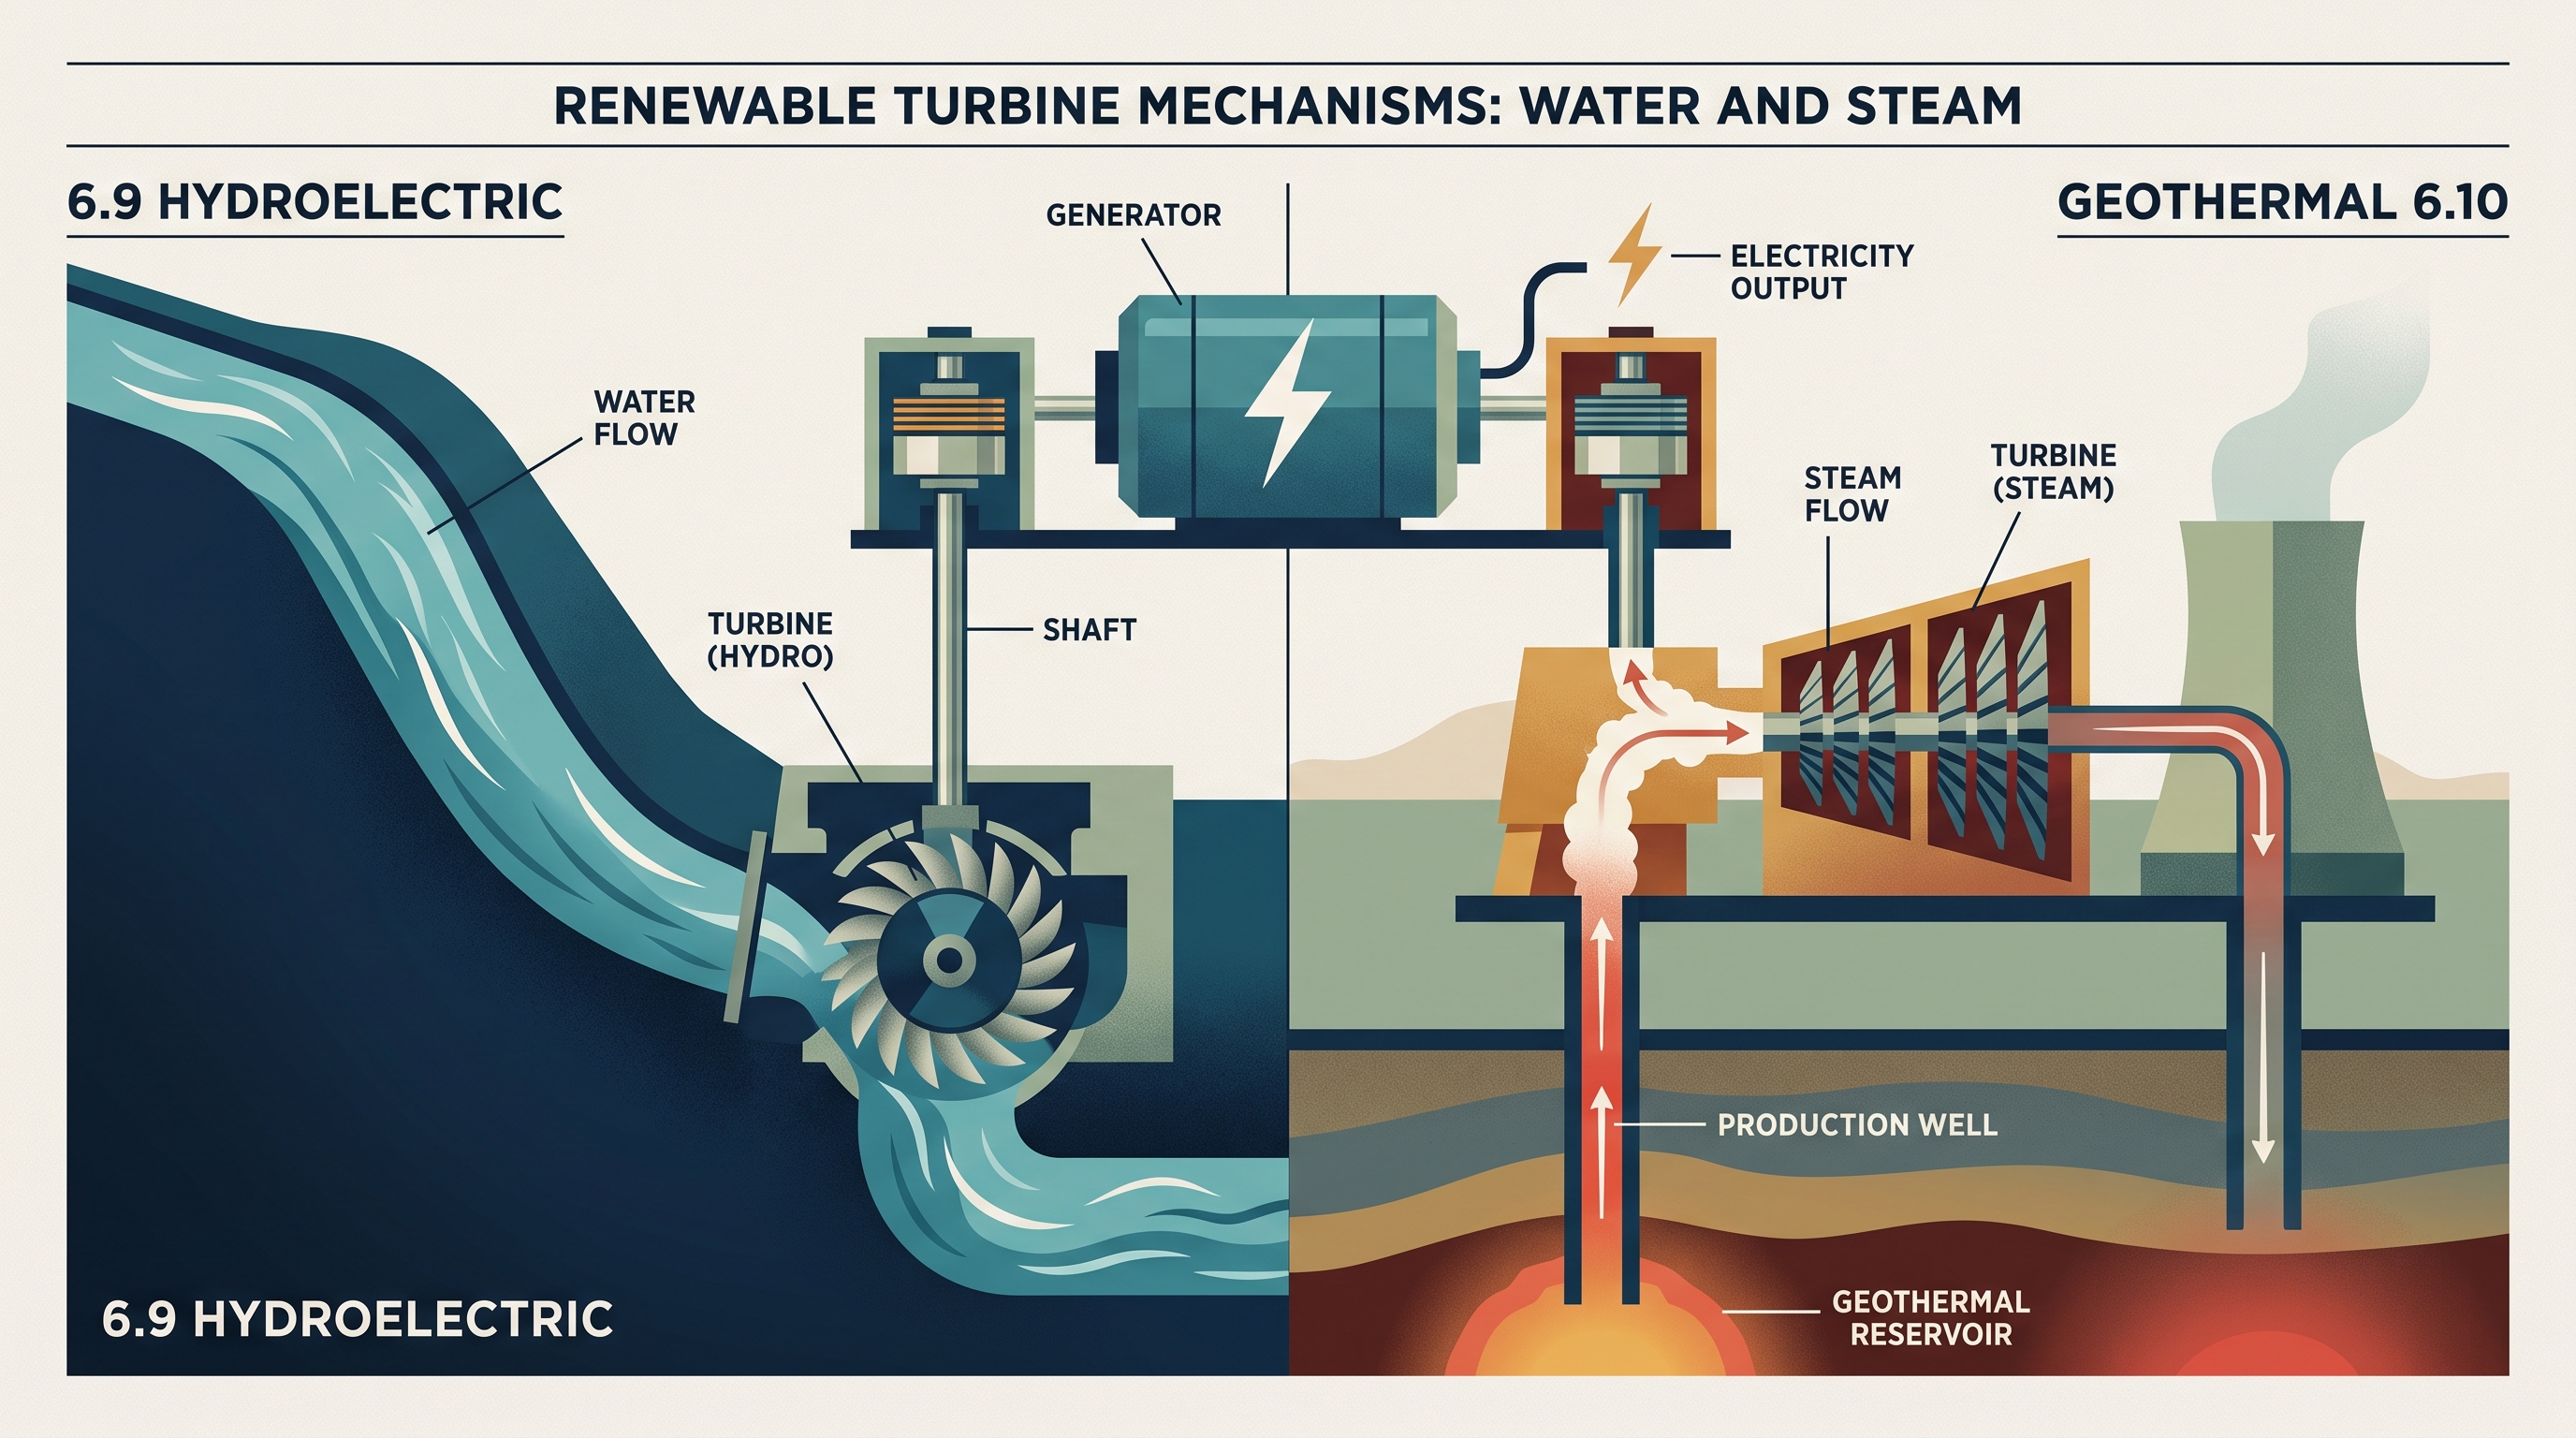
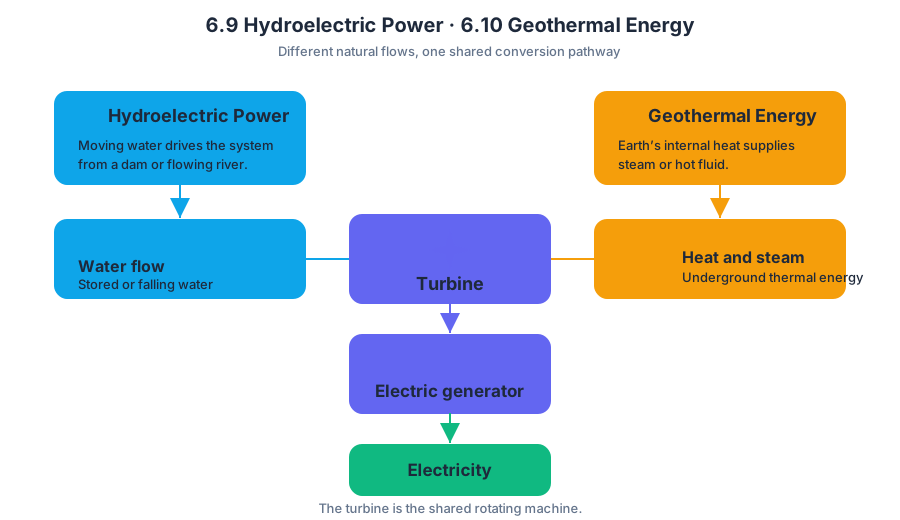
6.11 Hydrogen Fuel Cell · 6.12 Wind Energy
Key concepts: Hydrogen fuel cells · Hydrogen and oxygen reaction · Renewable fuel sources · Hydrogen fuel cells in power generation · Environmental impacts of hydrogen fuel cells · Hydrogen fuel-cell automobiles · Energy-intensive hydrogen production · Economic cost of hydrogen vehicles · Safety risks of hydrogen fuel cells · Wind energy
A hydrogen fuel cell generates electricity by combining hydrogen gas with oxygen from the air; a wind turbine generates electricity by capturing the kinetic energy of moving air.
6.11 Hydrogen Fuel Cell · 6.12 Wind Energy
A hydrogen fuel cell generates electricity by combining hydrogen gas with oxygen from the air; a wind turbine generates electricity by capturing the kinetic energy of moving air. Both can replace some nonrenewable fuel use, but neither is environmentally consequence-free: the key question is where the input energy comes from and what impacts occur during construction and operation.
6.11 Hydrogen Fuel Cell
A hydrogen fuel cell is an electrochemical device that uses hydrogen as a fuel and oxygen as the reactant. Instead of burning hydrogen in a flame, the cell separates the chemical reaction into steps that produce an electric current. The overall reaction can be represented as:
$$ 2H_2 + O_2 \rightarrow 2H_2O + \text{energy} $$
In practical terms, hydrogen enters one side of the cell and oxygen enters from the air. Hydrogen is split into positively charged hydrogen ions and electrons; the electrons travel through an external circuit, producing electricity, while the ions and oxygen combine to form water. The main product, or emission, from the fuel cell is water rather than carbon dioxide.
This makes hydrogen fuel cells an alternative to nonrenewable fuel sources. A fuel-cell power station, for example, could receive stored hydrogen, combine it with air, and supply electricity to a hospital, factory, or local electrical grid. It can generate power without the direct carbon dioxide emissions produced by burning coal, oil, or natural gas.
Environmental trade-offs
The environmental advantage depends strongly on how the hydrogen is produced. If electricity from a renewable source is used to separate water into hydrogen and oxygen, the hydrogen can be produced with no carbon dioxide emissions from the production process. During operation, the fuel cell also produces no carbon dioxide, so its direct environmental impact is relatively low.
However, hydrogen is an energy carrier, not usually a primary energy source. Energy must first be used to create, compress, transport, and store the hydrogen. If that energy comes from fossil fuels, carbon dioxide may be released before the hydrogen ever reaches the fuel cell. Even when the hydrogen is produced from water, the process may require substantial energy—possibly more energy than the fuel cell ultimately generates for a vehicle.
Hydrogen technology also has economic and safety limitations. Hydrogen fuel-cell automobiles are currently expensive to manufacture, and hydrogen is highly flammable; a vehicle involved in an accident may present an explosion risk.
Misconception check: “A hydrogen fuel-cell vehicle has the same disadvantage as a battery-powered vehicle because charging stations may be unavailable or the battery may fail.”
The relevant disadvantages here are the high manufacturing cost, energy-intensive hydrogen production, and possible explosion risk. Limited charging stations and battery problems describe battery-electric vehicles, not the key CED disadvantage of hydrogen fuel cells.
6.12 Wind Energy
Wind energy uses moving air as a renewable energy source. Uneven solar heating creates differences in air temperature and pressure; air moves from areas of higher pressure toward areas of lower pressure. A wind turbine captures part of that moving air’s kinetic energy.
The conversion pathway is:
$$ \text{wind kinetic energy} \rightarrow \text{rotational mechanical energy} \rightarrow \text{electrical energy} $$
As wind pushes the turbine blades, the rotor turns a shaft connected to a generator. The generator converts mechanical rotation into electricity, which can then be transmitted to users. Unlike a fossil-fuel power plant, a wind turbine does not combust fuel during operation, so it produces no direct carbon dioxide or air-pollutant emissions.
Benefits and limitations
Wind power is renewable because atmospheric motion is continually regenerated by solar heating. It also uses little water during operation and can reduce dependence on nonrenewable fuel sources. A wind farm can therefore lower operational greenhouse-gas emissions when it displaces electricity generated by fossil fuels.
Wind is intermittent: turbines produce electricity only when wind speeds fall within their operating range. Electricity demand, however, continues even during calm conditions, so wind power may require energy storage, transmission connections, or complementary generating sources. Turbine construction also requires materials and land, and installations may create visual and noise impacts or harm birds and bats if poorly located.
The important comparison is not “renewable equals impact-free.” A wind farm generally has low impacts during electricity generation, while its larger concerns involve intermittency, infrastructure, habitat disturbance, and wildlife collisions. A hydrogen fuel cell similarly has clean direct emissions, but its total environmental benefit depends on the energy used to produce the hydrogen.
Worked application
A rural hospital needs reliable electricity. A wind farm could supply low-emission electricity when wind conditions are favorable. Excess renewable electricity could produce hydrogen from water; the hydrogen could then be stored and fed into a fuel cell when wind output is low. This pairing addresses wind’s intermittency, but it adds energy losses and costs during hydrogen production, compression, storage, and reconversion to electricity.
Retrieval check
A hydrogen fuel cell receives hydrogen produced using electricity from coal-fired power plants. Does the vehicle have zero carbon dioxide emissions overall? No. The fuel cell produces no carbon dioxide at the vehicle, but upstream coal combustion released carbon dioxide while producing the hydrogen. Explain one advantage and one limitation of wind energy: a strong response identifies renewable, low-direct-emission electricity as an advantage and intermittency or wildlife and land impacts as a limitation.
AP alignment
ENG-3.P — Describe the use of hydrogen fuel cells in power generation. Connect the hydrogen–oxygen reaction to electricity production and water as the product. ENG-3.Q — Describe the effects of the use of hydrogen fuel cells in power generation on the environment. Explain both the low direct carbon dioxide emissions and the energy and cost required to produce hydrogen. The suggested science practice is 1.C: Concept Explanation, especially when applying these processes to a power station or vehicle.
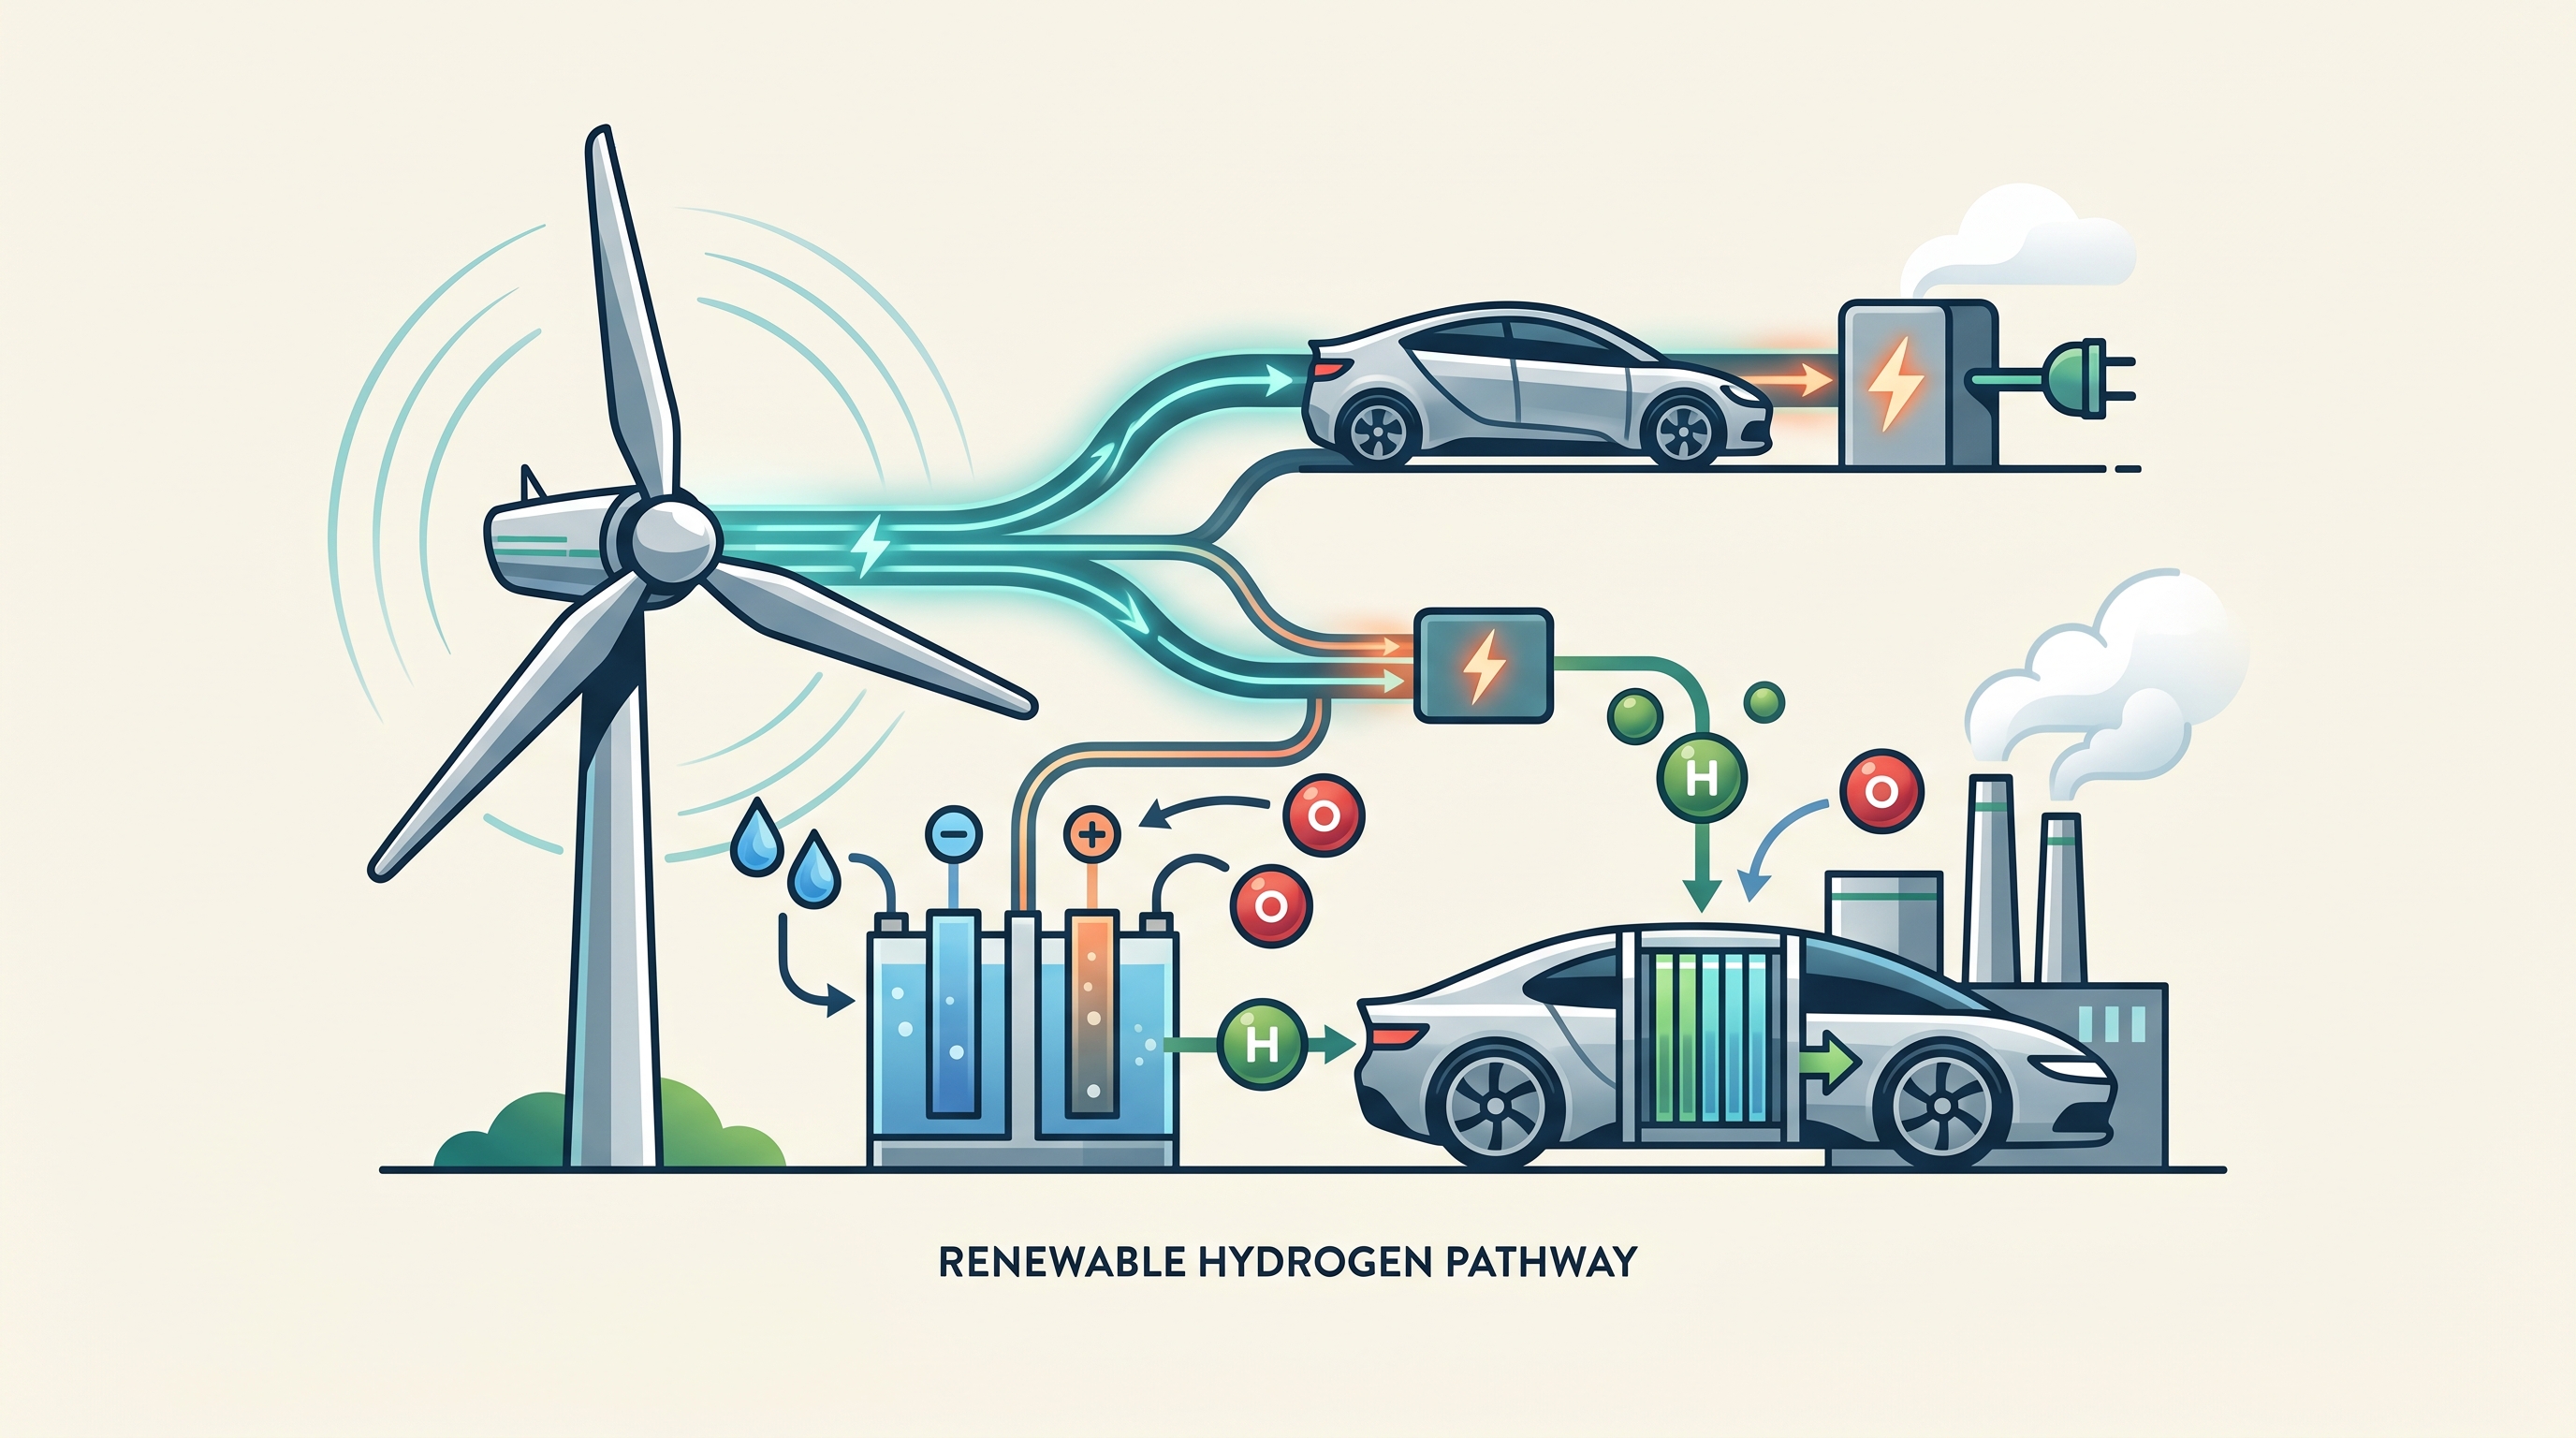
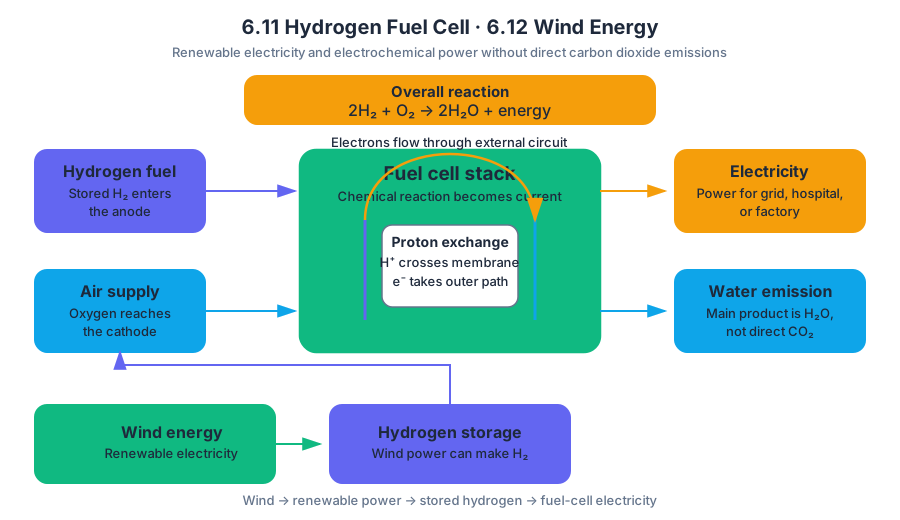
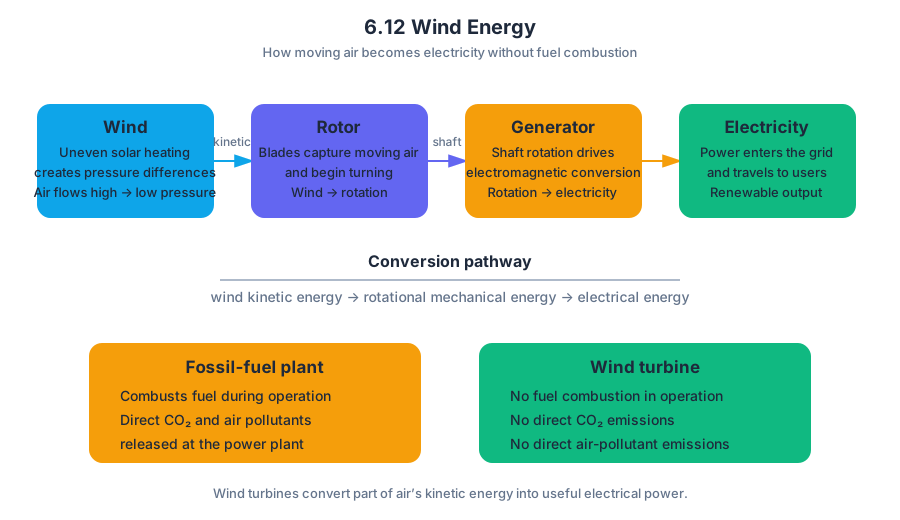
6.13 Energy Conservation
Energy conservation means reducing the amount of energy consumed while still providing the same useful service—such as lighting a room, heating a building, or transporting a person.
6.13 Energy Conservation
Energy conservation means reducing the amount of energy consumed while still providing the same useful service—such as lighting a room, heating a building, or transporting a person. The key question is not simply “Which energy source is better?” but “How can society accomplish the same task with less energy?”
A light-emitting diode (LED) illustrates the idea. If an incandescent bulb uses $60\ \text{W}$ to provide a desired amount of light but an LED provides comparable light using $10\ \text{W}$, replacing the bulb does not eliminate the need for lighting; it reduces the electricity required for that service.
Conservation versus efficiency
Energy conservation is the broad practice of using less energy. Energy efficiency is the use of technology or design that provides the same output with less energy input. Turning off an unnecessary light is conservation through behavior; replacing an incandescent bulb with an LED is conservation through improved efficiency.
The distinction matters because energy production often creates environmental impacts. Burning fossil fuels can release carbon dioxide, sulfur dioxide, nitrogen oxides, particulate matter, and other pollutants. If a household reduces electricity demand, the power plant may need to generate less electricity, decreasing fuel consumption and associated emissions.
Major methods of energy conservation
| Method | How it reduces energy consumption | Example |
|---|---|---|
| Improved efficiency | Produces the same service with less energy input | LED bulbs, efficient appliances |
| Reduced heat loss | Prevents energy from escaping unnecessarily | Insulation, sealed windows |
| Behavioral changes | Avoids unnecessary energy use | Turning off lights, adjusting thermostats |
| Transportation changes | Reduces energy used per passenger or distance | Public transit, walking, carpooling |
| Building and community design | Decreases heating, cooling, and travel demand | Passive solar design, compact development |
| Energy management | Matches energy use to actual demand | Smart thermostats and efficient scheduling |
Conservation can also reduce peak demand—the highest rate of electricity use during a period. For example, using efficient air-conditioning systems and improving building insulation can reduce the electricity required on very hot afternoons, when many buildings are cooling simultaneously.
Worked example: calculating electricity savings
A school replaces $100$ incandescent bulbs rated at $60\ \text{W}$ with $100$ LED bulbs rated at $10\ \text{W}$. Each bulb operates for $2{,}000$ hours per year. Determine the annual electricity savings.
First calculate the power reduction per bulb:
$$60\ \text{W} - 10\ \text{W} = 50\ \text{W}$$
For $100$ bulbs, the total reduction is:
$$50\ \text{W} \times 100 = 5{,}000\ \text{W} = 5\ \text{kW}$$
Annual electricity savings are:
$$5\ \text{kW} \times 2{,}000\ \text{h} = 10{,}000\ \text{kWh}$$
If electricity costs $$0.15$ per kilowatt-hour, the school saves:
$$10{,}000\ \text{kWh} \times $0.15\ \text{kWh}^{-1} = $1{,}500$$
The environmental benefit depends on how the electricity was generated. The reduction is greatest when the avoided electricity would otherwise come from a highly polluting or carbon-intensive source.
Energy conservation as an environmental solution
Energy conservation can reduce several impacts at once: extraction of coal, oil, natural gas, or uranium; land disturbance from mining and drilling; air pollution from combustion; greenhouse-gas emissions; water use for energy production; and waste from power generation. It is therefore often described as a demand-side strategy: instead of increasing energy supply, society lowers the amount of energy demanded.
However, conservation is not automatically cost-free or equally accessible. Efficient appliances may require an initial investment, building upgrades may be difficult for renters, and public transportation may be unavailable in rural areas. A strong environmental solution considers effectiveness, cost, feasibility, and who receives the benefits.
Common misconception check
Misconception: Energy conservation means abandoning modern technology or using no energy.
Conservation does not mean eliminating useful energy services. It means reducing waste and using energy more effectively. Also, replacing one appliance with a more efficient model does not guarantee lower total consumption if people respond by using it more often—a possibility called the rebound effect.
AP Science Practices in Topic 6.13
Topic 6.13 Energy Conservation is especially suited to the following official science practices:
- Science Practice 1: Concept Application — connect efficiency improvements to reduced fuel use, emissions, and resource extraction.
- Science Practice 2: Visual Representations — interpret an energy-flow diagram or compare energy inputs and useful outputs.
- Science Practice 5: Data Analysis — identify trends in electricity use before and after an efficiency intervention.
- Science Practice 6: Mathematical Routines — calculate energy consumption using $E = Pt$, convert watts to kilowatts, and determine cost or percent change.
- Science Practice 7: Environmental Solutions — evaluate conservation strategies using environmental, economic, and social criteria.
Retrieval check: A building reduces annual electricity use from $50{,}000\ \text{kWh}$ to $42{,}500\ \text{kWh}$. The reduction is $7{,}500\ \text{kWh}$, or:
$$\frac{50{,}000-42{,}500}{50{,}000}\times100 = 15%$$
The building conserved $15%$ of its electricity consumption. It did not necessarily produce $15%$ more electricity; it lowered the demand for electricity.
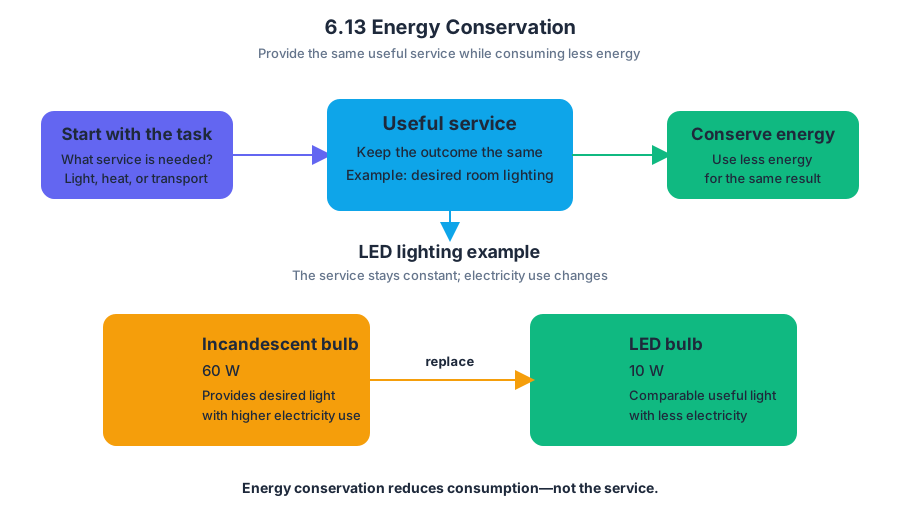
7.1 Introduction to Air Pollution · 7.2 Photochemical Smog
Key concepts: Air pollution from fossil-fuel combustion · Pollutants released by coal combustion · Nitrogen oxides from fossil-fuel combustion · Photochemical smog formation · Role of heat and sunlight in smog formation · Volatile organic hydrocarbons · Primary and secondary air pollutants · Sulfur dioxide and air quality · Lead pollution and Clean Air Act regulation · Catalytic converters as pollution-control devices
A vehicle can release pollutants that were not present in its fuel as separate substances: combustion transforms fuel and oxygen into new gases, particles, and reactive chemicals.
7.1 Introduction to Air Pollution · 7.2 Photochemical Smog
A vehicle can release pollutants that were not present in its fuel as separate substances: combustion transforms fuel and oxygen into new gases, particles, and reactive chemicals. The central question is therefore not simply “What comes out of a smokestack or tailpipe?” but “Which pollutants are released directly, and which form later in the atmosphere?”
Enduring Understanding STB-2: Human activities have physical, chemical, and biological consequences for the atmosphere.
Learning Objective STB-2.A: Identify the sources and effects of air pollutants.
The pollutant mixture from fossil-fuel combustion
Air pollution is the release of substances into the atmosphere at concentrations that can harm organisms, ecosystems, materials, or air quality. Burning coal, gasoline, diesel, and other fossil fuels produces several pollutants at once because fuels contain carbon, hydrogen, sulfur, and impurities, while combustion occurs under conditions that may be incomplete or chemically complex.
| Fuel-combustion source | Important pollutants | Major atmospheric consequence |
|---|---|---|
| Coal combustion | Carbon dioxide, sulfur dioxide, toxic metals, and particulate matter | Climate effects, degraded air quality, and health risks |
| Fossil-fuel combustion generally | Nitrogen oxides, carbon monoxide, hydrocarbons, and particulate matter | Ozone production, photochemical smog, and other pollution |
| Diesel combustion | Sulfur dioxide and particulate matter | Reduced air quality and respiratory hazards |
STB-2.A.1 requires recognition that coal combustion releases carbon dioxide, sulfur dioxide, toxic metals, and particulates. Carbon dioxide is a greenhouse gas; sulfur dioxide can contribute to acid deposition; toxic metals can harm organisms even at low concentrations; and particulate matter consists of small solid particles or liquid droplets suspended in air.
STB-2.A.2 identifies additional pollutants from fossil-fuel combustion. Nitrogen oxides, written collectively as $NO_x$, are released when combustion produces high temperatures that allow atmospheric nitrogen and oxygen to react. In the atmosphere, $NO_x$ contributes to ozone production, photochemical smog, and the formation of nitric acid, which can contribute to acid rain. Incomplete combustion can also produce carbon monoxide, while unburned or partially reacted fuel produces hydrocarbons.
Primary versus secondary pollutants
A primary pollutant enters the atmosphere directly from a source, such as sulfur dioxide emitted by a coal-fired power plant or carbon monoxide emitted by an engine. A secondary pollutant forms in the atmosphere when primary pollutants react with one another or with sunlight, heat, and atmospheric oxygen.
STB-2.A.5 requires this distinction. For example, $NO_x$ may be emitted directly, but ozone near Earth’s surface is generally a secondary pollutant because it forms through atmospheric reactions. The word secondary describes how a pollutant forms—not whether it is less dangerous.
How photochemical smog forms
Photochemical smog is a mixture of secondary air pollutants produced when nitrogen oxides and volatile organic hydrocarbons react in the presence of heat and sunlight. Volatile organic hydrocarbons are carbon-containing compounds that readily evaporate into the air; they can come from fuel vapors, vehicle exhaust, and industrial solvents.
The formation sequence is:
- Fossil-fuel combustion releases $NO_x$ and hydrocarbons.
- Sunlight supplies energy for atmospheric chemical reactions.
- Heat accelerates those reactions.
- The reacting mixture produces ozone and other secondary pollutants.
- The resulting brownish, irritating haze reduces air quality, especially in areas with many vehicles and strong sunlight.
Worked example: Imagine a sunny, hot afternoon in a city with heavy traffic. Tailpipes release $NO_x$, carbon monoxide, hydrocarbons, and particulate matter. Because heat and sunlight are abundant, the $NO_x$ and volatile organic hydrocarbons react in the atmosphere, producing ozone and a variety of other pollutants. The smog therefore does not merely equal the visible exhaust; it is a chemically altered mixture that develops after emission.
Misconception check: Ozone is not always “good” or always “bad.” Stratospheric ozone protects Earth from ultraviolet radiation, while ozone in the lower atmosphere is a harmful component of photochemical smog.
Pollution control and regulation
STB-2.A.3 emphasizes that sulfur dioxide released during fossil-fuel burning—particularly from diesel fuels—can affect air quality. Regulation can reduce emissions at the source. Under the Clean Air Act, the Environmental Protection Agency regulated lead, especially lead in fuels; these policies dramatically decreased the amount of lead in the atmosphere.
A catalytic converter is an air-pollution-control device installed in internal-combustion engine exhaust systems. It converts carbon monoxide, nitrogen oxides, and hydrocarbons into less harmful molecules, including carbon dioxide, nitrogen, oxygen, and water.
AP science practices in this topic
Air-pollution scenarios can assess Science Practice 1: Concept Explanation, when you identify a pollutant’s source and atmospheric effect; Science Practice 2: Visual Representations, when you interpret a reaction pathway or emissions diagram; Science Practice 3: Questions and Methods, when you predict how sunlight, heat, or fuel type would affect an investigation; Science Practice 4: Representing and Describing Data, when you describe pollutant trends; Science Practice 5: Statistical Tests and Data Analysis, when you evaluate whether measured differences support a claim; Science Practice 6: Mathematical Routines, when you calculate emissions or percent change; and Science Practice 7: Environmental Solutions, when you justify catalytic converters, fuel regulation, or another pollution-control strategy.
Retrieval check
A city records high $NO_x$ and hydrocarbon emissions on a hot, sunny day. Which pollutant is most likely to form secondarily, and why? Answer: Ozone, because $NO_x$ and volatile organic hydrocarbons react in the presence of heat and sunlight. Identify one primary pollutant in the same scenario: $NO_x$, carbon monoxide, hydrocarbons, sulfur dioxide, or particulate matter emitted directly from combustion.
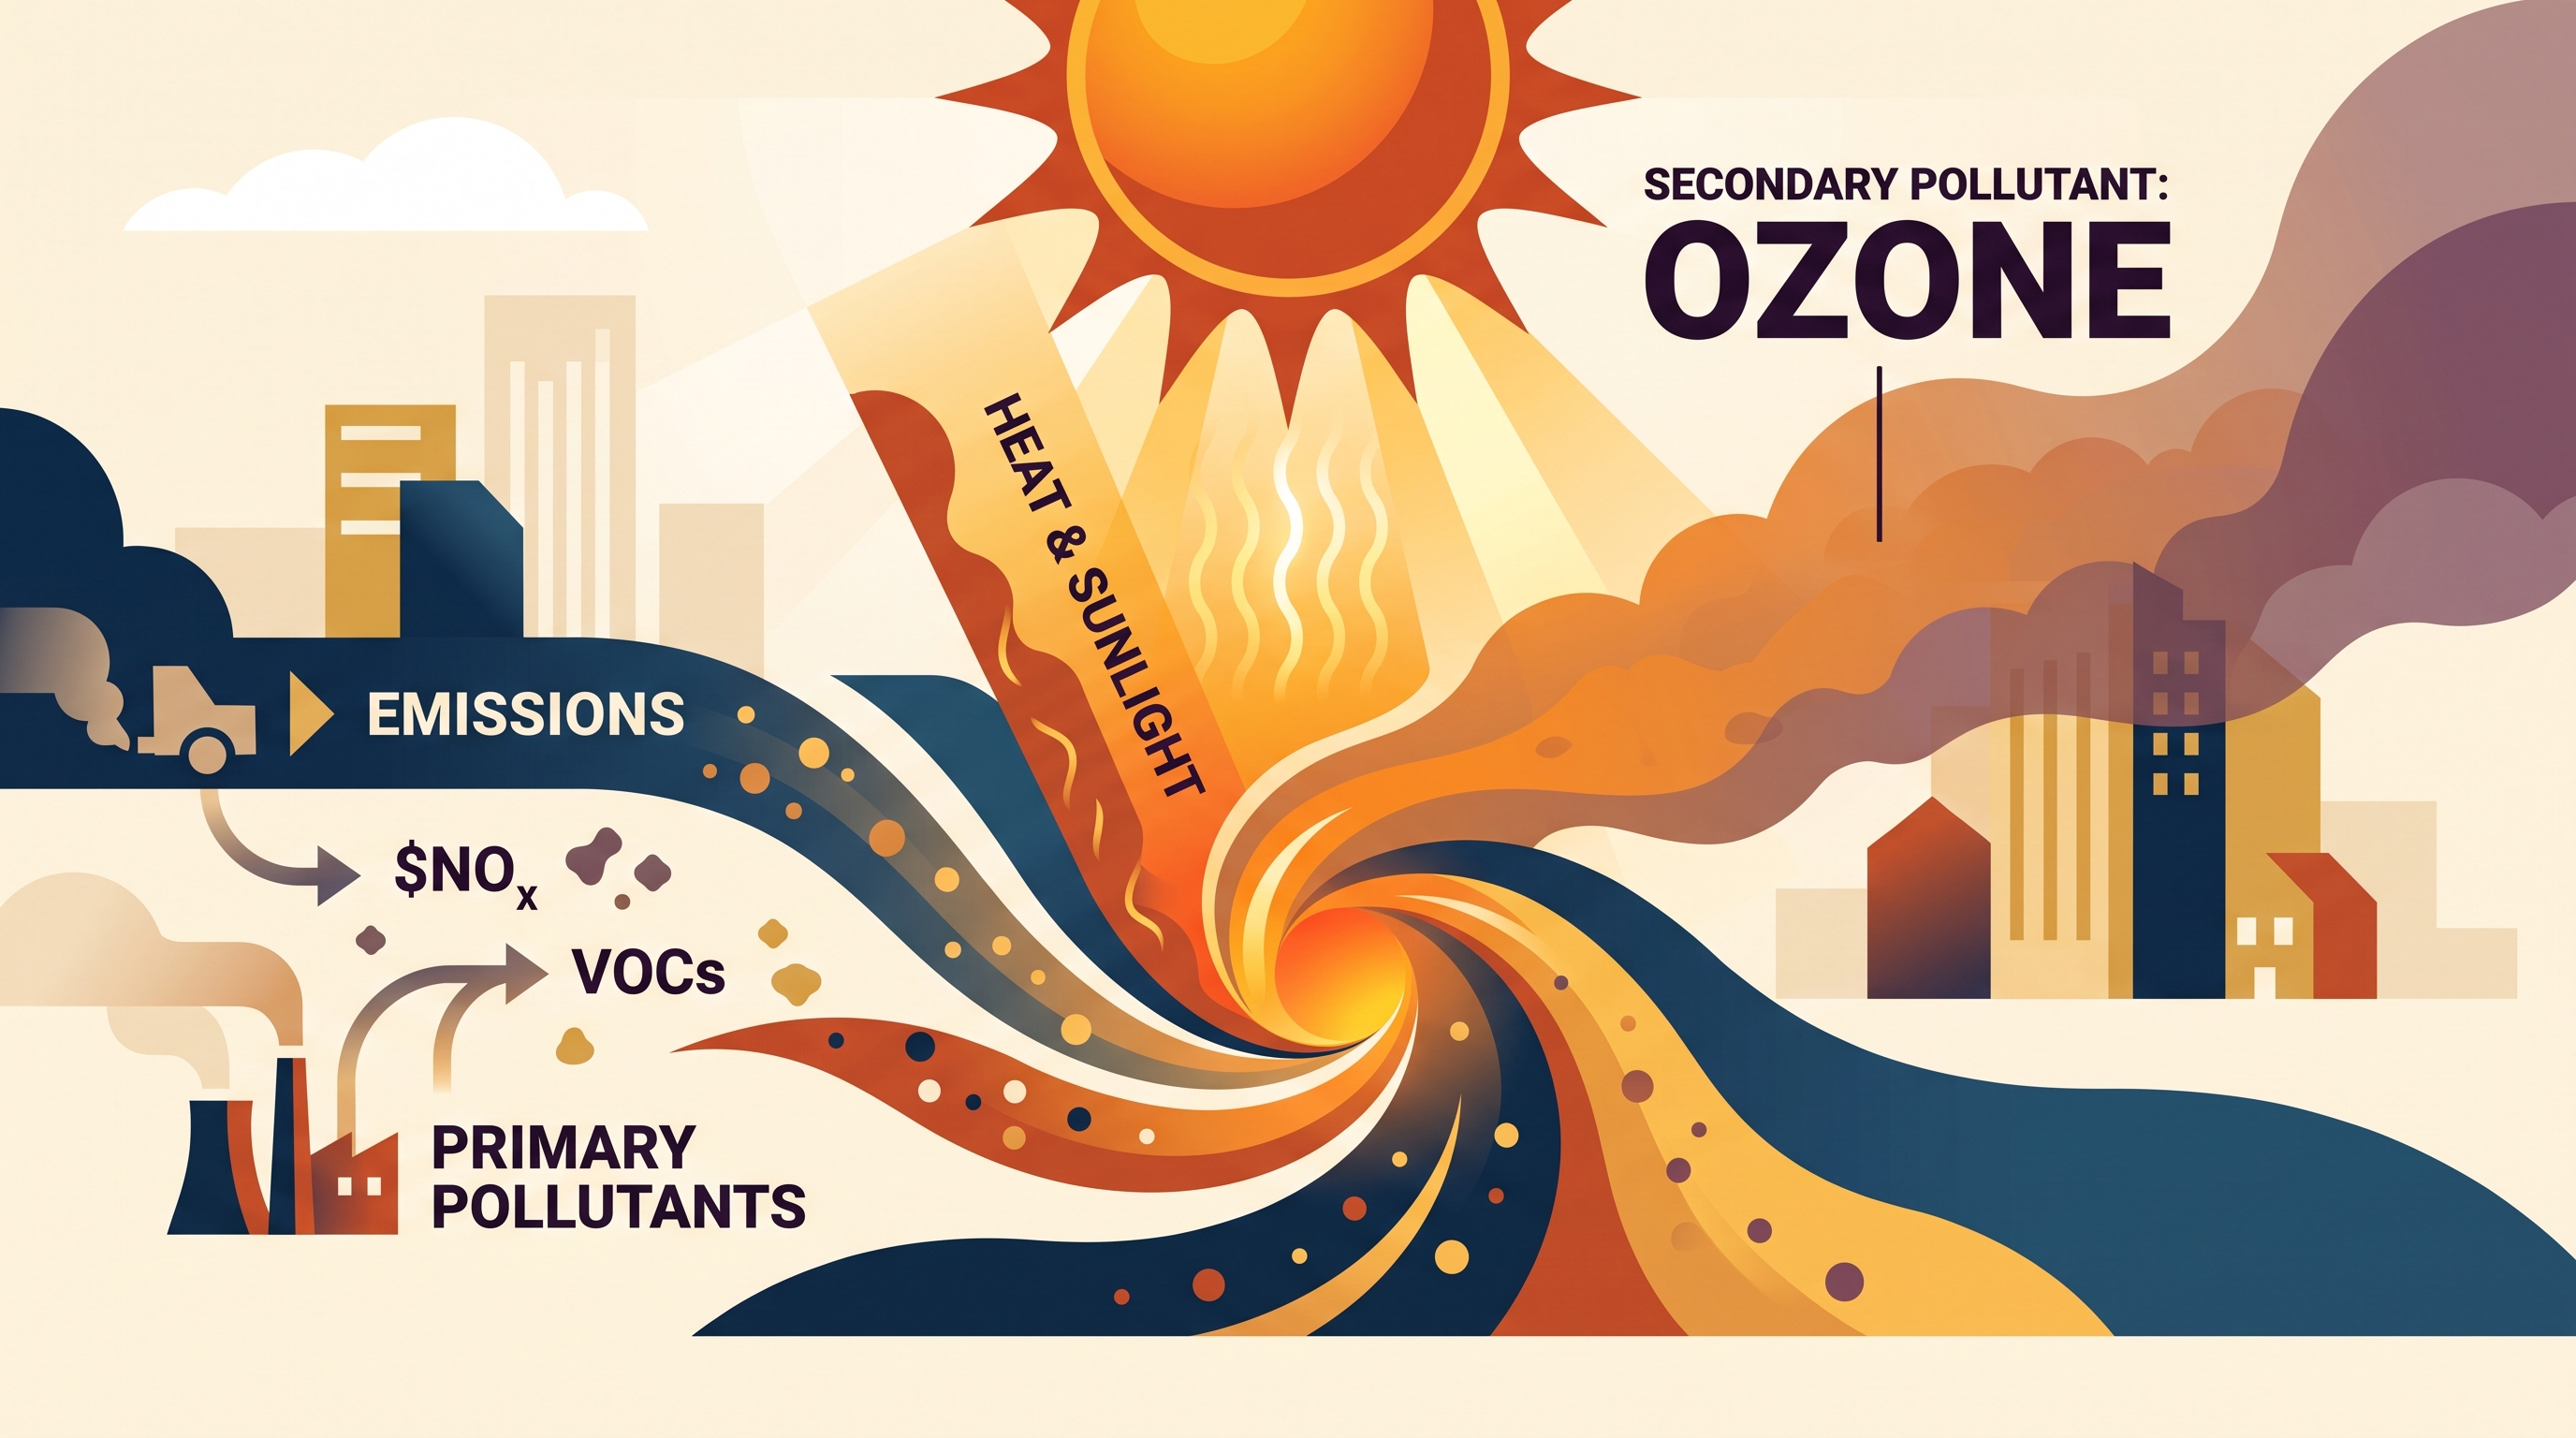
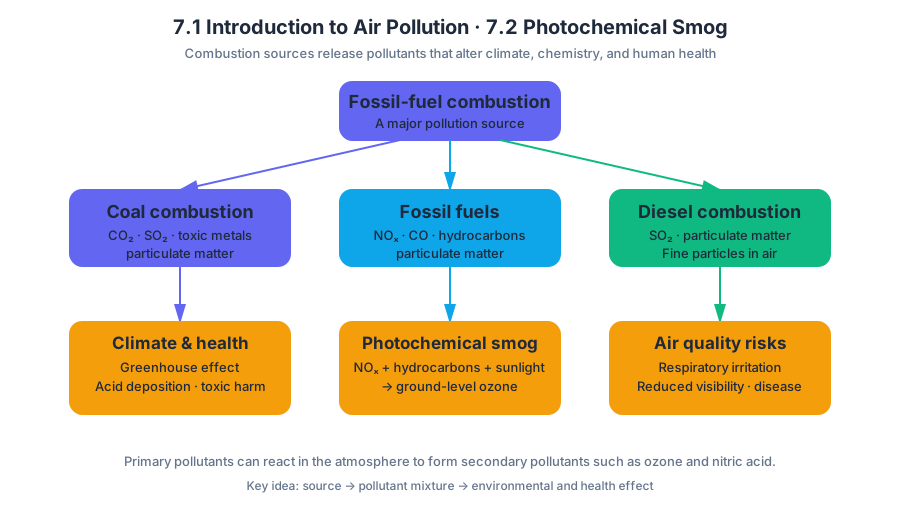
7.3 Thermal Inversion · 7.4 Atmospheric CO₂ and Particulates
Key concepts: Thermal inversion · Normal atmospheric temperature gradient · Air pollution trapping near Earth’s surface · Photochemical smog · Particulates · Nitrogen oxides (NOx) · Volatile organic compounds (VOCs) · Natural gas versus coal power generation · Air-quality improvement through pollutant reduction · Visual interpretation of environmental processes
A thermal inversion occurs when the usual atmospheric temperature pattern reverses: air near Earth’s surface becomes cooler than air above it. The result is like placing a lid over a shallow bowl of smoke—the pollutants cannot mix upward easily, so concentrations increase where people live and breathe.
7.3 Thermal Inversion · 7.4 Atmospheric CO₂ and Particulates
A thermal inversion occurs when the usual atmospheric temperature pattern reverses: air near Earth’s surface becomes cooler than air above it. The result is like placing a lid over a shallow bowl of smoke—the pollutants cannot mix upward easily, so concentrations increase where people live and breathe.
Thermal inversion: when the atmosphere stops mixing
Under the normal atmospheric temperature gradient, air temperature generally decreases with increasing altitude. Sunlight warms Earth’s surface, and the surface warms the air immediately above it. Because warm air is less dense, it rises; cooler air descends, creating vertical mixing that disperses pollutants.
During an inversion, the normal gradient is altered: relatively cold, dense air remains at the surface while warmer air sits above it. This warmer layer prevents the colder surface air from rising, suppressing convection and trapping emissions close to the ground.
STB-2.C.1 — During a thermal inversion, the normal temperature gradient in the atmosphere is altered as the air temperature at Earth’s surface is cooler than the air at higher altitudes.
The inversion itself does not necessarily create new pollutants. Instead, it changes their concentration by reducing vertical dispersion. Vehicle exhaust, industrial emissions, smoke, nitrogen oxides, volatile organic compounds, and particulate matter accumulate within the shallow layer of air beneath the inversion.
STB-2.C.2 — Thermal inversion traps pollution close to the ground, especially smog and particulates.
Normal conditions versus inversion conditions
| Atmospheric condition | Temperature pattern | Air movement | Pollution outcome |
|---|---|---|---|
| Normal gradient | Surface air is warmer than air above | Warm air rises and mixes | Pollutants disperse more effectively |
| Thermal inversion | Surface air is cooler than air above | Warm upper air acts as a cap | Smog and particulates accumulate near the surface |
Thermal inversions are especially effective in valleys or basins, where dense cool air settles near the ground and surrounding mountains limit horizontal movement. Calm winds can intensify the effect because there is little mechanical mixing to break apart the stagnant air layer.
Worked example: a trapped urban plume
Imagine a city that emits $100$ units of particulate pollution during a calm winter morning. Under ordinary mixing, the emissions spread through a deep atmospheric layer. During an inversion, the same $100$ units remain concentrated in a much shallower layer, so the pollutant concentration near the surface rises even though the emission rate has not changed.
As established for photochemical smog, nitrogen oxides, written collectively as $NO_x$, and volatile organic compounds, or VOCs, react in sunlight. During an inversion, the resulting pollutants and unreacted precursors remain concentrated near the surface because vertical mixing is suppressed. Therefore, an inversion is associated with increased concentrations of smog and particulates and can worsen respiratory problems and eye irritation.
Misconception check — “An inversion causes smog.”
An inversion does not supply the chemical ingredients for smog. It is a meteorological condition that traps pollutants and can make smog episodes more severe. Reducing $NO_x$ and VOC emissions addresses the source, while changing weather conditions may eventually restore mixing.
Atmospheric CO₂ and particulates
Atmospheric carbon dioxide, $CO_2$, is a gas released by processes such as fossil-fuel combustion and cellular respiration. It is not a particulate. Particulates are tiny solid particles or liquid droplets suspended in air, including soot, ash, dust, and smoke. Their small size allows them to remain airborne and, when inhaled, reach sensitive parts of the respiratory system.
The distinction matters because the pollutants behave differently. Atmospheric $CO_2$ is a gas that contributes to the greenhouse effect, whereas particulates directly reduce air quality and can irritate or damage respiratory tissues. An inversion can trap both near the surface, but the control strategy depends on the pollutant’s source and properties.
For example, replacing coal with natural gas in a power plant can improve air quality because natural gas produces fewer particulates during combustion. This change does not eliminate all air pollution or make the plant emission-free, but it can reduce the amount of particulate matter entering the atmosphere.
AP science practices in context
This topic most directly exercises Science Practice 1.A, Describe environmental concepts and processes, when identifying the altered temperature gradient; Science Practice 2.A, Describe characteristics of a model or representation, when interpreting a temperature-versus-altitude diagram; Science Practice 3.B, Describe relationships in data, when linking inversion events with increased particulate concentrations; and Science Practice 7.A, Describe environmental problems, when explaining why a city experiences degraded air quality.
Retrieval check: A monitoring station records unusually high particulate concentrations during a calm morning. Temperature measurements show that air at the surface is colder than air above it. What mechanism explains the observation, and why would reducing $NO_x$ and VOC emissions help?
Answer: The temperature pattern identifies a thermal inversion, which suppresses vertical mixing and traps pollution near the ground. Reducing $NO_x$ and VOC emissions lowers the precursors available for photochemical smog formation.
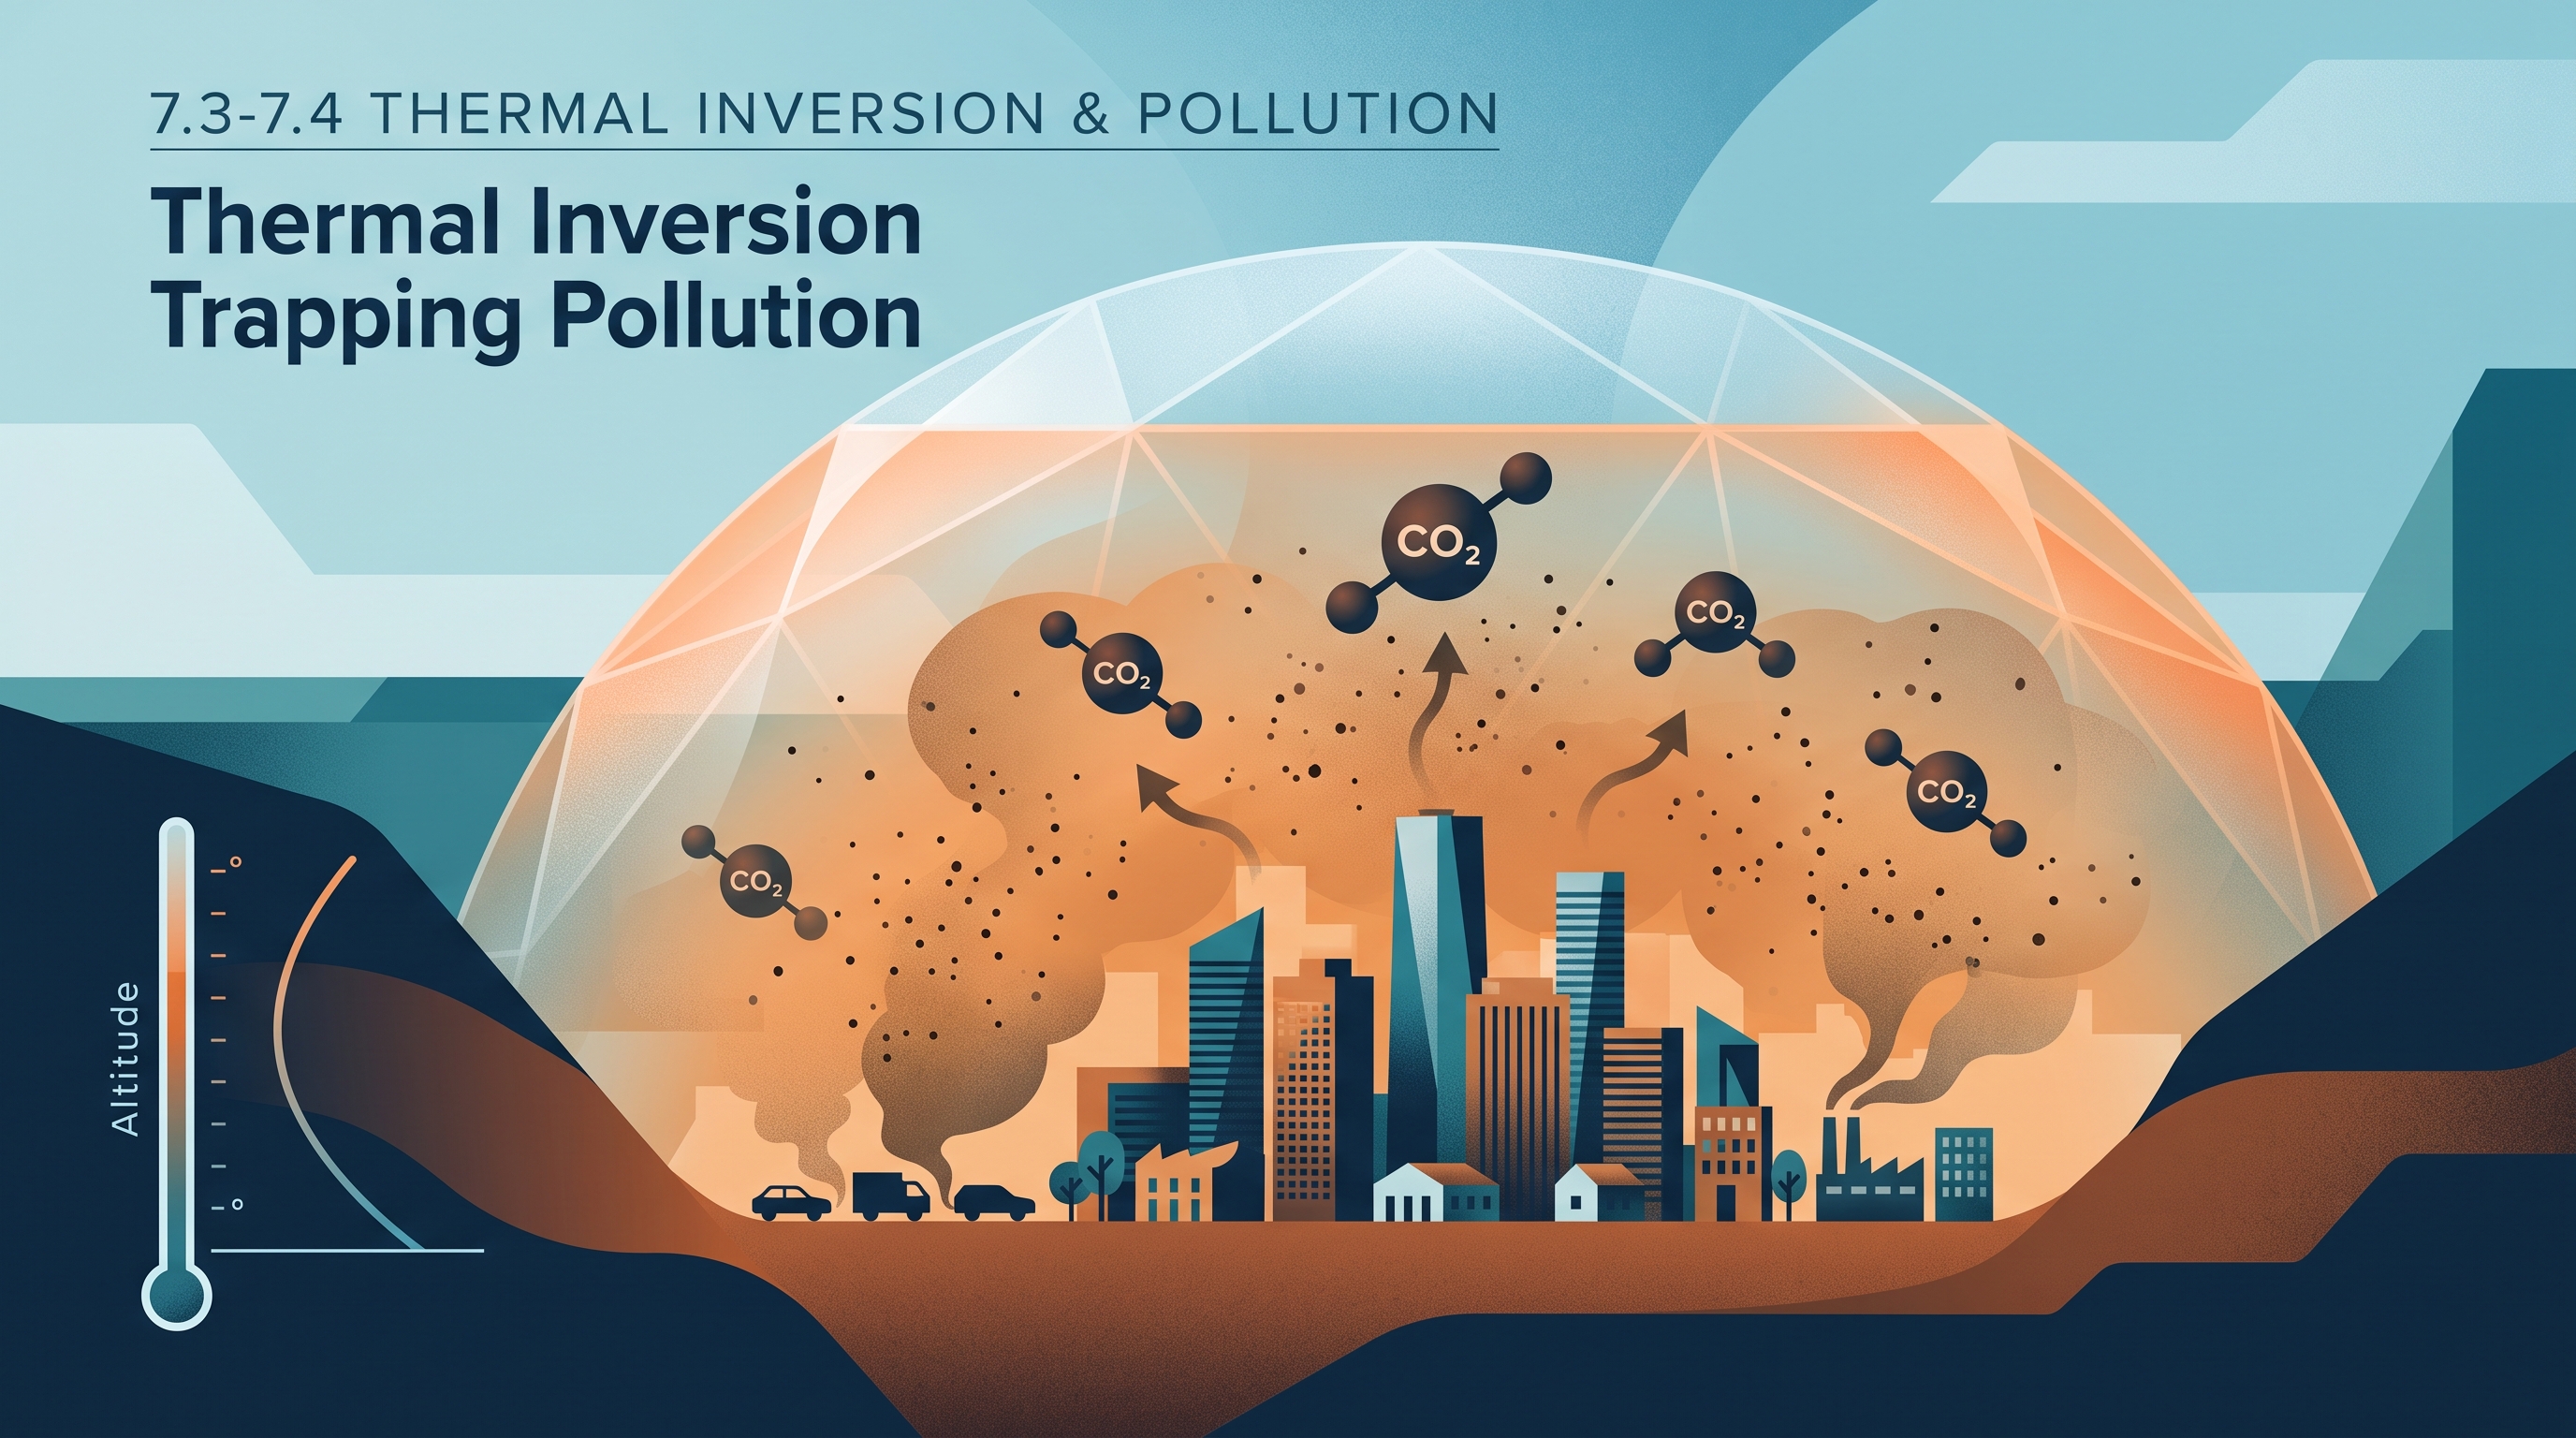
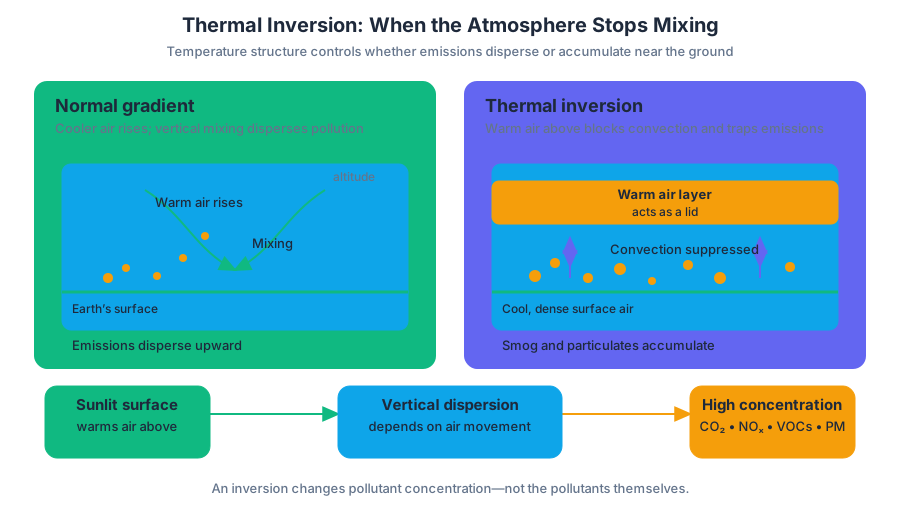
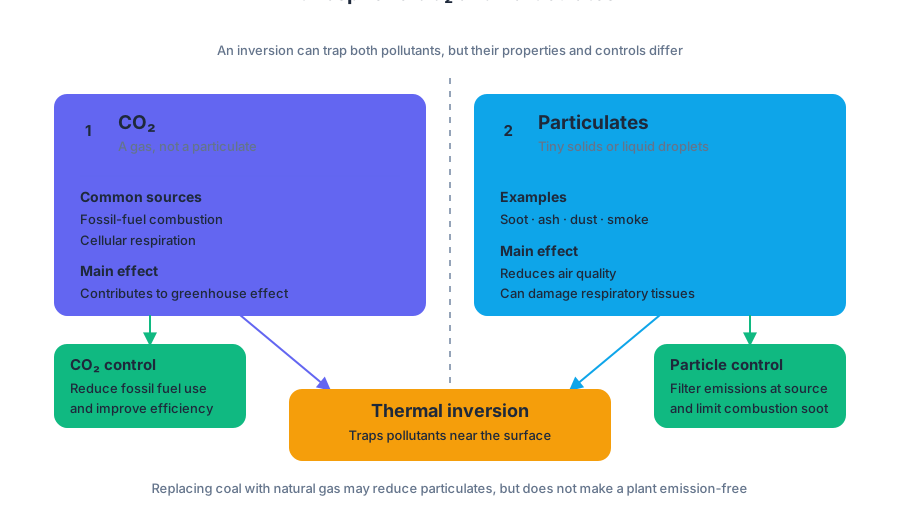
7.5 Indoor Air Pollutants · 7.6 Reduction of Air Pollutants
Key concepts: Indoor air pollution · Carbon monoxide as an asphyxiant · Particulate indoor air pollutants · Volatile organic compounds (VOCs) · Formaldehyde as an indoor air pollutant · Radon gas and radioactive decay · Health effects of indoor air pollutants · Sources and pathways of indoor pollutants · Reduction of air pollutants · Data analysis of air-pollution patterns and trends
Indoor air pollution can build inside a home even when outdoor air appears clean. The key question is not merely what pollutant is present, but also where it comes from, how it affects people, and which intervention removes or reduces the exposure.
7.5 Indoor Air Pollutants · 7.6 Reduction of Air Pollutants
Indoor air pollution can build inside a home even when outdoor air appears clean. The key question is not merely what pollutant is present, but also where it comes from, how it affects people, and which intervention removes or reduces the exposure.
STB-2: Human activities have physical, chemical, and biological consequences for the atmosphere.
Under STB-2.E, the required learning objective is to identify indoor air pollutants. These pollutants come from three broad source categories:
- Natural sources: radon, mold, and dust
- Human-made sources: insulation, furniture, paneling, carpets, upholstery, building materials, and paints
- Combustion: carbon monoxide, nitrogen oxides, sulfur dioxide, particulates, and tobacco smoke
A source-to-health-effect map
The same building may contain pollutants from several categories at once. For example, a basement may receive naturally occurring radon from soil, while a poorly vented heater adds carbon monoxide and a new carpet releases volatile organic compounds.
| Pollutant or group | Typical indoor source | Classification or concern |
|---|---|---|
| Carbon monoxide | Incomplete combustion; tobacco smoke | Asphyxiant |
| Asbestos, dust, smoke | Insulation, damaged materials, combustion | Particulates |
| Volatile organic compounds (VOCs) | Furniture, paneling, carpets | Chemical indoor pollutants |
| Formaldehyde | Building materials, furniture, upholstery, carpeting | Chemical indoor pollutant |
| Radon | Uranium decay in rocks and soils | Radioactive natural pollutant |
| Lead | Paints | Toxic human-made pollutant |
Carbon monoxide: an asphyxiant
STB-2.E.1 identifies carbon monoxide as an indoor air pollutant classified as an asphyxiant. An asphyxiant is a substance that interferes with the body’s ability to obtain or use oxygen. Carbon monoxide is especially dangerous because it can accumulate indoors without producing a strong warning odor.
Worked example: A gasoline-powered generator operates inside a closed garage during a power outage. Combustion produces carbon monoxide, and the closed space prevents rapid dilution. The correct environmental-health chain is:
$$ \text{incomplete combustion} \rightarrow \text{CO accumulation} \rightarrow \text{interference with oxygen transport} \rightarrow \text{asphyxiation risk} $$
The solution is not simply to “wear a mask”; it is to eliminate the indoor source and provide safe ventilation by operating combustion equipment outdoors.
Misconception check: Carbon monoxide is not the same as carbon dioxide. Carbon monoxide is a toxic asphyxiant; carbon dioxide is a normal product of respiration and combustion that becomes hazardous at sufficiently high concentrations.
Particulates, VOCs, and formaldehyde
Under STB-2.E.2, indoor particulates are tiny solid or liquid particles suspended in air. Required examples include asbestos, dust, and smoke. Their small size allows them to remain airborne and enter the respiratory system; asbestos is particularly concerning because fibers can persist in lung tissue.
Volatile organic compounds (VOCs) are carbon-containing chemicals that readily evaporate into indoor air. Under STB-2.E.5, VOCs can originate from furniture, paneling, and carpets. Formaldehyde is another human-made indoor pollutant that can come from building materials, furniture, upholstery, and carpeting.
A useful distinction is that particulates are particles, whereas VOCs and formaldehyde are gases released from materials. Dust control and filtration address suspended particles; source substitution, ventilation, and low-emission materials address chemical vapors.
Radon: a natural pollutant with a serious consequence
STB-2.E.4 lists radon as a common natural-source indoor pollutant. STB-2.F.1 specifies that radon-222 is produced by the radioactive decay of uranium found in some rocks and soils. Radon can move upward through soil and enter homes through basements, cracks in walls or foundations, and groundwater entering through a well.
Under STB-2.F.2, exposure to radon gas can cause radon-induced lung cancer, identified in the required content as the second leading cause of lung cancer in America. The pathway is:
$$ \text{uranium in rock or soil} \rightarrow \text{radioactive decay} \rightarrow \text{radon gas} \rightarrow \text{indoor infiltration} \rightarrow \text{inhalation risk} $$
Radon reduction therefore depends on testing buildings, sealing entry pathways, improving ventilation beneath or within foundations, and using systems that vent radon safely outdoors.
Reducing indoor air pollution
Topic 7.6 Reduction of Air Pollutants applies a general prevention sequence:
- Control the source: remove tobacco smoke, repair combustion equipment, avoid indoor generator use, and select low-emission materials.
- Capture or filter pollutants: use appropriate particle filtration for dust and smoke.
- Increase safe ventilation: dilute and remove indoor contaminants without introducing polluted outdoor air.
- Monitor exposure: use carbon-monoxide alarms and radon testing.
- Maintain the intervention: replace filters, repair leaks, and retest after mitigation.
For STB-2.E.6 Data Analysis, interpret pollutant measurements by looking for patterns and trends rather than relying on a single reading. For example, if radon levels are consistently higher in a basement than on an upper floor, the pattern supports soil or foundation entry as a likely exposure pathway.
For 7.D, Use data and evidence to support a potential solution, connect the proposed action to measured evidence: “Because carbon monoxide rises whenever the heater operates, repairing or replacing the heater is a stronger solution than merely opening a window occasionally.”
Retrieval check
A house contains a dusty, deteriorating insulation material, a new carpet, and elevated basement radon. Identify one particulate, one VOC-related source, and one natural pollutant; then name one reduction method for each. The expected reasoning is: deteriorating insulation may release particulates, the carpet may release VOCs, radon comes from uranium decay in soil or rock, and the responses should match the pollutant—filtration or removal for particles, source control and ventilation for VOCs, and testing plus radon mitigation for radon.
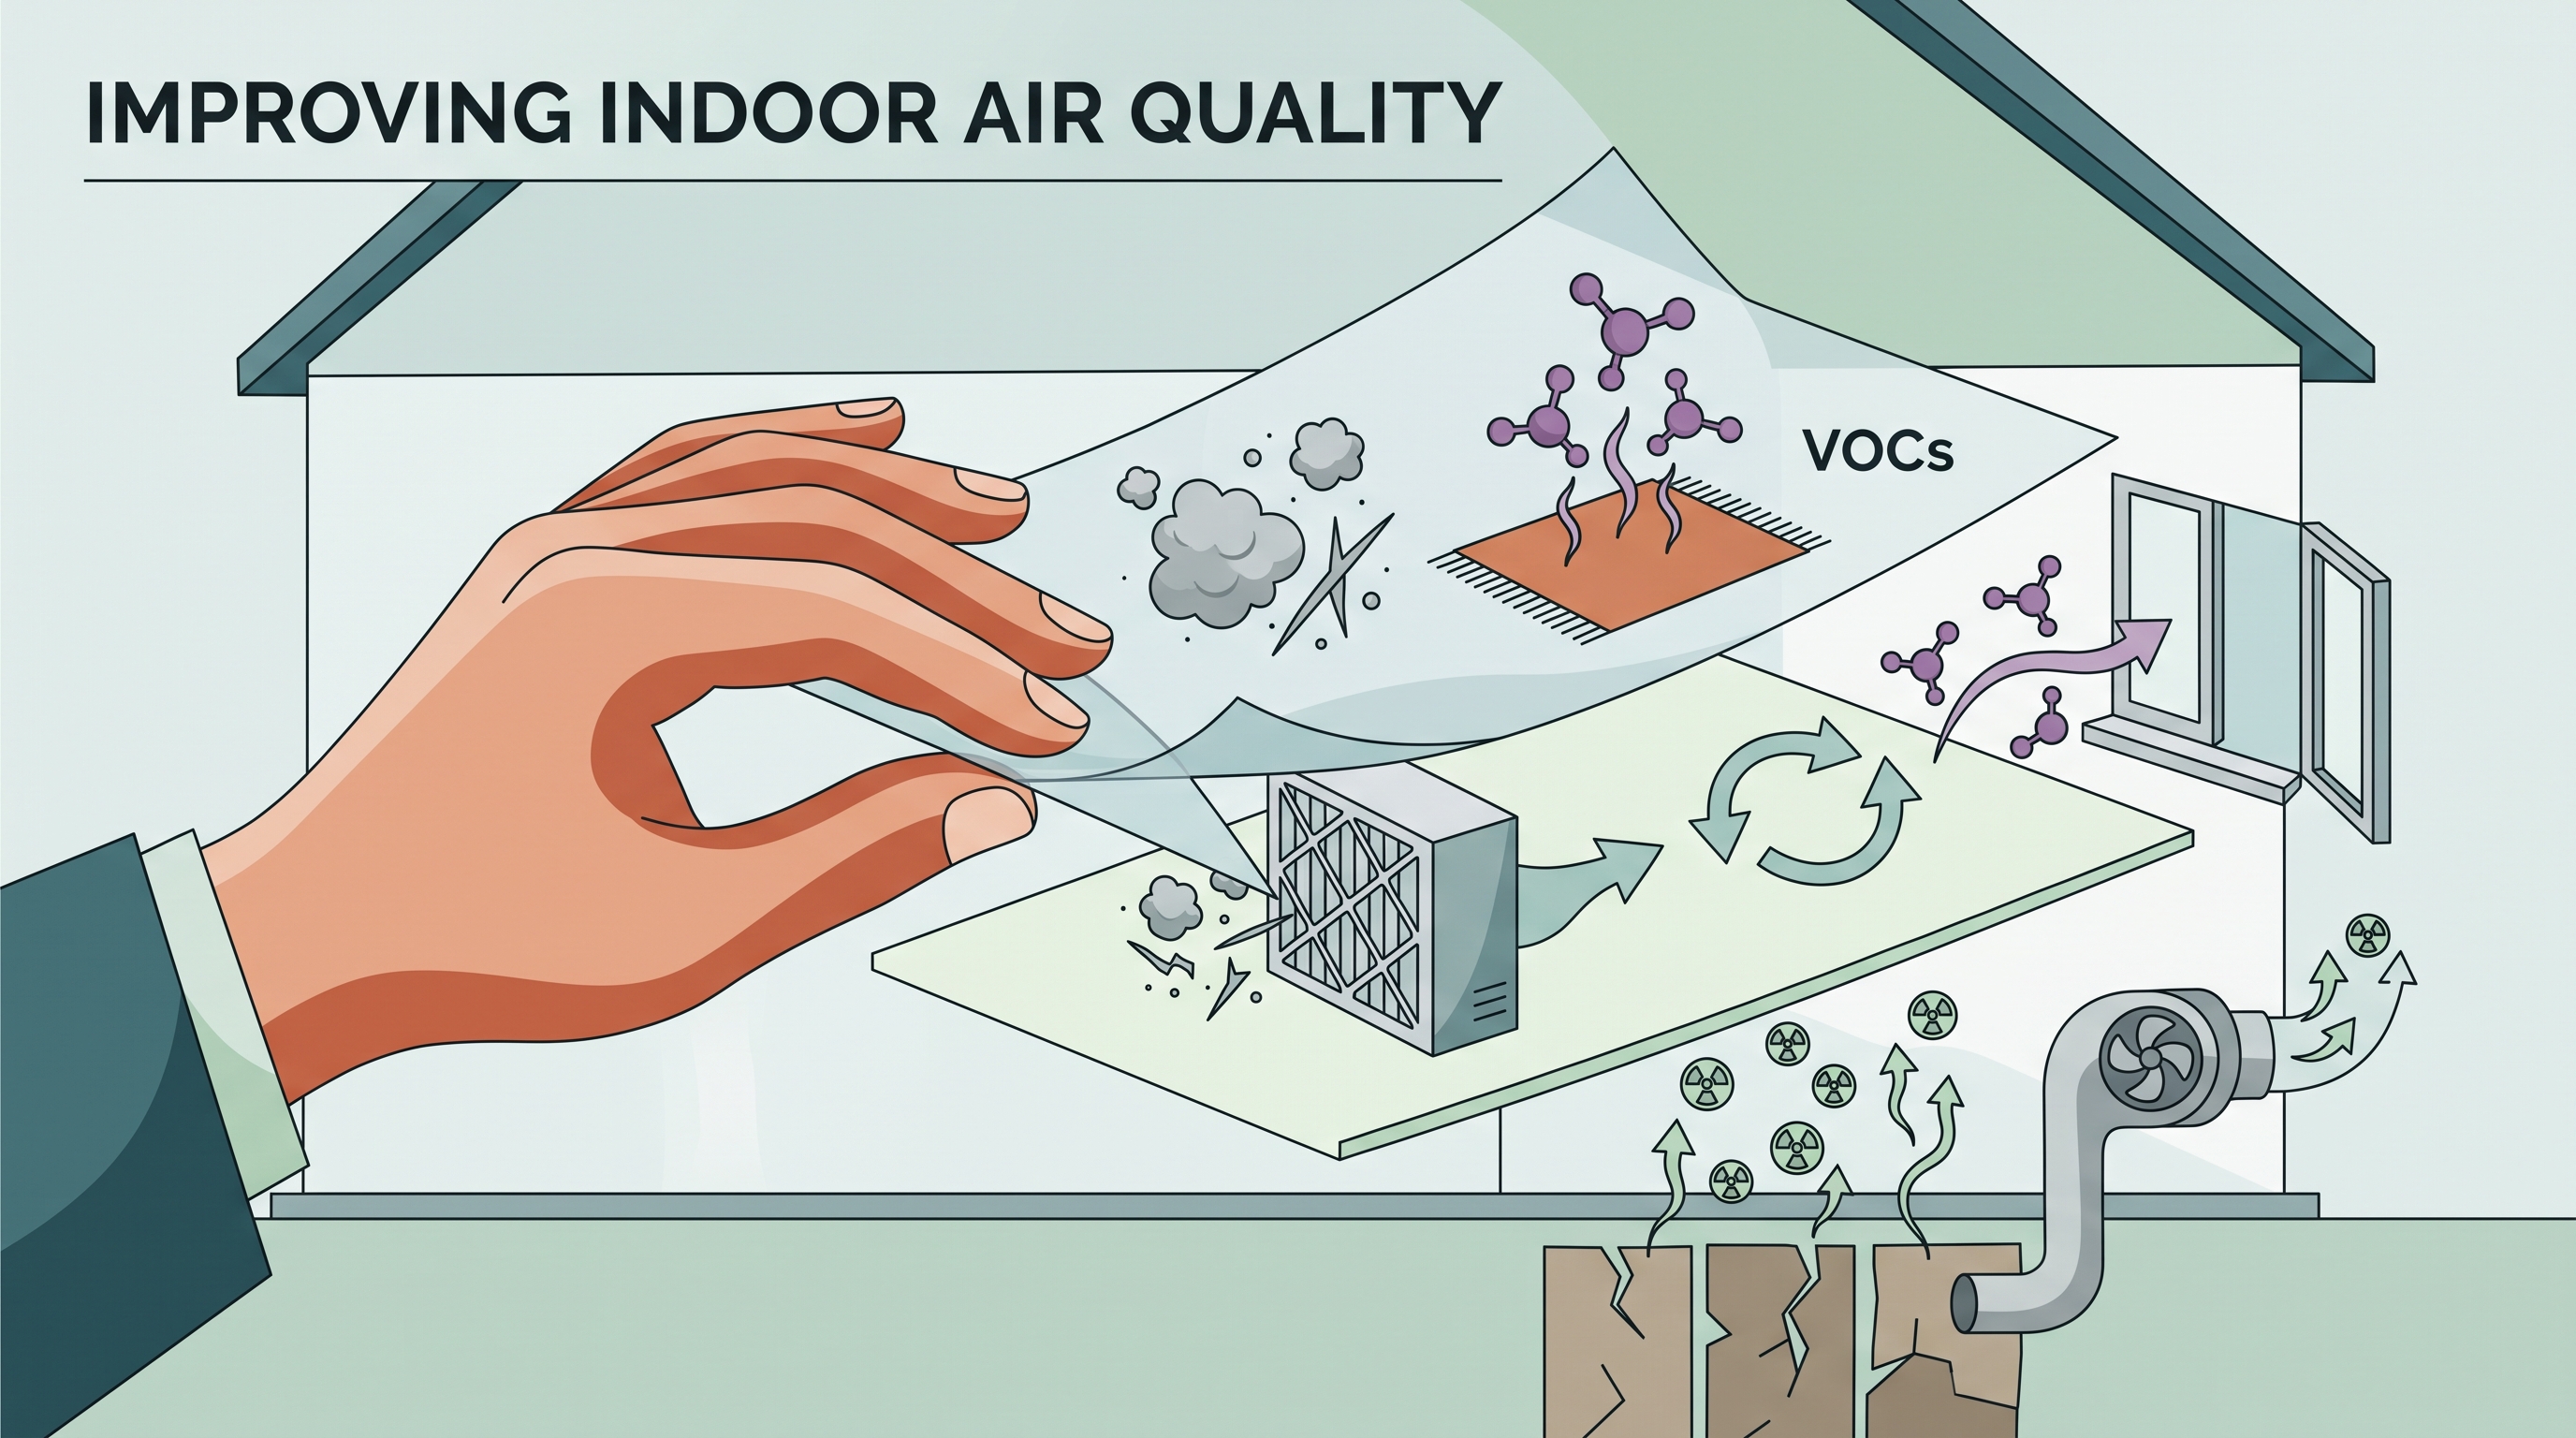
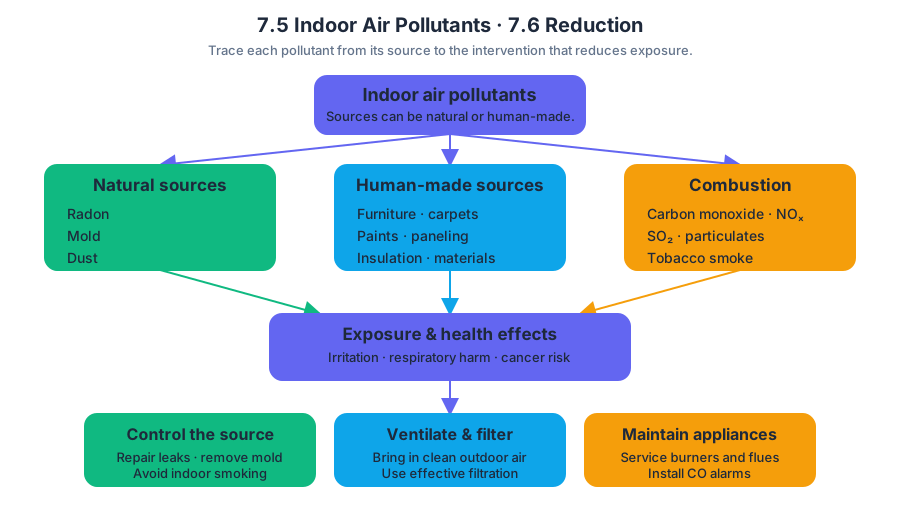
7.7 Acid Rain · 7.8 Noise Pollution
Key concepts: Acid rain formation and environmental effects · Sulfur dioxide and nitrogen oxide air pollution · Soil and limestone buffering of acid rain · Coal-burning power plants as sources of sulfur dioxide · Methods for reducing air pollution from power plants · Particulate matter sources · Vapor recovery nozzles and volatile organic compounds · Reducing vehicle commuting to lower emissions · Noise pollution and environmental consequences · Environmental technology and pollution mitigation
Coal-burning power plants can affect ecosystems hundreds of kilometers away: sulfur-containing fuel releases sulfur dioxide, atmospheric reactions produce sulfuric acid, and prevailing winds carry the resulting acid deposition downwind.
7.7 Acid Rain · 7.8 Noise Pollution
Coal-burning power plants can affect ecosystems hundreds of kilometers away: sulfur-containing fuel releases sulfur dioxide, atmospheric reactions produce sulfuric acid, and prevailing winds carry the resulting acid deposition downwind.
Acid rain: from emission to ecosystem damage
Acid deposition is the return of acidic substances from the atmosphere to Earth’s surface. It includes wet deposition, such as acid rain, snow, or fog, and dry deposition, in which acidic particles and gases settle without precipitation. The central chemical pathway begins when sulfur oxides and nitrogen oxides react in the atmosphere to form sulfuric acid and nitric acid.
Coal-burning power plants are a major source of the sulfur dioxide associated with acid deposition. Vehicles and combustion sources also release nitrogen oxides; therefore, reducing vehicle travel through public transportation or carpooling can reduce emissions of nitrogen oxides and sulfur oxides, decrease atmospheric acidity, and reduce the formation of nitric and sulfuric acids.
The geographic pattern matters. Acid deposition mainly affects communities downwind from coal-burning power plants, because emitted pollutants can be transported before they are converted into acids and deposited. This is why a local power plant can create regional environmental effects rather than only affecting the land immediately surrounding its smokestack. STB-2.I.1
What acid rain changes in soils and water
Acid rain increases environmental acidity, lowering the pH of soils, lakes, and ponds. Aquatic organisms may be harmed when water chemistry changes beyond their tolerance ranges, while acidic soils can alter nutrient availability and make toxic metals more soluble. The result is not simply “rain that burns”; it is a chemical shift that changes the conditions organisms depend on. STB-2.I.2
Some environments resist this change through buffering, the ability of a substance or system to neutralize added acid and limit a rapid pH decrease. Limestone bedrock, composed largely of calcium carbonate, can neutralize acidic water. In simplified form, carbonate consumes hydrogen ions:
$$ CO_3^{2-} + 2H^+ \rightarrow H_2CO_3 $$
Soils also differ in buffering strength. A useful investigation would add equal volumes of acidic rainwater to equal masses of different soil types, then measure the change in pH. The soil showing the smallest pH decrease provides the strongest buffer, provided the experiment controls soil mass, acid volume, acid concentration, and measurement method.
Misconception check — “All lakes respond identically to acid rain.” They do not. A lake over limestone or carbonate-rich material may be strongly buffered, whereas a lake in thin, nutrient-poor soil over noncarbonate bedrock may experience a much larger pH decline.
Reducing acid-forming pollution at the source
Source control prevents pollutants from entering the atmosphere rather than attempting to repair damage afterward. Methods for reducing air pollution from coal-burning power plants include scrubbers, which remove sulfur dioxide from exhaust gases, and electrostatic precipitators, which use electrical charges to remove particulate matter from smokestack emissions. This directly applies the suggested skill STB-2.G.5: Explain how air pollutants can be reduced at the source.
A vapor recovery nozzle addresses a different source: vehicle refueling. It captures gasoline vapors, including volatile organic compounds, and prevents those fumes from escaping into the atmosphere. This device does not remove sulfuric acid from a lake; it reduces pollution at the moment the vapor would otherwise be released.
Particulate matter: pollution that travels as particles
Particulate matter consists of tiny solid particles or liquid droplets suspended in air. Sources include industry, construction and demolition, agriculture, mining, waste incineration, biomass burning, human-caused wildfires, and unpaved roads. Identifying a source requires naming an activity—not merely writing “pollution.”
For example, “construction” identifies an anthropogenic source because excavation and demolition can release dust particles. “Wildfires” is incomplete if the question asks for a human-caused source; “human-caused wildfires” is more precise.
Noise pollution
Noise pollution is unwanted or harmful sound produced at levels, frequencies, or durations that interfere with human activity or wildlife behavior. Transportation, construction, industrial machinery, aircraft, and urban activity can create persistent noise. Unlike acid rain, noise pollution is not a chemical pollutant that forms an acid in the atmosphere; its effects are transmitted as sound energy.
Mitigation reduces either the source, the transmission pathway, or the receiver’s exposure. Examples include quieter machinery, limits on operating hours, sound barriers, increased distance from the source, and vegetation or structural barriers where appropriate. A strong environmental solution links the intervention to the impact: reducing traffic noise near a nesting area can reduce disturbance to wildlife.
Retrieval check
- Why are communities downwind from coal-burning power plants especially vulnerable to acid deposition?
- Which environmental material can buffer acid rain: limestone bedrock or unpaved-road dust? Explain.
- Complete the causal chain: fewer personal-vehicle commutes $\rightarrow$ lower ______ emissions $\rightarrow$ less formation of ______ and ______ acids.
- Name one particulate-matter source other than motor vehicles and one function of a vapor recovery nozzle.
Answers: pollutants are transported downwind before deposition; limestone bedrock because carbonate neutralizes acid; nitrogen oxides or sulfur oxides, followed by nitric and sulfuric acids; acceptable sources include construction, mining, agriculture, waste incineration, biomass burning, human-caused wildfires, or unpaved roads, and the nozzle prevents gasoline vapors from escaping during refueling.
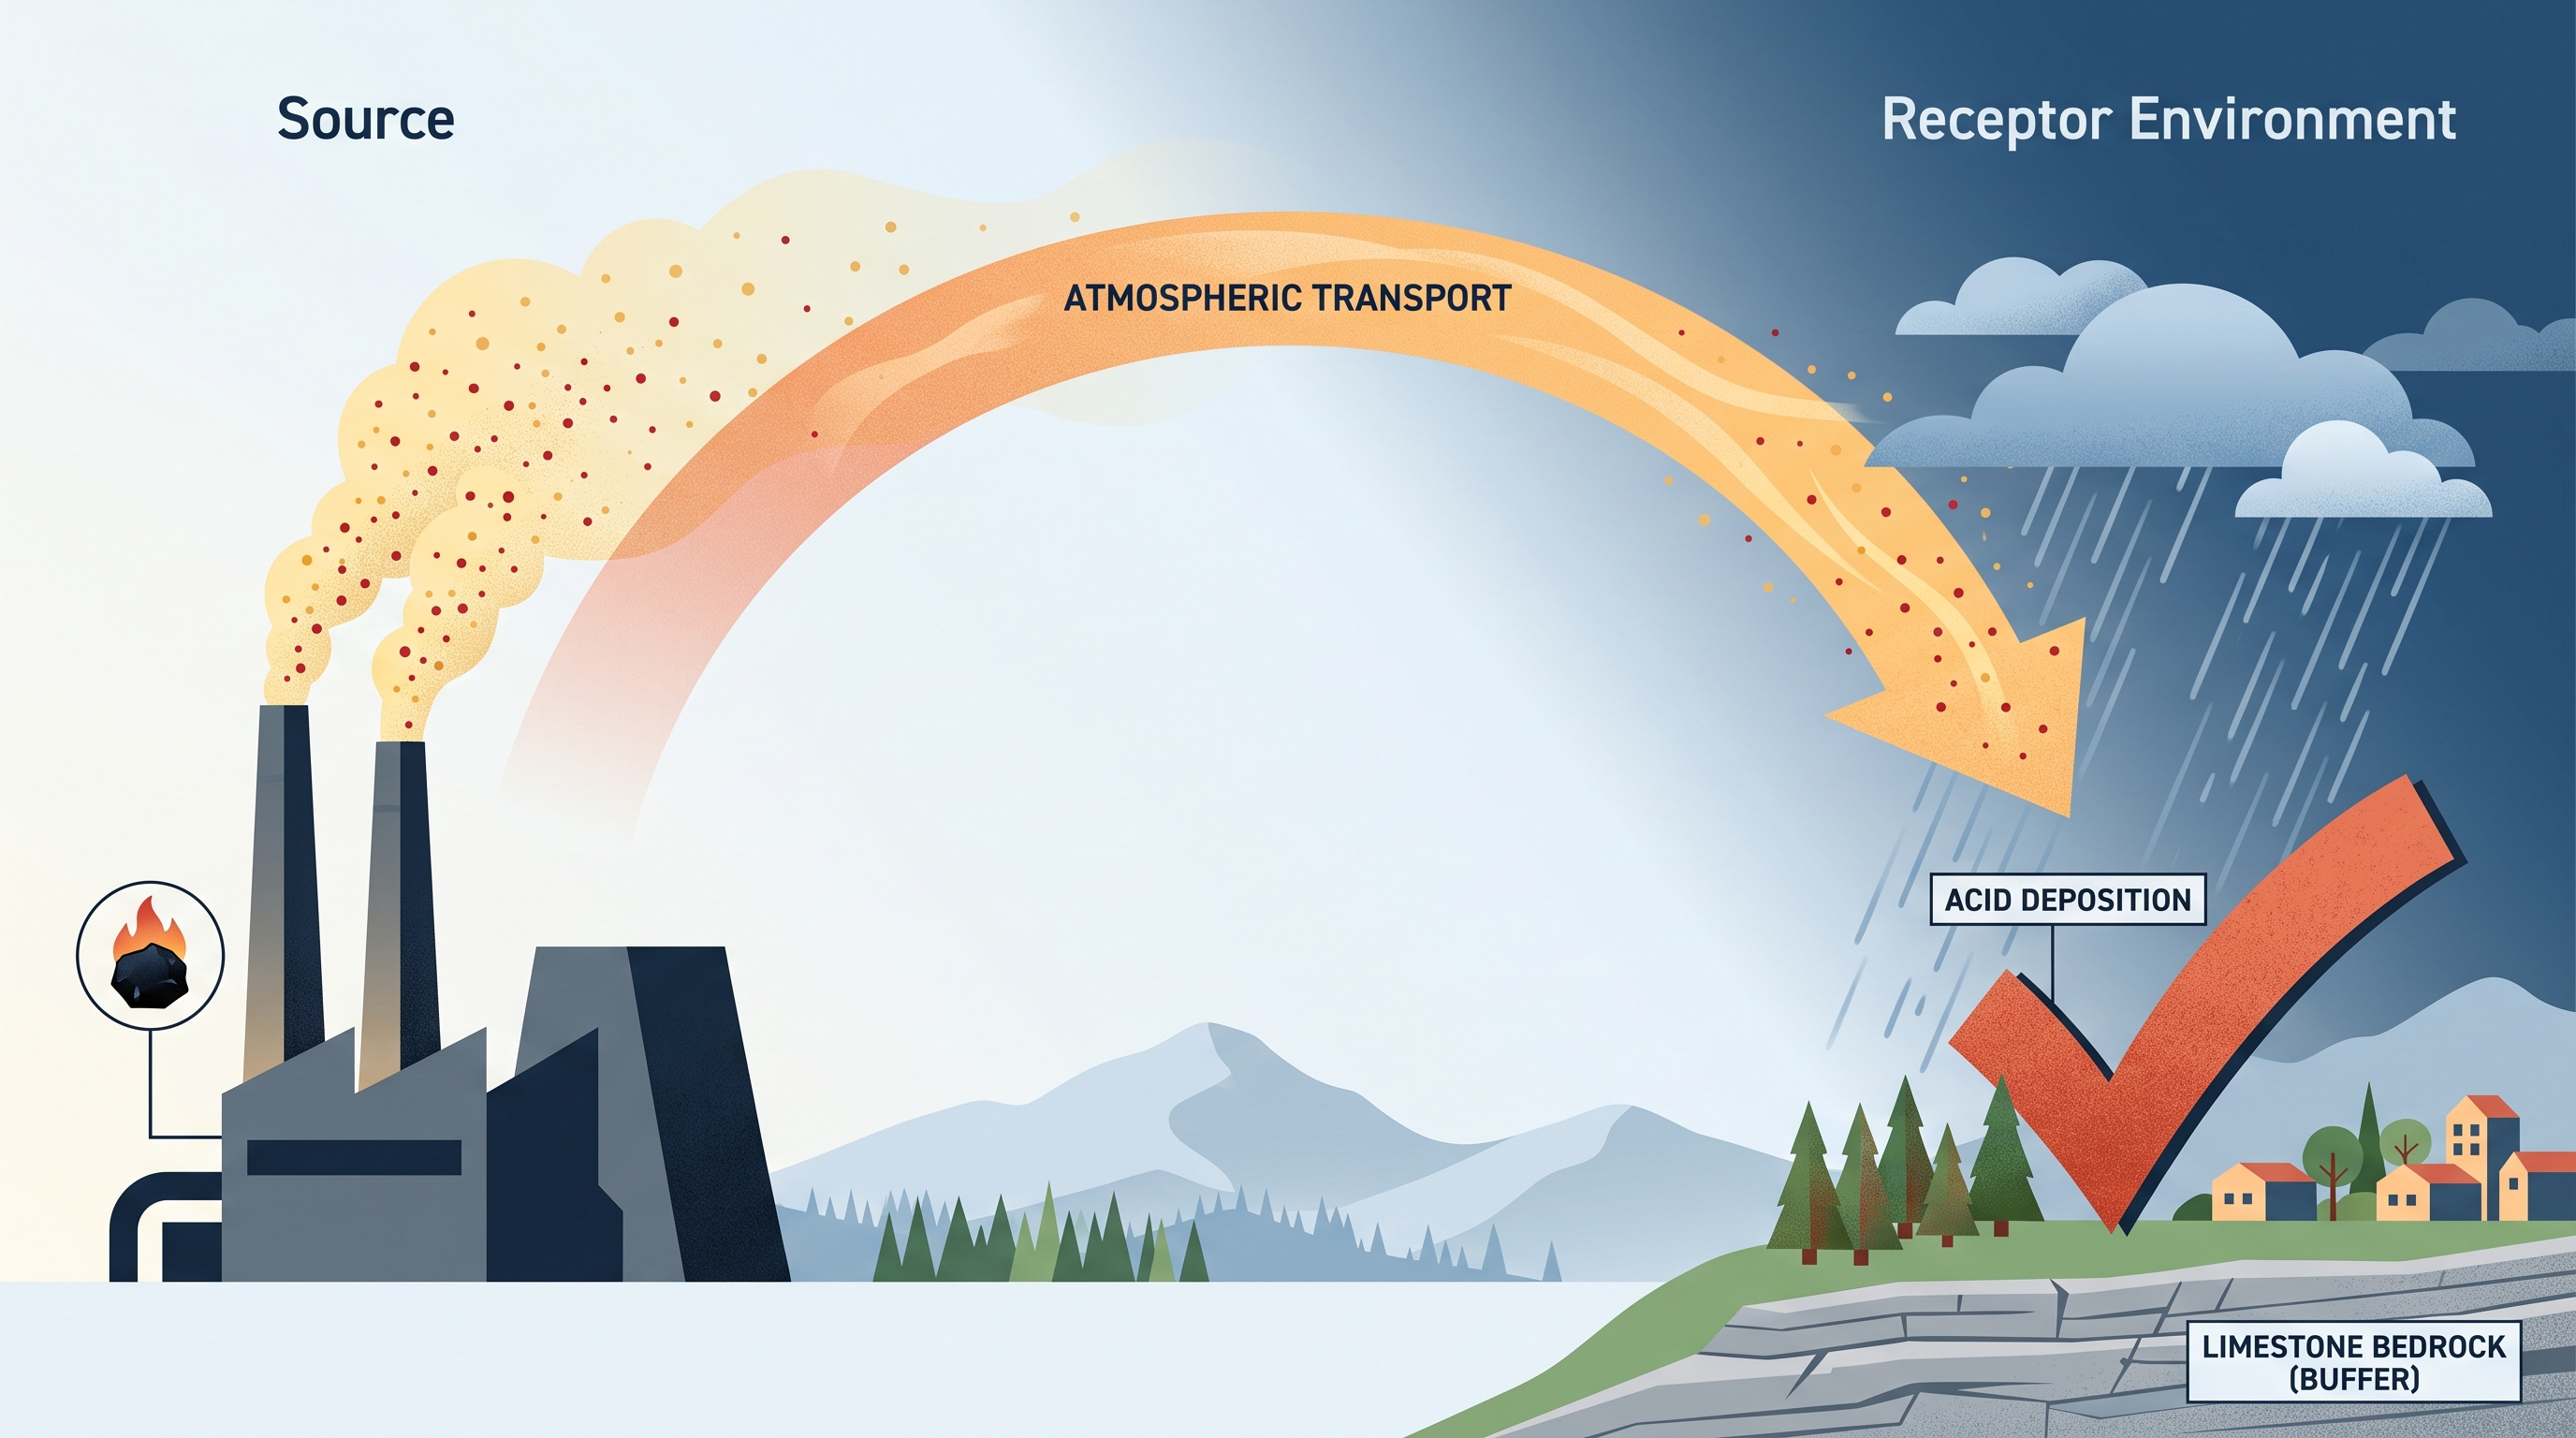
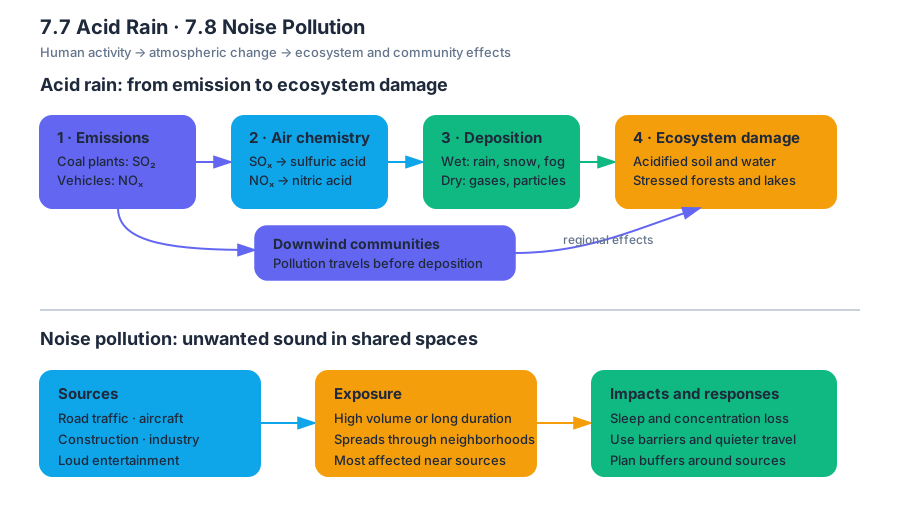
8.1 Sources of Pollution · 8.2 Human Impacts on Ecosystems
Key concepts: Sources of pollution · Primary and secondary air pollutants · Physical, chemical, and biological consequences of human activities · Point sources of pollution · Human impacts on aquatic ecosystems · Economic impacts of oil pollution · Mercury contamination and methylmercury · Anthropogenic eutrophication · Environmental evidence and data analysis · Environmental problem-solving
A pollutant is a substance or form of energy introduced into the environment at a rate that can harm organisms, ecosystems, or human systems. Its effects depend not only on toxicity, but also on where it enters, how it moves, and how organisms respond.
8.1 Sources of Pollution · 8.2 Human Impacts on Ecosystems
A pollutant is a substance or form of energy introduced into the environment at a rate that can harm organisms, ecosystems, or human systems. Its effects depend not only on toxicity, but also on where it enters, how it moves, and how organisms respond.
Sources and types of pollution
A point source releases pollution from a single, identifiable location, such as a smokestack or a waste-discharge pipe. A nonpoint source is diffuse: pesticide sprayed across many fields or urban runoff carrying oil, metals, and nutrients from roads may enter an ecosystem from many locations at once.
Air pollutants are classified by how they enter the atmosphere. A primary pollutant is emitted directly from a source; examples include carbon monoxide from incomplete combustion, sulfur dioxide from burning sulfur-containing fuels, nitrogen oxides from engines, and particulate matter from combustion or disturbed surfaces. A secondary pollutant forms in the atmosphere when primary pollutants react with one another or with sunlight. Ground-level ozone, a major component of photochemical smog, is produced through reactions involving nitrogen oxides and volatile organic compounds.
| Classification | Formation | Example |
|---|---|---|
| Primary pollutant | Released directly | Sulfur dioxide from a coal-burning facility |
| Secondary pollutant | Formed by atmospheric reactions | Ground-level ozone produced from nitrogen oxides and volatile organic compounds |
Misconception check — “secondary” means less harmful. It does not. A pollutant’s classification describes its formation, not its danger. A directly emitted pollutant can be harmful, and a secondary pollutant such as ground-level ozone can damage respiratory tissue and vegetation.
Physical, chemical, and biological consequences
Human activities, including resource use, have physical, chemical, and biological consequences for ecosystems (STB-3.A.2). Physical consequences alter habitat structure or environmental conditions: roads fragment habitat, mining removes soil, and dams change water flow. Chemical consequences change the composition of air, water, or soil: combustion adds pollutants to the atmosphere, while fertilizer runoff adds nitrogen and phosphorus to water. Biological consequences alter organisms and communities: pollution can reduce reproduction, shift species abundance, or cause death.
Organisms have a range of tolerance for pollutants. Within an optimum range, an organism can maintain homeostasis; outside that range, it may experience physiological stress, limited growth, reduced reproduction, or death (STB-3.B.1). Thus, a pollutant does not need to kill every organism immediately to damage an ecosystem: reducing reproduction or removing a sensitive species can change the entire community.
Aquatic pollution and cascading effects
Consider fertilizer carried by stormwater into a lake. The pollutant is nitrate, a nitrogen compound that acts as a nutrient. Excess nitrate stimulates algal growth; when algae die, decomposer bacteria break down the organic matter and consume dissolved oxygen. Oxygen depletion can then cause fish and other aerobic organisms to die.
This sequence is an anthropogenic form of eutrophication:
$$ \text{fertilizer runoff} \rightarrow \text{increased nitrate} \rightarrow \text{algal growth} \rightarrow \text{decomposition} \rightarrow \text{oxygen depletion} \rightarrow \text{fish death} $$
Misconception check — “the algae are the pollutant.” In this example, nitrate is the pollutant, algal growth is the biological response, and oxygen depletion and fish death are ecological consequences. Do not apply the primary/secondary air-pollutant classification to algae in a lake.
Another aquatic pathway involves mercury. Bacteria can convert elemental mercury into methylmercury, a highly toxic form that can enter aquatic food webs. Because methylmercury can accumulate in organisms and become increasingly concentrated at higher trophic levels, predators and people who consume contaminated fish may face greater exposure.
Economic consequences of pollution
Oil pollution illustrates how ecological damage becomes an economic problem. Oil washing onto a beach can harm organisms directly, contaminate habitat, and reduce the quality of the shoreline for recreation. Fishing industries may lose income when fish populations decline or catches become unsafe, while tourism industries may lose visitors because beaches are visually polluted or closed.
A useful environmental analysis connects the chain rather than naming only the first effect:
$$ \text{oil spill} \rightarrow \text{organism and habitat damage} \rightarrow \text{reduced fishing} \rightarrow \text{lost tourism revenue} $$
Evidence, graphs, and calculations
AP analysis often asks you to use evidence to support a solution. If a graph shows lower particulate concentrations after installation of emissions controls, a strong conclusion identifies the trend and connects it to the intervention: particulate concentration decreased after the control technology was installed, supporting the technology as a pollution-reduction strategy. Avoid claiming that the intervention caused the change unless the design or comparison supports causation.
For a numerical comparison, calculate percent change with:
$$ \text{percent change}=\frac{\text{final value}-\text{initial value}}{\text{initial value}}\times 100 $$
For example, if dissolved oxygen falls from $8.0\ \text{mg L}^{-1}$ to $3.0\ \text{mg L}^{-1}$:
$$ \frac{3.0-8.0}{8.0}\times100=-62.5% $$
The negative sign shows a decrease of $62.5%$.
These tasks develop STB-3.A Concept Explanation, STB-2.A.5 Scientific Experiments, and STB-3.B.4 Mathematical Routines: explain environmental mechanisms, evaluate evidence and experimental changes, compare trends, and show mathematical work using appropriate units.
Retrieval check: A stream receives fertilizer runoff. Identify the pollutant, the biological response, and two ecological consequences. Then classify this air-pollution example: sulfur dioxide released directly from a smokestack is primary or secondary? Answer: nitrate is the pollutant; algal growth is the biological response; oxygen depletion and fish death are ecological consequences; directly emitted sulfur dioxide is a primary pollutant.
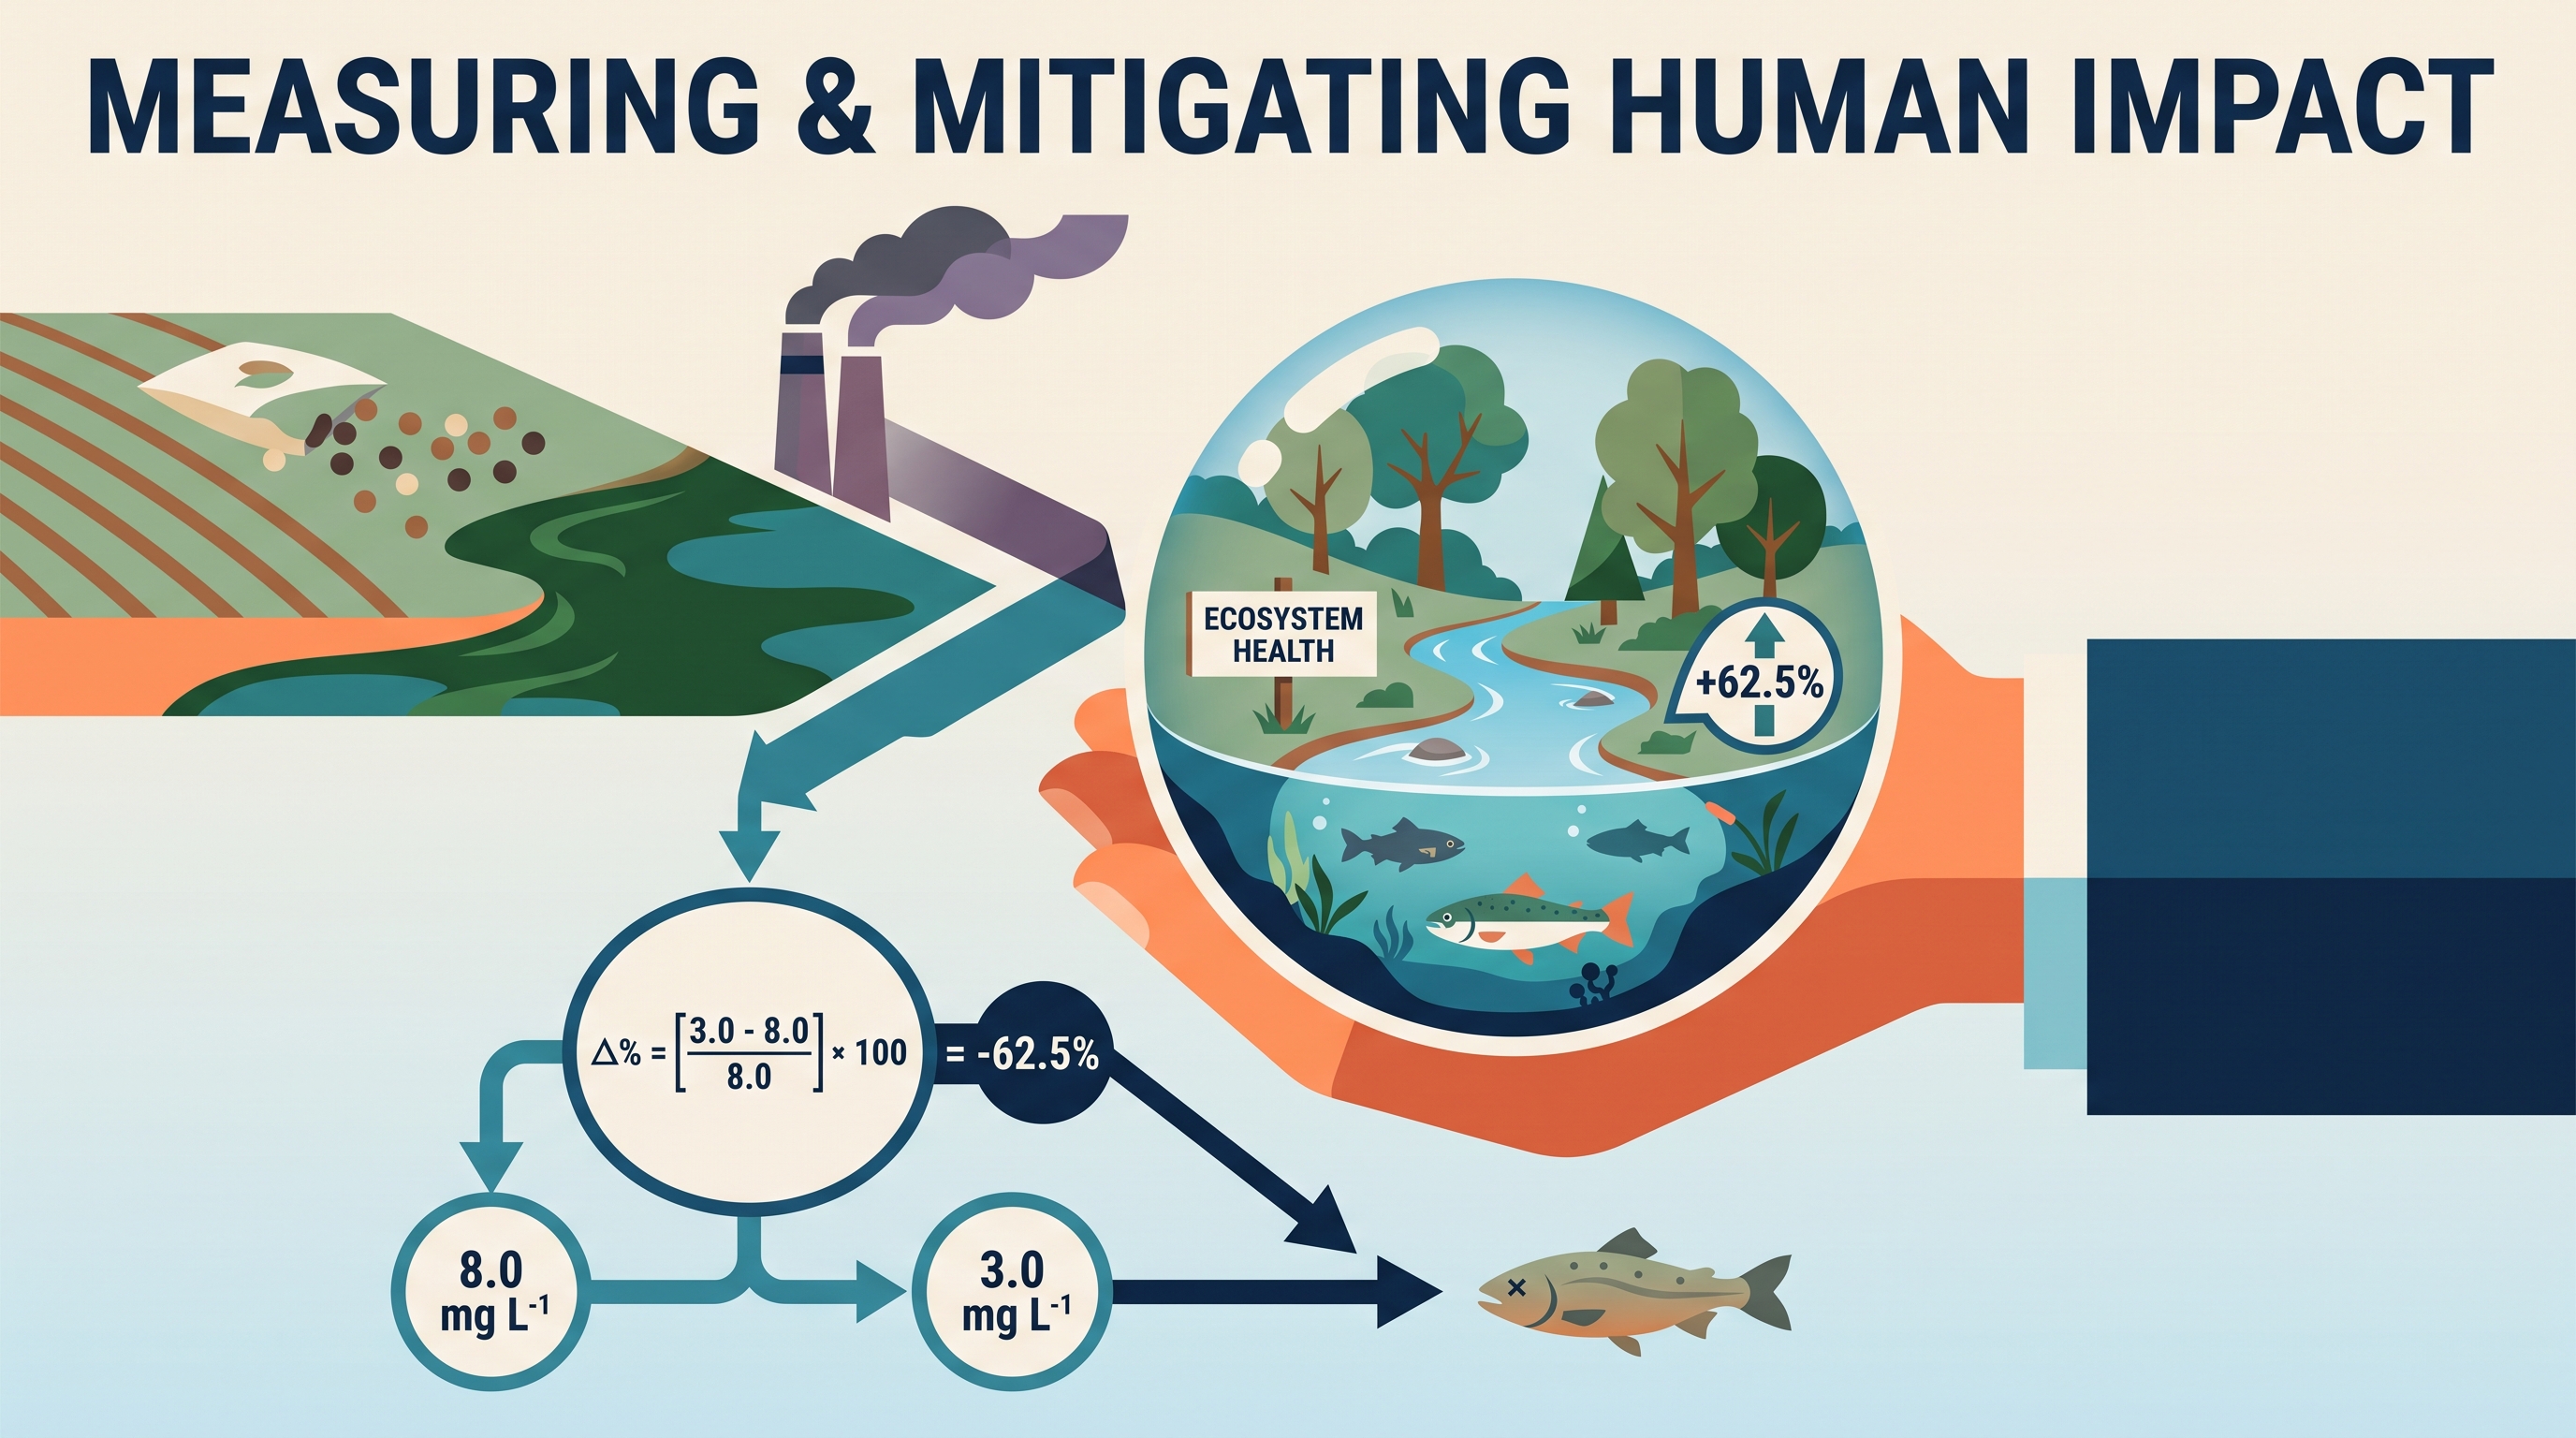




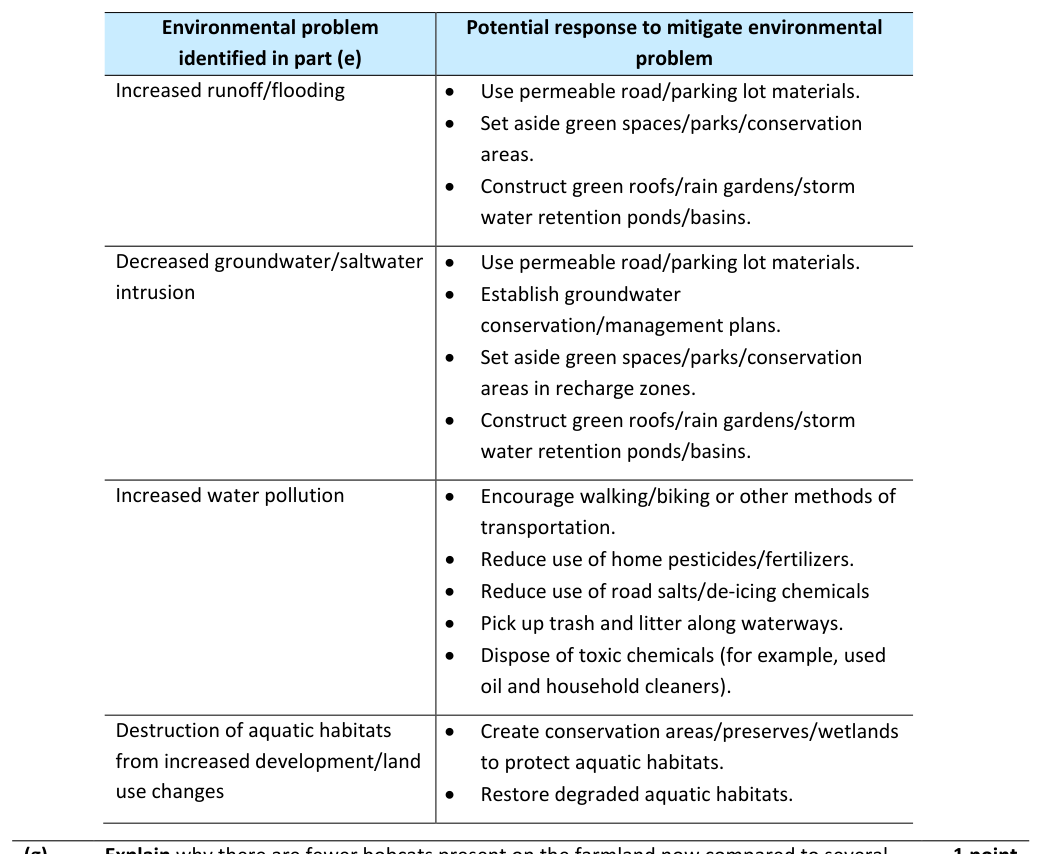

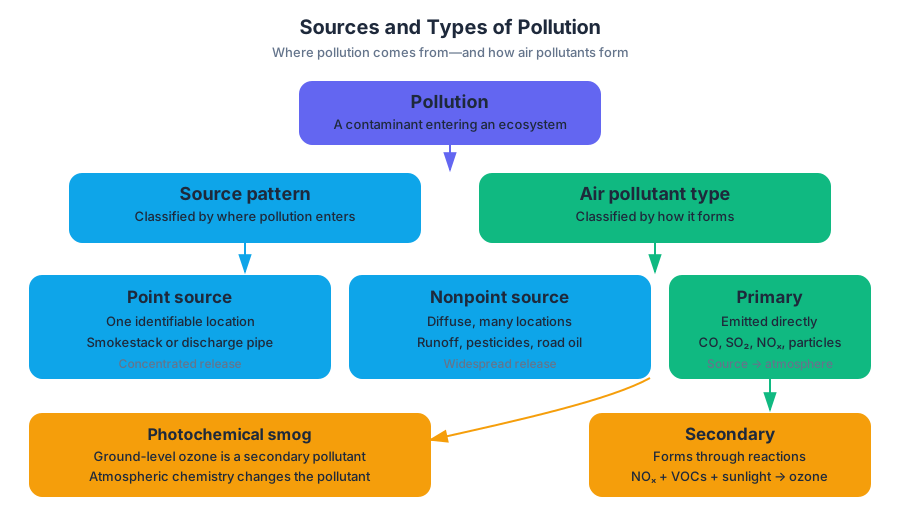
8.3 Endocrine Disruptors · 8.4 Human Impacts on Wetlands and Mangroves
Key concepts: Endocrine disruptors · Interference with the endocrine system in animals · Birth defects and developmental disorders caused by endocrine disruptors · Gender imbalances in fish and other species · Wetlands as providers of regulating ecosystem services · Human impacts of urbanization and development on wetlands · Mangrove and wetland environmental problems · Nutrient and sediment pollution in estuaries · Environmental solutions for aquatic pollution · Water-quality improvement through filtration
A chemical does not need to kill an animal immediately to damage an ecosystem: if it interferes with hormones during development, it can alter reproduction, growth, or sexual development across an entire population.
8.3 Endocrine Disruptors · 8.4 Human Impacts on Wetlands and Mangroves
A chemical does not need to kill an animal immediately to damage an ecosystem: if it interferes with hormones during development, it can alter reproduction, growth, or sexual development across an entire population.
Endocrine disruptors: chemical interference with hormones
The endocrine system is the network of glands and hormones that regulates processes such as growth, development, reproduction, and metabolism. An endocrine disruptor is a chemical that interferes with this system in an animal. It may imitate a natural hormone, block a hormone’s action, or change how much hormone an animal produces or breaks down.
STB-3.C — Describe endocrine disruptors.
STB-3.C.1 — Endocrine disruptors are chemicals that can interfere with the endocrine system of animals.
The ecological danger is often indirect. A contaminant may not cause immediate mortality, yet still reduce the number of healthy offspring produced or alter the proportion of males and females. Because reproduction and development determine future population size, a subtle chemical effect can become a population-level problem over time.
Effects on animals and ecosystems
Endocrine disruptors can lead to birth defects, developmental disorders, and gender imbalances in fish and other species. For example, if a chemical causes unusually high production of female fish in a population, the population may eventually contain too few males for successful reproduction. The result is not merely an individual abnormality; it can reduce recruitment, meaning the addition of new individuals to the population.
STB-3.D — Describe the effects of endocrine disruptors on ecosystems.
STB-3.D.1 — Endocrine disruptors can lead to birth defects, developmental disorders, and gender imbalances in fish and other species.
Worked example: A wastewater discharge enters a stream below a city. Fish downstream show abnormal development and a strongly uneven sex ratio, while fish upstream do not. A defensible explanation is that a chemical in the discharge interferes with the fish endocrine system, producing developmental effects and fewer reproductively successful pairings. Over several generations, the downstream population could decline even if adult fish do not die immediately.
Misconception check — “Only poisonous chemicals are harmful.” Acute toxicity and endocrine disruption are different mechanisms. A chemical can be harmful at relatively low concentrations if it alters hormonal signaling, especially during sensitive stages such as embryonic or juvenile development.
For AP reasoning, Science Practice 1: Concept Explanation, especially 1.A Describe environmental concepts and processes, is central here. A strong response names the chemical interference, identifies the endocrine system as the affected biological system, and connects the effect to development or reproduction; simply stating that “pollution harms fish” is too vague.
Wetlands and mangroves as regulating systems
A wetland is an area where water covers the soil either all or part of the time. Marshes, swamps, tidal flats, and mangrove forests are examples. Mangroves are coastal wetlands whose salt-tolerant vegetation slows water movement and traps material carried by runoff and tides.
STB-3.E.1 — Wetlands are areas where water covers the soil, either part or all of the time.
Wetlands provide regulating ecosystem services: benefits produced when ecosystems control or moderate environmental conditions. Their vegetation, saturated soils, and sediments can filter water and reduce flooding.
| Wetland feature | Regulating service | Mechanism |
|---|---|---|
| Dense roots and stems | Water purification | Slow water and trap sediment and some pollutants |
| Saturated soil and shallow basins | Flood reduction | Store water and release it more gradually |
| Mangrove roots along coasts | Shoreline protection | Reduce wave energy and hold sediment in place |
Water purification is a form of filtration. As nutrient- and sediment-rich runoff moves through wetland vegetation and soils, suspended particles can settle and plant uptake can remove some nutrients from the water. This does not make wetlands limitless pollution sinks: excessive inputs can overwhelm their capacity.
Urbanization and a defensible environmental response
Urbanization replaces permeable soil and vegetation with roads, buildings, and drainage systems. Development can therefore increase the delivery of nutrient- and sediment-rich runoff to an estuary, while filling, draining, or fragmenting wetlands removes the very areas that would have slowed and filtered that water.
STB-3.E.2 — Wetlands provide a variety of ecological services, including water purification and flood protection.
Worked contextual example: An estuary surrounded by expanding neighborhoods has declining water quality and stressed manatees. A strong response is to reduce nutrient and sediment pollution before it reaches the estuary—for example, by protecting or restoring vegetated wetland buffers, improving stormwater filtration, and reducing polluted runoff from developed land.
The reasoning chain is:
$$ \text{urban development} \rightarrow \text{more nutrient and sediment runoff} \rightarrow \text{poorer estuary water quality} $$
$$ \text{wetland protection and filtration} \rightarrow \text{less nutrient and sediment delivery} \rightarrow \text{improved water quality} $$
The advantages extend beyond effects on manatees. Cleaner water can support fish and invertebrates, improve habitat for wading birds, reduce sediment accumulation, preserve wetland functions, and lower flood risk. A response earns stronger environmental-solutions reasoning when it identifies both the action and the environmental mechanism.
This applies Science Practice 7: Environmental Solutions, particularly 7.B Describe potential solutions to environmental problems. It also uses Science Practice 1: Concept Explanation, 1.B Explain environmental concepts and processes, when the response links filtration or nutrient reduction to improved water quality rather than merely naming a solution.
Misconception check — “Wetlands are wastelands that should be drained.” Wetlands provide valuable regulating services. Removing them can increase flooding and pollution because development eliminates natural water storage and filtration.
Retrieval and interpretation check
- What makes a chemical an endocrine disruptor?
- Name two ecosystem-level effects of endocrine disruption.
- Why can wetland filtration improve an urban estuary?
- Why does reducing nutrient and sediment pollution benefit more than one species?
Answers: An endocrine disruptor interferes with an animal’s endocrine system. Effects include birth defects, developmental disorders, and gender imbalances. Wetland filtration slows runoff, traps sediment, and removes or retains some nutrients, improving water quality. Cleaner water supports multiple organisms and preserves wetland and estuary functions, not only manatees.
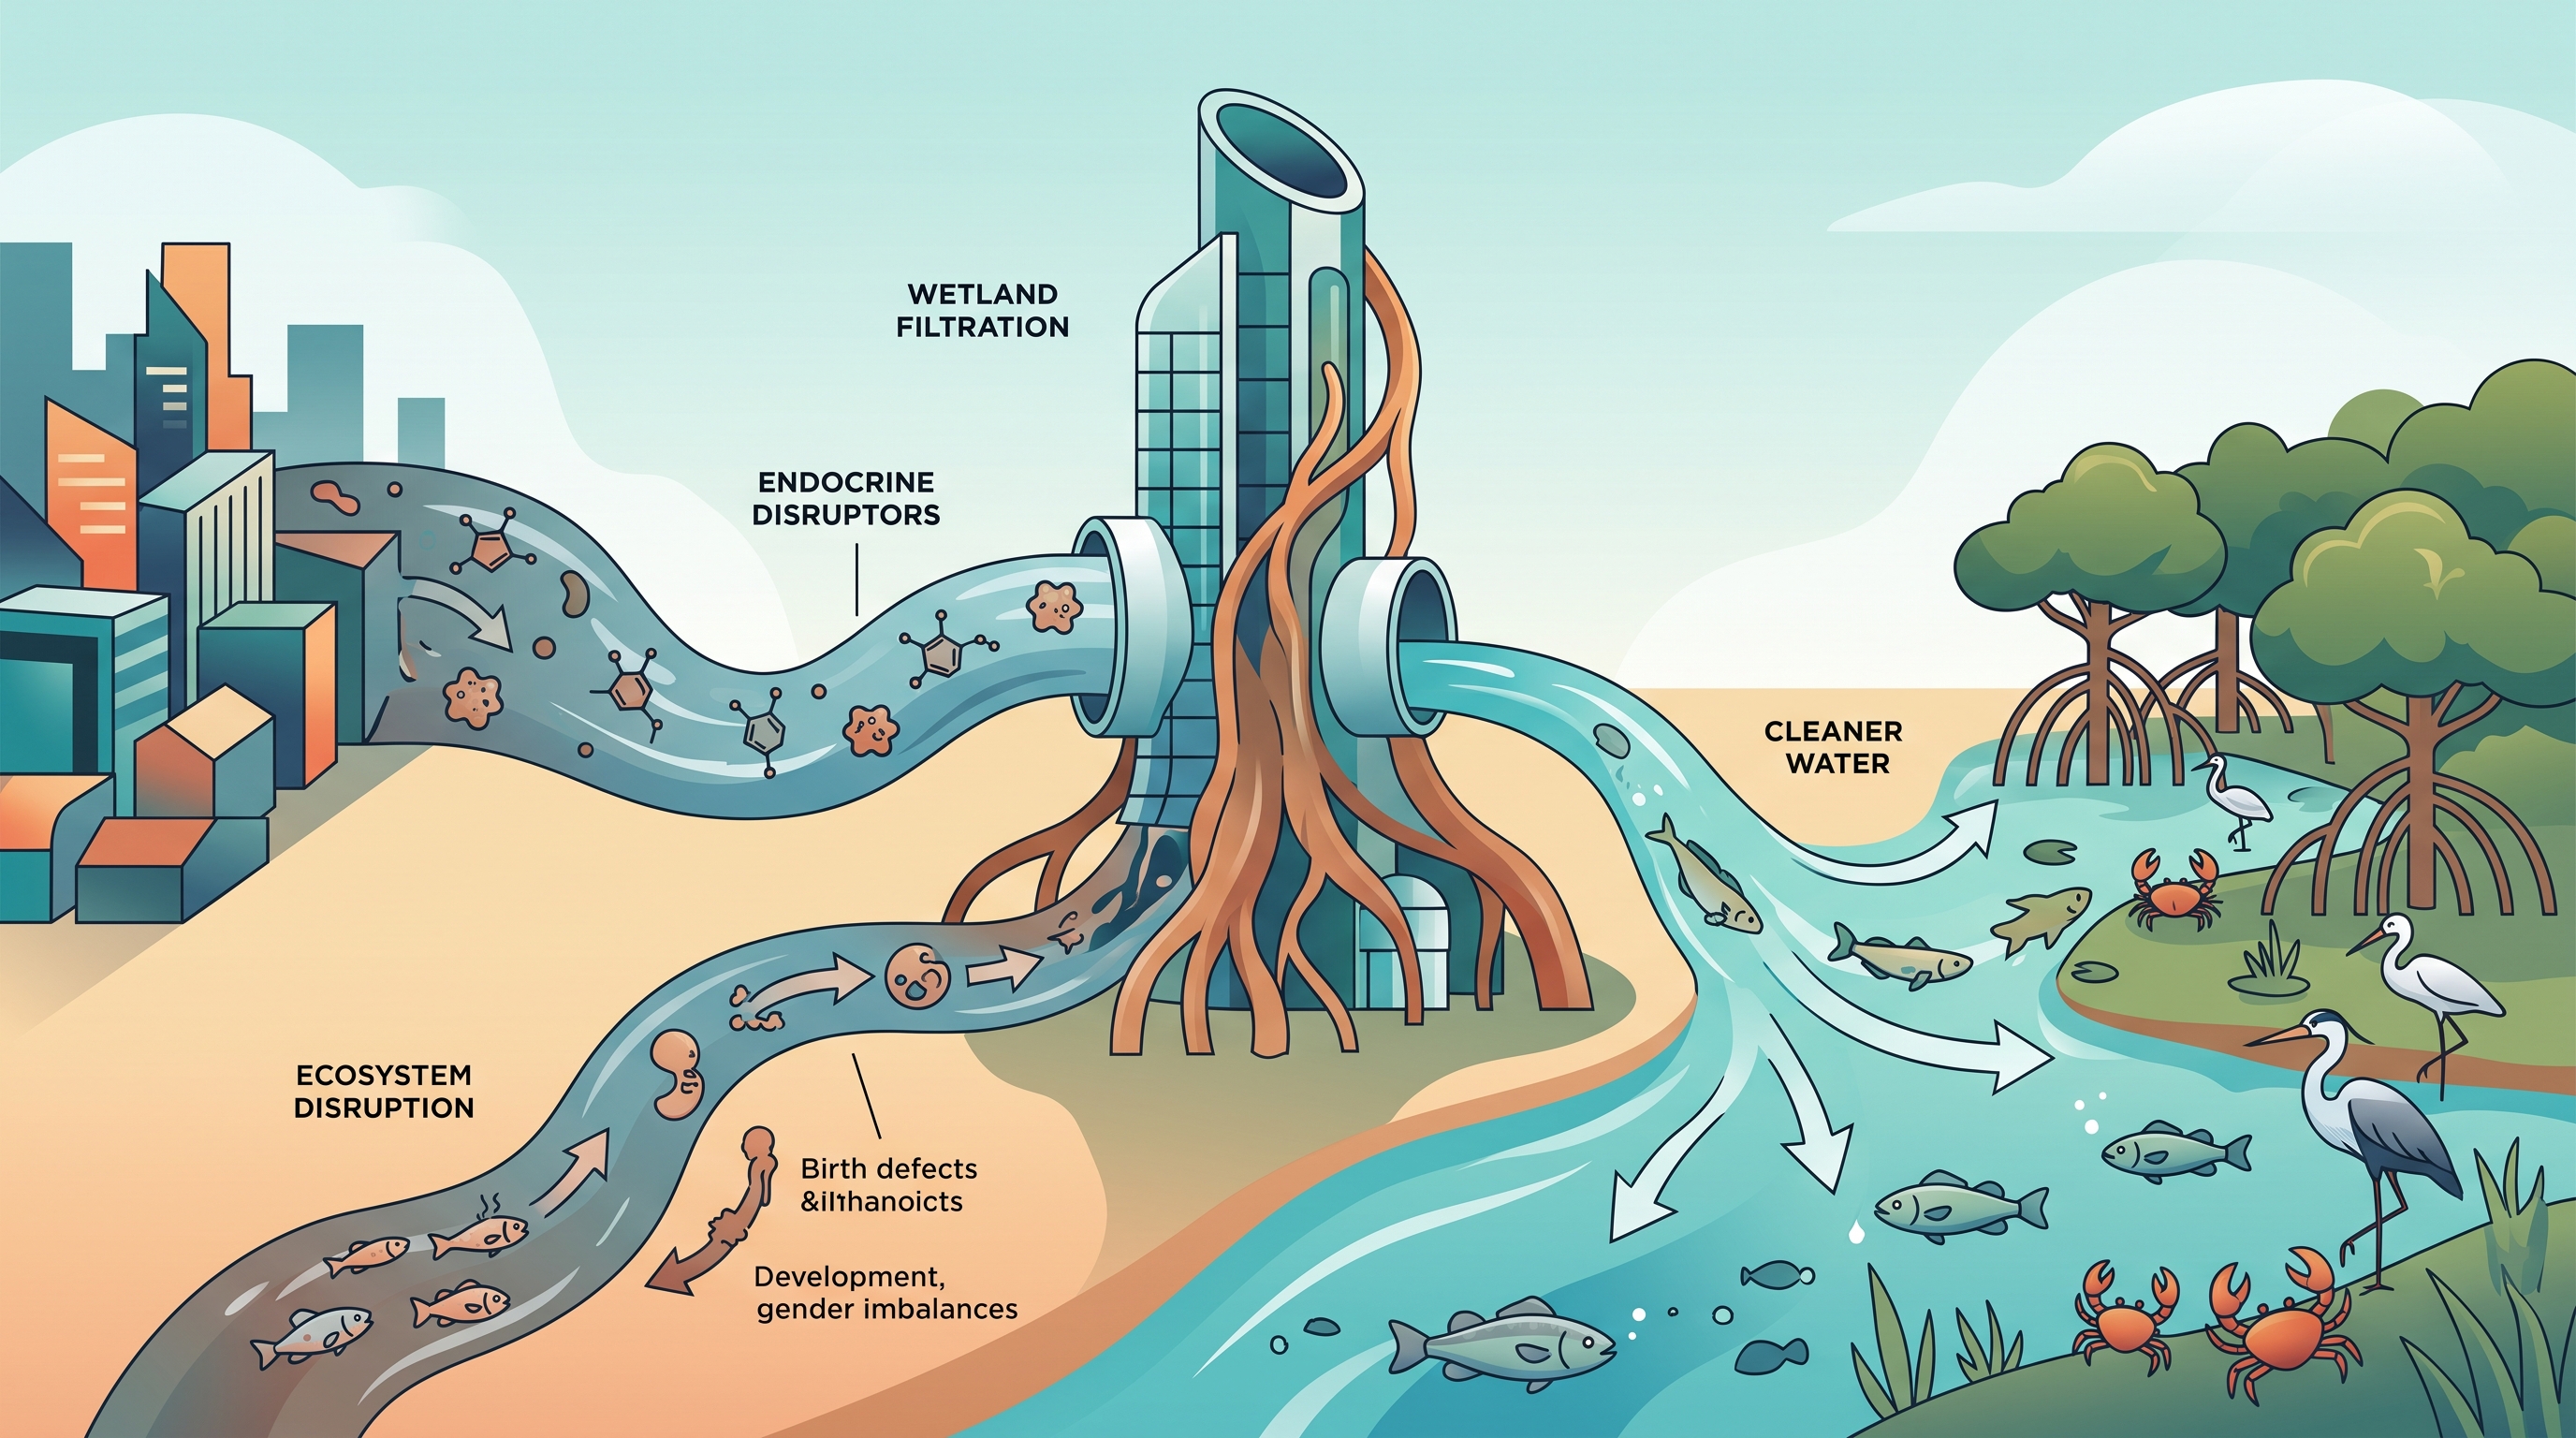
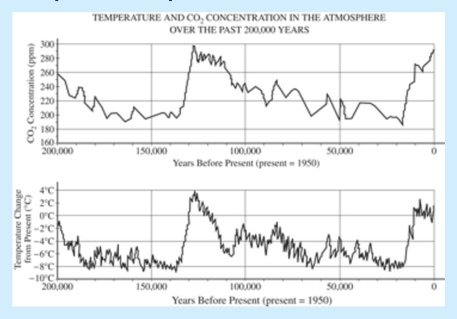
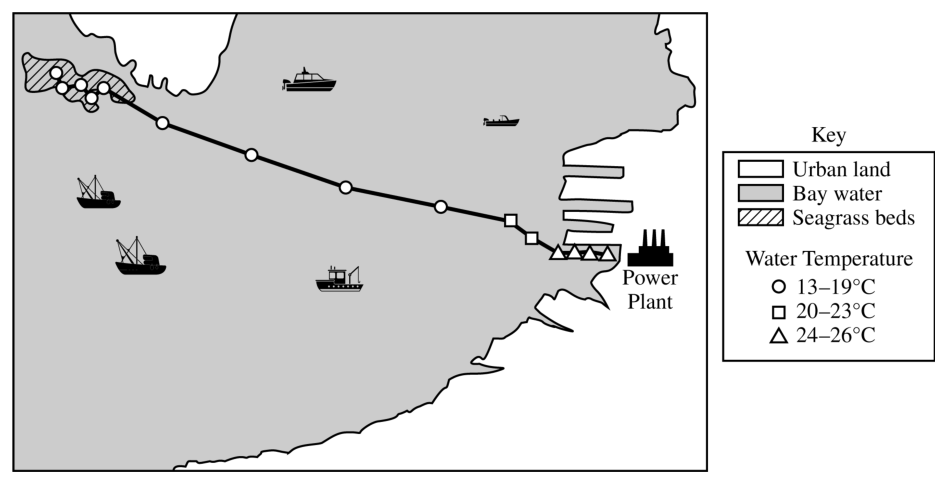
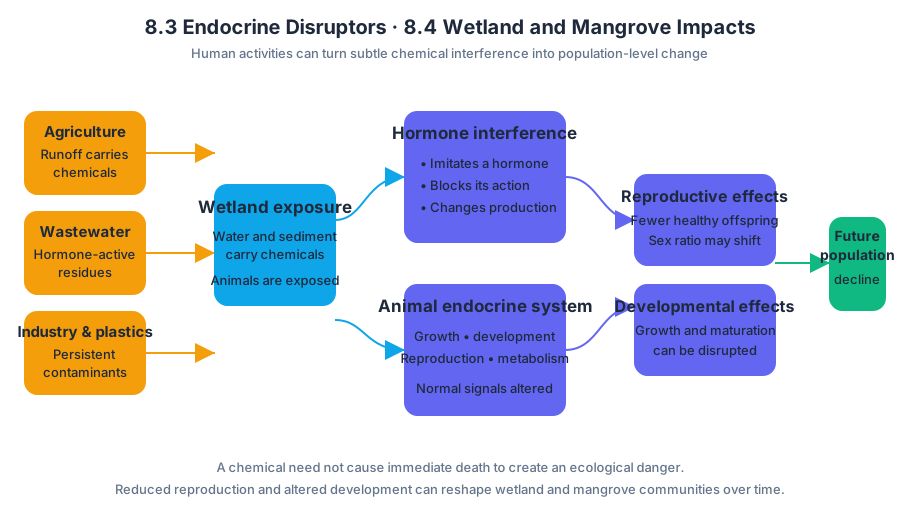
8.5 Eutrophication · 8.6 Thermal Pollution
Key concepts: Deforestation · Clear-cutting · Water temperature · Shade from trees · Sunlight reaching water · Sedimentation
A forest can influence the temperature and oxygen content of a stream even when the trees never touch the water. Removing the forest changes the stream’s physical conditions first; those changes can then affect dissolved oxygen, algae, and aquatic organisms.
8.5 Eutrophication · 8.6 Thermal Pollution
A forest can influence the temperature and oxygen content of a stream even when the trees never touch the water. Removing the forest changes the stream’s physical conditions first; those changes can then affect dissolved oxygen, algae, and aquatic organisms.
Deforestation and clear-cutting
Deforestation is the removal or conversion of forest cover. Clear-cutting is one form of deforestation in which most or all trees in an area are removed at once. Because a forest canopy regulates the conditions beneath it, clear-cutting can alter both terrestrial and aquatic ecosystems.
Along a forested stream, tree branches and leaves provide shade, blocking part of the incoming solar radiation. After clear-cutting, fewer trees remain to intercept sunlight, so more sunlight reaches the water’s surface. Increased solar energy can raise the water temperature; this is a form of thermal pollution, meaning a human-caused change in the temperature of a natural water body.
$$ \text{clear-cutting} \rightarrow \text{less shade} \rightarrow \text{more sunlight at water surface} \rightarrow \text{higher water temperature} $$
A second pathway: sedimentation
Clear-cutting can also leave soil exposed. Without tree roots and ground vegetation to hold soil in place, rainfall may cause more erosion, carrying sediment into the stream. Sedimentation is the accumulation or transport of soil particles into an aquatic system. Suspended or deposited sediment can absorb solar energy and contribute to warming, while also increasing turbidity and covering stream-bottom habitat.
The two explanations are related but distinct. A strong explanation may identify either the loss of shade and increased sunlight or the addition of sediment from erosion; the strongest response recognizes that both mechanisms can operate simultaneously.
| Change after clear-cutting | Immediate mechanism | Possible aquatic effect |
|---|---|---|
| Trees removed | Less canopy shade | More sunlight reaches water |
| Exposed soil | Greater erosion during rainfall | More sediment enters stream |
| More solar absorption | Water gains thermal energy | Water temperature rises |
| More suspended particles | Reduced water clarity | Turbidity and habitat quality may change |
Thermal pollution and dissolved oxygen
Warmer water generally holds less dissolved oxygen than cooler water. Therefore, a temperature increase caused by clear-cutting can place additional stress on aquatic organisms, especially species that require cool, oxygen-rich water. Temperature is an abiotic factor, but it can produce biological consequences throughout the ecosystem.
Misconception check: clear-cutting does not necessarily cool a stream simply because vegetation has been removed. The relevant question is the energy balance at the water surface: removing shade usually allows more sunlight to enter, and sediment may absorb additional heat. The expected explanation is therefore a temperature increase, not merely “the habitat was disturbed.”
Eutrophication from nutrient runoff
A golf course constructed in forest B could alter a different water-quality indicator through fertilizer runoff. Fertilizers commonly add nitrogen and phosphorus compounds, including nitrates and phosphates, to the surrounding environment. Rain can transport these nutrients into nearby water.
$$ \text{fertilizer runoff} \rightarrow \text{more nitrates and phosphates} \rightarrow \text{algal growth} \rightarrow \text{decomposition} \rightarrow \text{lower dissolved oxygen} $$
Eutrophication is the enrichment of water with nutrients that promotes excessive algal or plant growth. When the resulting algae die, decomposer organisms break down the organic matter and use oxygen during cellular respiration. If oxygen consumption exceeds oxygen replenishment, dissolved oxygen falls, potentially creating stressful or hypoxic conditions for aquatic organisms.
Not every change at the golf course must increase pollution. Maintained grass can reduce erosion compared with barren, clear-cut land, so sedimentation or turbidity might decrease relative to the clear-cut area. The direction of change depends on which land surface is being compared and which pollutant pathway dominates.
Applying the investigation design
If forest A remains intact while forest B is clear-cut, forest A functions as a control. Researchers can compare temperature, turbidity, sedimentation, or dissolved oxygen between the intact and altered areas. The comparison helps isolate the effect of forest removal rather than treating a single measurement as proof of causation.
AP science practices in context
This topic most directly uses Science Practice 1: Concept Application when connecting clear-cutting to shade, sunlight, sedimentation, temperature, and dissolved oxygen; Science Practice 2: Visual Representations when interpreting a forest-stream diagram or causal model; Science Practice 4: Scientific Experiments when identifying the control forest and measured variables; Science Practice 5: Data Analysis when comparing water-quality measurements; and Science Practice 7: Environmental Solutions when evaluating strategies such as preserving streamside trees. Science Practice 3: Text Analysis can support evidence-based explanations, while Science Practice 6: Mathematical Routines may be used to calculate changes in temperature, turbidity, or dissolved oxygen.
Retrieval check
A stream beside a clear-cut area becomes warmer, and nitrate concentration rises near a fertilized golf course. Give one mechanism for the temperature increase and one mechanism for a possible dissolved-oxygen decrease.
Answer: Fewer trees provide less shade, allowing more sunlight to reach and warm the water. Fertilizer runoff adds nutrients, stimulating algal growth; decomposition of dead algae consumes dissolved oxygen.
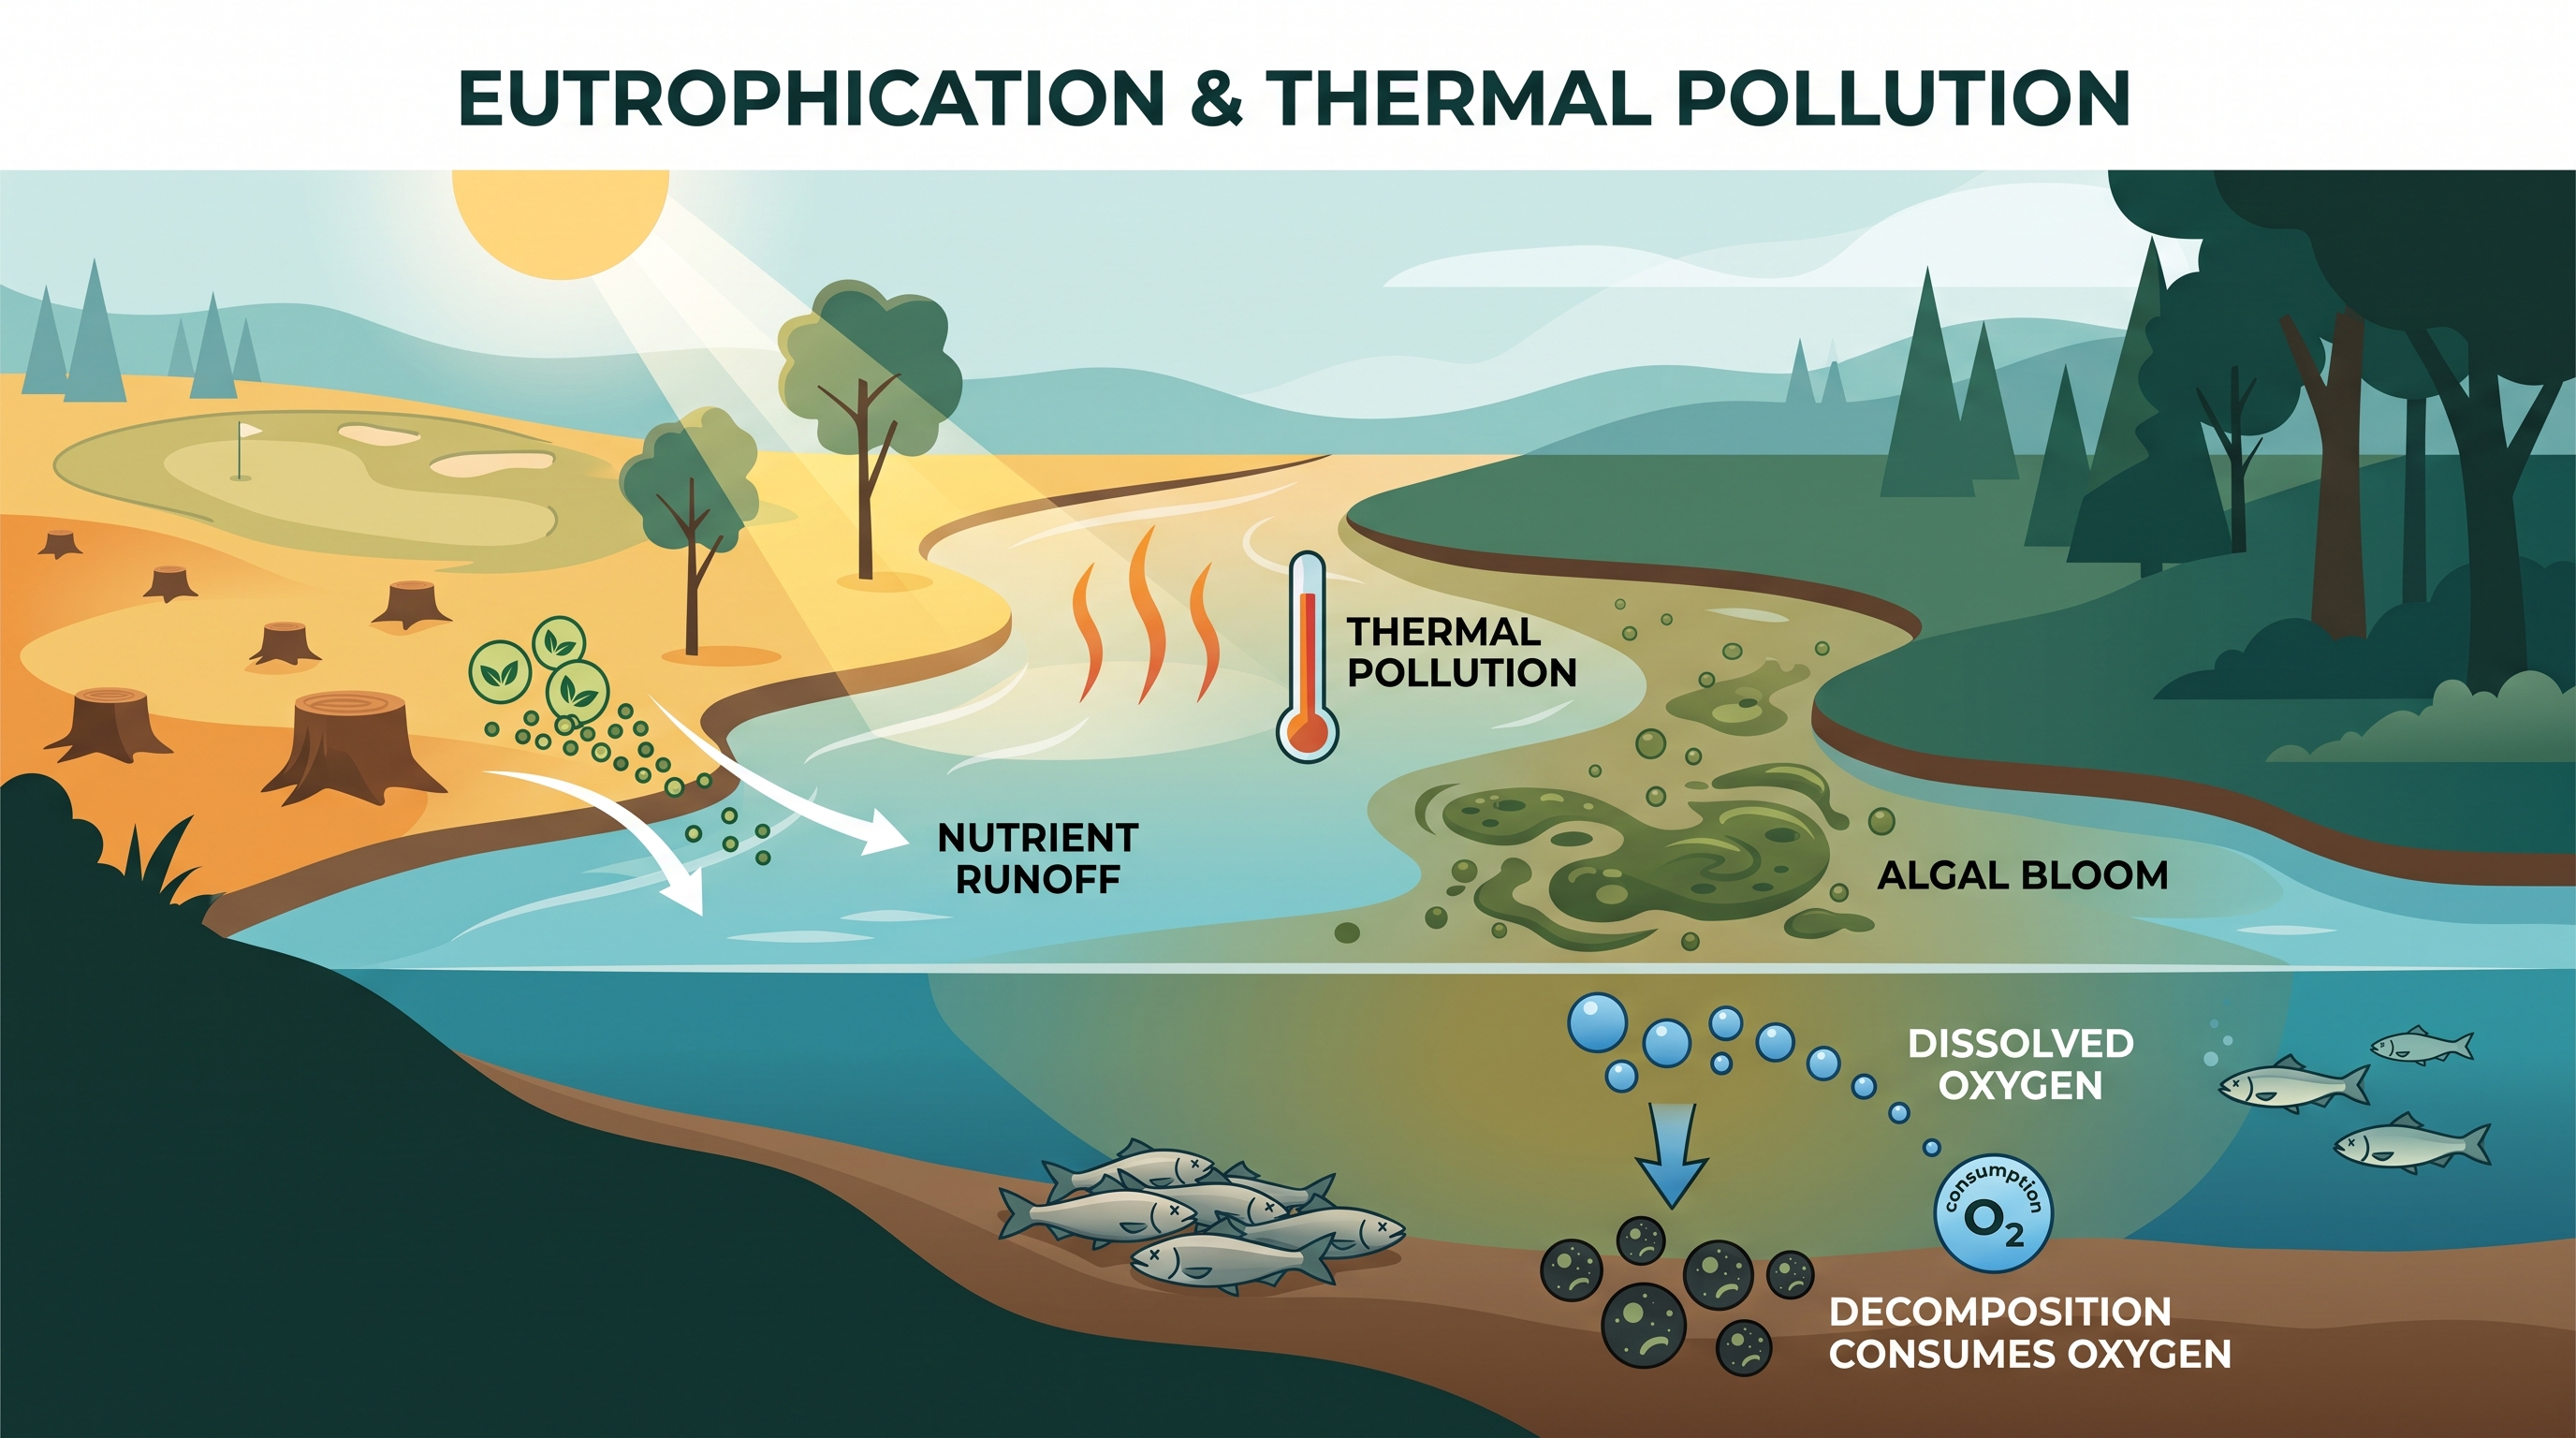
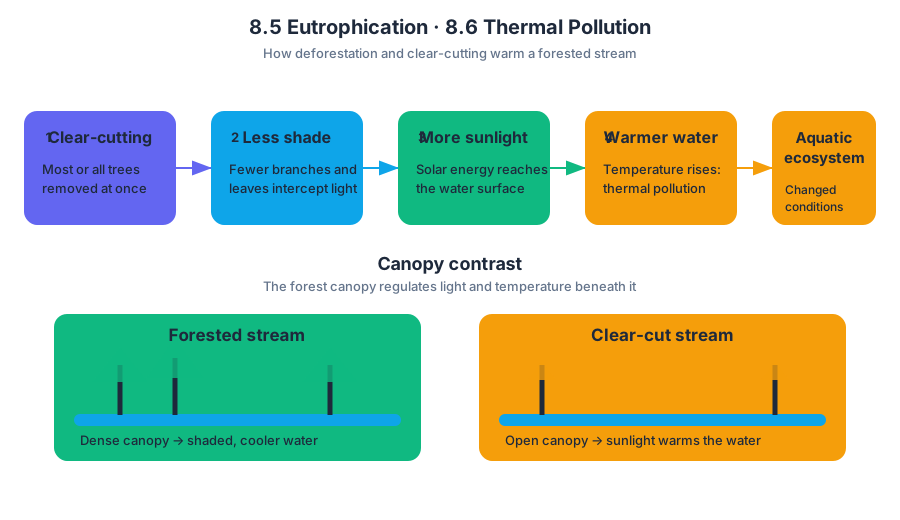
8.7 Persistent Organic Pollutants (POPs) · 8.8 Bioaccumulation and Biomagnification
Key concepts: Persistent organic pollutants (POPs) · Synthetic carbon-based molecules · Environmental persistence · Fat solubility · Toxicity to organisms · Bioaccumulation · Selective absorption into organisms’ fatty tissues · Biomagnification · Trophic levels · DDT and PCBs as examples of POPs
Persistent organic pollutants (POPs) are synthetic, carbon-based molecules that resist environmental breakdown and can become increasingly concentrated in organisms and food webs. Two important examples are DDT and PCBs.
8.7 Persistent Organic Pollutants (POPs) · 8.8 Bioaccumulation and Biomagnification
Persistent organic pollutants (POPs) are synthetic, carbon-based molecules that resist environmental breakdown and can become increasingly concentrated in organisms and food webs. Two important examples are DDT and PCBs.
Investigative question: How can a small concentration of a pollutant in water eventually harm organisms at the top of a food web?
Why POPs persist
The word persistent means that a substance does not easily decompose or chemically break down in the environment. Because POPs are synthetic carbon-based molecules, natural processes such as microbial decomposition do not remove them quickly. A pollutant released in one location may therefore remain available for transport and biological uptake long after its original use.
STB-3.H.1: Persistent organic pollutants (POPs) do not easily break down in the environment because they are synthetic, carbon-based molecules, such as DDT and PCBs.
POPs may travel long distances through wind and water before being redeposited. This means that contamination can appear far from the place where a chemical was manufactured, applied, or released. Persistence and transport together give POPs a broad geographic reach.
A useful mental model is a slow-moving environmental conveyor belt:
$$ \text{release} \rightarrow \text{transport by wind or water} \rightarrow \text{redeposition} \rightarrow \text{uptake by organisms} $$
Why fat solubility causes toxicity
Many POPs are fat-soluble, meaning they dissolve more readily in lipids than in water. Once an organism absorbs a fat-soluble POP, the pollutant can be stored in fatty tissues instead of being rapidly excreted in urine or other water-based wastes.
STB-3.H.2: Persistent organic pollutants (POPs) can be toxic to organisms because they are soluble in fat, which allows them to accumulate in organisms’ fatty tissues.
Toxicity depends on exposure and biological effects, not simply on whether a chemical is present. A POP stored in tissue may interfere with reproduction, development, or normal body functions. At the ecosystem level, those effects can reduce reproductive success, alter predator–prey relationships, and change population sizes.
Key distinction: Persistence describes how long a pollutant remains in the environment; fat solubility helps explain why it remains in organisms.
Bioaccumulation versus biomagnification
Bioaccumulation is the selective absorption and buildup of a pollutant within one organism’s tissues over time. It occurs when uptake from food, water, or sediment is faster than the organism can eliminate the pollutant.
Biomagnification is the increase in pollutant concentration at progressively higher trophic levels. A predator may consume many contaminated prey organisms, acquiring the pollutant stored in each one. Consequently, organisms at higher trophic levels can contain greater concentrations than organisms lower in the same food web.
The two processes operate together:
$$ \text{water or sediment} \rightarrow \text{plankton} \rightarrow \text{small fish} \rightarrow \text{large fish} \rightarrow \text{fish-eating bird} $$
$$ \text{bioaccumulation within individuals} + \text{consumption across trophic levels} \rightarrow \text{biomagnification} $$
Worked example: a contaminated wetland food web
Imagine that a wetland receives a small input of a PCB. The PCB does not easily break down, so it remains in sediment and water. Plankton absorb some of it, and a small fish accumulates more by eating many plankton over its lifetime.
A larger fish then eats numerous small fish. Finally, a wading bird eats several larger fish. The bird may receive the greatest total pollutant exposure because it consumes many contaminated organisms and stores the fat-soluble PCB in its own fatty tissues.
The reasoning chain is:
| Level | Environmental process | Expected consequence |
|---|---|---|
| Sediment and water | Persistent PCB remains available | Long-term contamination |
| Plankton | Absorption from the environment | Pollutant enters the food web |
| Small fish | Uptake from food exceeds elimination | Bioaccumulation |
| Large fish | Consumes many contaminated prey | Higher tissue concentration |
| Wading bird | Feeds at a high trophic level | Biomagnification and possible toxicity |
An AP-style explanation should connect mechanism to consequence: Because the PCB is persistent and fat-soluble, it remains in the ecosystem and accumulates in fatty tissues. Predators consume many contaminated prey, so PCB concentration increases at higher trophic levels, potentially reducing reproductive success or causing other biological effects in top predators.
Misconception check
Misconception: “Biomagnification means an organism simply gets larger.” Biomagnification refers to pollutant concentration increasing across trophic levels, not to body size. Bioaccumulation occurs within an individual organism; biomagnification compares concentrations among organisms at different trophic levels.
Misconception: “A low concentration in water is harmless.” A low environmental concentration can still matter when a persistent, fat-soluble pollutant is repeatedly absorbed and passed through a food web. Concentration, exposure duration, tissue storage, and trophic position all affect biological consequences.
AP skill connection
This topic is assessed through STB-3.G.21.C: Explain environmental biological consequences for ecosystems. To apply this skill, do more than name bioaccumulation: identify the pollutant’s property, trace its movement through the food web, and state a specific ecosystem consequence.
Retrieval check: A pollutant is found at a low concentration in water but at a much higher concentration in fish-eating birds. Which process explains the increase among trophic levels, and which pollutant property makes storage in the birds’ tissues possible?
Answer: Biomagnification explains the increase across trophic levels; fat solubility allows storage in fatty tissues.
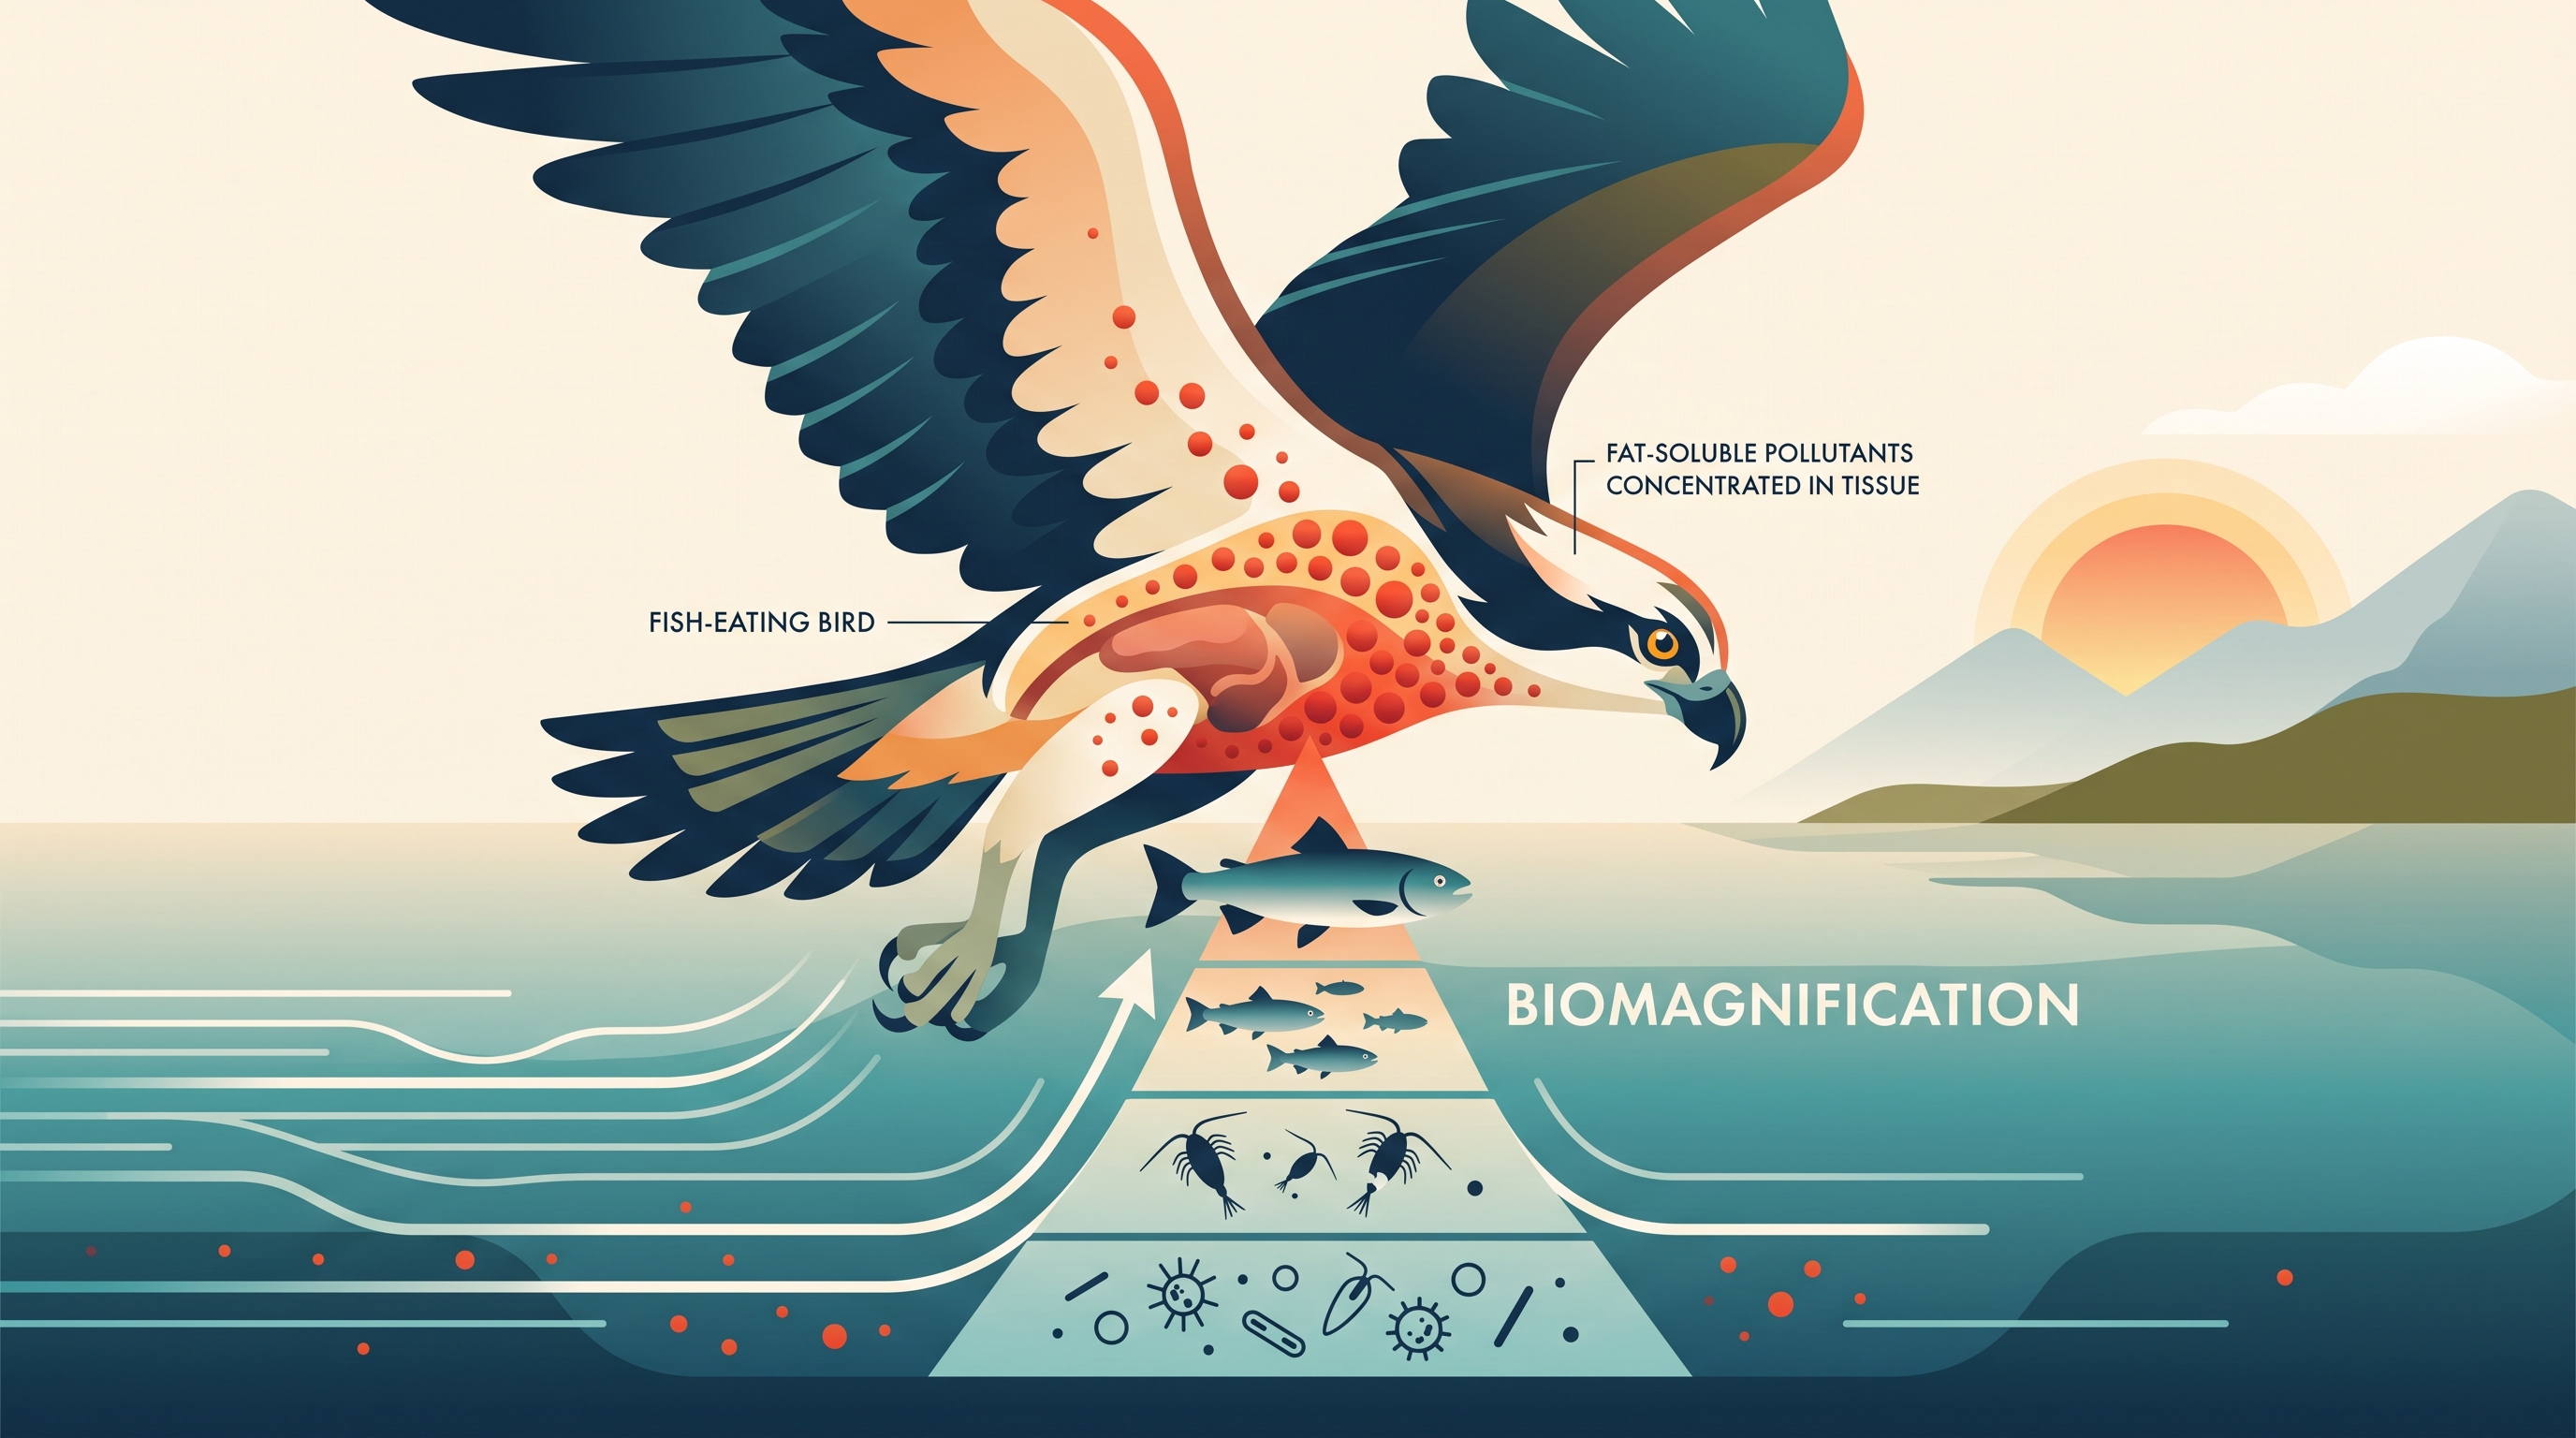
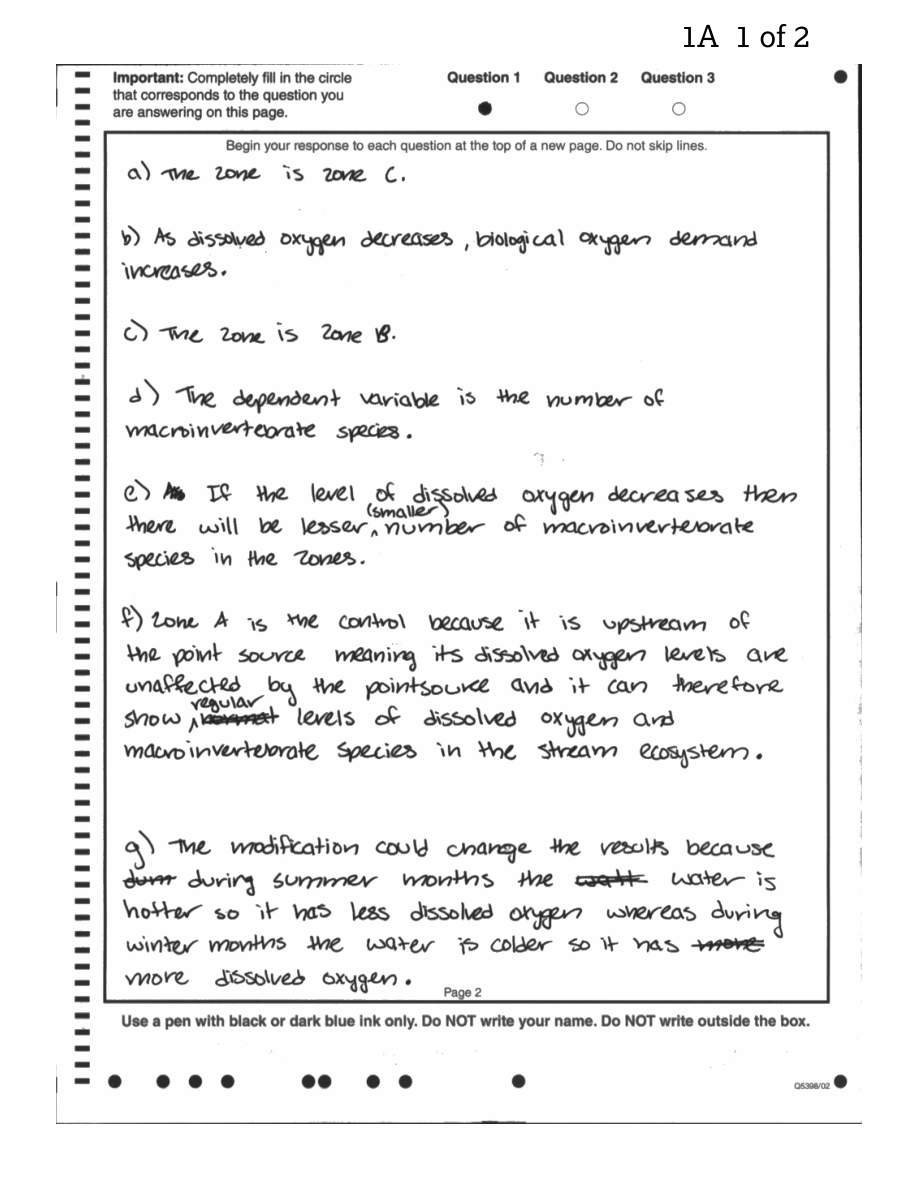
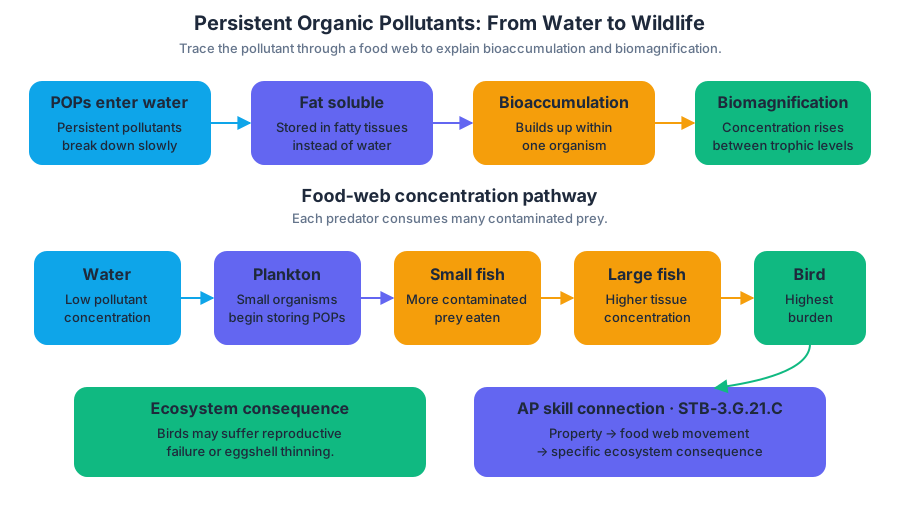
8.9 Solid Waste Disposal · 8.10 Waste Reduction Methods
Key concepts: Solid waste · Solid waste disposal methods · Landfills · Landfill decomposition · Methane emissions · Incineration · Illegal dumping · Organic waste · Waste reduction methods · Electronic waste
A discarded cell phone, a banana peel, a worn tire, and a broken television all become part of the waste stream—but they do not behave alike after disposal.
8.9 Solid Waste Disposal · 8.10 Waste Reduction Methods
A discarded cell phone, a banana peel, a worn tire, and a broken television all become part of the waste stream—but they do not behave alike after disposal. Solid waste is any discarded material that is neither a liquid nor a gas. Human activities generate it in domestic, industrial, business, and agricultural sectors, including large quantities of organic waste and electronic waste, or e-waste, such as televisions, cell phones, and computers.
Essential Knowledge STB-3.K.1: Solid waste is any discarded material that is not a liquid or gas. It is generated in domestic, industrial, business, and agricultural sectors.
Essential Knowledge STB-3.K.3: Electronic waste, or e-waste, is composed of discarded electronic devices including televisions, cell phones, and computers.
Landfills: containment, not disappearance
Solid waste is most often disposed of in landfills. A modern sanitary municipal landfill is engineered to isolate waste from surrounding ecosystems, but it does not make the waste vanish or eliminate every environmental risk.
A sanitary landfill typically includes five protective systems:
- Bottom liner: plastic or clay that limits movement of contaminated liquid into soil and groundwater.
- Storm-water collection system: channels precipitation away from the waste to reduce infiltration.
- Leachate collection system: gathers contaminated liquid produced when water moves through the waste.
- Cap: covers filled waste, reducing water entry and limiting contact with air.
- Methane collection system: captures methane produced as organic material decomposes.
Essential Knowledge STB-3.K.4: A sanitary municipal landfill consists of a bottom liner, a storm-water collection system, a leachate collection system, a cap, and a methane collection system.
The central trade-off is straightforward: landfill engineering reduces exposure, but the waste remains chemically and biologically active. Landfills can still contaminate groundwater if leachate escapes and can release harmful gases if gas collection is incomplete.
Essential Knowledge STB-3.K.2: Solid waste is most often disposed of in landfills. Landfills can contaminate groundwater and release harmful gases.
What controls landfill decomposition?
Decomposition is the breakdown of organic material by microorganisms. In a landfill, its rate and products depend on two major variables: the composition of the trash and the conditions available for microbial decomposition.
A load containing food scraps, paper, and yard waste contains substantial biodegradable material. A load dominated by glass, metals, plastics, and other non-degradable materials will change much more slowly. Oxygen concentration also matters: buried organic waste may undergo low-oxygen or anaerobic decomposition, producing methane, $CH_4$, as a by-product.
Essential Knowledge STB-3.L.1: Factors in landfill decomposition include the composition of the trash and conditions needed for microbial decomposition of the waste.
Worked example: predicting landfill gas
Suppose two landfill sections receive equal masses of trash. Section A contains mostly food scraps and paper, while Section B contains mostly glass and metal. If both sections have limited oxygen, Section A is expected to generate more methane because it contains more biodegradable organic material available for anaerobic microbial decomposition. A methane-collection system can capture this gas; the methane may then be used as an energy source or burned off to reduce its release into the atmosphere.
Misconception check — “All buried trash decomposes at the same rate.” It does not. Decomposition depends on both what the trash contains and whether microorganisms have suitable conditions, including an appropriate oxygen environment. Non-degradable materials may remain while organic material changes around them.
Incineration and improper disposal
Incineration burns solid waste at high temperatures. Its major advantage is volume reduction: much less solid material requires final disposal. Its major disadvantage is that combustion can create air pollution, so incineration does not automatically transform waste into an environmentally harmless product.
Illegal dumping is another improper disposal method. For example, discarded rubber tires can collect water and create breeding sites for mosquitoes, while unmanaged waste can spread into soil and water. The disposal method therefore changes the pathway by which pollution reaches organisms and ecosystems.
Waste reduction and methane mitigation
The strongest waste strategy is to prevent material from entering disposal systems in the first place. Acceptable reduction or mitigation methods include:
| Method | Environmental mechanism |
|---|---|
| Reusing materials | Extends product life and avoids replacement waste |
| Recycling | Recovers materials for use in new products |
| Composting non-synthetic organic waste | Diverts biodegradable material from landfills |
| Incineration | Reduces the volume requiring disposal, while requiring air-pollution controls |
| Methane collection | Captures landfill methane before it escapes |
| Burning off methane | Converts captured methane into less climate-forcing combustion products |
Reusing or recycling paper and textiles, and composting suitable organic material, reduce the amount of biodegradable waste available for methane production. When organic waste is already in a landfill, methane collection or controlled burning can reduce atmospheric emissions.
Suggested skill — “Use data and evidence to support a potential solution.” A strong environmental solution must connect evidence to a mechanism. For example, if waste audits show that a landfill receives a high percentage of compostable food waste, composting is supported because it removes biodegradable material before anaerobic landfill decomposition can generate methane.
Retrieval check: A landfill receives more organic waste but has the same oxygen concentration and collection infrastructure. Predict the likely change in methane production and explain your reasoning using STB-3.L.1. Why would composting that organic fraction address the cause rather than merely the symptom?
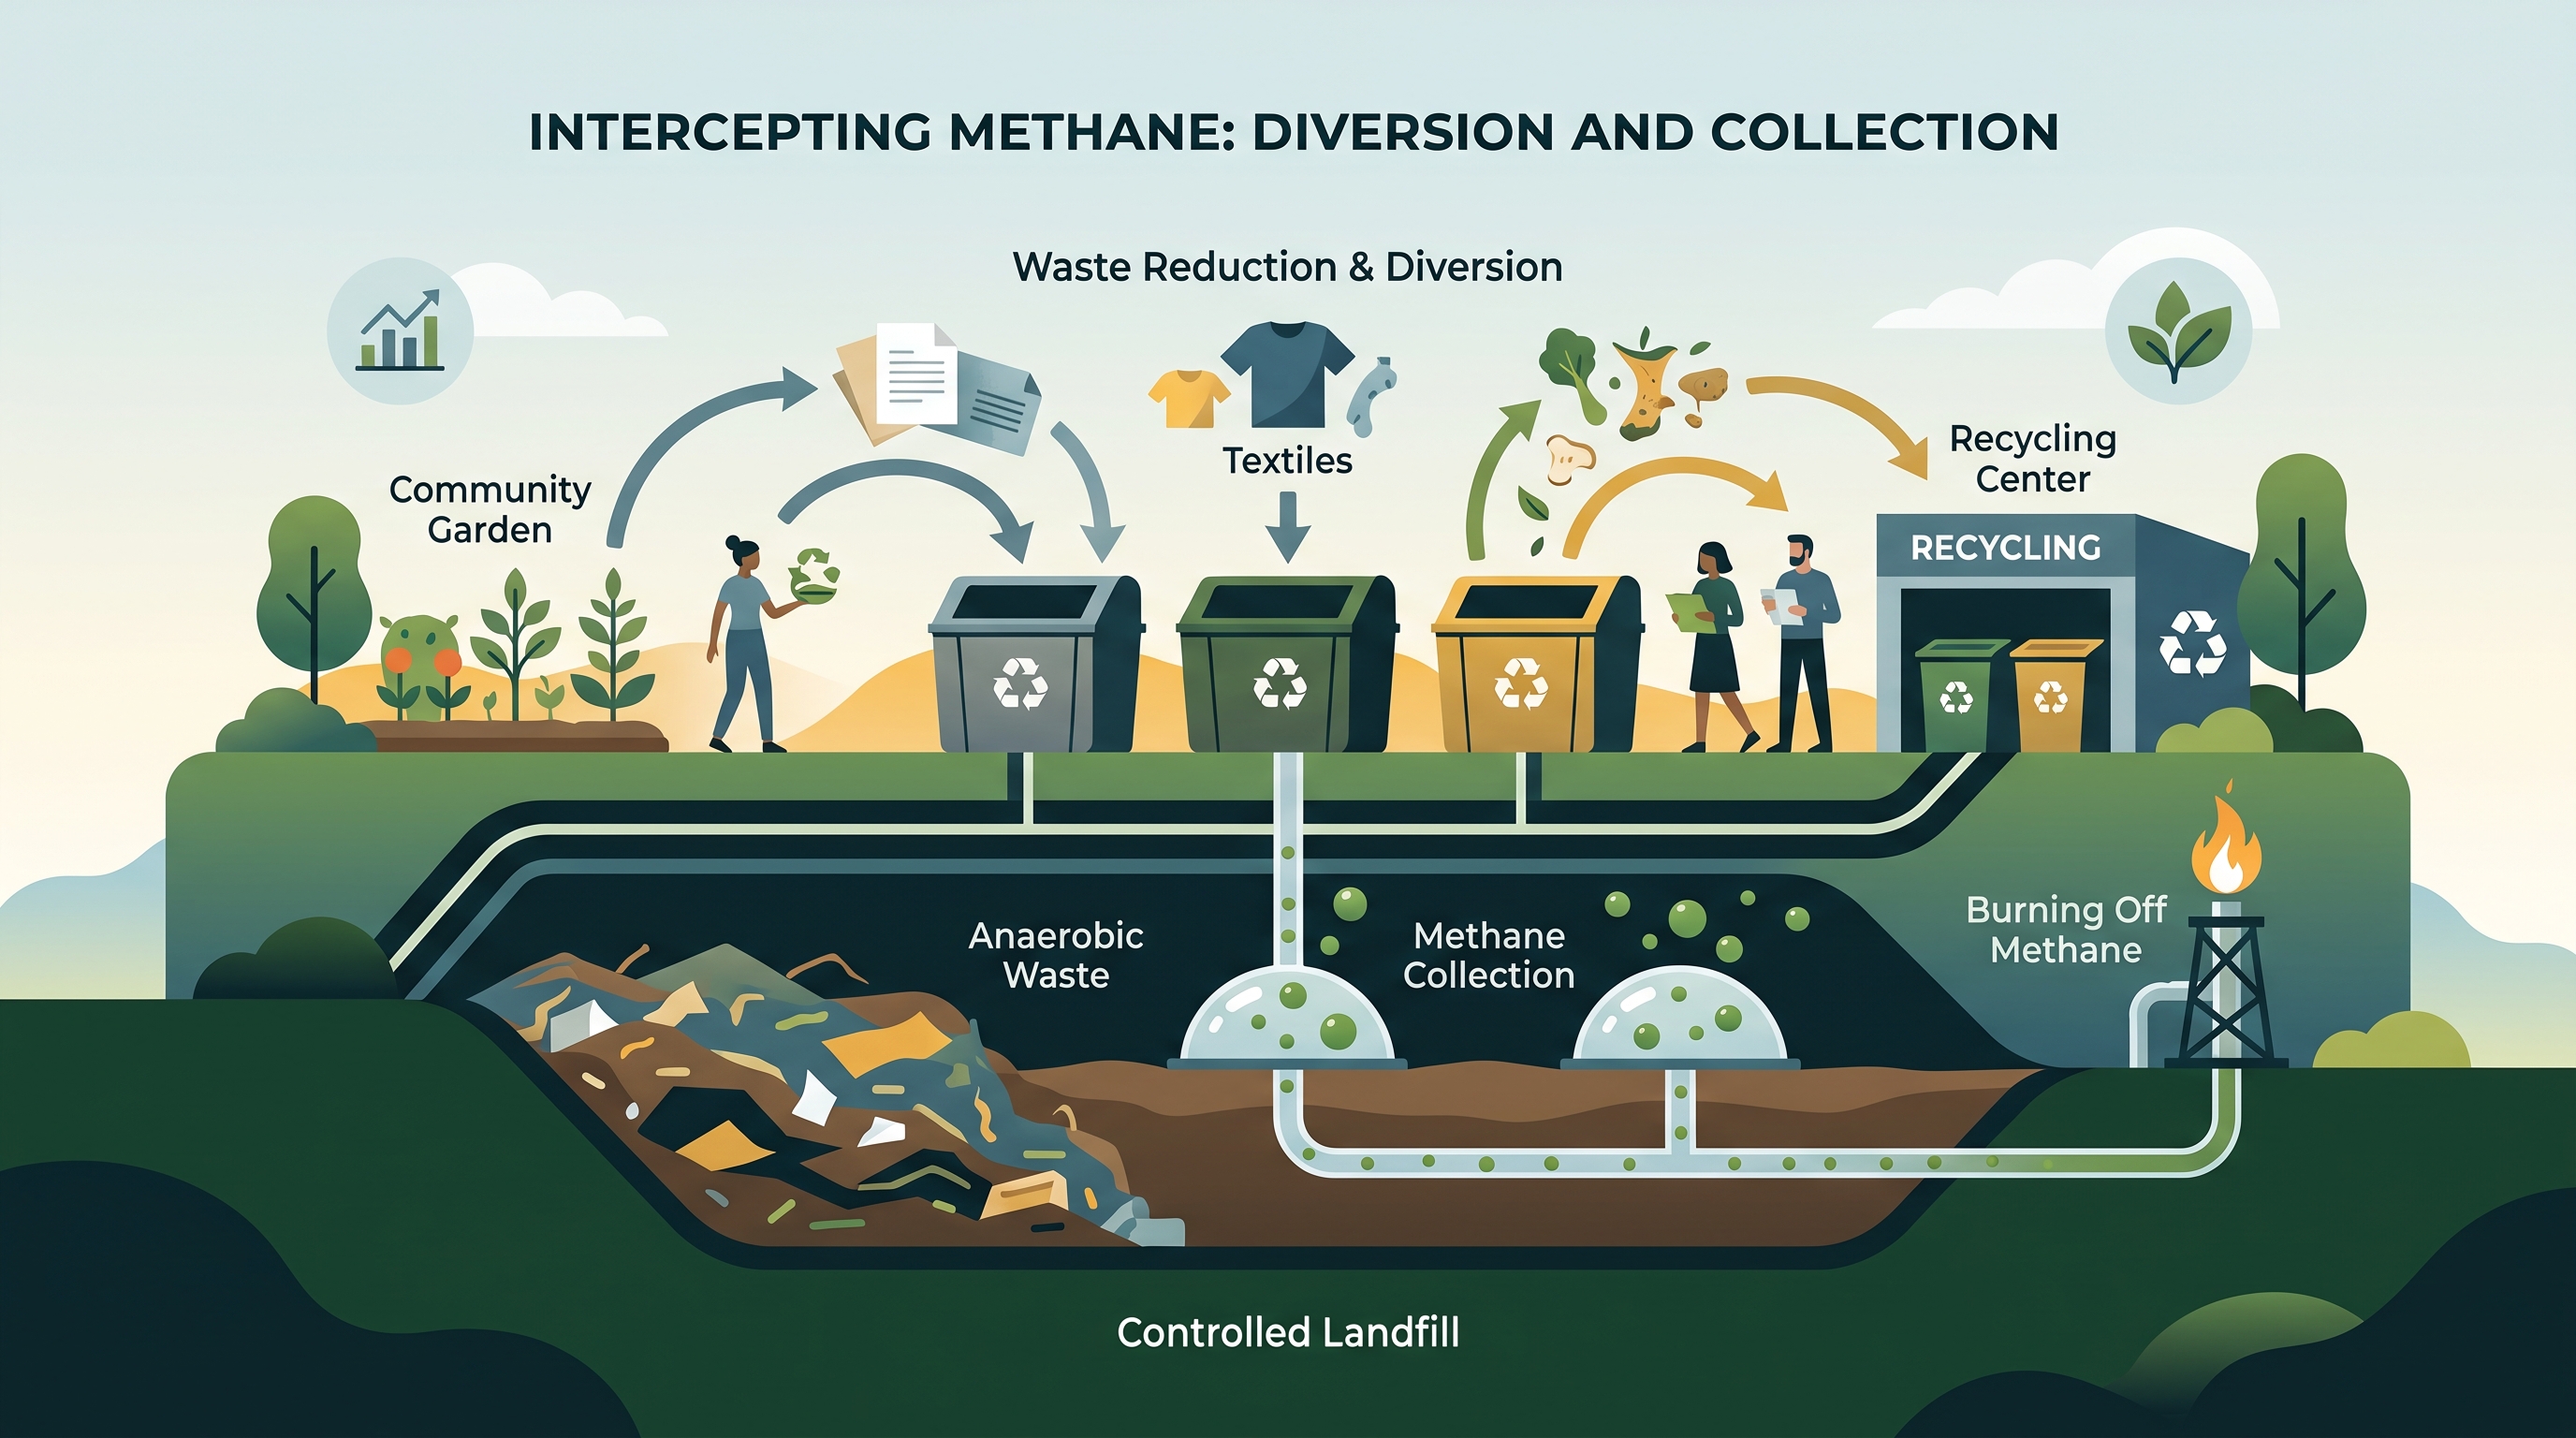
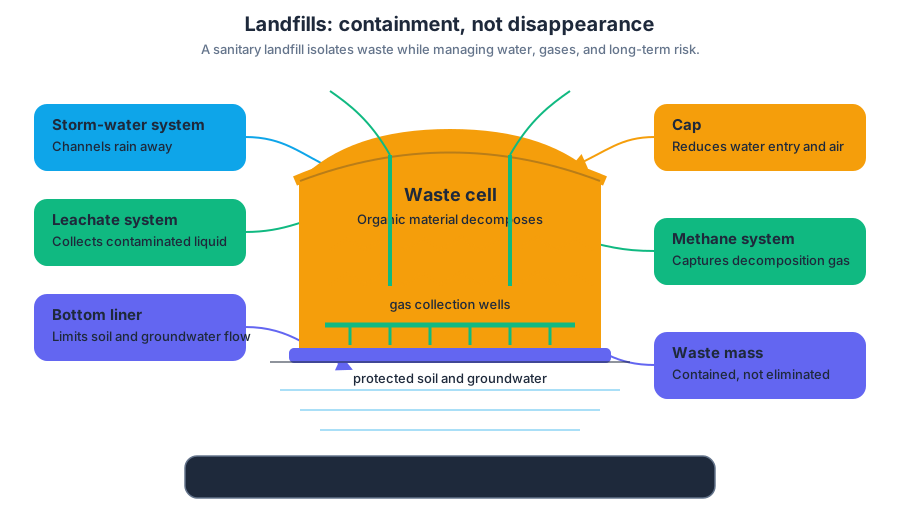
8.11 Sewage Treatment · 8.12 Lethal Dose 50% (LD50)
Key concepts: Sewage treatment · Disinfection of treated sewage · Chlorine, ozone, and ultraviolet (UV) light as disinfectants · Lethal Dose 50% (LD50) · Interpreting an LD50 curve · Calculating LD50 · Dose-response relationships · Using experimental data to estimate LD50
Sewage treatment uses physical, biological, and chemical steps to reduce pollutants and pathogens before wastewater returns to the environment. The final safety question is simple but consequential: How can treated sewage be disinfected, and how can the toxicity of a chemical be measured quantitatively?
8.11 Sewage Treatment · 8.12 Lethal Dose 50% (LD50)
Sewage treatment uses physical, biological, and chemical steps to reduce pollutants and pathogens before wastewater returns to the environment. The final safety question is simple but consequential: How can treated sewage be disinfected, and how can the toxicity of a chemical be measured quantitatively?
Sewage treatment and disinfection
After solids and many dissolved pollutants have been removed, sewage treatment may use one or more disinfectants, substances that kill bacteria and other disease-causing microorganisms. Common disinfectants named for Topic 8.11 are chlorine, ozone, and ultraviolet (UV) light.
These disinfectants work through different mechanisms. Chlorine is added as a chemical and is widely used because it can continue disinfecting water while it moves through pipes. Ozone is a highly reactive form of oxygen that damages microorganisms, while UV light inactivates microorganisms by disrupting their genetic material. The treatment choice depends on effectiveness, cost, equipment, and the characteristics of the treated sewage.
A useful distinction is that treatment and disinfection are not identical. Treatment removes or transforms contaminants; disinfection specifically targets living microorganisms. A water sample can appear clear yet still contain bacteria, so visual clarity alone does not demonstrate that sewage is safe for release.
Suggested skill connection — Science Practice 3: Scientific Experiments, Skill 3.A: Describe characteristics of a scientific investigation. A sewage-treatment investigation could compare equal volumes of treated sewage exposed to chlorine, ozone, or UV light. The independent variable is the disinfectant treatment, the dependent variable is the number of surviving bacteria, and untreated or non-disinfected sewage provides a comparison condition.
Worked example: comparing disinfectants
Suppose three equal wastewater samples begin with similar bacterial concentrations. After treatment, the chlorine sample contains a much smaller bacterial population, the ozone sample contains a similarly small population, and the UV sample also shows substantial bacterial reduction. The valid conclusion is that each treatment reduced bacterial abundance under the tested conditions; the data do not automatically prove that one disinfectant is best in every sewage-treatment plant.
Misconception check — “Disinfection removes all pollution.” Disinfection is aimed at microorganisms, especially bacteria. It does not mean that every nutrient, dissolved chemical, heavy metal, or solid has been removed; those pollutants require other treatment processes.
What LD50 measures
Lethal Dose 50% (LD50) is the dose of a chemical that kills $50%$ of an exposed population. The population may consist of laboratory organisms, plants, animals, or humans. LD50 is therefore a population-level statistic, not a prediction that one individual will die at exactly that dose.
$LD_{50}$ is the chemical dose associated with $50%$ mortality in the tested population.
The dose must be reported in the quantity appropriate to the problem. If the data describe milligrams of chemical per kilogram of body mass, the result should be reported as $\mathrm{mg,kg^{-1}}$. If the question asks for the total amount administered, a result in milligrams may be required instead. A number without its unit—or with the wrong type of quantity—can misrepresent the result.
Interpreting an LD50 curve
An LD50 curve is created by plotting chemical dose on the horizontal axis and the percentage of organisms that die on the vertical axis. As dose increases, mortality commonly increases. The LD50 is estimated at the dose corresponding to $50%$ mortality.
Imagine a classroom investigation using radish seeds. Students expose groups of seeds to several drug doses, then record the percentage that dies at each dose. The dose-response points are graphed, and a smooth or best-fit curve is used to estimate where the curve crosses $50%$ mortality.
For example, suppose the experimental results are:
| Dose | Mortality |
|---|---|
| $2\ \mathrm{mg,kg^{-1}}$ | $30%$ |
| $4\ \mathrm{mg,kg^{-1}}$ | $70%$ |
The $50%$ mortality point lies between the two measured doses. A simple linear interpolation gives
$$ LD_{50}=2+\left(\frac{50-30}{70-30}\right)(4-2) $$
Thus,
$$ LD_{50}=2+\left(\frac{20}{40}\right)(2)=3\ \mathrm{mg,kg^{-1}} $$
This is an estimate based on the experimental pattern, not a directly observed dose unless a tested group actually had exactly $50%$ mortality.
Misconception check — “A lower LD50 means a safer chemical.” The opposite is generally true: a lower LD50 means that a smaller dose produces $50%$ mortality in the tested population, indicating greater acute toxicity. However, LD50 alone does not describe every aspect of environmental risk, such as persistence, bioaccumulation, exposure frequency, or long-term effects.
Retrieval check
A sewage facility disinfects wastewater with UV light, while a radish-seed experiment finds $40%$ mortality at $3\ \mathrm{mg,kg^{-1}}$ and $60%$ mortality at $5\ \mathrm{mg,kg^{-1}}$. Name the purpose of UV disinfection, identify the approximate LD50, and state the unit that should be used if the problem reports dose per kilogram of organism.
The answers are: UV light is used to kill or inactivate bacteria; the estimated $LD_{50}$ is approximately $4\ \mathrm{mg,kg^{-1}}$; and the result should retain the dose-per-mass unit $\mathrm{mg,kg^{-1}}$. These applications exercise Science Practice 6: Mathematical Routines, Skill 6.B: Apply appropriate mathematical relationships to solve a problem, with work shown (e.g., dimensional analysis).
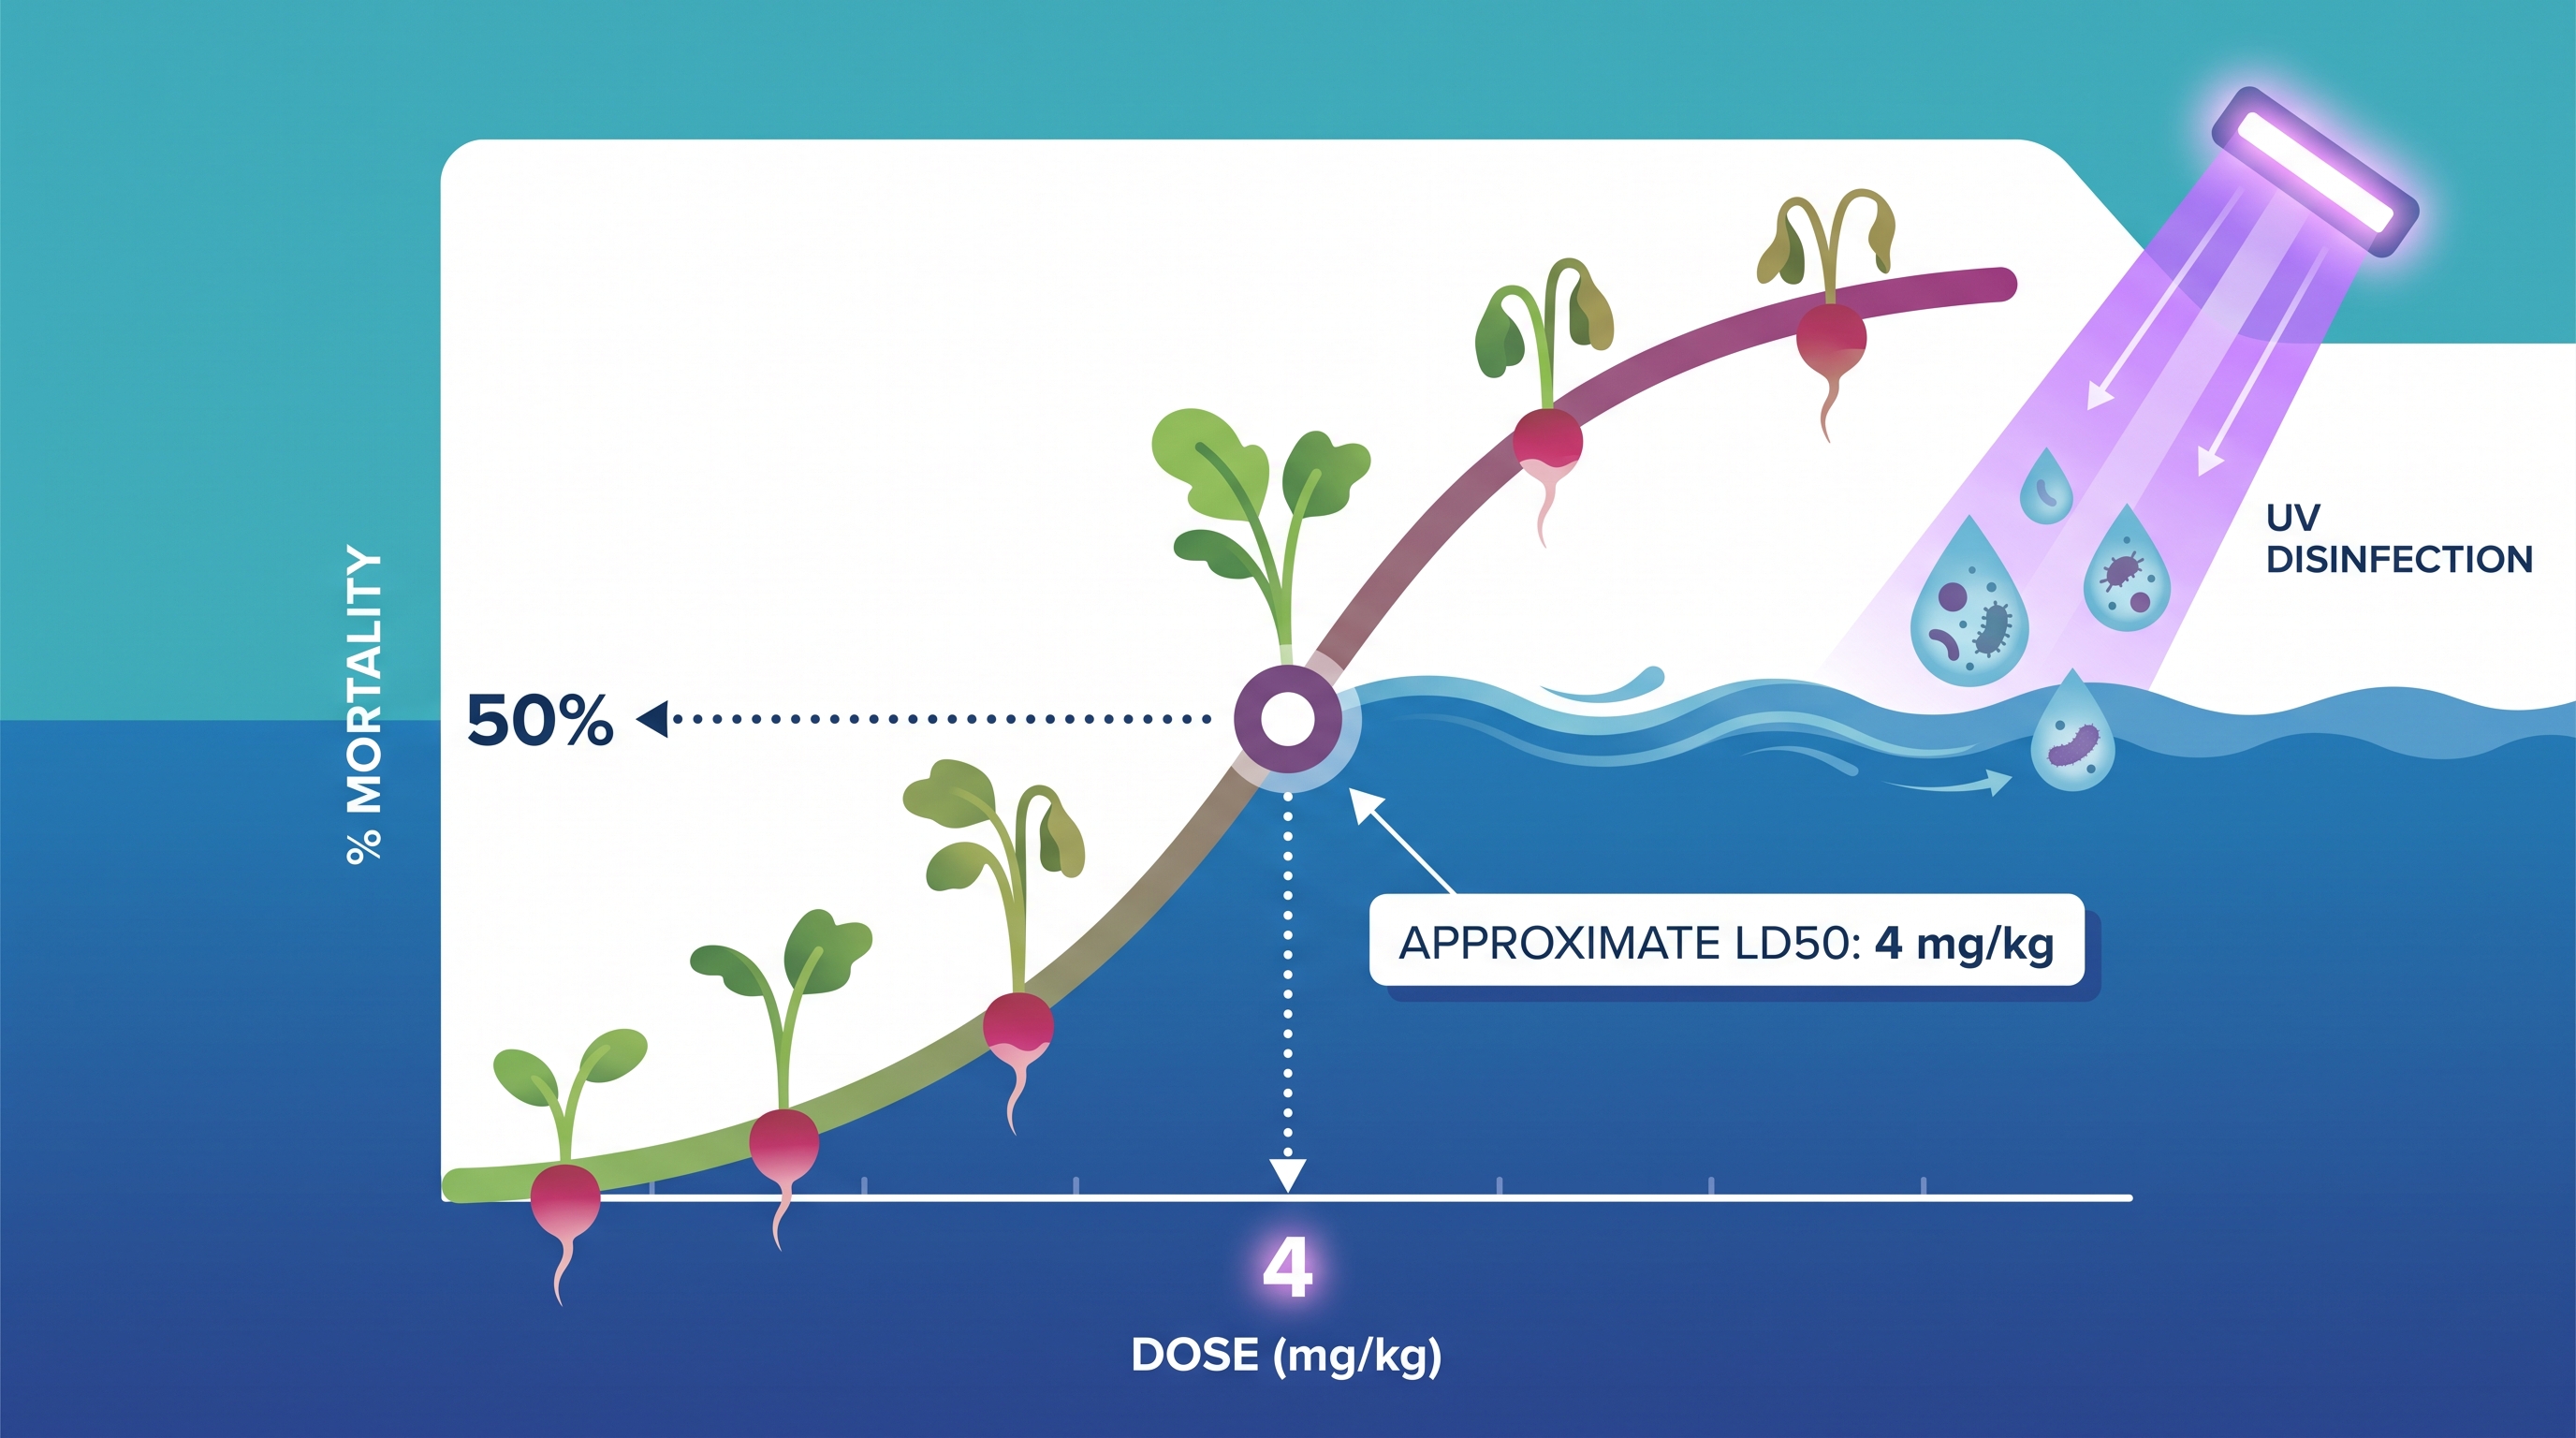
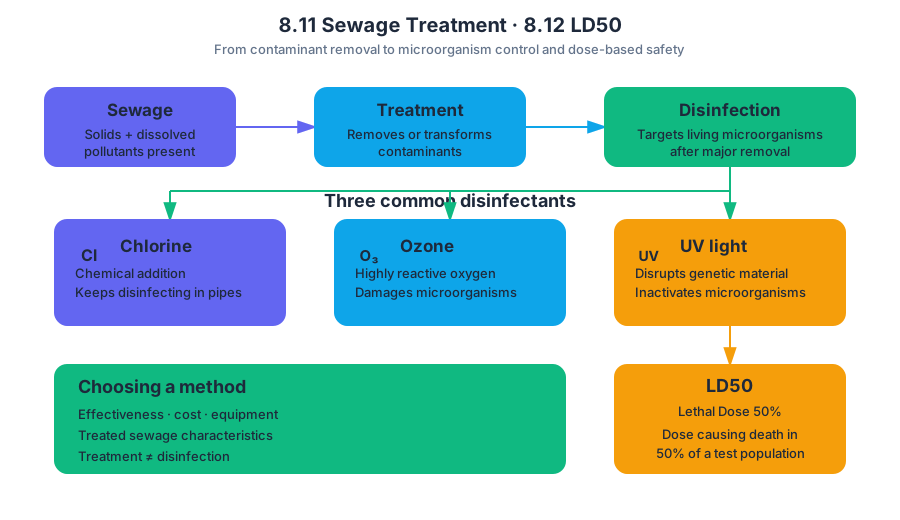
8.13 Dose Response Curve · 8.14 Pollution and Human Health
Key concepts: Dose-response curves · Evaluating dose-response curves · Dose of a toxin or drug · Organism effects from pollutants · Population mortality rate · Lethal dose 50% (LD₅₀) · Pollutants’ direct impacts on organism health · Pollutants’ indirect impacts on organism health · Pollution and human health · Aquatic and terrestrial pollution
A dose-response curve shows how an organism, or a population’s mortality rate, changes as exposure to a particular toxin or drug increases. The curve turns “more pollution” into a measurable question: How much exposure produces which biological effect?
8.13 Dose Response Curve · 8.14 Pollution and Human Health
A dose-response curve shows how an organism, or a population’s mortality rate, changes as exposure to a particular toxin or drug increases. The curve turns “more pollution” into a measurable question: How much exposure produces which biological effect?
Essential Knowledge EIN-3.B.1: A dose response curve describes the effect on an organism or mortality rate in a population based on the dose of a particular toxin or drug.
Reading the curve
A dose is the quantity of a substance received by an organism. Depending on the investigation, the horizontal axis may show concentration, mass of pollutant, or dose per unit body mass, such as $mg/kg$. The vertical axis may show an observable response—reduced growth, impaired reproduction, organ damage, or another health effect—or the mortality rate, the proportion of a population that dies:
$$ \text{Mortality rate}=\frac{\text{number of deaths}}{\text{initial population size}} $$
Always inspect the axes before interpreting the shape. A curve that rises with dose indicates increasing harm as exposure increases; a curve that falls may represent declining survival or another response variable whose meaning must be read from its label. A steep section means that a small increase in dose produces a large change in response, while a shallow section indicates a smaller change over that dose range.
The location of a curve also matters. If one species or pollutant produces a given response at a lower dose than another, it is more sensitive under those experimental conditions. However, the comparison is valid only when the studies use comparable organisms, exposure times, response measures, and units.
Evaluating dose-response data
The Learning Objective EIN-3.B, “Evaluate dose response curves,” requires more than identifying whether the line goes up or down. Under the suggested skill Data Analysis 5.E: Explain what the data implies or illustrates about environmental issues, a strong interpretation identifies the variables, describes the trend using evidence from the graph, and explains the environmental meaning of that trend.
For example, imagine a laboratory study exposing equal-sized groups of aquatic insects to a pesticide. Mortality is $5%$ at $1\ mg/L$, $20%$ at $3\ mg/L$, $50%$ at $7\ mg/L$, and $85%$ at $10\ mg/L$.
Worked interpretation: The independent variable is pesticide dose in $mg/L$; the dependent variable is mortality rate. Mortality increases as dose increases, with the sharpest increase between $3\ mg/L$ and $7\ mg/L$. At $7\ mg/L$, $50%$ mortality is directly observed in the data, so that measured dose corresponds to the previously established $LD_{50}$ for this specific species and testing condition. If $50%$ mortality were not directly measured, its value would need to be estimated by interpolation between nearby data points or read from the plotted curve.
The conclusion must remain appropriately narrow: the pesticide is associated with increased mortality in these insects under the tested conditions. The graph alone does not prove that the same dose will produce the same result in humans, birds, fish, or organisms exposed for a different length of time.
Pollution: direct and indirect effects
Pollutants can affect organisms directly, meaning the pollutant acts on the organism itself. Examples include a toxin damaging nervous tissue, particulate matter irritating the lungs, or a chemical interfering with reproduction. Direct effects may appear as illness, reduced growth, impaired behavior, lower fertility, or death.
Pollutants can also act indirectly by changing the ecosystem on which organisms depend. A pollutant may reduce oxygen in water, eliminate food sources, alter habitat, or disrupt a food web. The health of a species is therefore closely tied to the health of its ecosystem: an organism can be harmed even when it does not absorb a large dose of the original pollutant.
For instance, nutrient pollution entering a lake may stimulate algal growth. When algae die, decomposers consume the organic matter and use dissolved oxygen. Fish may then suffocate because of hypoxic water. The fish mortality is an indirect ecological effect of the nutrient pollutant, even though the nutrients did not necessarily poison the fish directly.
Misconception check
Misconception: “A dose-response curve gives one universal safe dose.” It does not. Responses vary among species and individuals, and depend on exposure route, duration, body size, chemical properties, and environmental conditions. A curve describes a tested relationship; it does not automatically establish harmlessness below the measured range or guarantee safety for every population.
Retrieval and interpretation check
A graph shows mortality rates of $10%$ at $2\ mg/L$, $35%$ at $5\ mg/L$, and $70%$ at $8\ mg/L. What trend should be reported, and how should the $LD_{50}$ be described? A complete answer states that mortality increases with dose and that $50%$ mortality lies between $5\ mg/L$ and $8\ mg/L$, so the $LD_{50}$ must be estimated from the curve or by interpolation rather than claimed as an exact measured value. Then identify one possible indirect pathway by which the pollutant could harm organisms: altered habitat, reduced food availability, or reduced dissolved oxygen.
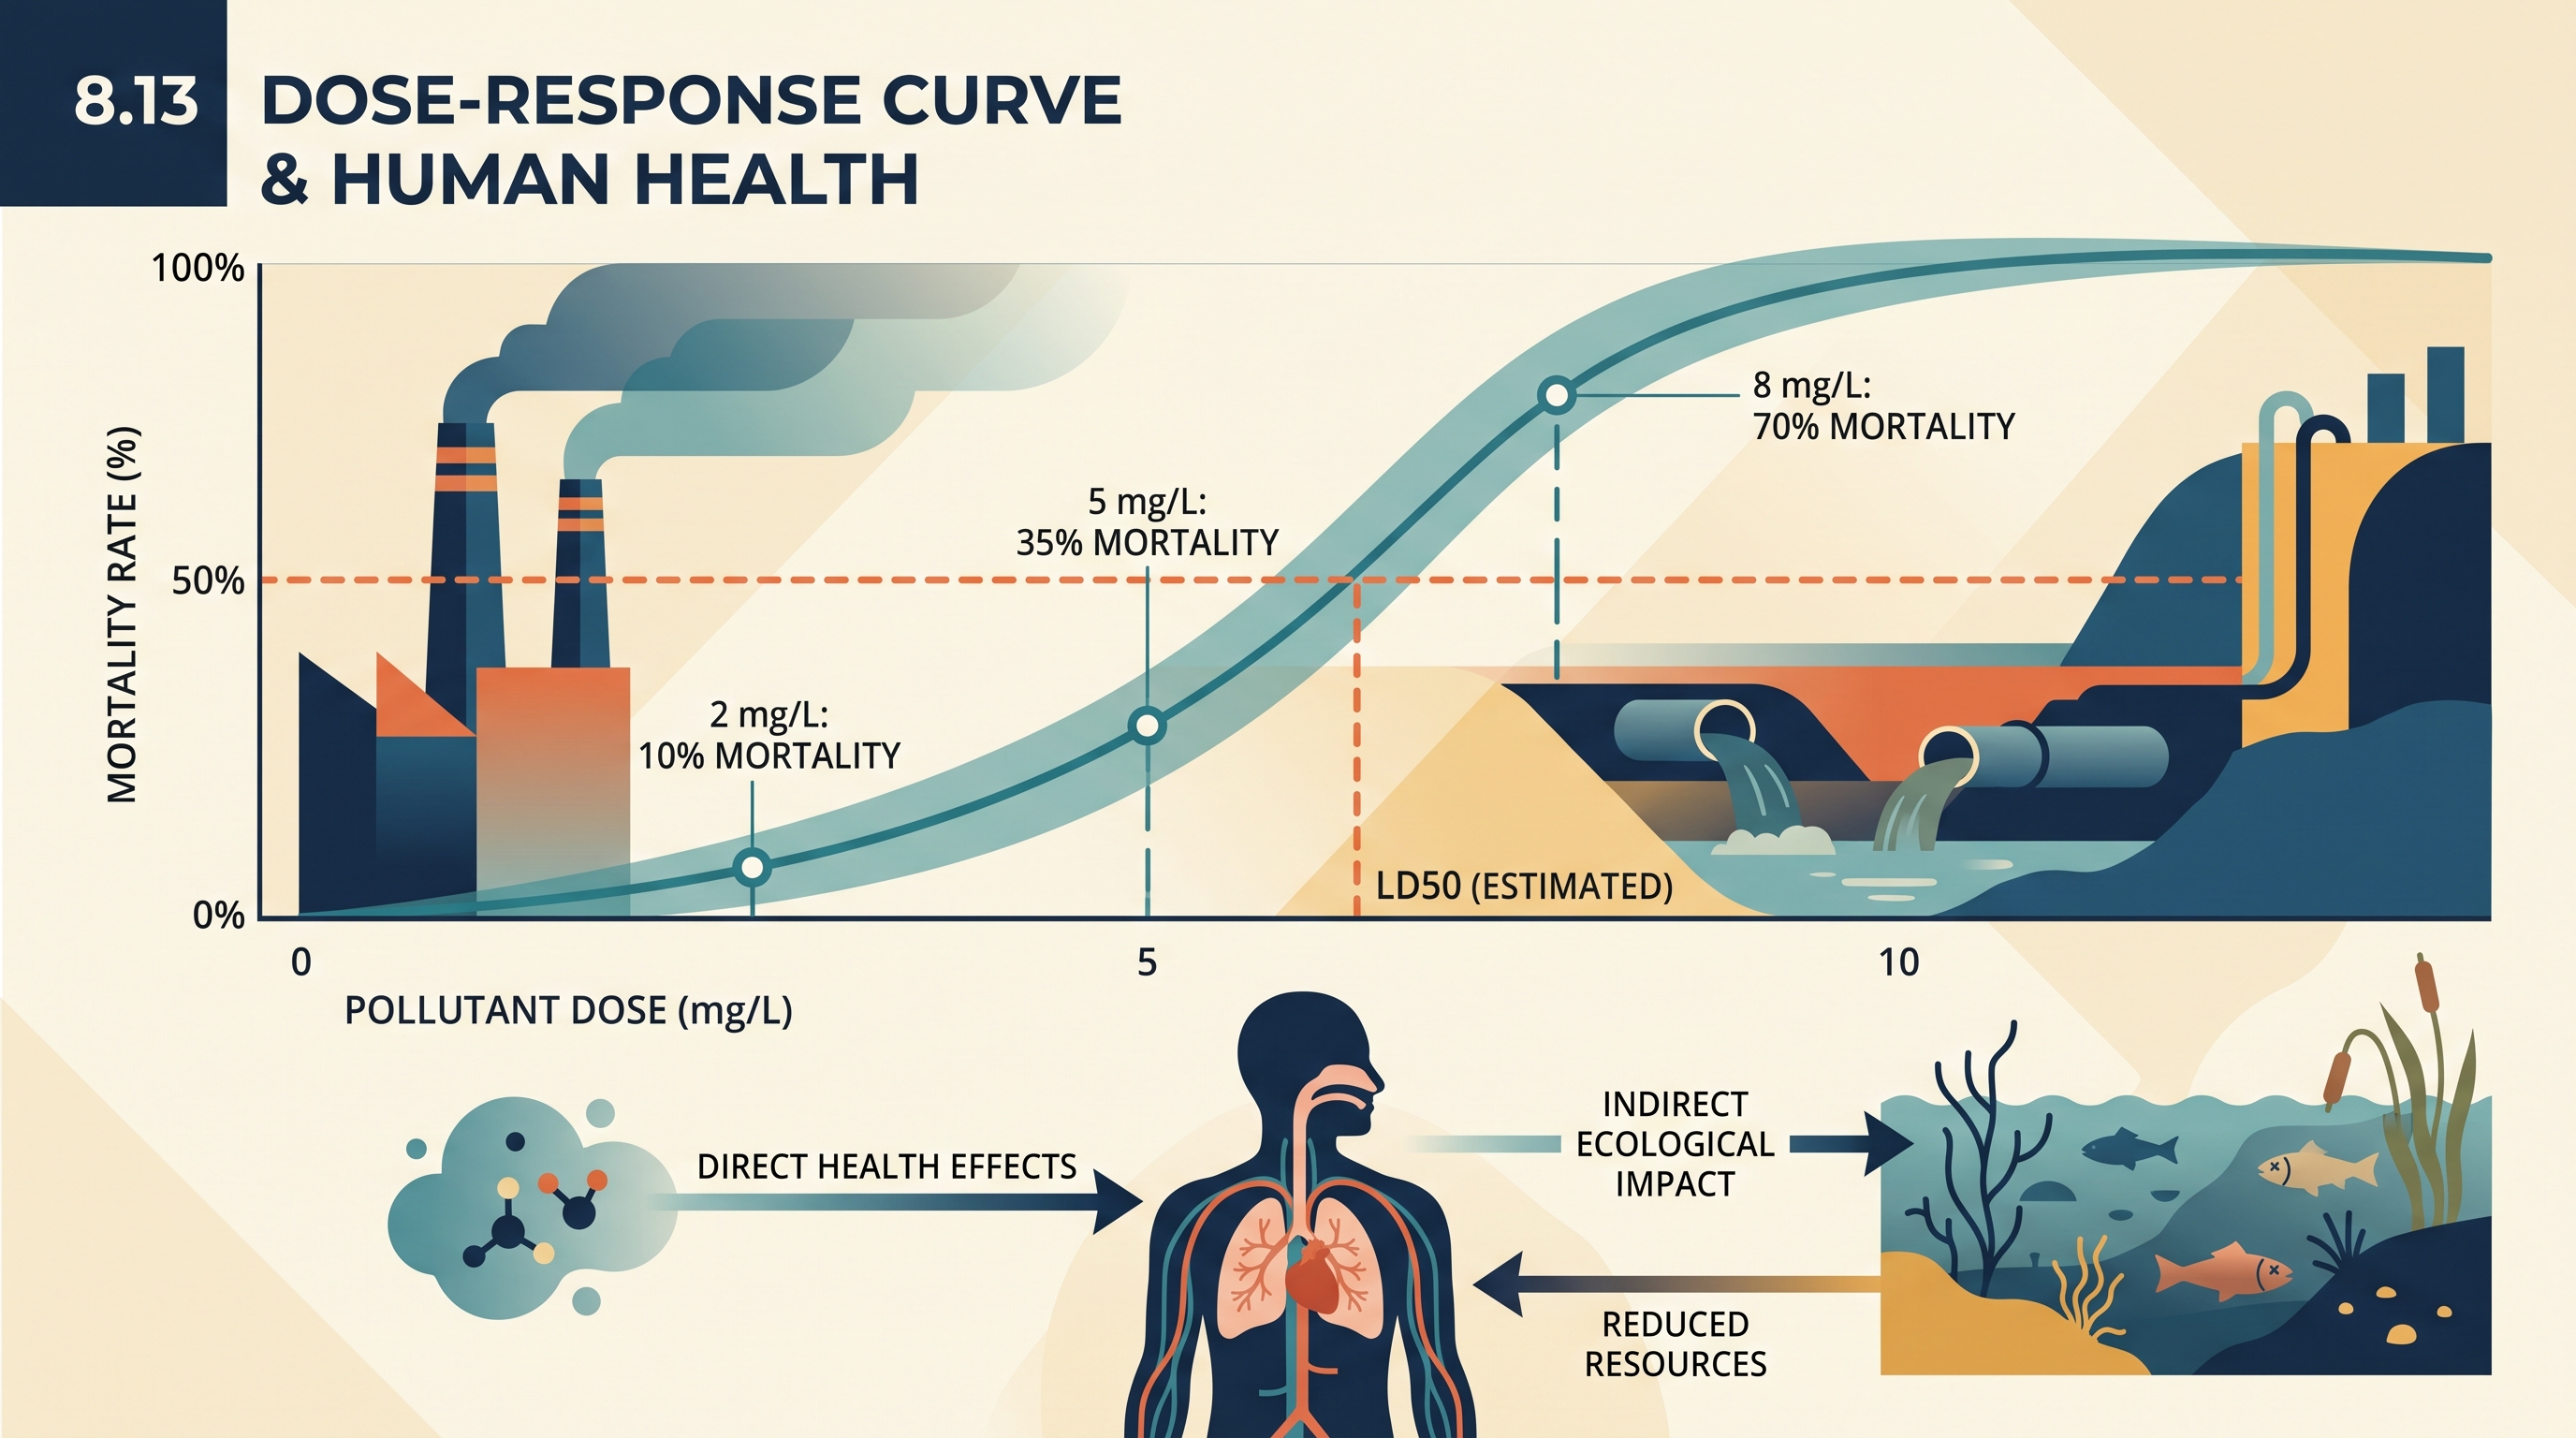
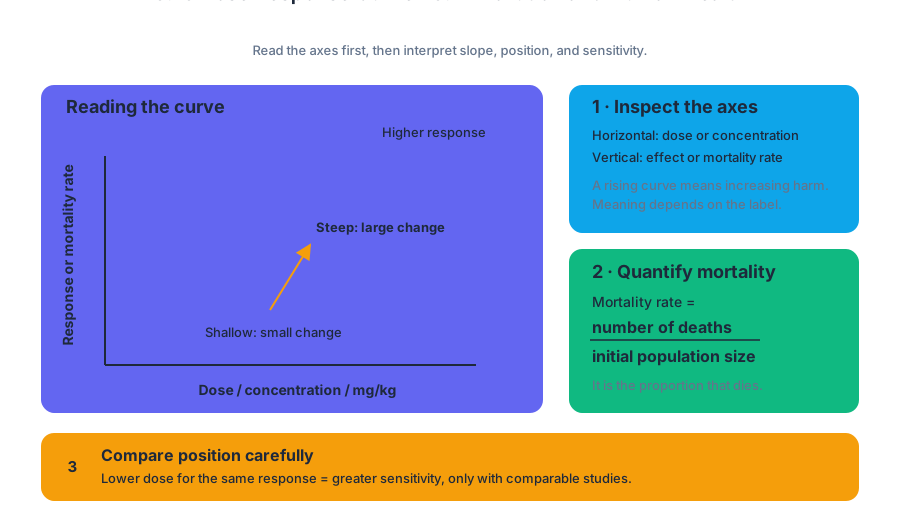
8.15 Pathogens and Infectious Diseases
Key concepts: Human pathogens · Infectious diseases · Pathogen cycling through the environment · Environmental transmission pathways · Direct and indirect health impacts of pollutants · Sanitary waste disposal and drinking-water quality · Disease emergence in new areas · Respiratory and direct-contact transmission · Vector-borne transmission · Plague
A human pathogen is a disease-causing organism or infectious agent that can move among hosts, survive in environmental reservoirs, and exploit opportunities created by climate, pollution, or inadequate sanitation.
8.15 Pathogens and Infectious Diseases
A human pathogen is a disease-causing organism or infectious agent that can move among hosts, survive in environmental reservoirs, and exploit opportunities created by climate, pollution, or inadequate sanitation. An infectious disease results when that pathogen enters a host, reproduces or disrupts normal function, and spreads through a transmission pathway.
Enduring Understanding EIN-3: Pollutants can have both direct and indirect impacts on the health of organisms, including humans.
Learning Objective EIN-3.D: Explain human pathogens and their cycling through the environment.
How pathogens cycle through the environment
Pathogens do not exist only inside visibly sick people. They may cycle among humans, other organisms, soil, water, air, food, and contaminated materials. A pathogen’s environmental cycle therefore includes three linked questions: where it persists, how it moves, and how it enters a new host.
A useful model is:
reservoir → release → environmental transport → exposure → infection → new reservoir
For example, human waste can introduce pathogens into surface water. If that water contaminates drinking supplies, food, or hands, another person may ingest the pathogen. The pathogen has therefore moved through an environmental pathway rather than passing only through direct person-to-person contact.
EIN-3.D.1–EIN-3.D.5 organize the required explanation of pathogen cycling, including pathogen persistence, adaptation, climate-related geographic spread, sanitation conditions, and the specific example of plague. Pathogens can occur even in places that appear sanitary, and some evolve in ways that allow them to exploit new hosts or transmission opportunities.
Environmental transmission pathways
Different pathogens use different routes. Respiratory transmission occurs when infectious particles move through the air or respiratory droplets; direct-contact transmission occurs through physical contact. Vector-borne transmission uses another organism—often an insect—to carry the pathogen from one host to another. Zoonotic transmission involves movement from an infected nonhuman animal to humans.
| Disease | Pathogen type | Main environmental or contact pathway |
|---|---|---|
| Tuberculosis | Bacterial | Respiratory or direct contact |
| SARS | Viral | Respiratory or direct contact |
| Malaria | Parasitic | Bites from infected mosquitoes |
| West Nile virus | Viral | Bites from infected mosquitoes |
| Zika | Viral | Bites from infected mosquitoes |
| Plague | Bacterial | Vector bites or contact with contaminated fluids and tissues |
The distinction between pathogen type and transmission pathway matters. Bacterial, viral, and parasitic describe what causes the disease; respiratory, direct-contact, mosquito-borne, or tissue-contact descriptions explain how it spreads. A virus is not automatically airborne, and a bacterium is not automatically waterborne.
Climate and geographic expansion
Diseases may spread into areas where they were not previously known to occur. As equatorial-type climate zones spread northward, warmer conditions may allow pathogens or their vectors—such as mosquitoes—to survive in subtropical or temperate areas. Climate does not create every disease by itself, but it can change whether a suitable host, vector, temperature range, and habitat exist in a particular location.
Worked example: Suppose a mosquito species cannot complete its life cycle in a cool region. If average temperatures rise, the mosquito may survive there for a longer season. If an infected person or animal introduces a pathogen, the mosquito can acquire it and transmit it to additional hosts. The disease’s geographic range has expanded because climate conditions altered the transmission pathway.
Misconception check — “A disease cannot occur in a new region unless the pathogen evolves there.”
A pathogen may already exist elsewhere. A change in temperature, precipitation, host distribution, or vector habitat can allow it to spread into a region where it was previously absent or uncommon.
Pollution, sanitation, and infectious disease
Pollutants can harm organisms directly, through immediate exposure or physiological damage, and indirectly, by changing environmental conditions that increase disease transmission. For instance, pollution may damage an organism’s health or weaken its defenses, while contaminated water and poorly managed waste may create reservoirs through which pathogens reach new hosts.
Poverty-stricken, low-income areas may lack sanitary waste disposal and have contaminated drinking-water supplies. These conditions create havens and opportunities for infectious disease because human waste, pathogens, and drinking water can come into contact. Improving sewage treatment, protecting water sources, and safely disposing of waste interrupt the pathogen cycle before infection occurs.
Plague illustrates several pathways at once. It is a bacterial disease carried by organisms infected with plague bacteria. Humans may acquire it through the bite of an infected organism or through contact with contaminated fluids or tissues. The same disease can therefore involve a vector pathway and a direct environmental-contact pathway.
AP skill: interpreting visual representations
Suggested Skill 2.B — Visual Representations: Explain relationships between different characteristics of environmental concepts, processes, or models represented visually: In theoretical contexts; In applied contexts. On a map, flowchart, or disease-cycle diagram, do more than identify labels: explain the relationship between them. For example, connect warmer conditions to expanded mosquito habitat, expanded habitat to increased vector contact, and increased contact to greater disease-transmission opportunity.
A strong visual explanation names both the mechanism and the direction of change: “Higher temperature permits mosquitoes to occupy a larger area, increasing the number of potential host-vector interactions.” That is stronger than simply writing “climate change increases malaria.”
Retrieval check
A town’s untreated sewage enters a river used for drinking water, while warmer temperatures extend the local mosquito season. Identify one pollutant-related indirect health impact and one mosquito-borne disease from the table. Then state how each pathway could be interrupted.
Answer: Untreated sewage indirectly increases infectious-disease risk by contaminating drinking water and enabling pathogen transmission; sanitary waste disposal and safe drinking-water treatment interrupt that route. Malaria, West Nile virus, or Zika could increase when mosquito habitat and season length expand; reducing standing-water habitat and limiting mosquito-human contact interrupts that vector pathway.
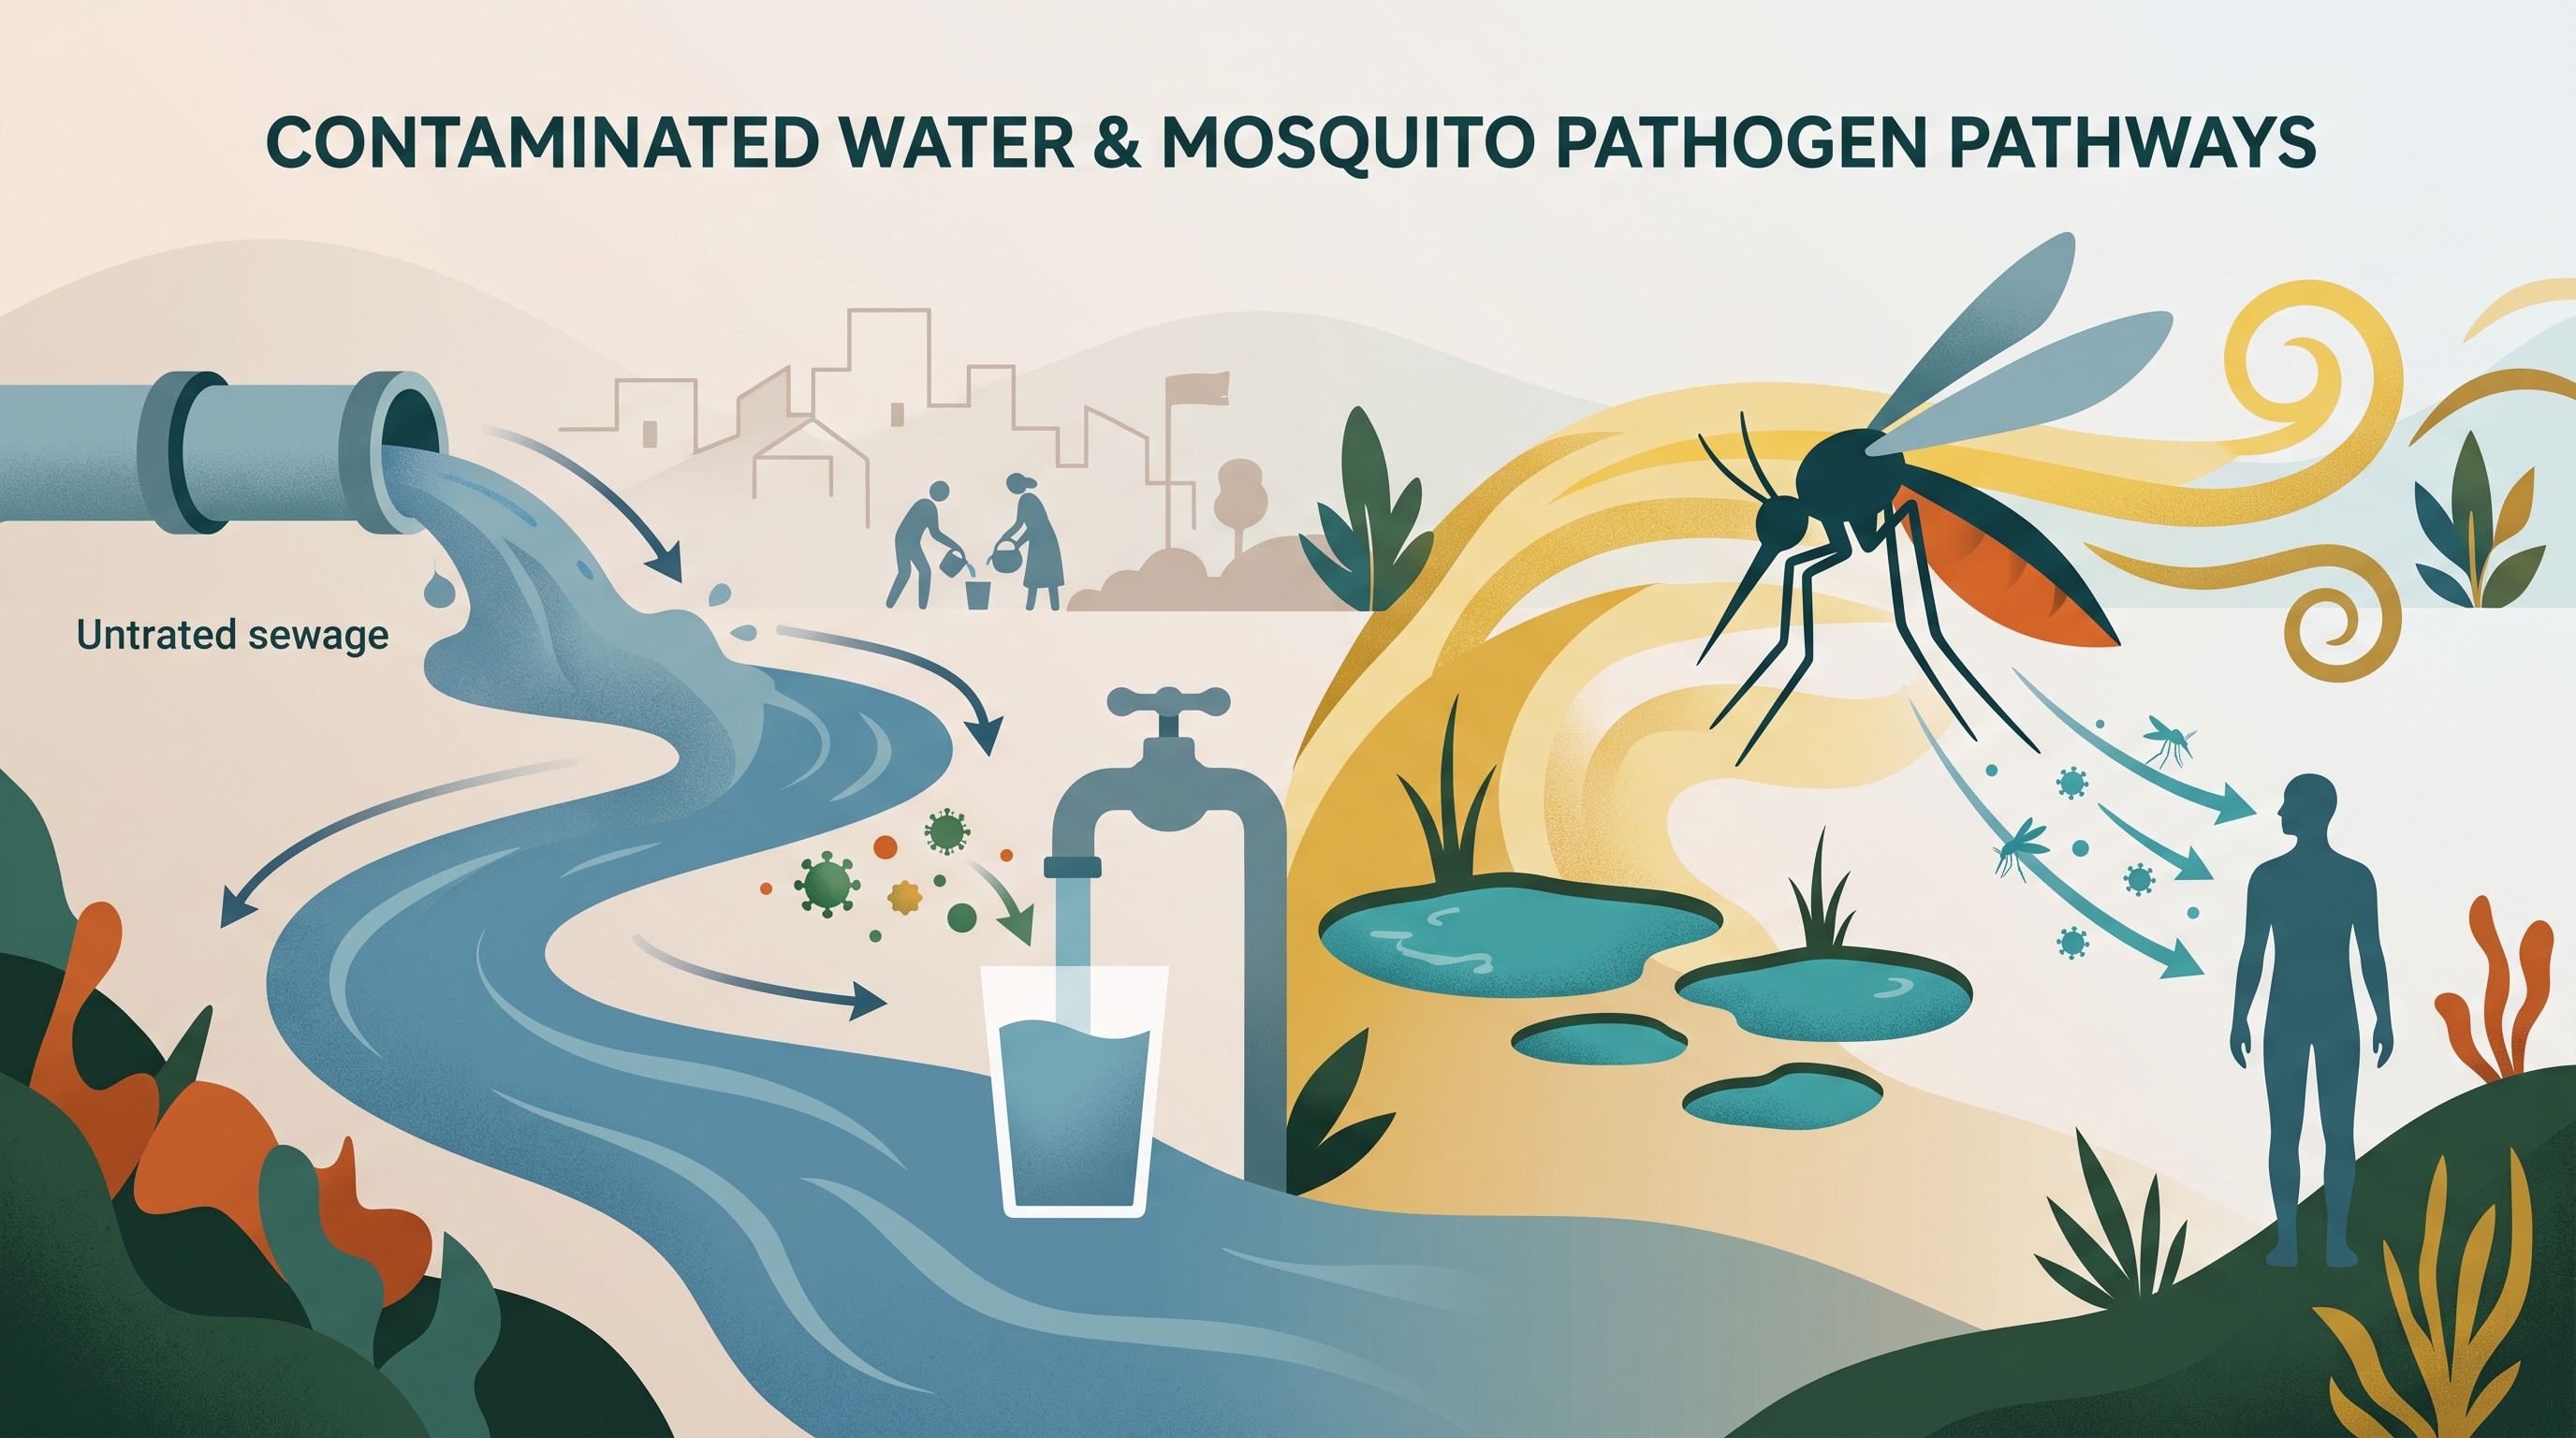
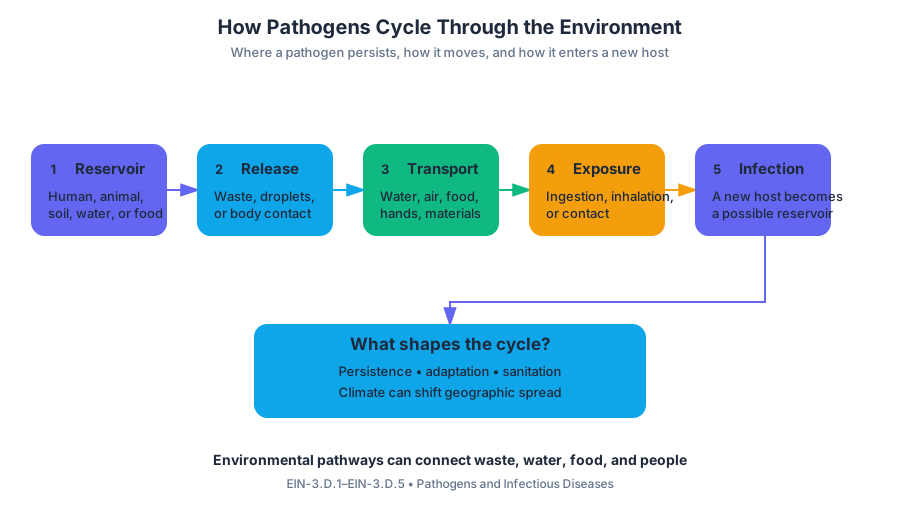
9.1 Stratospheric Ozone Depletion · 9.2 Reducing Ozone Depletion
Key concepts: Stratospheric ozone depletion · Anthropogenic causes of ozone depletion · Chlorofluorocarbons (CFCs) · Natural factors contributing to ozone depletion · Melting ice crystals in the atmosphere · Antarctic spring ozone depletion · Ultraviolet (UV) radiation · Human health effects of increased UV exposure · Skin cancer · Cataracts
A thin layer of ozone high above Earth acts like a planetary sunscreen: when it becomes thinner, more ultraviolet radiation reaches the surface, increasing risks such as skin cancer and cataracts.
9.1 Stratospheric Ozone Depletion · 9.2 Reducing Ozone Depletion
A thin layer of ozone high above Earth acts like a planetary sunscreen: when it becomes thinner, more ultraviolet radiation reaches the surface, increasing risks such as skin cancer and cataracts. The central question is therefore not whether ozone is “good” or “bad,” but where it is located: ozone in the stratosphere protects life, while ozone near the ground is an air pollutant.
Enduring Understanding STB-4: Local and regional human activities can have impacts at the global level.
The protective role of stratospheric ozone
Stratospheric ozone is ozone, $O_3$, concentrated in the stratosphere, a layer of the atmosphere above the troposphere. It absorbs much of the Sun’s biologically damaging ultraviolet, or UV, radiation before that radiation reaches Earth’s surface.
The ozone layer is therefore important to both the evolution of life on Earth and the continued health and survival of organisms. Reduced ozone means reduced filtering: the surface receives more UV radiation, which can damage cells and genetic material.
How ozone depletion occurs
Ozone depletion is a reduction in the amount or concentration of stratospheric ozone. The CED identifies both human-caused and natural contributors.
Anthropogenic causes: CFCs
Chlorofluorocarbons, or CFCs, are human-made chemicals historically used in products such as refrigeration systems and aerosol propellants. After CFC molecules rise into the stratosphere, ultraviolet radiation can break them apart and release chlorine. Chlorine can participate in chemical reactions that destroy ozone molecules, allowing more UV radiation to pass through.
A useful cause-and-effect chain is:
$$ \text{CFC release} \rightarrow \text{stratospheric transport} \rightarrow \text{UV breakdown} \rightarrow \text{ozone destruction} \rightarrow \text{increased surface UV} $$
Misconception check — “CFCs immediately destroy ozone at ground level.” CFCs are relatively stable near Earth’s surface; their major ozone-depleting effect occurs after they reach the stratosphere and are altered by ultraviolet radiation. Also, ozone depletion is distinct from the greenhouse effect: both involve atmospheric chemistry, but they describe different mechanisms and environmental consequences.
Natural factors: Antarctic spring
Natural processes can also contribute to ozone depletion. At the beginning of the Antarctic spring, ice crystals in the atmosphere melt. These crystals and the chemical conditions surrounding them can support reactions that remove stratospheric ozone.
The Antarctic pattern is especially important because the seasonal return of sunlight interacts with cold atmospheric conditions and accumulated reactive chemicals. The result can be a pronounced springtime reduction in ozone over Antarctica.
From atmospheric change to human health
The environmental consequence is a direct radiation pathway:
$$ \downarrow \text{stratospheric ozone} \rightarrow \uparrow \text{UV radiation at Earth’s surface} $$
Greater UV exposure can increase the risk of skin cancer in humans. It can also contribute to cataracts, a clouding of the eye’s lens that interferes with vision.
| Atmospheric change | Surface consequence | Human-health concern |
|---|---|---|
| Less stratospheric ozone | More UV radiation reaches Earth | Skin cancer and cataracts |
9.2 Reducing ozone depletion
Reducing ozone depletion requires preventing ozone-depleting substances from entering the atmosphere and replacing them with safer alternatives. Because CFCs can circulate through the atmosphere and affect ozone far from their original release, effective action must extend beyond one city or country.
A major policy example is the Montreal Protocol, an international agreement designed to reduce and phase out substances that damage stratospheric ozone. Its importance illustrates the STB-4 idea: a local industrial activity can create a global atmospheric problem, while coordinated international regulation can address it.
Evidence-based solution reasoning
When evaluating a proposed action, connect the policy to the mechanism:
- Reduce production or release of CFCs.
- Limit the amount of chlorine-containing material reaching the stratosphere.
- Reduce chemical destruction of ozone.
- Increase protection from UV radiation.
- Lower risks of skin cancer and cataracts.
This reasoning supports Science Practice 1.A, “Describe environmental concepts and processes,” and the topic skill pairing STB-4.A, especially STB-4.A.3: a decrease in stratospheric ozone increases the UV rays reaching Earth’s surface, and exposure can lead to skin cancer and cataracts. A strong environmental-solutions response should name the action, explain its mechanism, and identify the resulting benefit rather than merely calling a policy “helpful.”
Worked example
A country proposes replacing CFC-based refrigeration equipment with systems that do not release ozone-depleting chemicals.
Reasoning: The replacement reduces anthropogenic emissions at the source. With fewer CFCs transported into the stratosphere, less chlorine is released by UV radiation, so less ozone is destroyed. A thicker or recovering ozone layer absorbs more UV radiation, reducing the exposure pathway associated with skin cancer and cataracts.
Retrieval check
A student says, “Because ozone depletion increases UV radiation, the best solution is to tell people to wear sunglasses.” What is incomplete about this answer? It addresses individual protection, but it does not reduce the cause. A stronger solution targets CFC emissions through safer technology and international controls such as the Montreal Protocol.
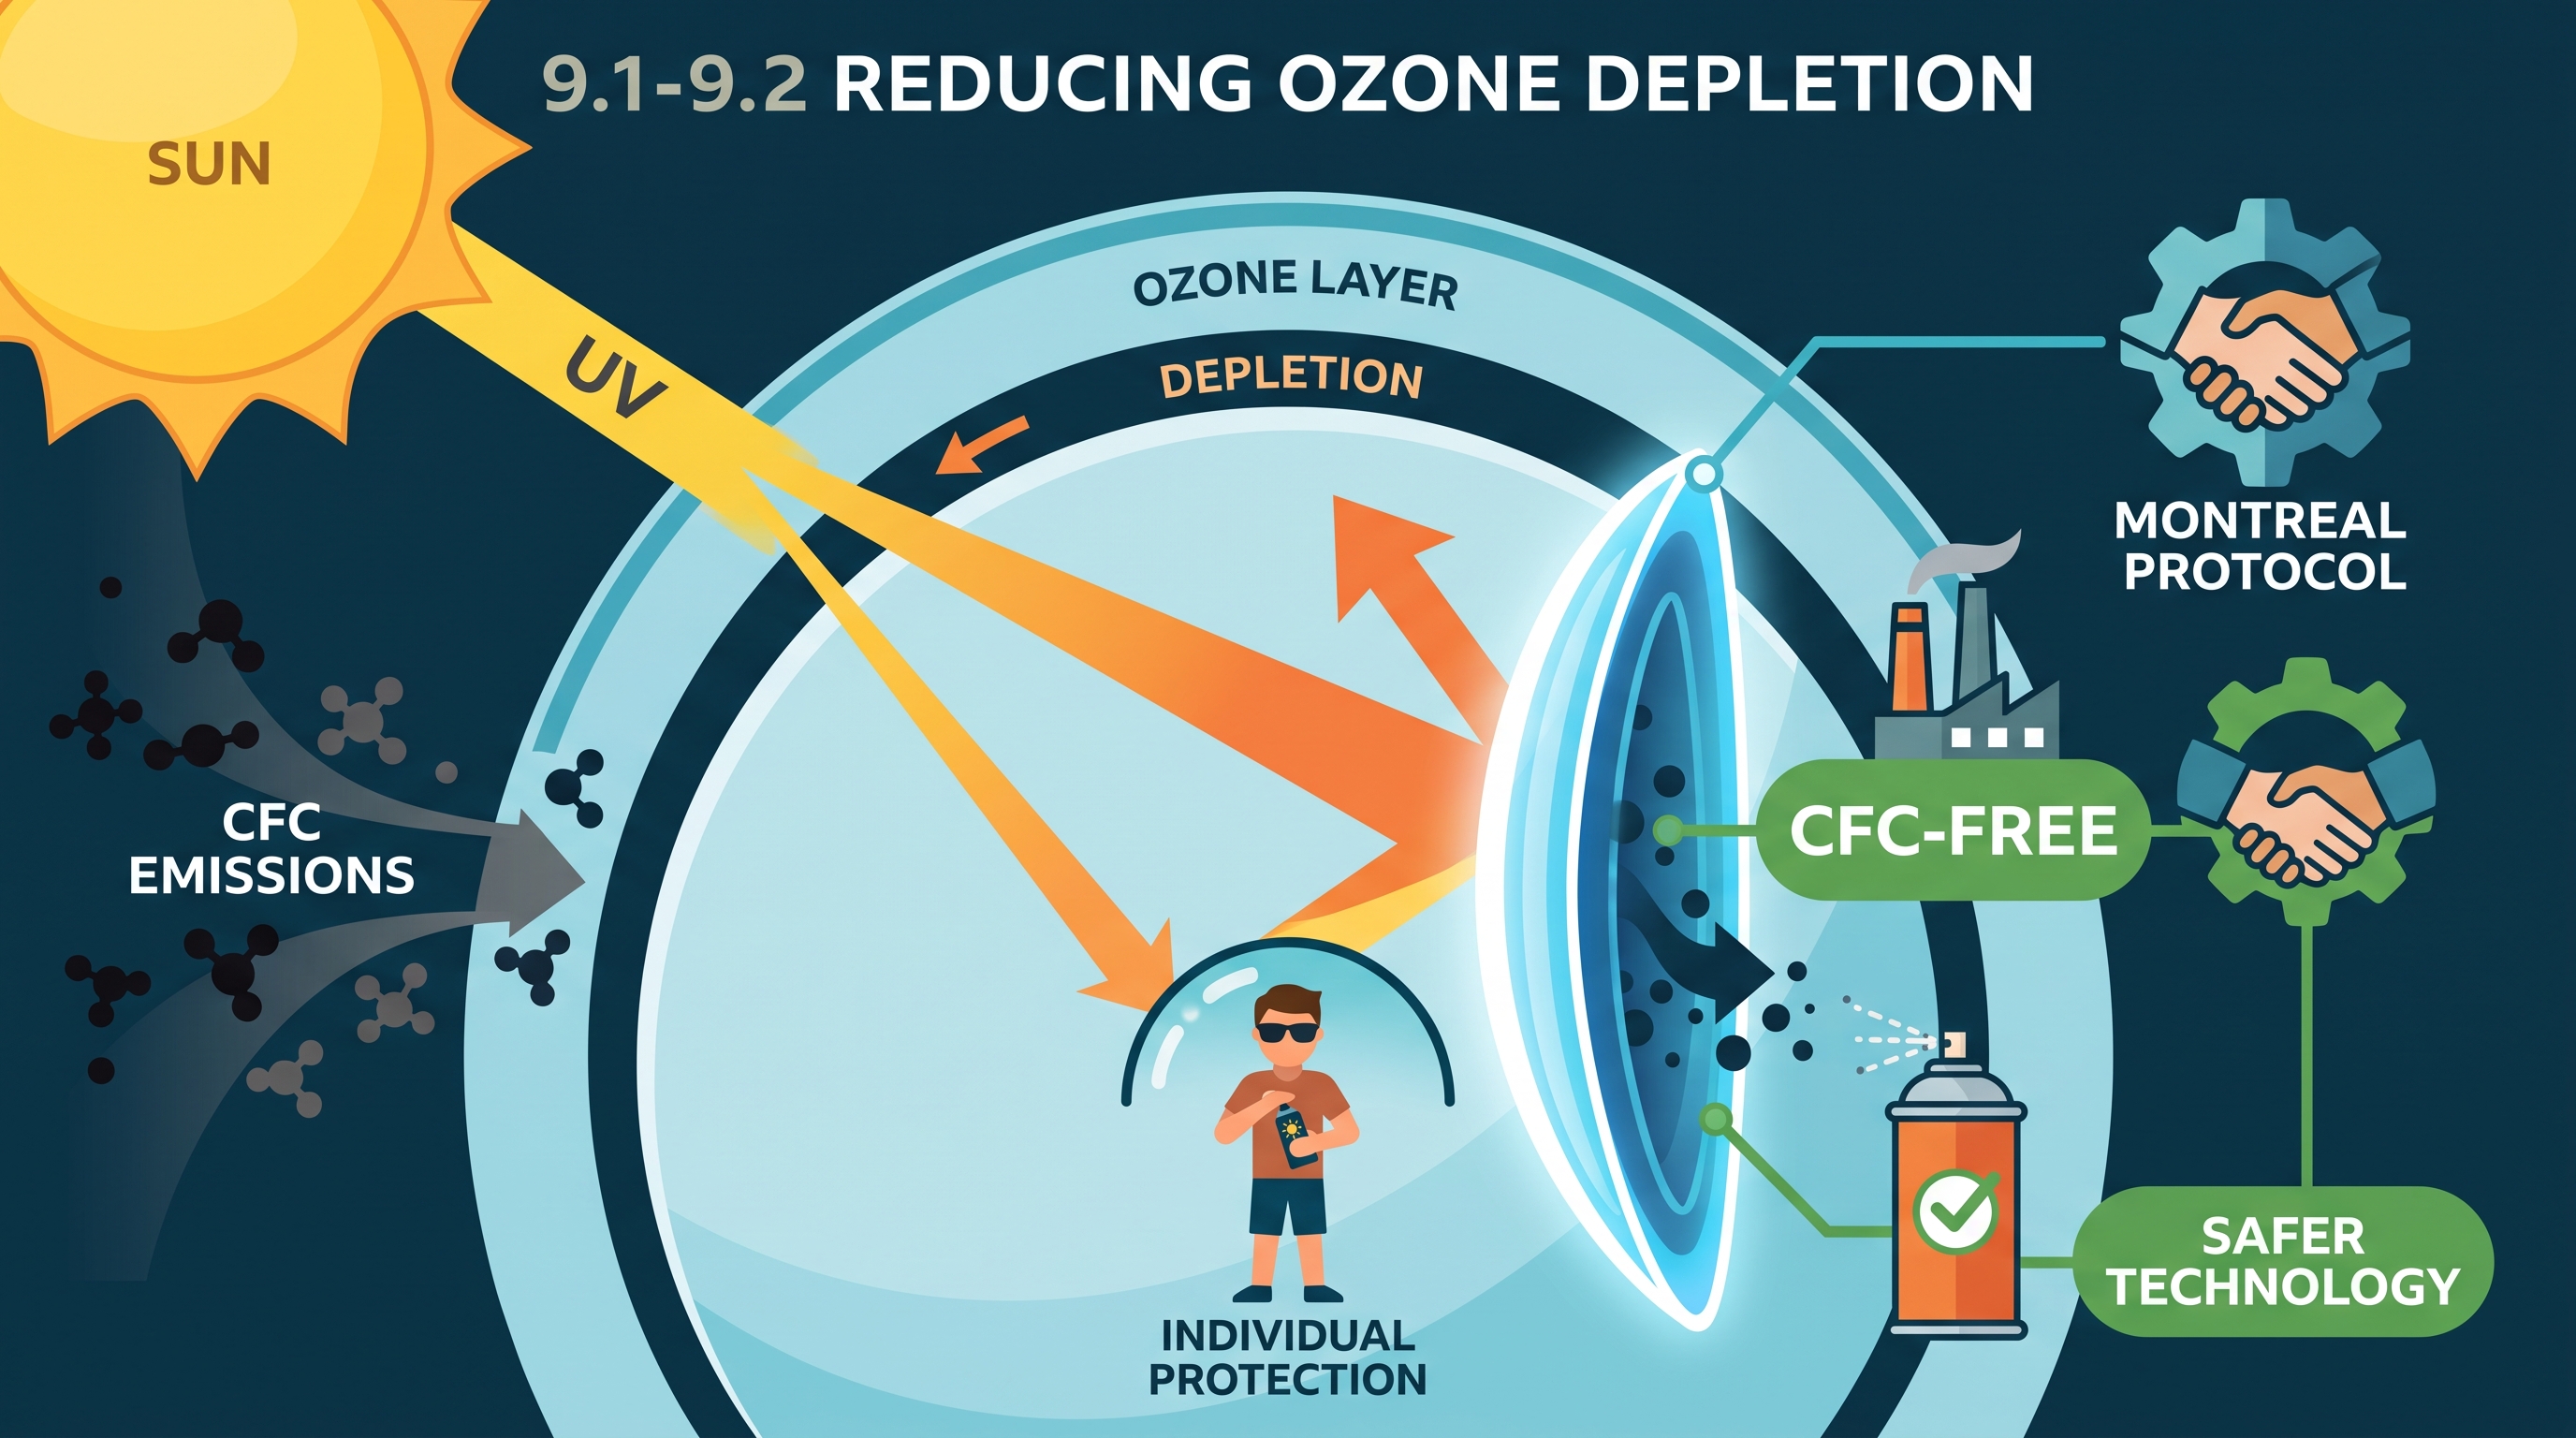
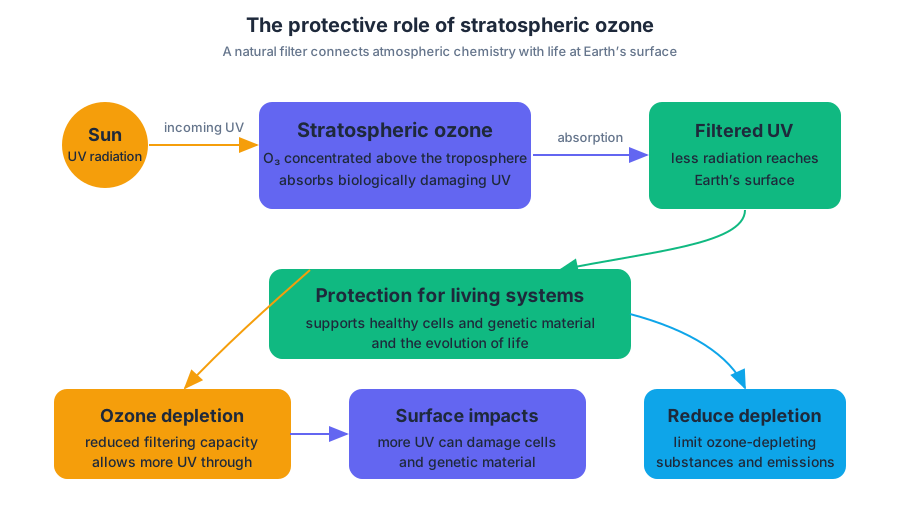
9.3 The Greenhouse Effect · 9.4 Increases in Greenhouse Gases
Key concepts: The greenhouse effect · Greenhouse gases · Increases in greenhouse-gas concentrations · Global climate change · Global warming potential (GWP) · Atmospheric residence time · Antarctic ice-core proxy data · Relationship between atmospheric carbon dioxide and global temperature · Climate-change feedbacks · Melting sea ice and thawing tundra
Earth’s atmosphere stays warm because certain gases absorb and re-emit outgoing infrared radiation, creating the greenhouse effect. Without this natural process, Earth’s surface would be too cold for life as we know it; the problem arises when human activities increase the concentration of greenhouse gases and…
9.3 The Greenhouse Effect · 9.4 Increases in Greenhouse Gases
Earth’s atmosphere stays warm because certain gases absorb and re-emit outgoing infrared radiation, creating the greenhouse effect. Without this natural process, Earth’s surface would be too cold for life as we know it; the problem arises when human activities increase the concentration of greenhouse gases and disturb the atmosphere’s energy balance.
The natural greenhouse effect
Sunlight passes through the atmosphere and warms Earth’s surface. The surface then releases energy as infrared radiation. Greenhouse gases absorb some of that outgoing energy and re-emit it in different directions, including back toward the surface.
STB-4.C.3: The greenhouse effect results in the surface temperature necessary for life on Earth to exist.
The greenhouse effect is therefore not itself pollution. A useful analogy is a blanket: a blanket is necessary to prevent excessive heat loss, but adding many more blankets makes the body too warm. Similarly, excess greenhouse gases strengthen the natural greenhouse effect and contribute to global climate change, meaning long-term changes in Earth’s climate patterns.
Principal greenhouse gases
STB-4.C requires identification of the greenhouse gases. The principal gases are carbon dioxide, methane, water vapor, nitrous oxide, and chlorofluorocarbons, or CFCs.
| Greenhouse gas | Important human sources | Key climate concept |
|---|---|---|
| Carbon dioxide, $CO_2$ | Fossil-fuel combustion, deforestation, cement production | Reference gas with GWP $=1$ |
| Methane, $CH_4$ | Livestock, landfills, rice cultivation, fossil-fuel extraction | High potency but short atmospheric residence time |
| Nitrous oxide, $N_2O$ | Agricultural soils and nitrogen fertilizers | Higher GWP than methane |
| CFCs | Older refrigerants and industrial compounds | Highest GWP among the gases listed |
| Water vapor, $H_2O$ | Evaporation and transpiration; mainly natural sources | Greenhouse gas with a short residence time |
STB-4.C.1 identifies the principal greenhouse gases, including carbon dioxide, methane, water vapor, nitrous oxide, and CFCs. Water vapor is a greenhouse gas, but STB-4.C.2 emphasizes that its short atmospheric residence time means it does not contribute significantly to long-term global climate change compared with longer-lived increases in gases such as carbon dioxide.
Global warming potential and residence time
Global warming potential (GWP) compares how strongly a greenhouse gas contributes to warming relative to carbon dioxide over a specified time period. Carbon dioxide is assigned a GWP of $1$, making it the reference point.
STB-4.D.1 establishes the required potency ranking: CFCs have the highest GWP, followed by nitrous oxide, then methane, with carbon dioxide as the reference gas.
A gas’s atmospheric residence time is how long it remains in the atmosphere before chemical reactions, biological uptake, or other processes remove it. GWP and residence time are related but not identical: a gas can be extremely potent while present in relatively small quantities, whereas a less potent gas can have a major long-term effect if it accumulates and remains for a long time.
Misconception check — “The most powerful gas must cause the most total warming.” Not necessarily. Climate impact depends on potency, atmospheric concentration, residence time, and the amount released. Methane has a shorter residence time than carbon dioxide, but large methane emissions can still produce substantial warming.
Ice cores as evidence of past climate
Antarctic ice cores provide proxy evidence—indirect evidence used to reconstruct past conditions. As snow accumulates and becomes compressed into ice, tiny bubbles of ancient atmosphere remain trapped inside. Scientists can measure past carbon dioxide concentrations in those bubbles, while chemical properties of the surrounding ice provide information about past temperature conditions.
Across the historical record preserved in Antarctic ice, atmospheric carbon dioxide levels and global temperature show a general relationship: periods with higher atmospheric carbon dioxide tend to correspond to higher temperatures, while periods with lower carbon dioxide tend to correspond to lower temperatures. The correlation does not mean that carbon dioxide is the only climate influence, but it is important evidence that atmospheric composition and temperature are connected.
Feedback from thawing landscapes
Warming can trigger processes that add still more greenhouse gases to the atmosphere. Melting sea ice changes Earth’s reflective surface, while thawing tundra can expose previously frozen organic matter to decomposition. That decomposition can release carbon dioxide and methane, creating a reinforcing feedback: warming promotes greenhouse-gas release, which can promote additional warming.
A local activity can therefore produce a global consequence. For example, methane released from a regional landfill or fossil-fuel operation mixes through the atmosphere and contributes to climate change beyond the location where it was emitted. This is the meaning of the required connection that local and regional human activities can have impacts at the global level.
Worked reasoning: an evidence chain
Scenario: A region expands natural-gas extraction, and monitoring shows increased methane emissions. Explain why the activity can affect global climate.
- The extraction activity increases atmospheric $CH_4$ concentration.
- Methane is a greenhouse gas, so it absorbs outgoing infrared radiation.
- Methane has a higher GWP than carbon dioxide, although its atmospheric residence time is relatively short.
- The enhanced greenhouse effect contributes to global climate change.
- Because methane mixes through the atmosphere, a regional emission can produce a global impact.
AP Science Practice 1.B — Concept Explanation: A strong explanation connects each cause to its mechanism and consequence. Do not merely write “methane causes warming”; identify methane as a greenhouse gas, explain its role in absorbing infrared radiation, and connect increased concentration to an enhanced greenhouse effect.
Retrieval check
Why can methane contribute strongly to climate change even though it has a short atmospheric residence time, and why is water vapor treated differently in this context? A complete answer should mention methane’s relatively high GWP, its emission-driven increase, and water vapor’s short residence time.
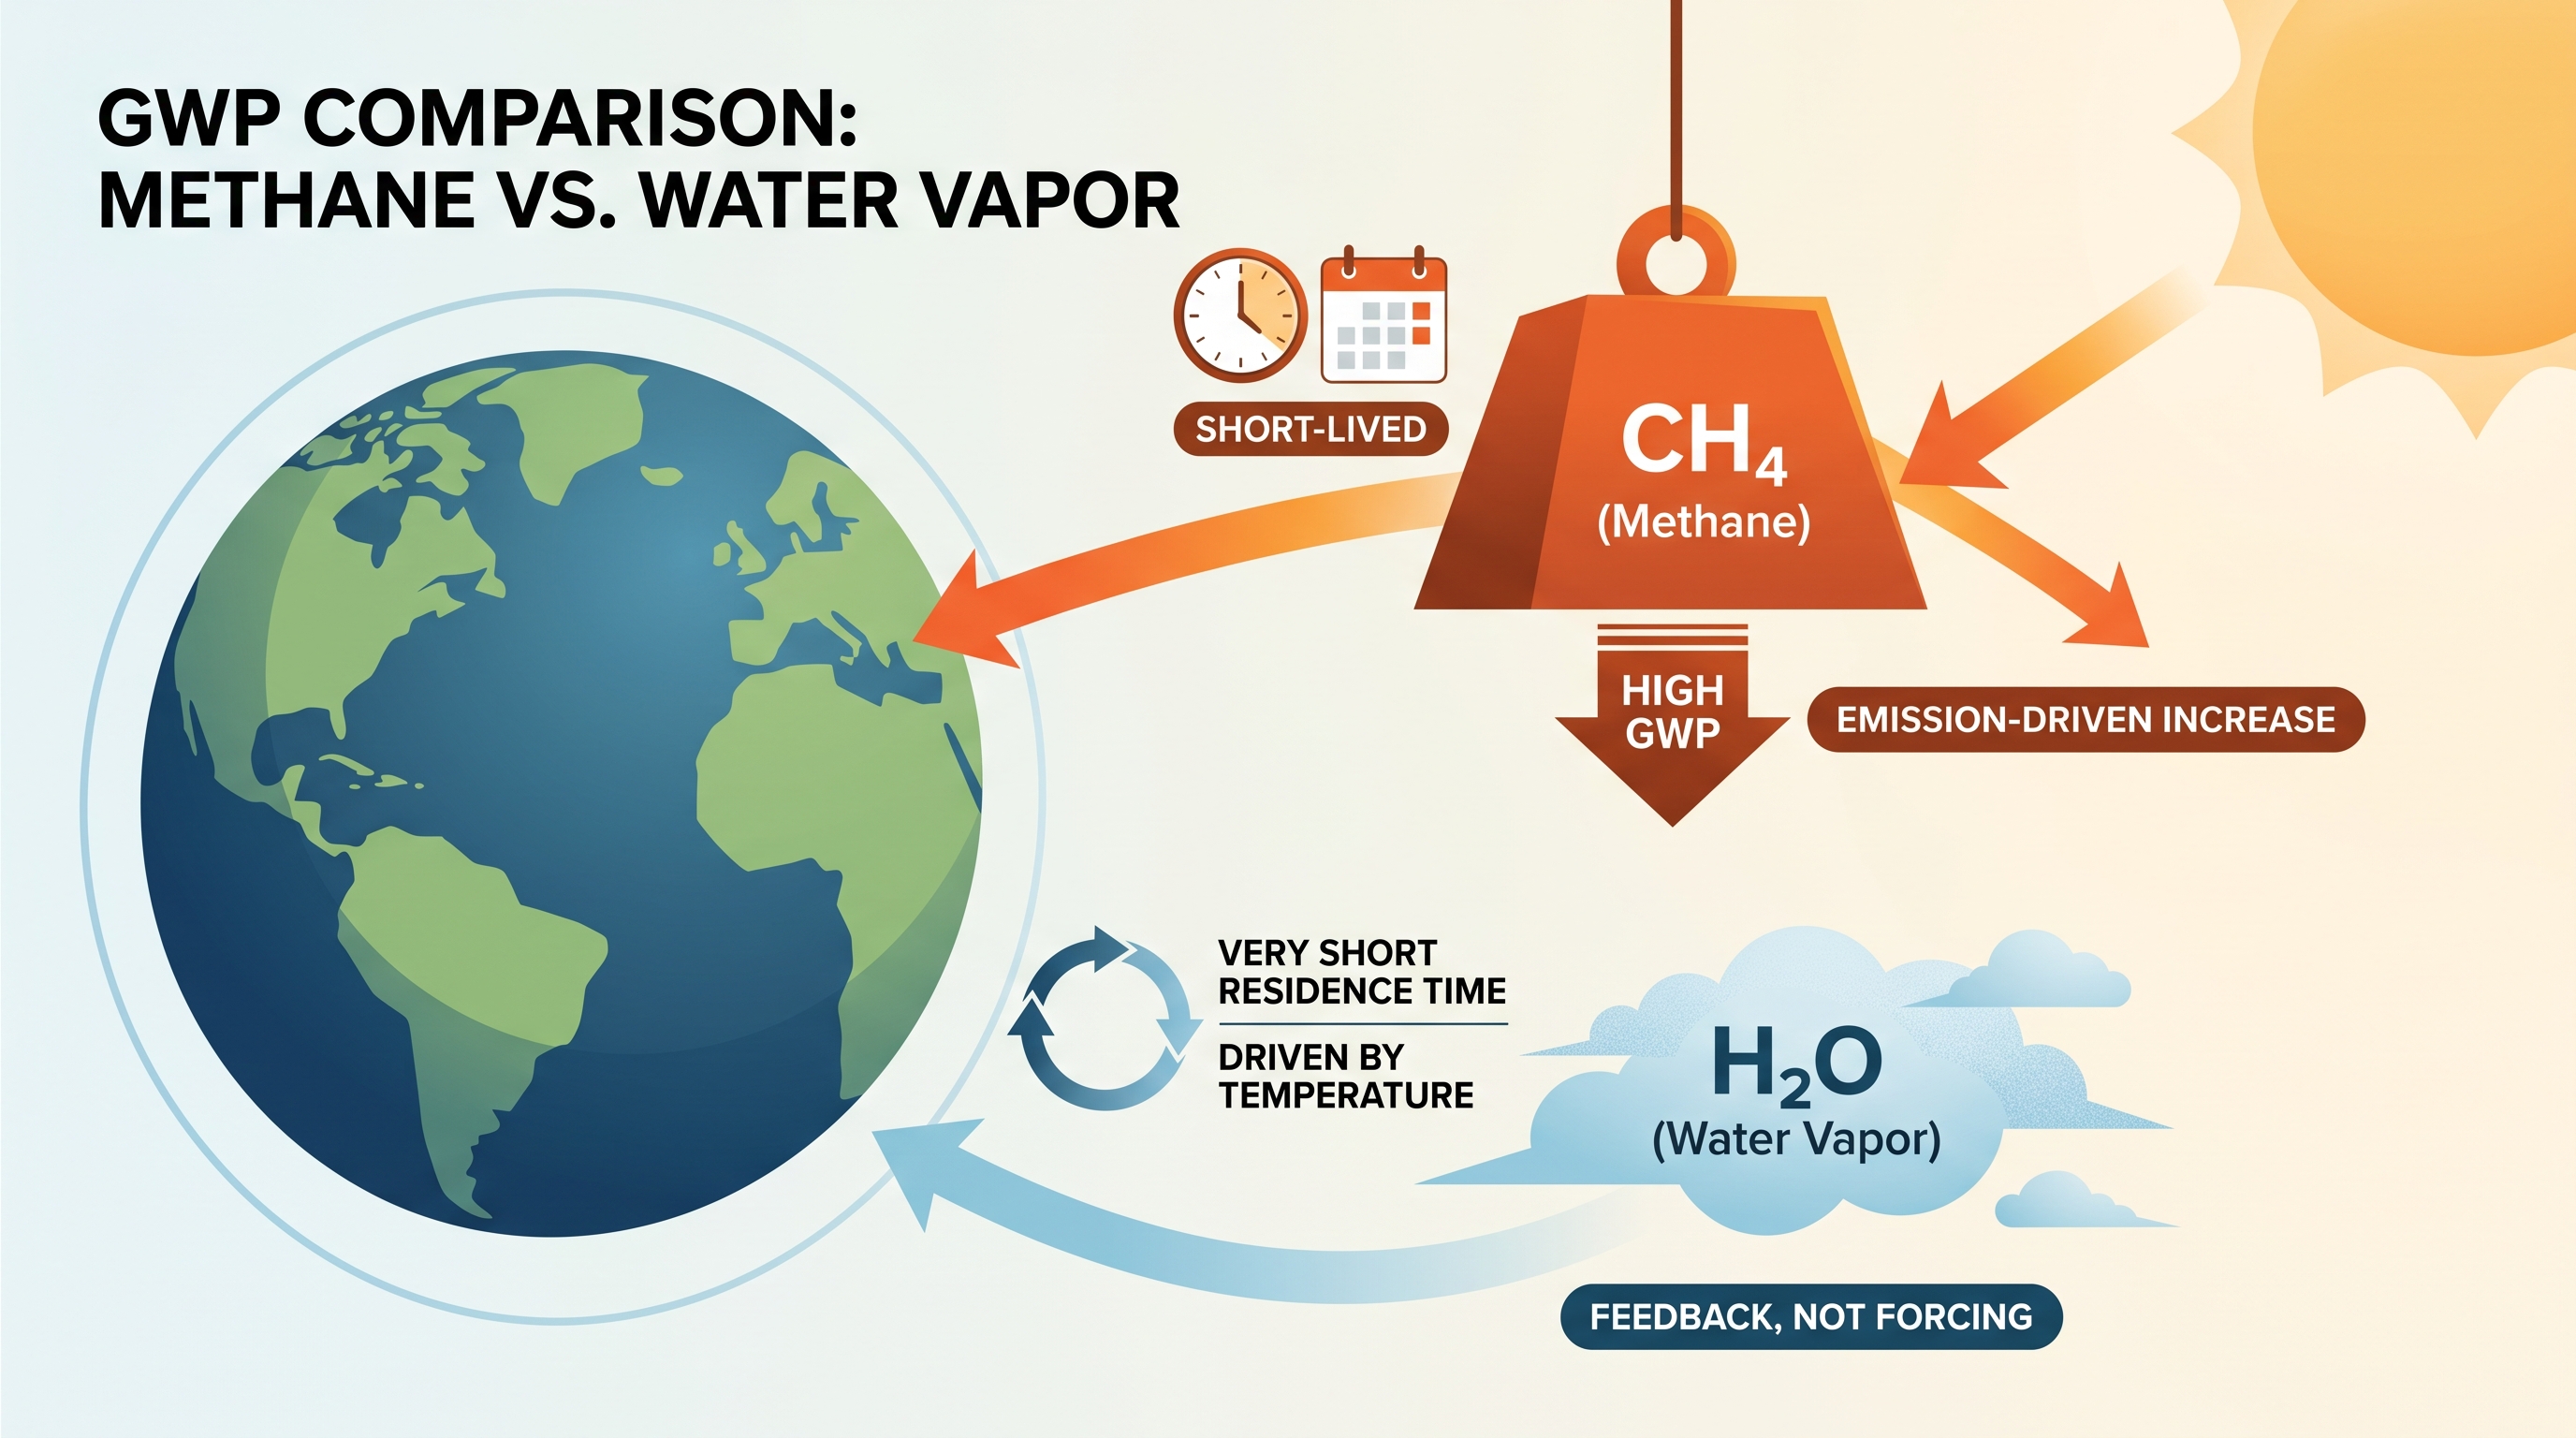
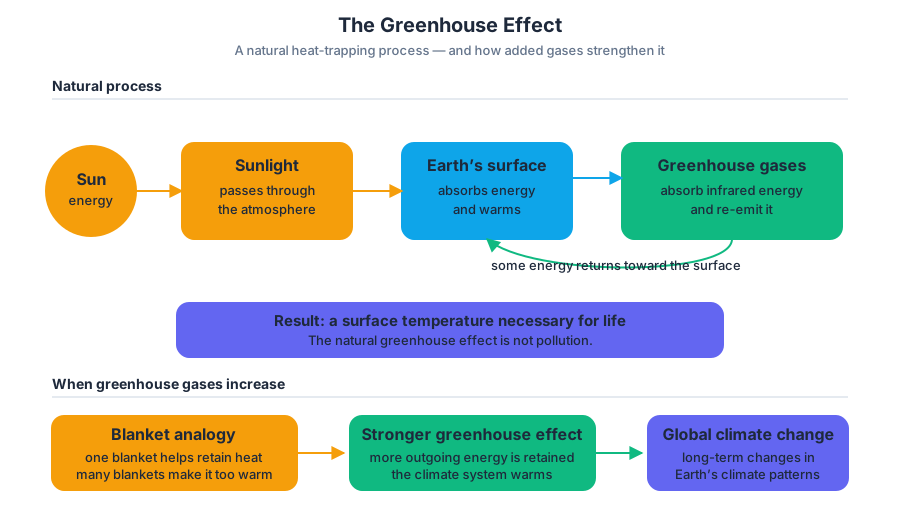
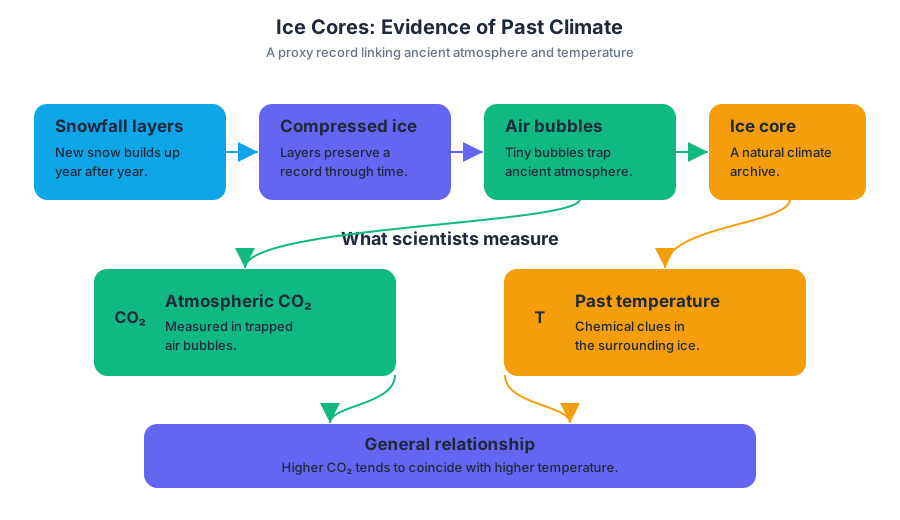
9.5 Global Climate Change · 9.6 Ocean Warming
Key concepts: Global climate change · Effects of climate change · Greenhouse gases and ocean acidification · Ocean warming · Coral bleaching · Oceanic currents and the ocean conveyor belt · Coastal and global climate impacts · Human activities affecting global systems · Climate-change impacts on habitats and species · Arctic versus global temperature change
Earth’s climate has changed throughout its history, but current warming is producing linked changes across ice, soil, oceans, ecosystems, and human communities. The key question is not merely whether temperature rises, but how one change propagates through connected Earth systems.
9.5 Global Climate Change · 9.6 Ocean Warming
Earth’s climate has changed throughout its history, but current warming is producing linked changes across ice, soil, oceans, ecosystems, and human communities. The key question is not merely whether temperature rises, but how one change propagates through connected Earth systems.
Climate change is a connected-system problem
Global climate change is a long-term change in Earth’s climate patterns, including temperature, precipitation, ice cover, sea level, and circulation.
A warmer climate can produce several observable effects at once:
- rising average temperatures;
- melting permafrost and sea ice;
- melting glaciers and land-based ice sheets;
- rising sea levels;
- changes in rainfall and soil viability;
- increased erosion;
- displacement of coastal inhabitants; and
- habitat loss or other changes for species that depend on particular temperature, moisture, or ice conditions.
These effects interact. For example, melting land-based ice raises sea level, while warming seawater expands. Higher sea levels can flood coastal wetlands, reduce nesting habitat, and force people to relocate. In a different system, altered temperature and rainfall can reduce soil viability and leave exposed soil more vulnerable to erosion. This cause-and-effect chain develops STB-4.F: Explain how changes in climate, both short- and long-term, impact ecosystems.
Oceanic currents move climate around the planet
Oceanic currents, sometimes called the ocean conveyor belt, are large-scale movements of seawater that redistribute heat throughout the world. Warm water transports energy away from the tropics; colder, denser water sinks and helps drive deep-water circulation.
A simplified circulation pattern looks like this:
$$ \text{Warm surface water} \rightarrow \text{higher latitudes} \rightarrow \text{cooling and sinking} \rightarrow \text{deep return flow} $$
This movement matters especially in coastal regions. If a current changes in speed, direction, or temperature, the climate of nearby land can change as well. Coastal communities may experience altered temperatures, precipitation patterns, storm conditions, fisheries, and growing seasons even when the change began far away in the ocean.
Essential knowledge — STB-4.F.5: Oceanic currents, or the ocean conveyor belt, carry heat throughout the world. When these currents change, they can strongly affect global climate, especially in coastal regions.
Misconception check — “The ocean only responds to climate.”
The ocean responds to atmospheric change, but it also helps control climate by storing and transporting heat. A current shift can therefore become a climate driver for regions along its path.
Positive feedback accelerates polar change
Albedo is the fraction of incoming solar energy reflected by a surface. Bright snow and ice have high albedo; darker ocean water and exposed ground absorb more energy.
The polar feedback can be represented as:
$$ \text{warming} \rightarrow \text{ice and snow melt} \rightarrow \text{lower albedo} \rightarrow \text{more energy absorbed} \rightarrow \text{additional warming} $$
This is a positive feedback loop because the initial change—warming—is amplified rather than reduced. In the Arctic, melting sea ice and thawing tundra can also release greenhouse gases such as methane, adding another reinforcing pathway. Species that rely on sea ice for habitat or food are consequently exposed to both habitat loss and food-web disruption.
Essential knowledge — STB-4.F.7, STB-4.F.8, and STB-4.F.9: Polar regions respond rapidly because ice and snow reflect substantial energy back to space. As they melt, Earth absorbs more energy, and Arctic feedback loops involving sea ice and thawing tundra can intensify warming.
A positive feedback is not the same as a positive outcome. “Positive” describes the direction of the response: the effect reinforces the original change.
Ocean warming and marine species
STB-4.G.1: Ocean warming is caused by the increase in greenhouse gases in the atmosphere.
The ocean absorbs much of the additional heat associated with atmospheric greenhouse-gas increases. Warmer seawater can affect marine species through loss of habitat and through changes in metabolism, growth, migration, and reproduction.
Ocean warming is also linked to changes in ocean pH. The chemical details of acidification belong with the following topic, but the connection is important: increasing greenhouse gases in the atmosphere can alter both ocean temperature and ocean chemistry. A single global-scale driver can therefore create multiple stresses for marine organisms.
Coral bleaching: a visible warning signal
Coral bleaching occurs when corals lose the algae living within their tissues and turn white. These algae normally contribute energy to the coral; without them, the coral is stressed and may have insufficient energy for growth, reproduction, and repair.
The sequence is:
$$ \text{ocean warming} \rightarrow \text{algal loss} \rightarrow \text{white coral tissue} \rightarrow \begin{cases} \text{recovery if stress ends} \ \text{death if stress persists} \end{cases} $$
STB-4.G.3: Ocean warming is causing coral bleaching; bleaching occurs when corals lose their algae and become white. Some bleached corals recover, while others die. Therefore, bleaching is not automatically proof that every coral is dead—but it is evidence of severe stress.
Worked example: linking local activity to global effects
Suppose a coastal region clears mangroves and increases fossil-fuel use. Locally, mangrove removal eliminates nursery habitat and reduces coastal protection. Regionally, more exposed shoreline is vulnerable to flooding and erosion. Globally, added greenhouse gases contribute to ocean warming; warmer water increases stress on nearby coral reefs, while rising sea level threatens low-lying communities.
The reasoning is:
- Identify the activity: land clearing and fuel combustion.
- Trace the physical change: habitat removal, increased greenhouse gases, warming ocean, and rising sea level.
- Connect each change to an ecosystem or human consequence: reduced nursery habitat, coral bleaching, erosion, flooding, and displacement.
- State the scale: a local or regional activity can contribute to impacts that operate globally.
This directly applies the skill 7.A.9 — Describe environmental problems: name the problem, identify its cause, and connect it to a specific environmental consequence.
Retrieval check
Why can a change in oceanic currents affect a coastal climate, and why can ocean warming cause coral bleaching? A strong answer should mention heat transport by currents, the loss of coral-associated algae, and the possibility of coral recovery or death depending on how long the stress lasts.
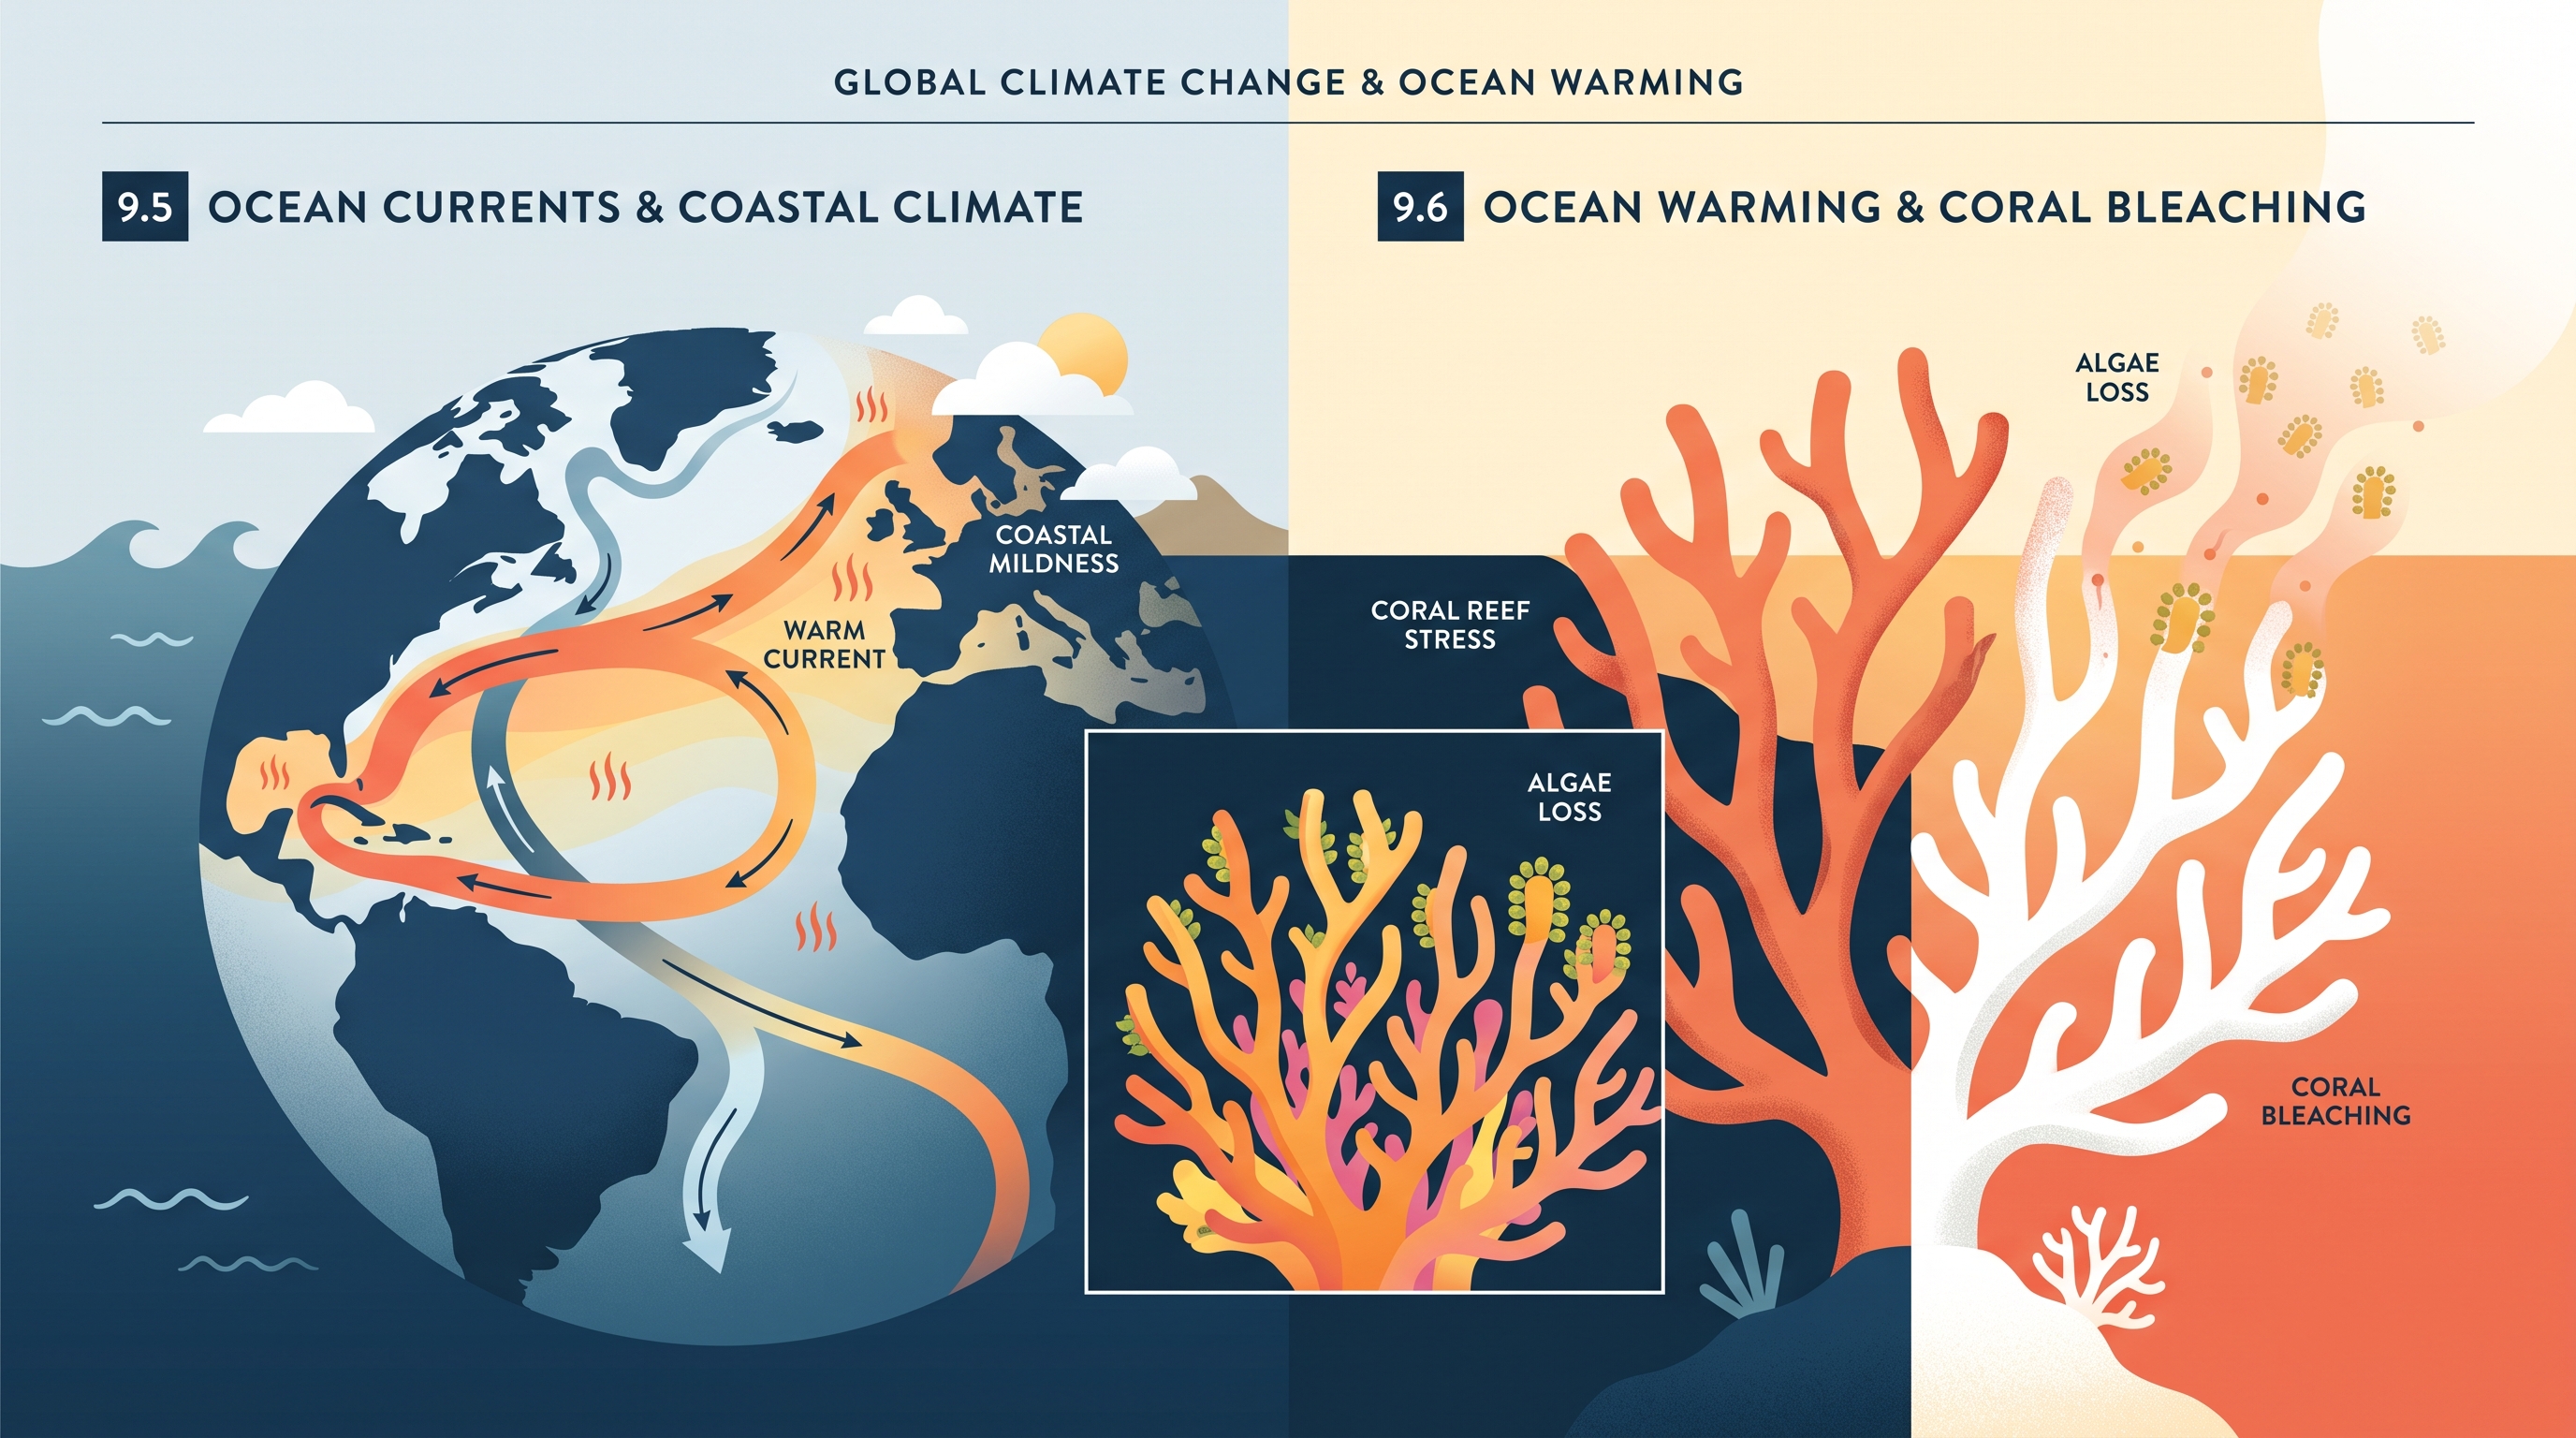
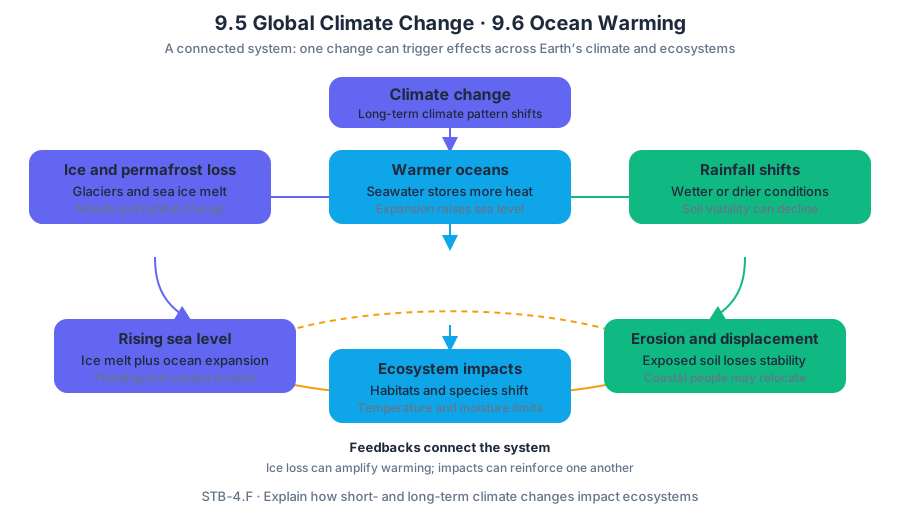
9.7 Ocean Acidification · 9.8 Invasive Species
Key concepts: Ocean acidification · Calcium carbonate shell formation · Coral reef damage · Invasive species · Non-native species · Competition with native species · Threats to native populations · Biological control · Preventing invasive-species spread
Ocean acidification makes seawater less chemically favorable for organisms that build calcium carbonate shells or skeletons, while invasive species can disrupt native populations after entering environments where they did not originally occur.
9.7 Ocean Acidification · 9.8 Invasive Species
Ocean acidification makes seawater less chemically favorable for organisms that build calcium carbonate shells or skeletons, while invasive species can disrupt native populations after entering environments where they did not originally occur. Both problems begin with a change in environmental conditions, but their mechanisms differ: acidification alters ocean chemistry globally; invasion changes biological interactions locally or regionally.
Ocean acidification: changing the carbonate building supply
Human activities that increase atmospheric carbon dioxide, including fossil-fuel combustion, vehicle emissions, and deforestation, also increase the amount of carbon dioxide absorbed by the ocean. Once dissolved, carbon dioxide participates in reactions that increase hydrogen-ion concentration and lower pH:
CO_2 + H_2O \rightleftharpoons H_2CO_3
H_2CO_3 \rightleftharpoons H^+ + HCO_3^-
As hydrogen-ion concentration rises, carbonate ions become less available. Because many marine organisms require carbonate ions to combine with calcium ions, the concentration of available calcium carbonate can decline.
STB-4.H.4: Ocean acidification damages coral because acidification makes it difficult for them to form shells, due to the loss of calcium carbonate.
The important chain is not simply “more carbon dioxide equals dead coral.” The exam-relevant reasoning is:
$$ \text{fossil fuels or deforestation} \rightarrow \text{more atmospheric } CO_2 \rightarrow \text{more dissolved } CO_2 \rightarrow \text{lower ocean pH} \rightarrow \text{less available } CaCO_3 \rightarrow \text{weaker shell or skeleton formation} $$
Why calcium carbonate matters
Calcium carbonate, written as $CaCO_3$, is a structural material used by organisms such as corals and many shell-forming marine animals. When seawater contains less available calcium carbonate, these organisms must spend more energy forming and maintaining shells or skeletons; existing calcium-carbonate structures may also become more vulnerable to dissolution.
Worked contextual example. A coastal region clears forest and expands gasoline-powered transportation. Atmospheric $CO_2$ rises, and the ocean absorbs more of that gas. The resulting increase in $H^+$ lowers seawater pH and reduces carbonate-ion availability. Coral polyps then have greater difficulty depositing $CaCO_3$ to build their skeletons. As coral growth slows, reef structure can weaken, reducing habitat complexity for organisms that depend on the reef.
Misconception check — “acidification means the ocean becomes a strong acid.” Ocean acidification means a decrease in pH relative to earlier conditions; seawater remains mildly basic in the ordinary chemical sense. The ecological danger comes from a shift in carbonate chemistry that interferes with shell and skeleton formation, not necessarily from seawater becoming chemically similar to vinegar.
Invasive species: when non-native becomes harmful
A non-native species is a species living outside the environment in which it normally occurs. An invasive species is a non-native species that can live, and sometimes thrive, outside its normal habitat and threatens native species.
EIN-4.A.1: Invasive species are species that can live, and sometimes thrive, outside of their normal habitat. Invasive species can sometimes be beneficial, but they are considered invasive when they threaten native species.
The distinction matters: non-native describes origin and location; invasive adds an ecological consequence. A non-native organism is not automatically invasive. It becomes invasive when its spread or abundance harms native species, populations, or ecosystem relationships.
Competition with native species
Invasive species may negatively affect native populations through competition, the interaction that occurs when organisms require the same limited resource. The resource might be food, light, nesting space, water, or territory. If the invasive species uses that resource more effectively, the native population may experience reduced growth, survival, or reproduction.
For example, suppose a non-native beetle enters an experimental plot and consumes the same plant material required by a native beetle. If both populations begin with similar access to food but the native beetle declines as the non-native beetle increases, competition is a plausible explanation. A strong environmental explanation identifies the shared limiting resource and connects resource reduction to a native-population effect.
Misconception check — “every introduced species is invasive.” Introduction alone does not establish invasiveness. The evidence must show that the species can persist outside its normal range and threaten native species, such as by competing for a limiting resource.
Controlling and preventing an invasion
Once an invasive population is established, biological control uses a living organism—such as a predator, parasite, or pathogen—to reduce the invasive species. Biological control can be effective because it targets the population directly, but the control organism must be selected carefully: introducing another non-native organism can create a second ecological problem if it attacks native species or spreads beyond the intended area.
Worked contextual example. Researchers discover a non-native beetle in an experimental plot. To prevent it from spreading beyond the current range, they could trap and physically remove beetles, apply an appropriate pesticide, or introduce a predator, parasite, or pathogen that harms the beetles. Each proposal is stronger when it specifies how the method reduces beetle abundance or blocks dispersal.
A prevention strategy should match the question. If the task asks how to stop spread beyond a plot, “protect native biodiversity” is too vague. A realistic answer names an action and its mechanism: remove beetles before reproduction, restrict movement of infested soil or plant material, establish barriers or quarantine zones, or use carefully evaluated biological control.
Apply the reasoning
The relevant AP science practice is Explain environmental concepts, processes, or models in applied contexts. For ocean acidification, explain a linked causal sequence from anthropogenic carbon dioxide emissions to reduced calcium-carbonate availability and coral damage. For invasive species, identify the non-native organism, explain how it persists outside its normal environment, and connect competition or another interaction to a decline in native populations.
Retrieval check. A graph shows atmospheric $CO_2$ increasing while coral growth decreases. What intermediate chemical change should appear in the explanation? Answer: More dissolved $CO_2$ increases hydrogen-ion concentration, lowers seawater pH, and reduces carbonate availability, making $CaCO_3$ formation more difficult. A separate prompt describes a beetle outside its normal range but provides no evidence of harm. Is “invasive” automatically justified? No: the threat to native species must also be established.
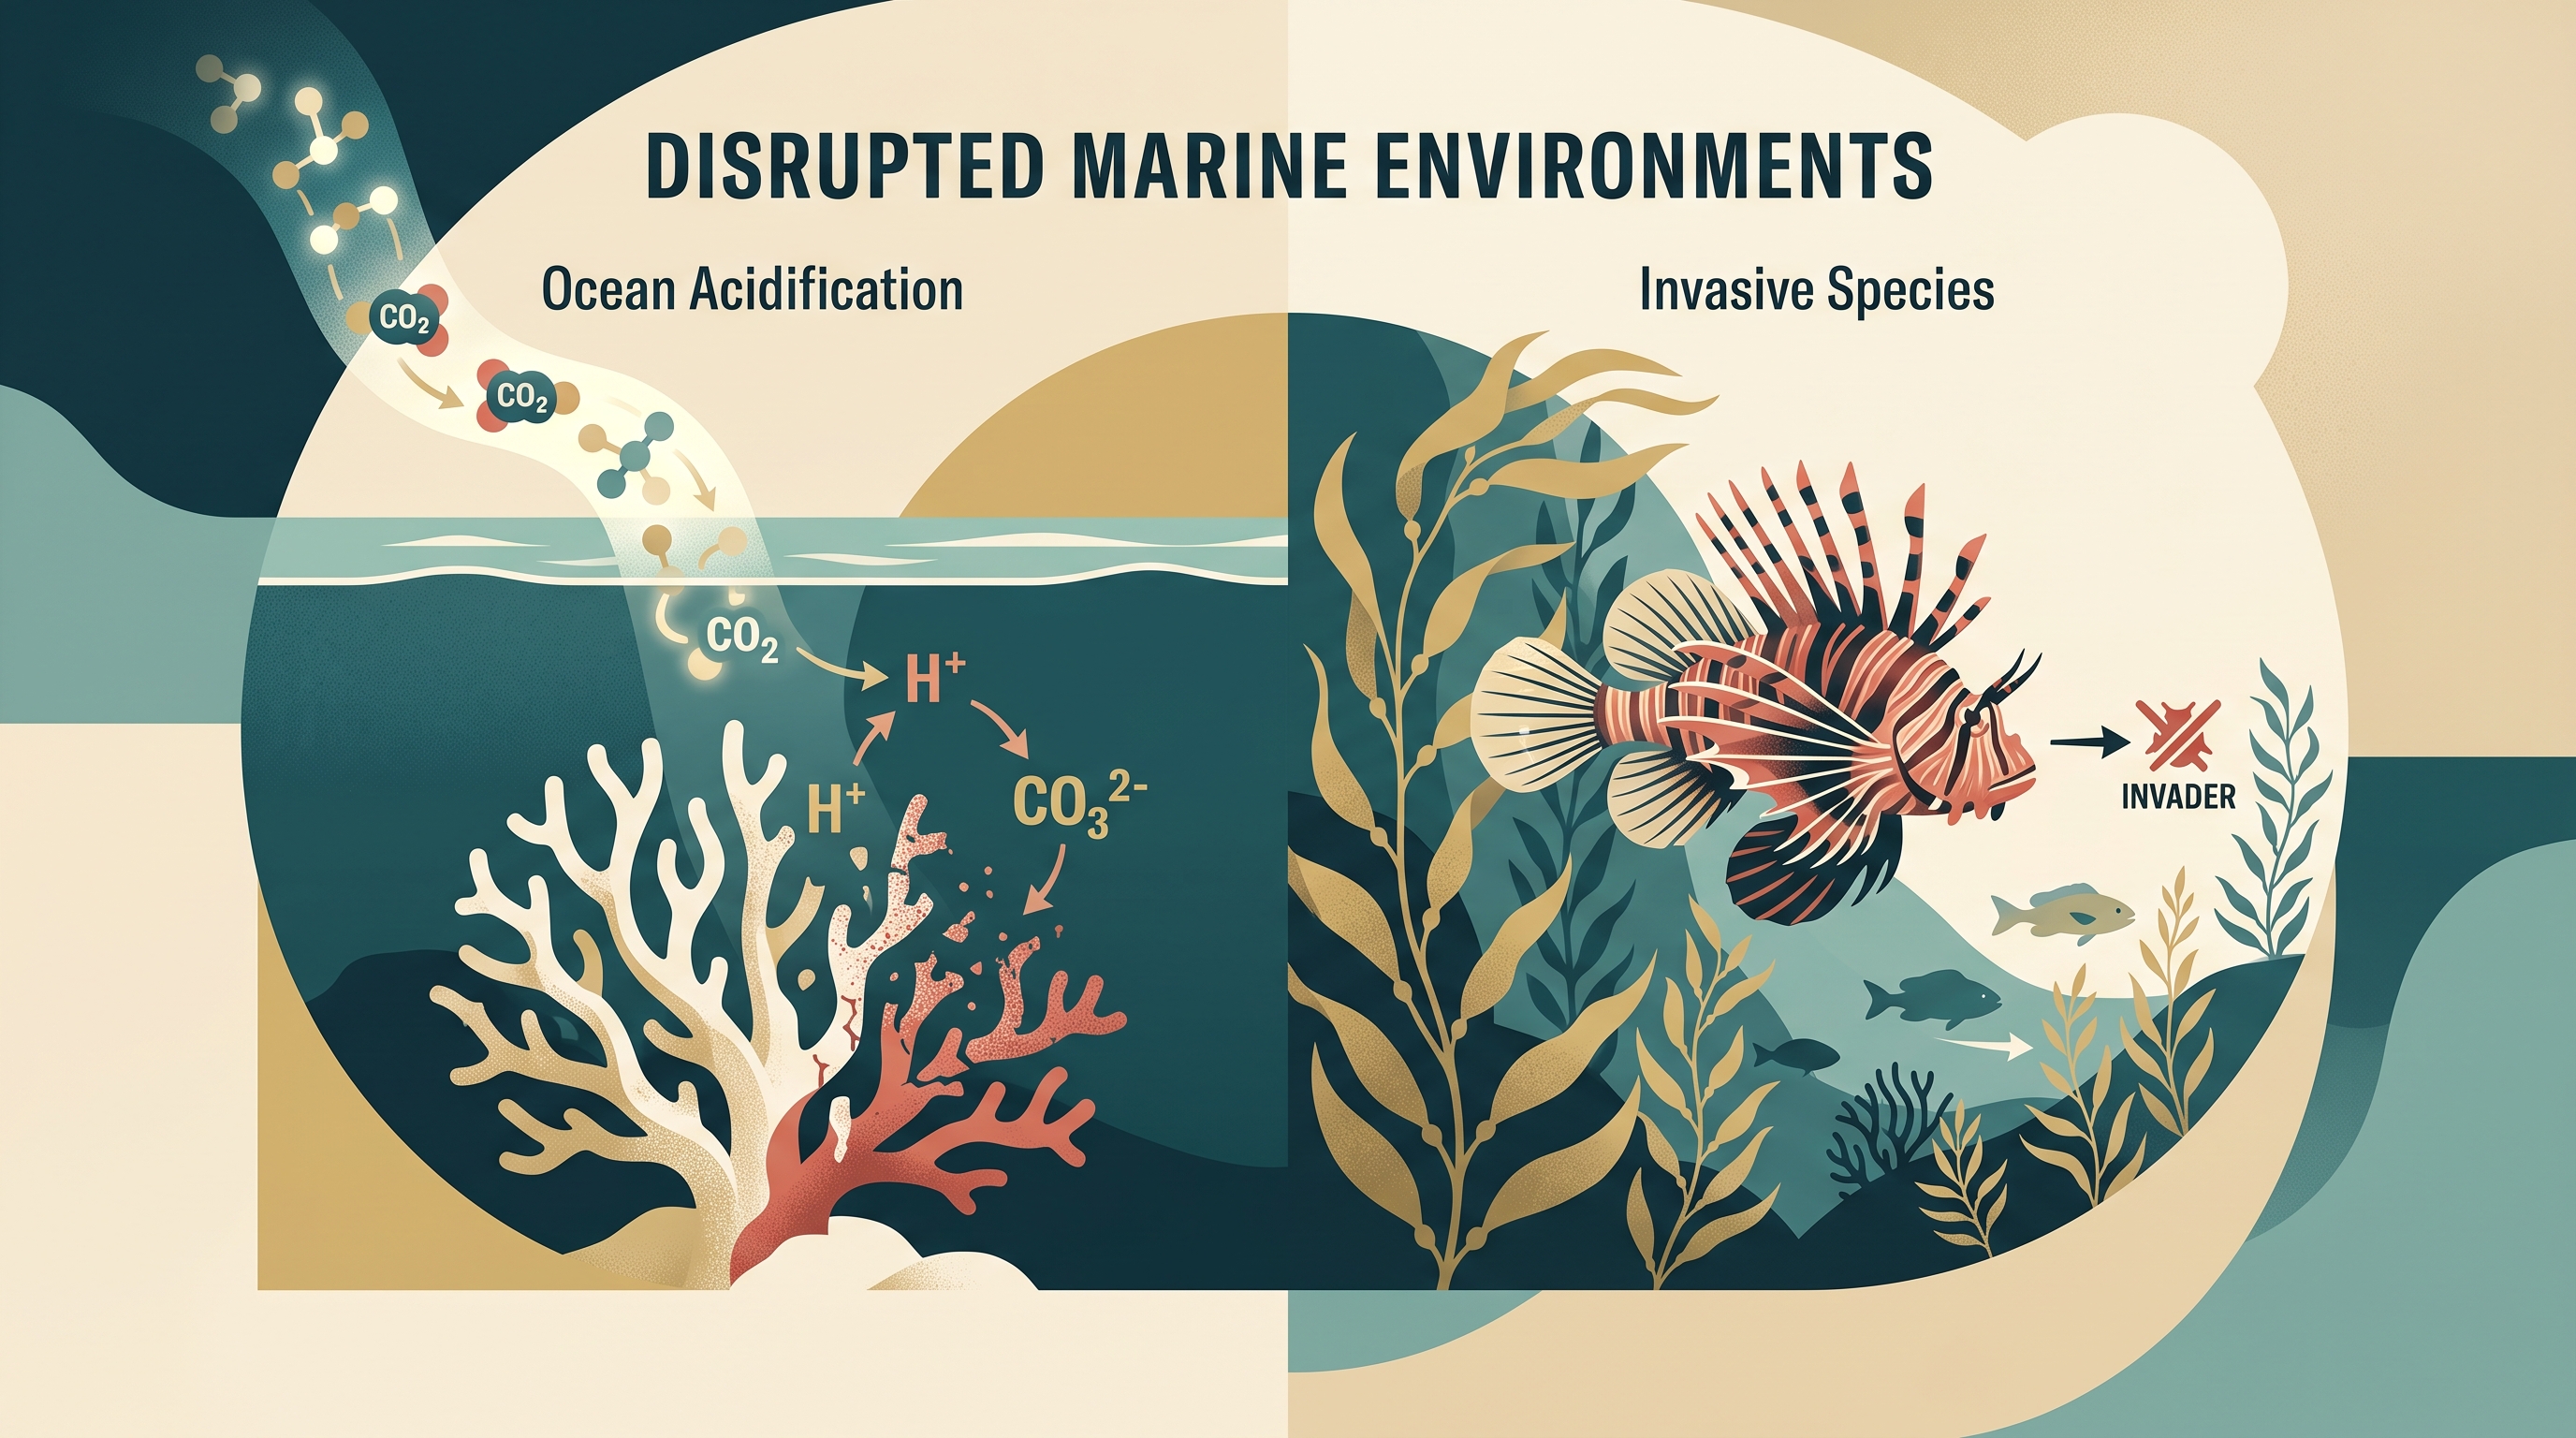
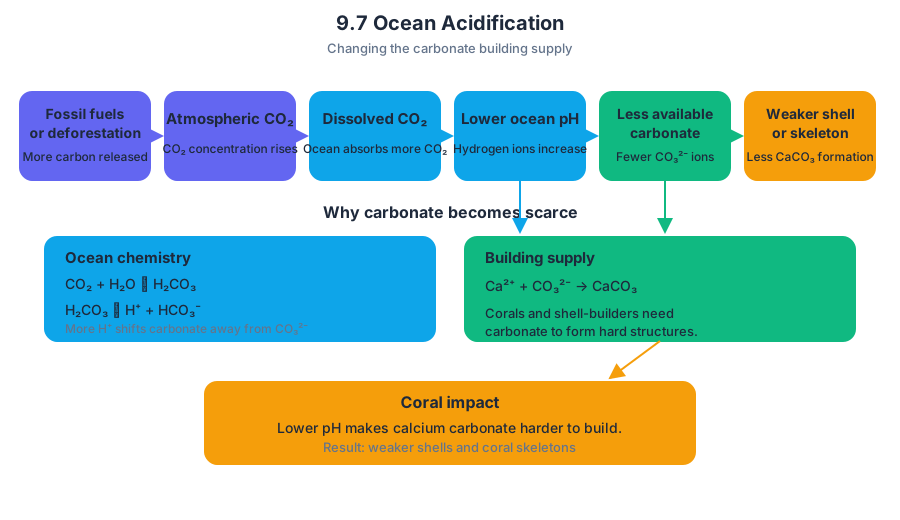
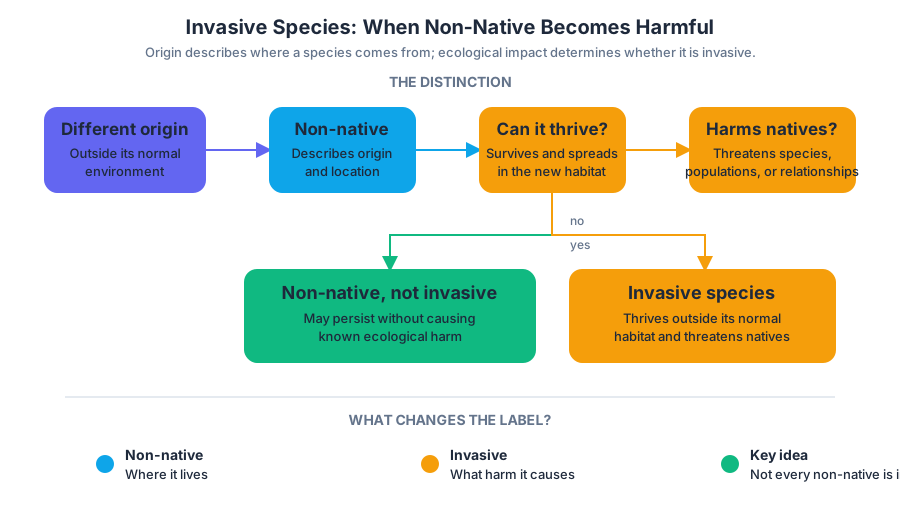
9.9 Endangered Species · 9.10 Human Impacts on Biodiversity
Key concepts: Endangered species · Human impacts on biodiversity · Strategies to combat biodiversity loss · Species health and ecosystem health · Effects of environmental change on species · Poaching as a threat to animal populations · Protecting animal populations · Species richness · Species diversity · Using experimental data to analyze biodiversity
A species can decline toward extinction because its habitat, food supply, breeding conditions, or ecological relationships have been altered—even when the change seems small. The central idea of 9.9 Endangered Species · 9.10 Human Impacts on Biodiversity is that species health is inseparable from ecosystem health.
9.9 Endangered Species · 9.10 Human Impacts on Biodiversity
A species can decline toward extinction because its habitat, food supply, breeding conditions, or ecological relationships have been altered—even when the change seems small. The central idea of 9.9 Endangered Species · 9.10 Human Impacts on Biodiversity is that species health is inseparable from ecosystem health.
Enduring Understanding EIN-4: The health of a species is closely tied to its ecosystem, and minor environmental changes can have a large impact.
Human activities and biodiversity loss
Biodiversity is the variety of life at genetic, species, and ecosystem levels. Human activities reduce biodiversity through the HIPPCO pressures identified in Essential Knowledge EIN-4.C.1:
- Habitat destruction and fragmentation
- Invasive species
- Population growth
- Pollution
- Climate change
- Overexploitation, including poaching
Habitat destruction removes the physical conditions a species needs. Fragmentation divides remaining habitat into smaller, isolated patches, which can reduce movement, limit access to mates and food, and decrease genetic exchange. Pollution can alter water chemistry, reproductive success, or food-web relationships, while climate change can shift temperature and precipitation beyond a species’ tolerance range.
The connection is often indirect. For example, a paved road through a forest may not kill every animal immediately, but it can divide habitat, increase road mortality, create noisy edges, and prevent individuals from reaching breeding areas. A small environmental change can therefore trigger several linked effects across the ecosystem.
Endangered species and conservation strategies
An endangered species is a species at serious risk of extinction throughout all or a significant portion of its range. Protecting the species itself is important, but protecting the ecosystem that supplies its food, shelter, nesting sites, and partners is usually more effective than treating the species as an isolated object.
The Learning Objective EIN-4.C is to explain how human activities affect biodiversity and strategies to combat the problem. Essential Knowledge EIN-4.C.6 identifies several mitigation strategies:
| Strategy | How it reduces biodiversity loss |
|---|---|
| Protected areas | Limit damaging development, hunting, or extraction in important habitat |
| Habitat corridors | Connect isolated habitat patches so organisms can migrate and exchange genes |
| Sustainable land use | Meet human needs while reducing long-term ecosystem damage |
| Habitat restoration | Rebuild degraded or lost habitat |
| Legislation | Establish enforceable protections for species and habitats |
| Criminalizing poaching | Makes illegal killing or capture punishable and can reduce overexploitation |
Poaching is the illegal hunting, capture, or collection of wildlife. Criminalizing poaching can protect animal populations by increasing the cost and legal risk of overexploitation, but enforcement, habitat protection, and reduction of illegal-market demand are also necessary. A law that exists only on paper may not stop population decline if poaching remains profitable and enforcement is weak.
Shell-in-a-bag investigation: richness versus diversity
A shell-in-a-bag investigation models an ecosystem containing multiple species. Without looking inside, a group records the different shell types, counts how many individuals belong to each type, and uses those data to compare biodiversity.
Species richness is simply the number of different species present:
$$ \text{Species richness} = S $$
If Bag A contains shells from five species and Bag B contains shells from three species, Bag A has greater species richness, regardless of how many shells belong to each species.
Species diversity includes both richness and relative abundance—how evenly individuals are distributed among the species. One common index is the Shannon diversity index:
$$ H'=-\sum_{i=1}^{S}p_i\ln(p_i) $$
where $S$ is the number of species and $p_i$ is the proportion of individuals belonging to species $i$. Higher $H'$ generally indicates greater diversity.
Worked example. Bag A contains four species with counts $4,4,4,4$. Bag B also contains four species, but its counts are $13,2,1,0$ only if the fourth species is absent, so Bag B actually has richness $3$. If the counts are instead $12,2,1,1$, both bags have richness $4$, but Bag A has greater species diversity because its individuals are more evenly distributed.
Misconception check: Species richness and species diversity are not interchangeable. Richness counts categories; diversity considers categories and abundance.
Interpreting an investigation
A strong interpretation connects evidence to a hypothesis rather than merely reporting which bag has more shells. Under Science Practice 5.D, Interpret experimental data and results in relation to a given hypothesis, a complete conclusion states the pattern, identifies the relevant measurement, and explains whether the evidence supports or refutes the hypothesis.
For example: “If the hypothesis predicts that disturbed habitat lowers biodiversity, and the disturbed bag has fewer species and a lower diversity index than the undisturbed bag, the results support the hypothesis.” The conclusion should not claim that the investigation proves the hypothesis; a small model may support a pattern without representing every ecosystem process.
AP reasoning and solution evaluation
This topic also uses Science Practice 1.C, Explain environmental concepts, processes, or models in applied contexts, when linking habitat change to population decline; Science Practice 7.A, Describe environmental problems, when identifying biodiversity loss; Science Practice 7.D, Use data and evidence to support a potential solution, when using richness or diversity data to justify conservation; Science Practice 7.E, Make a claim that proposes a solution to an environmental problem in an applied context; and Science Practice 7.C, Describe disadvantages, advantages, or unintended consequences for potential solutions.
A protected area may conserve habitat but restrict local economic activity. A corridor may improve gene flow but also allow disease transmission or increase human–wildlife conflict. The strongest environmental solution recognizes both its benefit and a plausible trade-off.
Retrieval check: A forest contains six species, but one species accounts for nearly every individual. Does it necessarily have high species diversity? Explain the difference between its species richness and its evenness, then name one strategy—such as a protected area, habitat corridor, sustainable land use, restoration, or stronger anti-poaching enforcement—that could address a likely biodiversity threat.
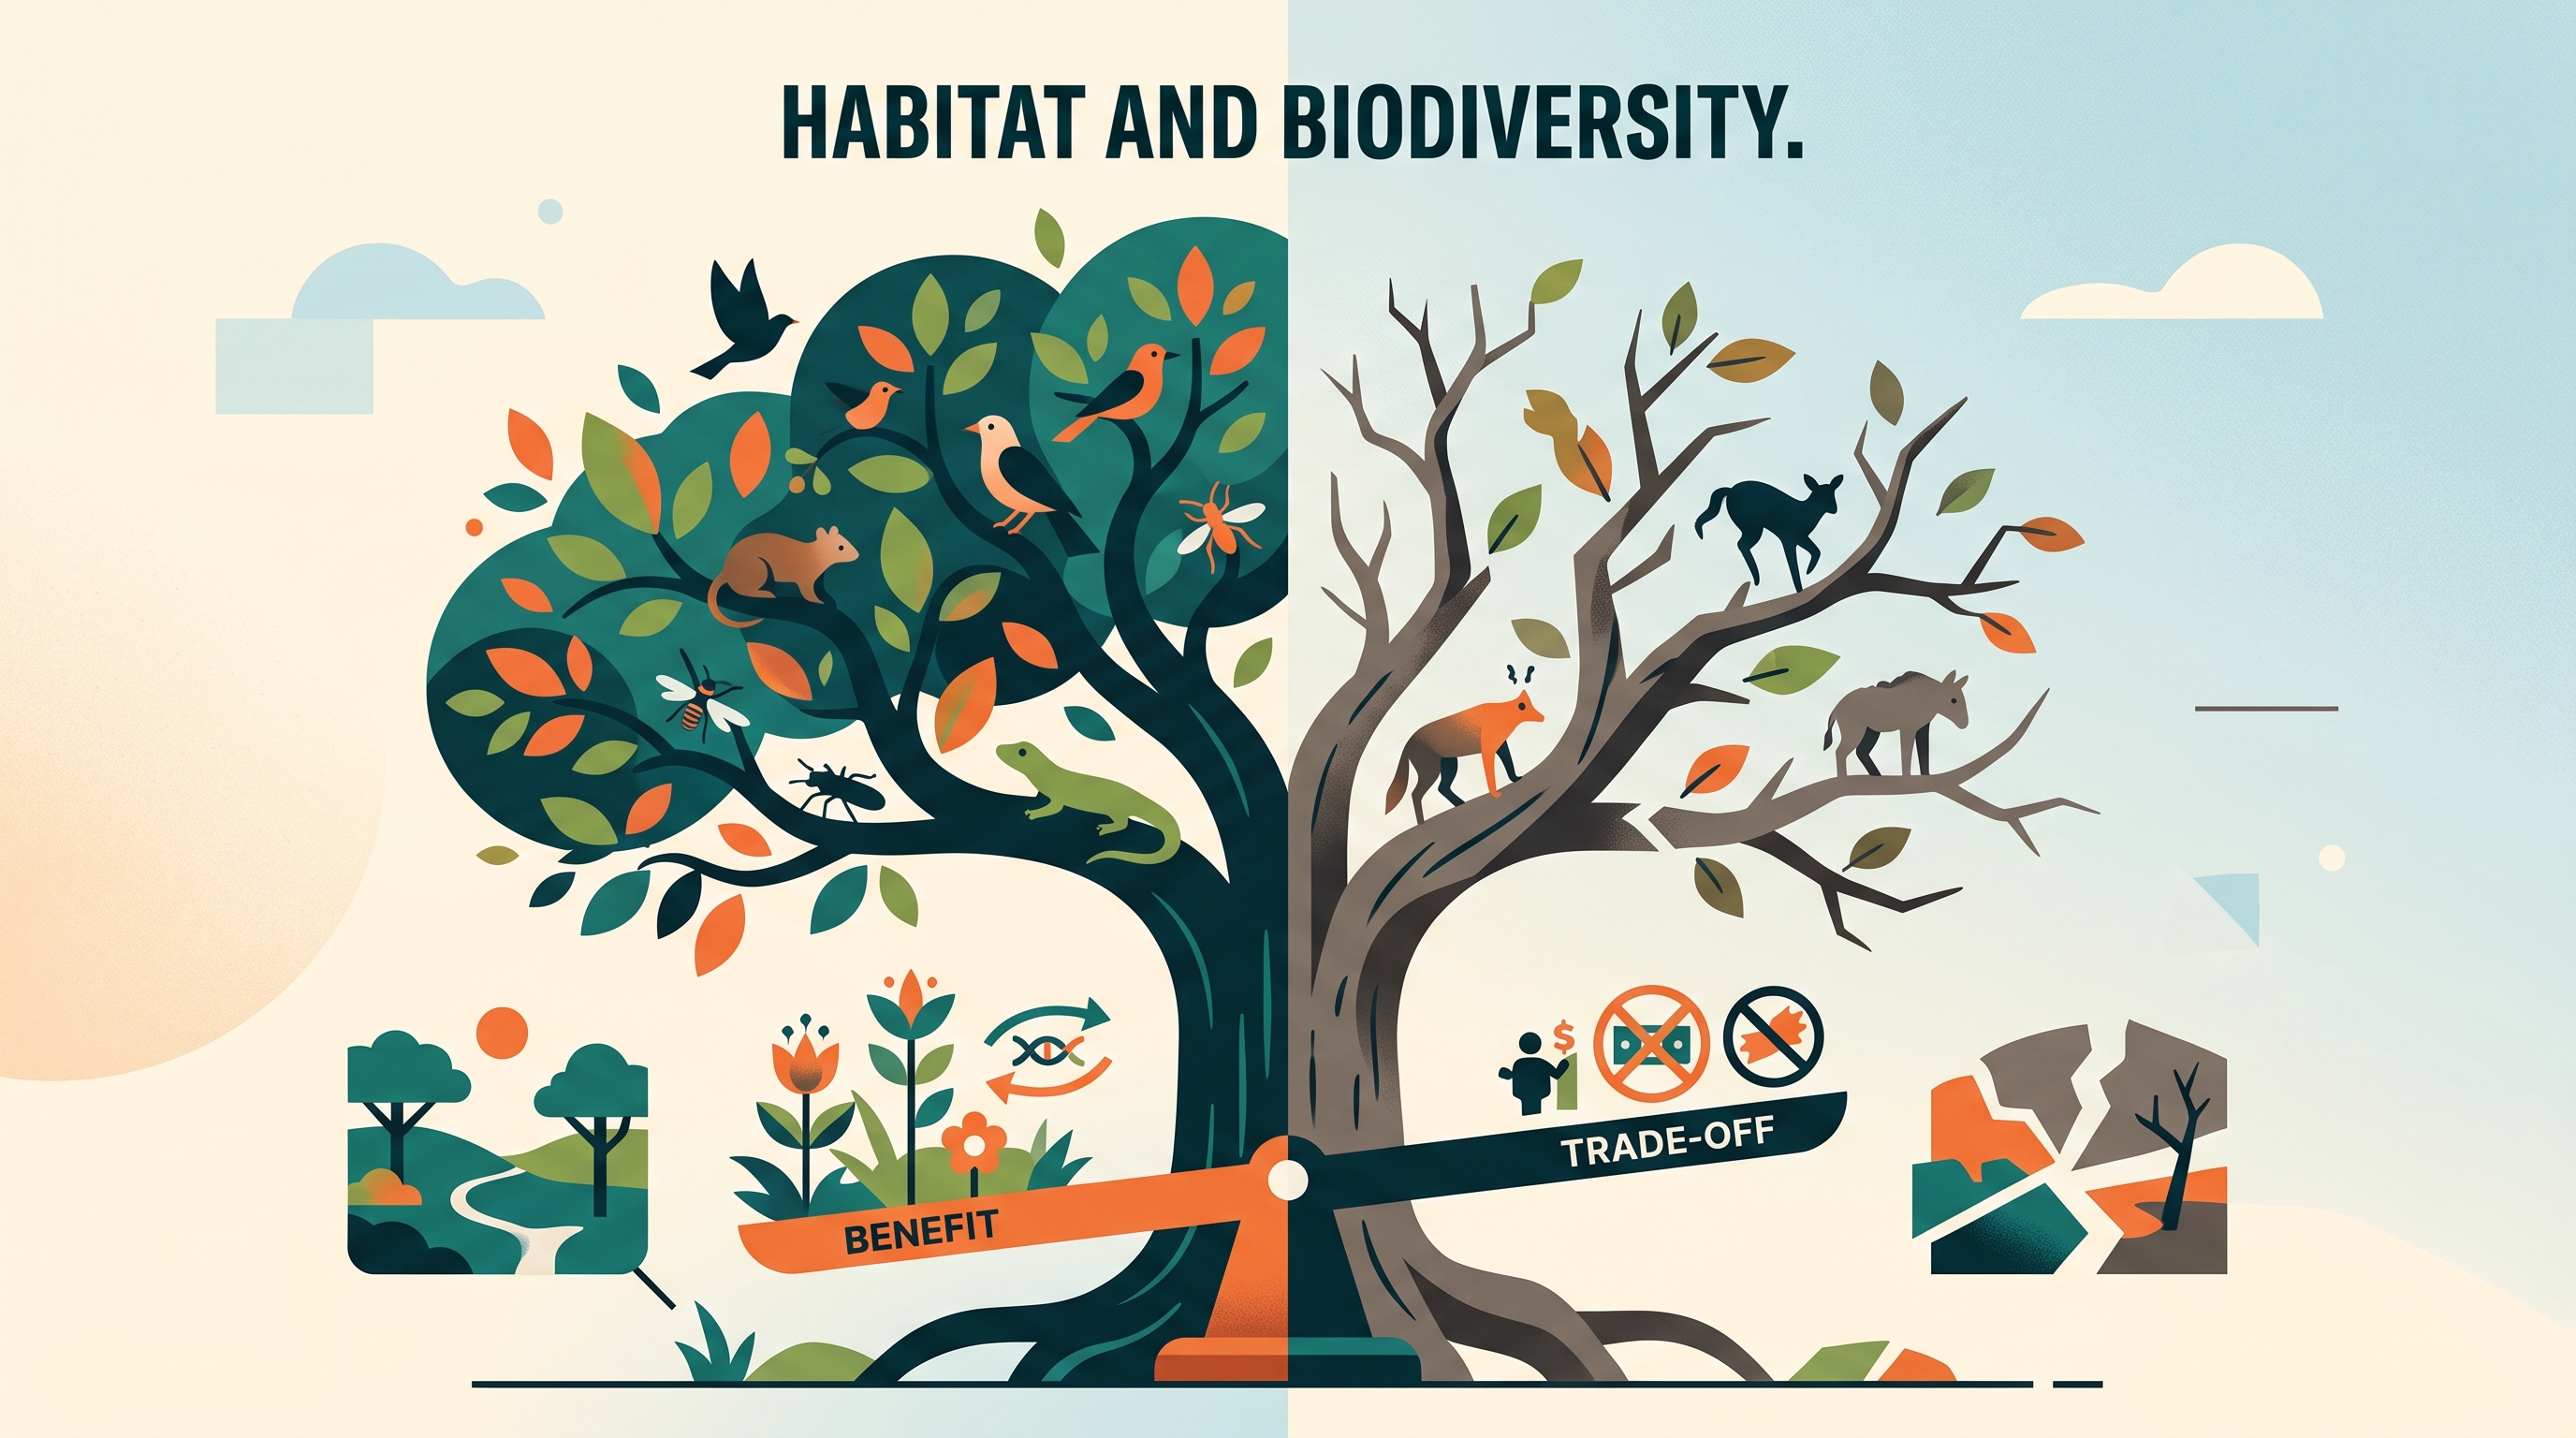
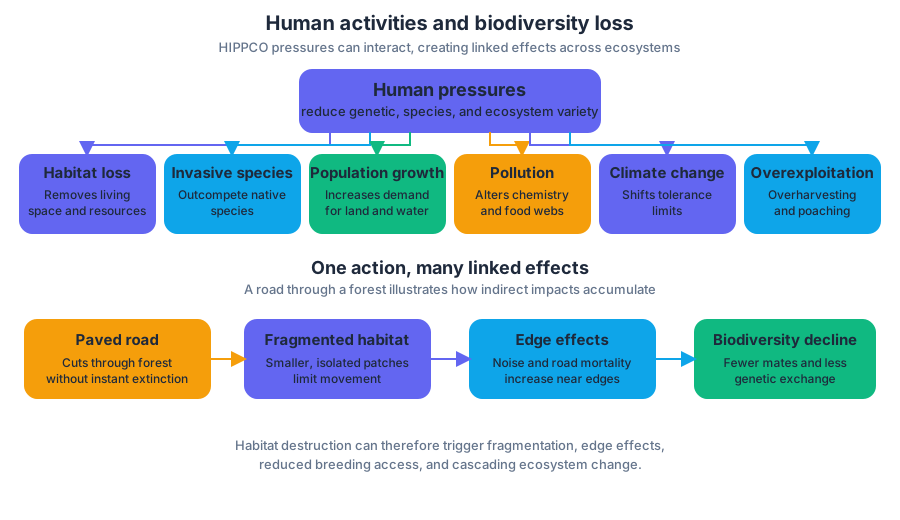
AP Practice 1
Key concepts: Evidence-based reasoning and the scientific method in AP courses · Intellectual freedom and analyzing perspectives in AP · AP Classroom practice tests and feedback · Digital activation and AP class-section registration · AP IDs and streamlined exam registration · Applying environmental science to real-world social and environmental problems · Proposing and evaluating solutions to environmental problems · Interpreting experimental data · Population growth curves and population change calculations · Effects of climate factors on population growth and environmental change
Environmental science turns evidence into decisions: an observation becomes useful only when a student can test an explanation, interpret the results, and justify a solution to a real environmental or social problem.
AP Practice 1
Environmental science turns evidence into decisions: an observation becomes useful only when a student can test an explanation, interpret the results, and justify a solution to a real environmental or social problem.
The evidence-to-solution chain
A strong environmental-science response follows a recognizable chain:
$$ \text{Question} \rightarrow \text{Hypothesis} \rightarrow \text{Investigation} \rightarrow \text{Data} \rightarrow \text{Conclusion} \rightarrow \text{Solution} $$
Evidence-based reasoning means connecting a claim to specific observations, measurements, or patterns. The scientific method does not require students to reach a predetermined political or cultural conclusion. Instead, it requires them to evaluate competing explanations according to the quality of their evidence.
AP courses also protect intellectual freedom. Students may analyze perspectives different from their own—including perspectives involving environmental policy, resource use, conservation, or development—without being required to adopt a prescribed cultural or political viewpoint. The exam rewards accurate scientific reasoning, not agreement with a particular ideology.
Practice 1 task: design an investigation
On the current AP Environmental Science exam, Free-Response Question 1 presents an authentic environmental scenario with a model or visual representation. The student must apply the scientific method, identify an environmental problem, and propose a solution. This task primarily assesses Practice 2: Visual Representations and commonly connects with Practice 1: Concept Application, Practice 4: Scientific Experiments, and Practice 7: Environmental Solutions.
A reliable response identifies:
- the environmental question being investigated;
- a testable hypothesis;
- the independent variable, which the investigator changes or compares;
- the dependent variable, which the investigator measures;
- a control or comparison condition;
- repeated trials or multiple sampling sites;
- a method for collecting comparable data;
- a conclusion tied directly to the evidence; and
- a realistic solution supported by the investigation.
Worked example: shoreline vegetation and bird habitat
A coastal town observes that sites with more shoreline development contain fewer nesting birds. A student proposes this investigation:
Question: How does the percentage of developed shoreline affect the number of nesting bird pairs?
Hypothesis: If the percentage of developed shoreline increases, then the number of nesting bird pairs will decrease because development reduces available nesting habitat.
The independent variable is percentage of developed shoreline. The dependent variable is the number of nesting bird pairs. The student should compare several shoreline sites, keep the survey area and observation period consistent, and repeat bird counts across multiple days or seasons. A suitable control is a minimally developed shoreline site, although the investigator should recognize that natural differences among sites—such as vegetation, predators, and tidal exposure—could also affect bird abundance.
If the data show that bird numbers decline as development increases, the evidence supports the hypothesis. A justified solution might combine development setbacks with protection or restoration of nesting vegetation. This solution is stronger than simply saying “stop development” because it addresses the mechanism shown by the investigation while recognizing that communities must evaluate alternative solutions.
Common misconception — correlation proves causation. A negative relationship between development and bird abundance does not automatically prove that development caused the decline. The response earns stronger scientific reasoning by identifying possible confounding variables and explaining how randomization, matched sites, repeated trials, or controls could reduce their influence.
The other practices that support this task
| Science practice | How it appears in environmental problem solving |
|---|---|
| Practice 1: Concept Application | Applies ecological, population, climate, or pollution concepts to a new scenario. |
| Practice 2: Visual Representations | Interprets maps, models, diagrams, graphs, or other representations. |
| Practice 3: Text Analysis | Uses information from text-based environmental sources. |
| Practice 4: Scientific Experiments | Identifies variables, controls, hypotheses, and limitations. |
| Practice 5: Data Analysis | Describes trends, compares groups, and evaluates evidence. |
| Practice 6: Mathematical Routines | Performs environmental calculations and shows work. |
| Practice 7: Environmental Solutions | Proposes and supports solutions to environmental problems. |
Population problems often require both data interpretation and calculation. For example, a population changing from $12{,}000$ to $13{,}200$ individuals has an absolute increase of $1{,}200$ individuals and a percent increase of
$$\frac{13{,}200-12{,}000}{12{,}000}\times 100=10%.$$
A response should then interpret the result biologically: the population increased by $10%$ during the measured interval. A growth curve can reveal whether that change is part of exponential growth, logistic growth approaching carrying capacity, or a temporary fluctuation caused by climate, food availability, disease, or another environmental factor.
Practice, feedback, and digital access
AP Classroom allows teachers to locate questions by topic and skill, assemble customized tests, and assign them online or on paper. Feedback is most useful when it identifies the failed reasoning step—not merely the incorrect answer. After practice, label each error as content misunderstanding, graph-reading error, calculation error, experimental-design error, or unsupported justification.
Students join an AP Classroom class section with a join code supplied by the teacher or AP Coordinator. Digital activation collects registration information and reduces extensive answer-sheet bubbling on exam day. Personalized AP ID registration labels connect exam materials with the student’s digital registration information, helping streamline exam registration and processing.
Timed practice and retrieval check
For this investigation-design task, reserve approximately $22$ minutes when practicing the three-question, $70$-minute free-response section. Spend the first few minutes identifying the variables and reading the visual, then write concise answers in complete sentences and show every required calculation.
Before moving on, answer without looking back: What is the difference between an independent and dependent variable? Why is a control useful? What evidence would distinguish a causal relationship from a mere correlation? Finally, name one environmental solution whose effectiveness could be tested with a follow-up investigation.

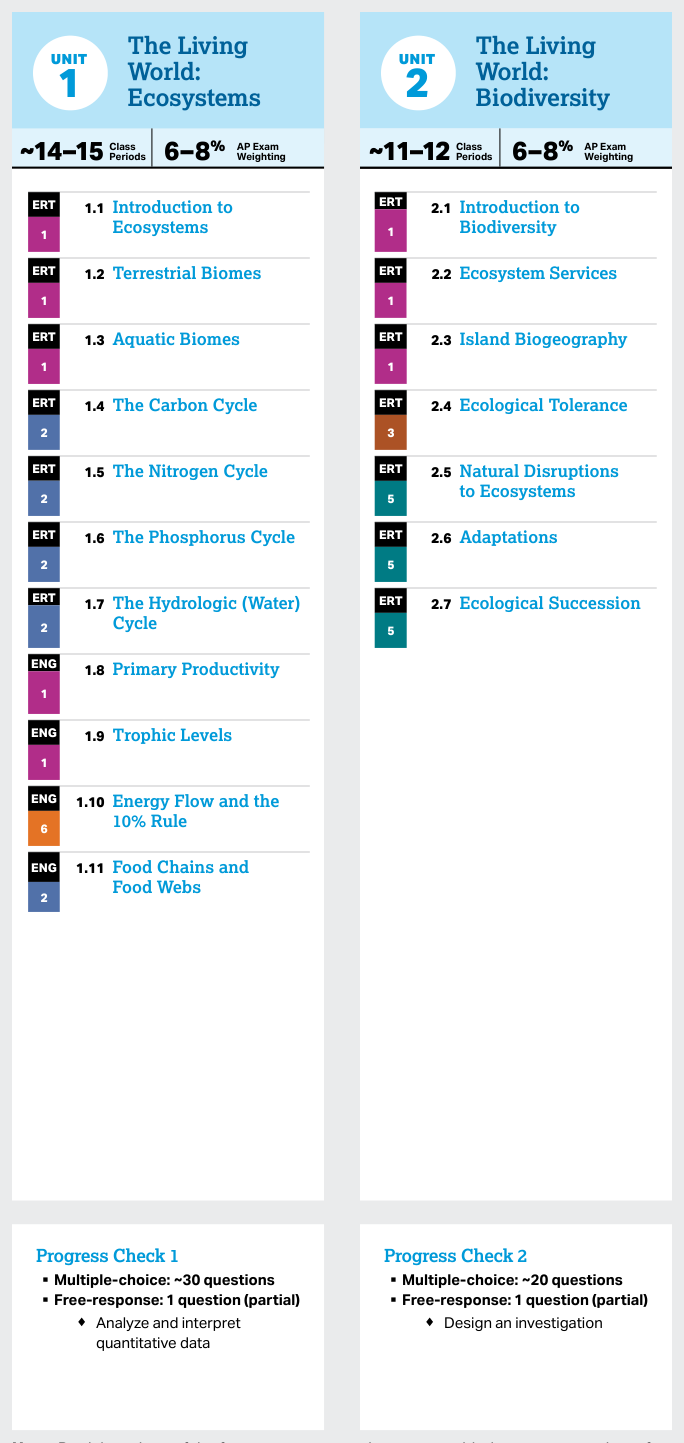
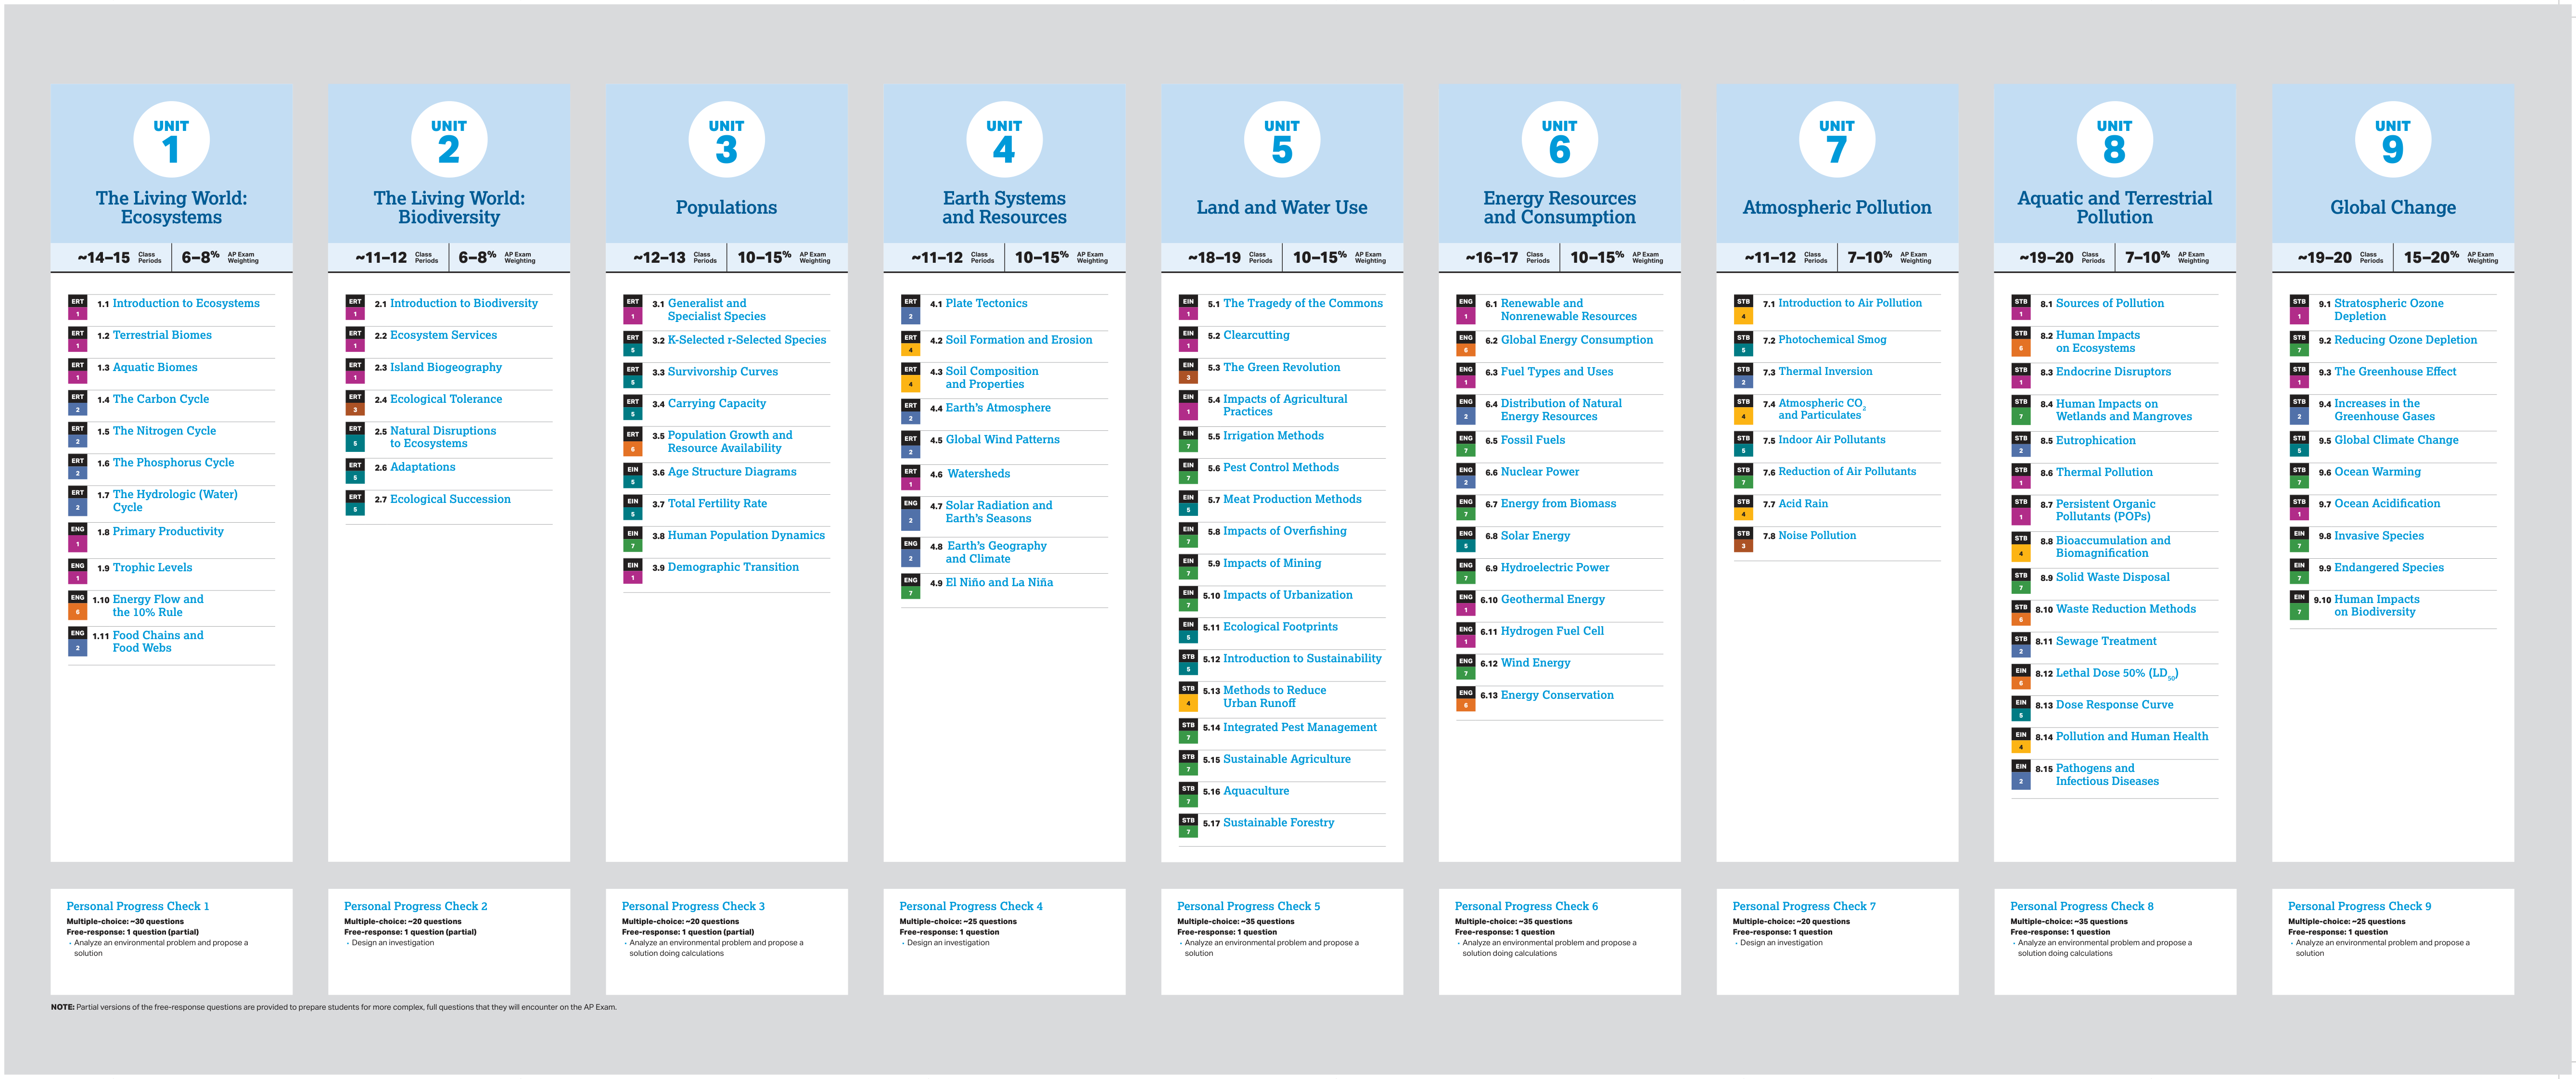
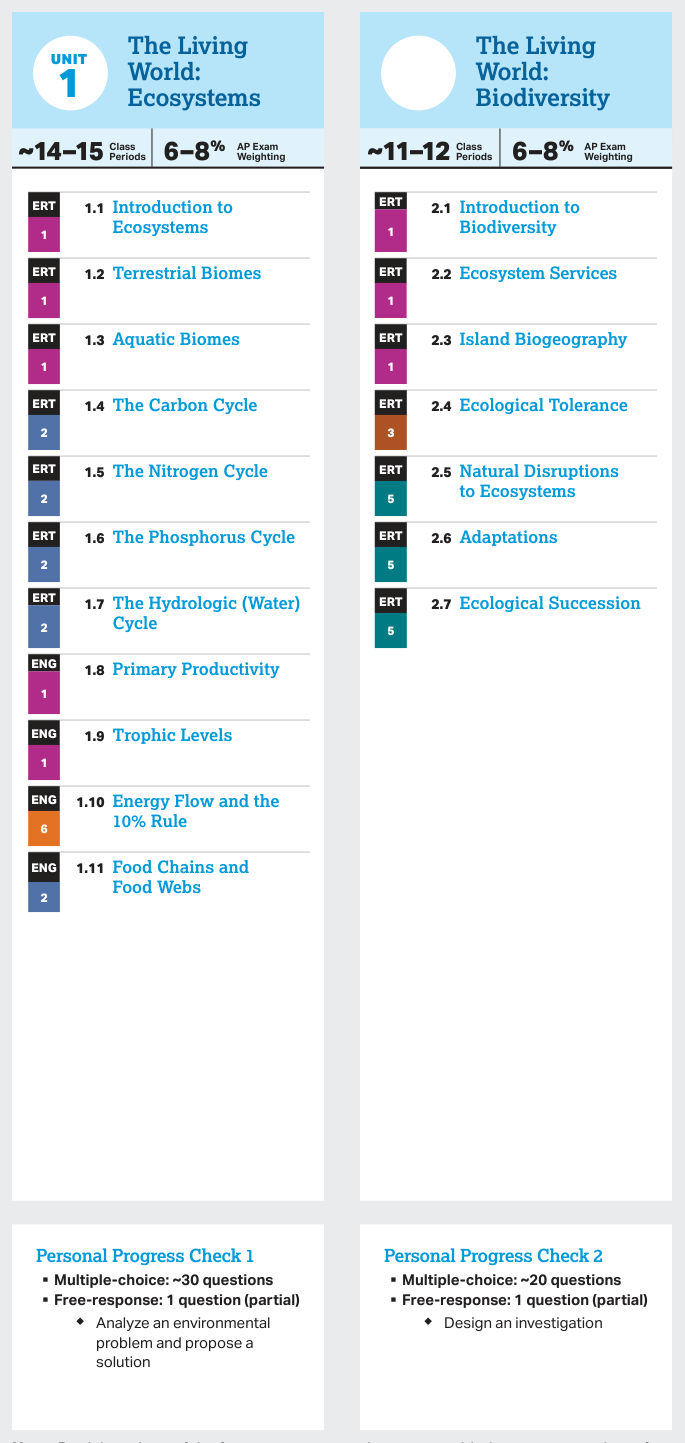
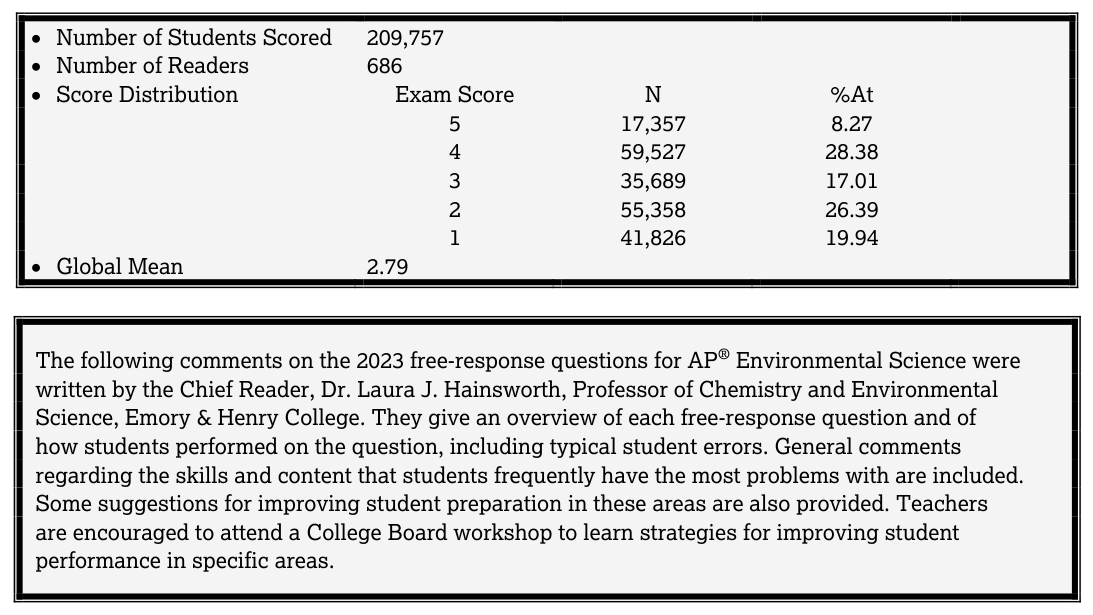
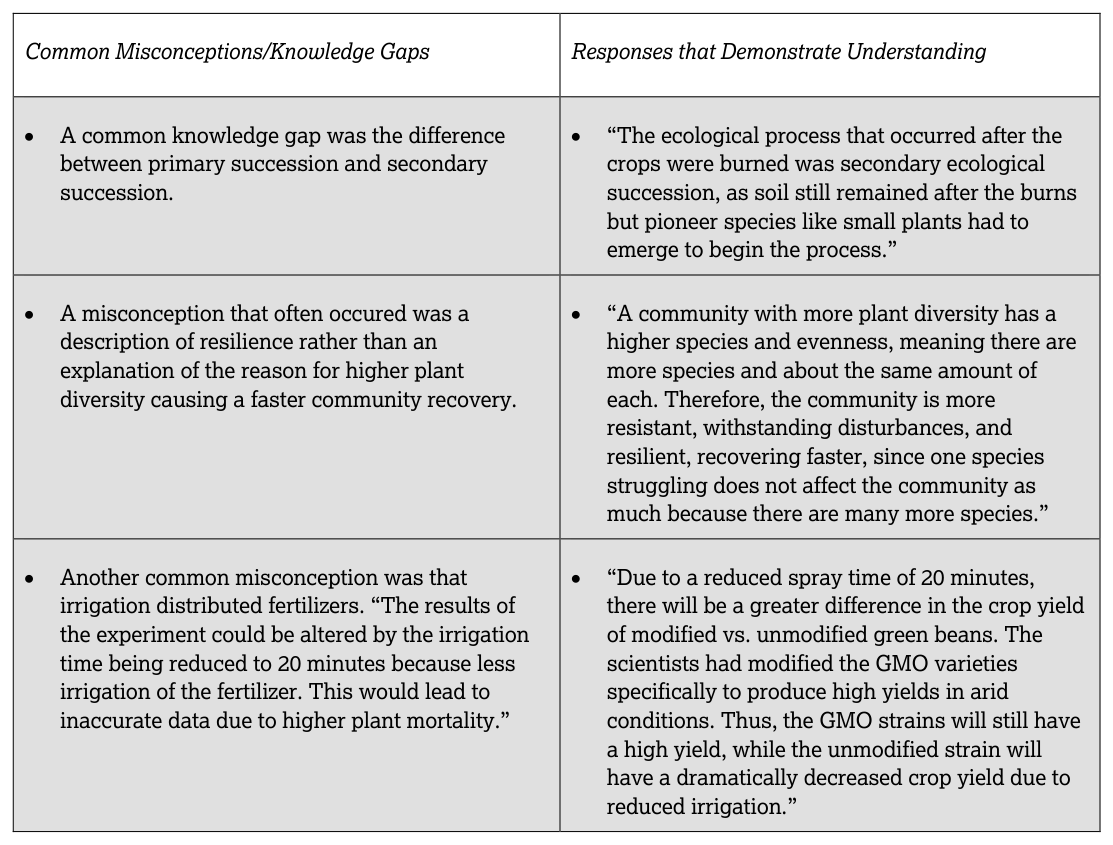
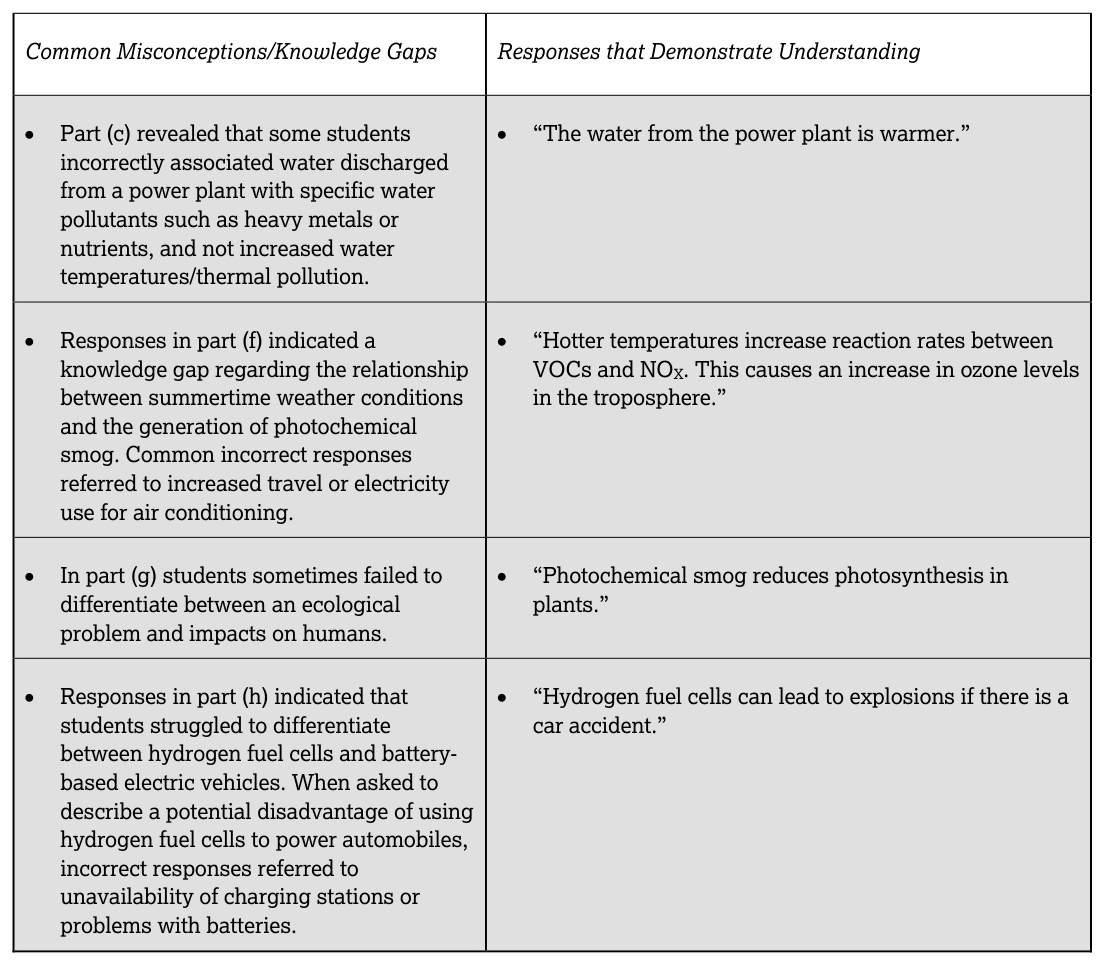
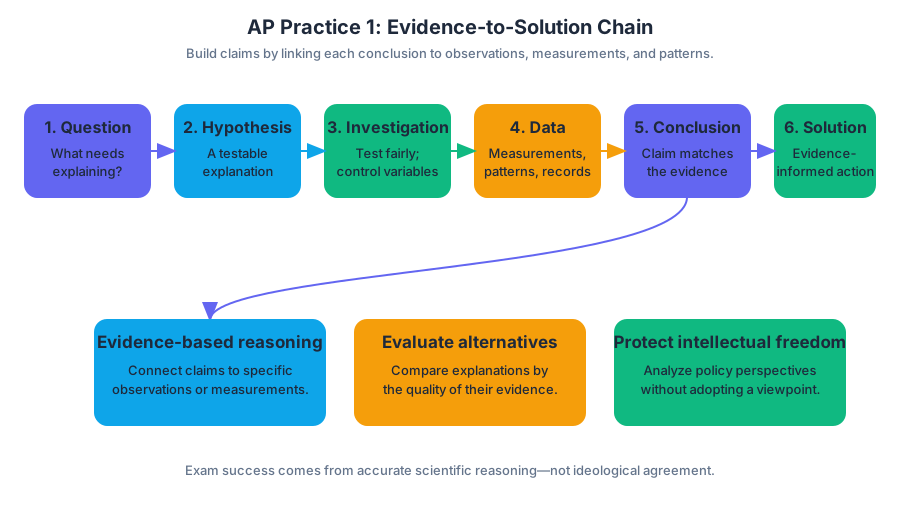
AP Practice 2
Key concepts: Biogeochemical cycles · Energy acquisition and transfer into usable forms · Human impacts on Earth-system cycles · Environmental science terminology · Patterns and trends in environmental data · Ecological services and ecological functions · Biodiversity and genetic diversity · Reproductive strategies of species · Invasive and endangered species · Evaluating environmental solutions and legislation
A wetland can be both a living machine and a public health safeguard: its plants capture energy, its soils store nutrients, and its standing water can either support biodiversity or create mosquito-breeding habitat when drainage and water movement are disrupted.
AP Practice 2
A wetland can be both a living machine and a public health safeguard: its plants capture energy, its soils store nutrients, and its standing water can either support biodiversity or create mosquito-breeding habitat when drainage and water movement are disrupted. A strong environmental analysis follows those connections through the system rather than treating each problem as an isolated fact.
Task type: Analyze an Environmental Problem and Propose a Solution
This original, unofficial practice task emphasizes Science Practice 1: Concept Explanation, Science Practice 2: Visual Representations, Science Practice 3: Text Analysis, Science Practice 5: Data Analysis, and Science Practice 7: Environmental Solutions. Allow about $22$ minutes, matching the approximate pacing for one of the three free-response questions. Write in complete sentences, label every part, show calculation work, and connect each claim to evidence.
Scenario and data
A coastal city replaces portions of a tidal wetland with roads and buildings. The remaining wetland becomes fragmented into smaller patches. Researchers measure air pollution, mosquito abundance, plant diversity, and mosquito-borne disease cases before and after development.
| Year | Wetland area ($ha$) | Average fine particulate concentration ($\mu g,m^{-3}$) | Plant species richness | Mosquitoes per trap | Disease cases |
|---|---|---|---|---|---|
| 1 | $820$ | $12$ | $34$ | $18$ | $6$ |
| 3 | $690$ | $16$ | $29$ | $31$ | $11$ |
| 5 | $510$ | $23$ | $21$ | $47$ | $19$ |
| 7 | $390$ | $28$ | $17$ | $63$ | $27$ |
(a) Identify the relationship between wetland area and mosquito abundance.
(b) Calculate the percent decrease in wetland area from Year $1$ to Year $7$.
(c) Describe one trend in the air-pollution data and identify one limitation that prevents the data from proving that wetland loss caused the trend.
(d) Explain how wetland loss and fragmentation could reduce both biodiversity and genetic diversity.
(e) Distinguish between an ecological function and an ecological service, giving one example of each for a wetland.
(f) Explain how energy enters and moves through the wetland ecosystem.
(g) Compare why an invasive mosquito species is more likely to spread successfully than an endangered wetland bird.
(h) Propose one solution that would reduce mosquito-borne disease while preserving wetland functions.
(i) Describe how legislation could develop to mitigate one environmental problem shown in the scenario.
Worked reasoning
(a) Relationship. Mosquito abundance increases as wetland area decreases: the two variables show a negative relationship. This is a description of an observed pattern, not automatically proof of causation.
(b) Calculation. Use
$$ \text{percent decrease}=\frac{\text{initial value}-\text{final value}}{\text{initial value}}\times 100 $$
$$ \text{percent decrease}=\frac{820-390}{820}\times 100 =\frac{430}{820}\times 100\approx 52.4% $$
The wetland area decreased by approximately $52.4%$. A response that gives only the number, without showing the setup when work is requested, is less defensible.
(c) Trend and limitation. Fine particulate concentration rises from $12$ to $28\ \mu g,m^{-3}$, an increase of $16\ \mu g,m^{-3}$. However, the study does not establish causation because vehicle traffic, construction activity, wind direction, or regional pollution could also have changed during the seven-year period. A controlled comparison with a similar undeveloped wetland would strengthen the inference.
(d) Biodiversity connection. Wetland loss removes habitat, so fewer species can survive; fragmentation further isolates populations and reduces movement between patches. Small isolated populations are more vulnerable to inbreeding, genetic drift, and random loss of alleles. Therefore, genetic diversity can decline even before a species disappears entirely. Reduced genetic variation leaves populations with fewer traits that might help them adapt to disease, temperature change, or altered water quality.
(e) Key distinction. An ecological function is a process performed by an ecosystem, such as wetland plants slowing water flow or microorganisms decomposing organic matter. An ecological service is a benefit people receive from that function, such as reduced flooding, water filtration, recreation, or disease-risk reduction. The function is the ecological process; the service is the human-relevant benefit. Confusing the two is a common vocabulary error.
(f) Energy flow. Producers capture light energy through photosynthesis and store it as chemical energy in organic molecules. Herbivores acquire some of that energy by feeding on plants, predators acquire some through feeding relationships, and organisms use cellular respiration to convert chemical energy into usable cellular energy. Energy transfer is not perfectly efficient: much is released as heat at each trophic transfer, while matter such as carbon and nitrogen cycles through the ecosystem.
(g) Reproductive strategies. An invasive mosquito is likely to spread because it may reproduce rapidly, mature early, produce many offspring, and tolerate a broad range of conditions. An endangered wetland bird is more likely to have a slower, $K$-selected strategy: fewer offspring, delayed maturity, and substantial parental investment. Those traits can support competitive individuals but make population recovery slow after habitat loss.
(h) Solution. The city could restore connected wetland patches while removing isolated pools that hold stagnant water near homes, using targeted biological or physical mosquito control rather than broad-spectrum pesticide application. This approach addresses disease risk while preserving filtration, flood reduction, habitat, and energy-flow functions. Monitoring should compare mosquito abundance, disease cases, native species richness, and water quality before and after implementation.
(i) Legislation pathway. A government could first require monitoring that documents wetland loss, pollution, and disease risk. Scientists and residents could then present the evidence during a rulemaking process; lawmakers or agencies could establish wetland-protection zones, development permits, runoff standards, and restoration requirements. The policy should include enforcement, funding, and periodic evaluation so that new data can reveal whether the intervention works.
Misconception check
A rising mosquito count does not by itself prove that mosquitoes caused the disease increase, just as declining wetland area does not by itself prove that every biodiversity change came from development. Strong responses identify a trend, cite the relevant variables, acknowledge alternative explanations, and propose a testable solution.
Error-review routine
After completing the task, mark each response as trend, calculation, mechanism, definition, evidence limitation, or solution. For every missed point, rewrite the answer using the pattern: claim → evidence or mechanism → environmental consequence. Ask whether you distinguished function from service, explained genetic diversity rather than only species richness, and traced energy from sunlight to chemical energy to cellular use.

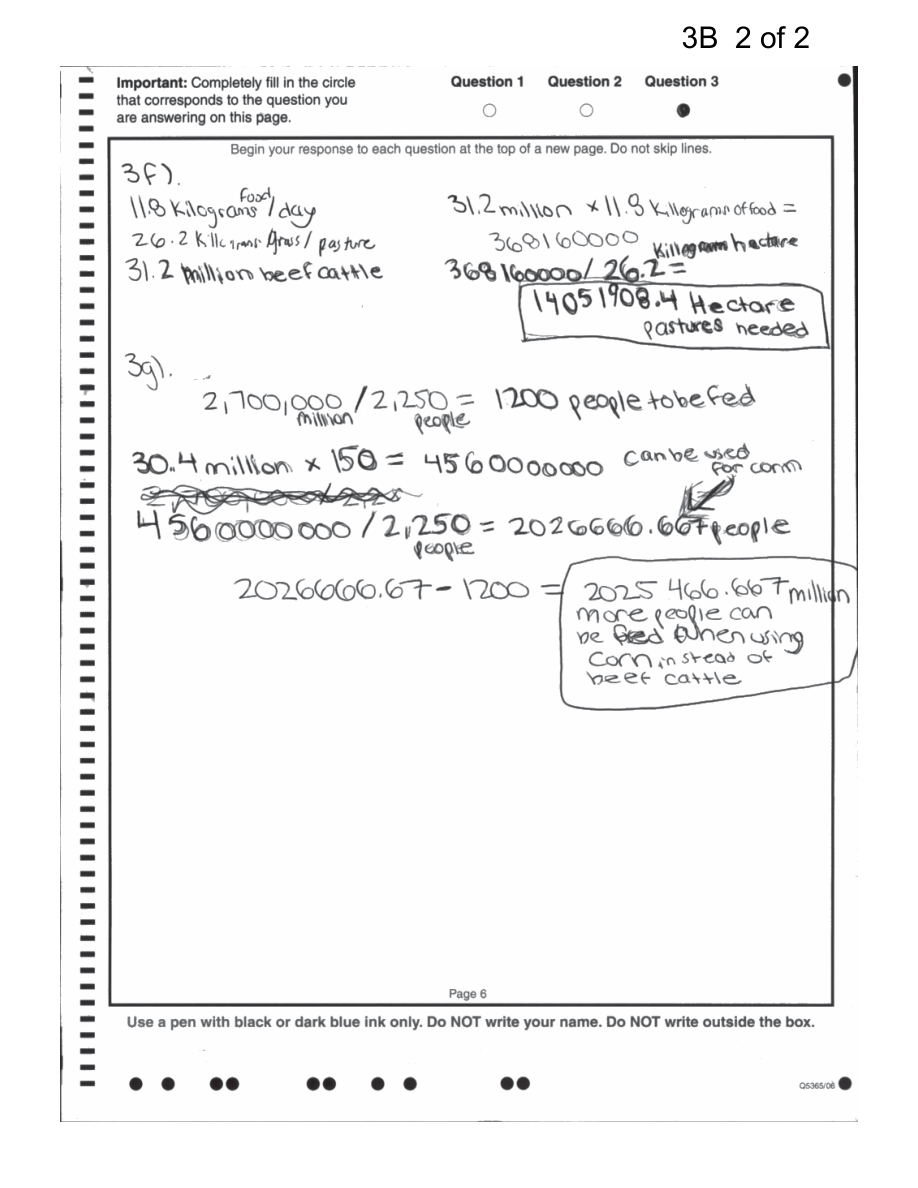
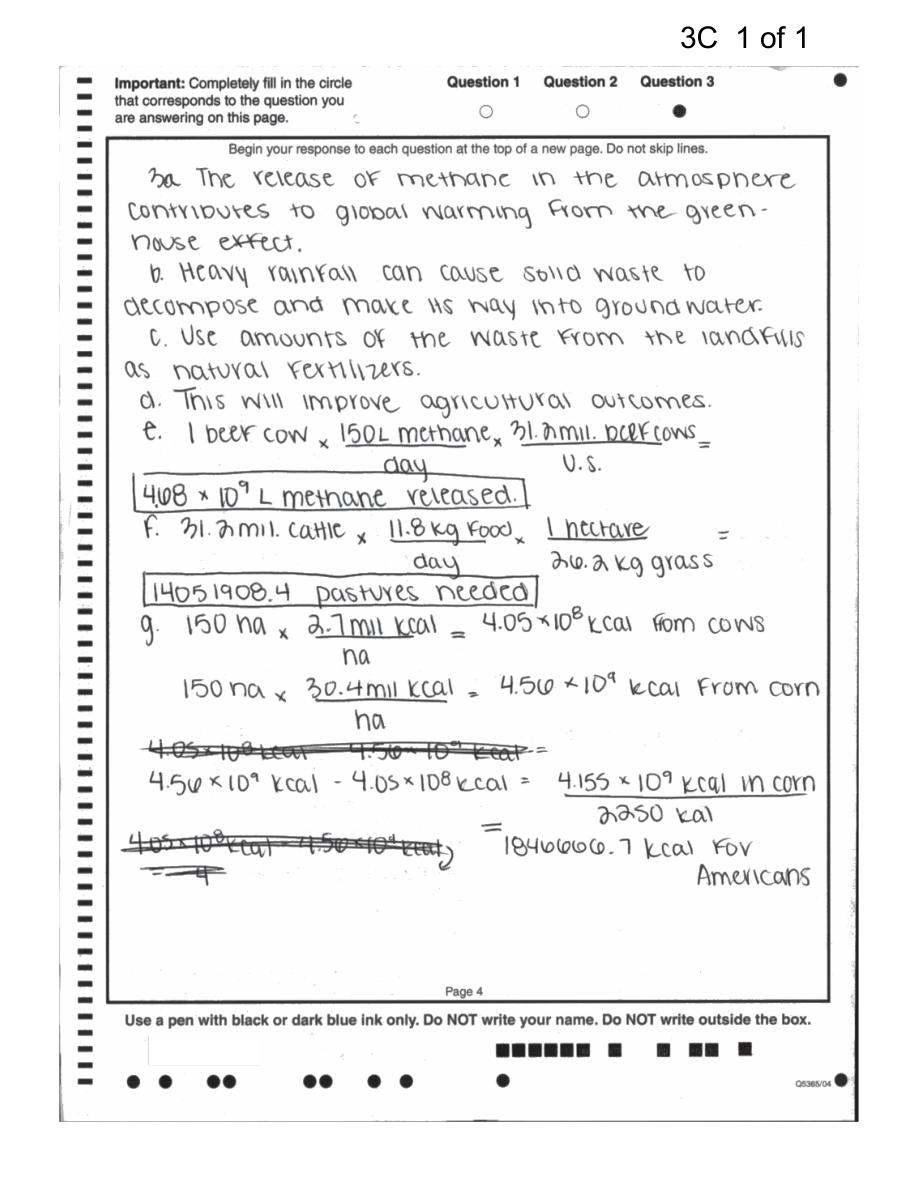
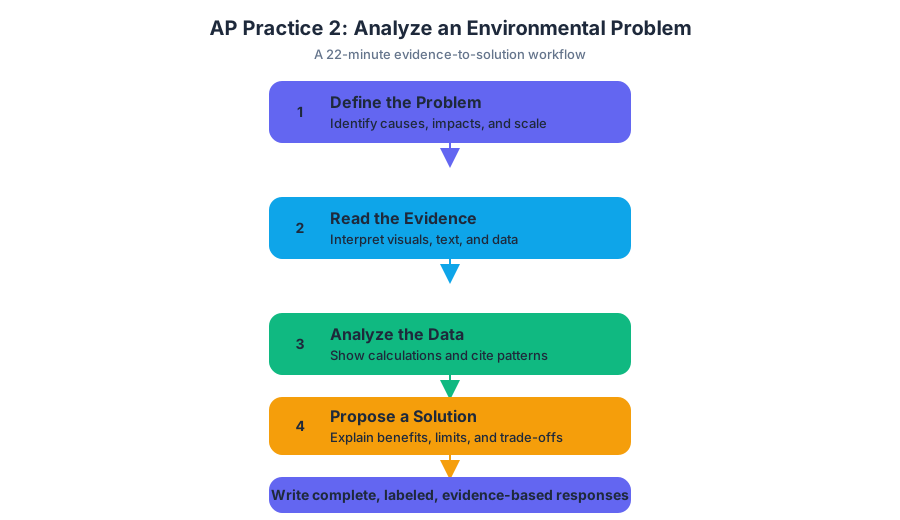
AP Practice 3
A nitrate-rich runoff pulse can transform a clear stream into an oxygen-starved system because nutrient enrichment increases algal production, and decomposition of that algal biomass consumes dissolved oxygen.
AP Practice 3
A nitrate-rich runoff pulse can transform a clear stream into an oxygen-starved system because nutrient enrichment increases algal production, and decomposition of that algal biomass consumes dissolved oxygen.
This practice set targets quantitative data interpretation, a free-response task that combines Science Practice 5: Data Analysis, Science Practice 6: Mathematical Routines, Science Practice 1: Concept Application, and Science Practice 7: Environmental Solutions. The scenario is original and unofficial.
Exam conditions
Allow approximately 23 minutes for this question when practicing as part of a $70$-minute, three-question free-response section. Use a calculator when helpful, but show the setup, substitution, and units for every calculation.
The strongest responses do not merely report that two variables changed together. They identify the pattern, calculate accurately, connect the pattern to an environmental mechanism, and propose a solution whose mechanism matches the pollutant.
Scenario and data
A reservoir receives drainage from an agricultural watershed. Researchers sampled the reservoir during three periods: before heavy rainfall, shortly after rainfall, and several days later. The measured variables were nitrate concentration, algal biomass, and dissolved oxygen concentration.
| Sampling period | Nitrate concentration ($\text{mg/L}$) | Algal biomass ($\text{mg/L}$) | Dissolved oxygen ($\text{mg/L}$) |
|---|---|---|---|
| Before rainfall | $2.0$ | $12$ | $8.4$ |
| Two days after rainfall | $10.0$ | $40$ | $3.1$ |
| Seven days after rainfall | $7.0$ | $55$ | $1.8$ |
The reservoir’s fish require at least $5.0\ \text{mg/L}$ of dissolved oxygen for normal activity. Oxygen concentrations below this value create stressful conditions; still lower concentrations can produce hypoxia, meaning abnormally low dissolved oxygen, or anoxia, meaning nearly absent dissolved oxygen.
Practice prompt
(a) Identify the period with the greatest nitrate concentration and state the relationship between nitrate concentration and dissolved oxygen concentration across the three sampling periods.
(b) Calculate the percent increase in nitrate concentration from before rainfall to two days after rainfall. Show your work.
(c) Describe the sequence of ecological processes that most plausibly explains the decrease in dissolved oxygen after nitrate concentration increased.
(d) Propose one treatment improvement at the agricultural site that would reduce the risk of oxygen depletion in the reservoir. Explain the mechanism by which the improvement reduces nitrate delivery or downstream oxygen consumption.
Worked reasoning
Part (a): Interpret the data
The greatest nitrate concentration occurred two days after rainfall, at $10.0\ \text{mg/L}$. Across the three sampling periods, nitrate concentration and dissolved oxygen show an inverse relationship: as nitrate concentration increased from $2.0$ to $10.0\ \text{mg/L}$, dissolved oxygen decreased from $8.4$ to $3.1\ \text{mg/L}$; as nitrate later declined to $7.0\ \text{mg/L}$, dissolved oxygen declined further to $1.8\ \text{mg/L}$.
The final sentence matters because it prevents an over-simple answer. Dissolved oxygen did not immediately recover when nitrate decreased. The algal biomass continued increasing from $40$ to $55\ \text{mg/L}$, so oxygen consumption could continue even after the nitrate peak had passed.
Scoring target: one point for identifying the correct sampling period and one point for describing the inverse pattern with data support. A response that says only “the variables are related” is weaker because it does not specify the direction of the relationship.
Part (b): Calculate percent increase
Use the percent-change equation:
$$ \text{Percent increase}
\frac{\text{new value} - \text{original value}}{\text{original value}} \times 100 $$
Substitute the nitrate values:
$$ \text{Percent increase}
\frac{10.0\ \text{mg/L} - 2.0\ \text{mg/L}} {2.0\ \text{mg/L}} \times 100
\frac{8.0}{2.0}\times 100
400% $$
The nitrate concentration increased by $400%$. It became five times its original value, but “five times as large” is not the same as a $500%$ increase: the original $100%$ is included in the final amount, so the increase is $400%$.
Scoring target: one point for the correct setup and one point for the correct answer with appropriate units or percent notation. Units cancel during the ratio, so the final result is reported as a percentage rather than $\text{mg/L}$.
Part (c): Explain the mechanism
The complete causal chain is:
$$ \text{nitrate input} \rightarrow \text{algal growth} \rightarrow \text{decomposition} \rightarrow \text{dissolved-oxygen consumption} \rightarrow \text{hypoxia or anoxia} $$
Rainfall can wash nitrate fertilizer from agricultural land into the reservoir. Because nitrogen is a limiting nutrient in some aquatic systems, the additional nitrate stimulates algal growth. When algae die, decomposers break down the organic matter; their cellular respiration consumes dissolved oxygen, causing the oxygen concentration to fall. Fish and other aerobic organisms are then stressed or displaced as hypoxia develops.
Scoring target: earn credit by connecting nitrate to algal growth and connecting decomposition to oxygen consumption. Simply stating that “nitrate uses oxygen” is incomplete: nitrate directly acts as a nutrient, while decomposer respiration is the major step that consumes oxygen in this eutrophication pathway.
Part (d): Propose an effective solution
One effective improvement is to establish or widen a vegetated riparian buffer between crop fields and drainage channels. Dense vegetation slows surface runoff, increases infiltration, and takes up dissolved nitrate before the water reaches the reservoir. Lower nitrate delivery reduces excessive algal growth; less algal biomass later decomposes, so decomposers consume less dissolved oxygen.
A different valid improvement would be to apply fertilizer according to soil-test results and avoid fertilizing immediately before predicted rainfall. This reduces excess nitrate available for runoff at the moment when stormwater would otherwise transport it rapidly into the reservoir.
Scoring target: one point for naming a plausible treatment improvement and one point for explaining its mechanism. “Use less fertilizer” earns stronger credit when the response explains how the change reduces nitrate runoff and the later oxygen demand.
Misconception check
Misconception: “More nitrate directly suffocates fish.” Nitrate enrichment can initiate eutrophication, but the oxygen crisis is produced mainly through the linked process of algal growth, algal death, and decomposer respiration. Also, nitrate concentration and dissolved oxygen are correlated in these observations, but the causal explanation comes from the ecological mechanism, not from the graph alone.
Error-review routine
After completing the question, label each missed point as one of four error types: data reading, mathematical setup, mechanism, or solution mechanism. Then rewrite only the sentence that would have earned the missing point. For part (c), recite the complete chain: nitrate input → algal growth → decomposition → dissolved-oxygen consumption → hypoxia or anoxia.
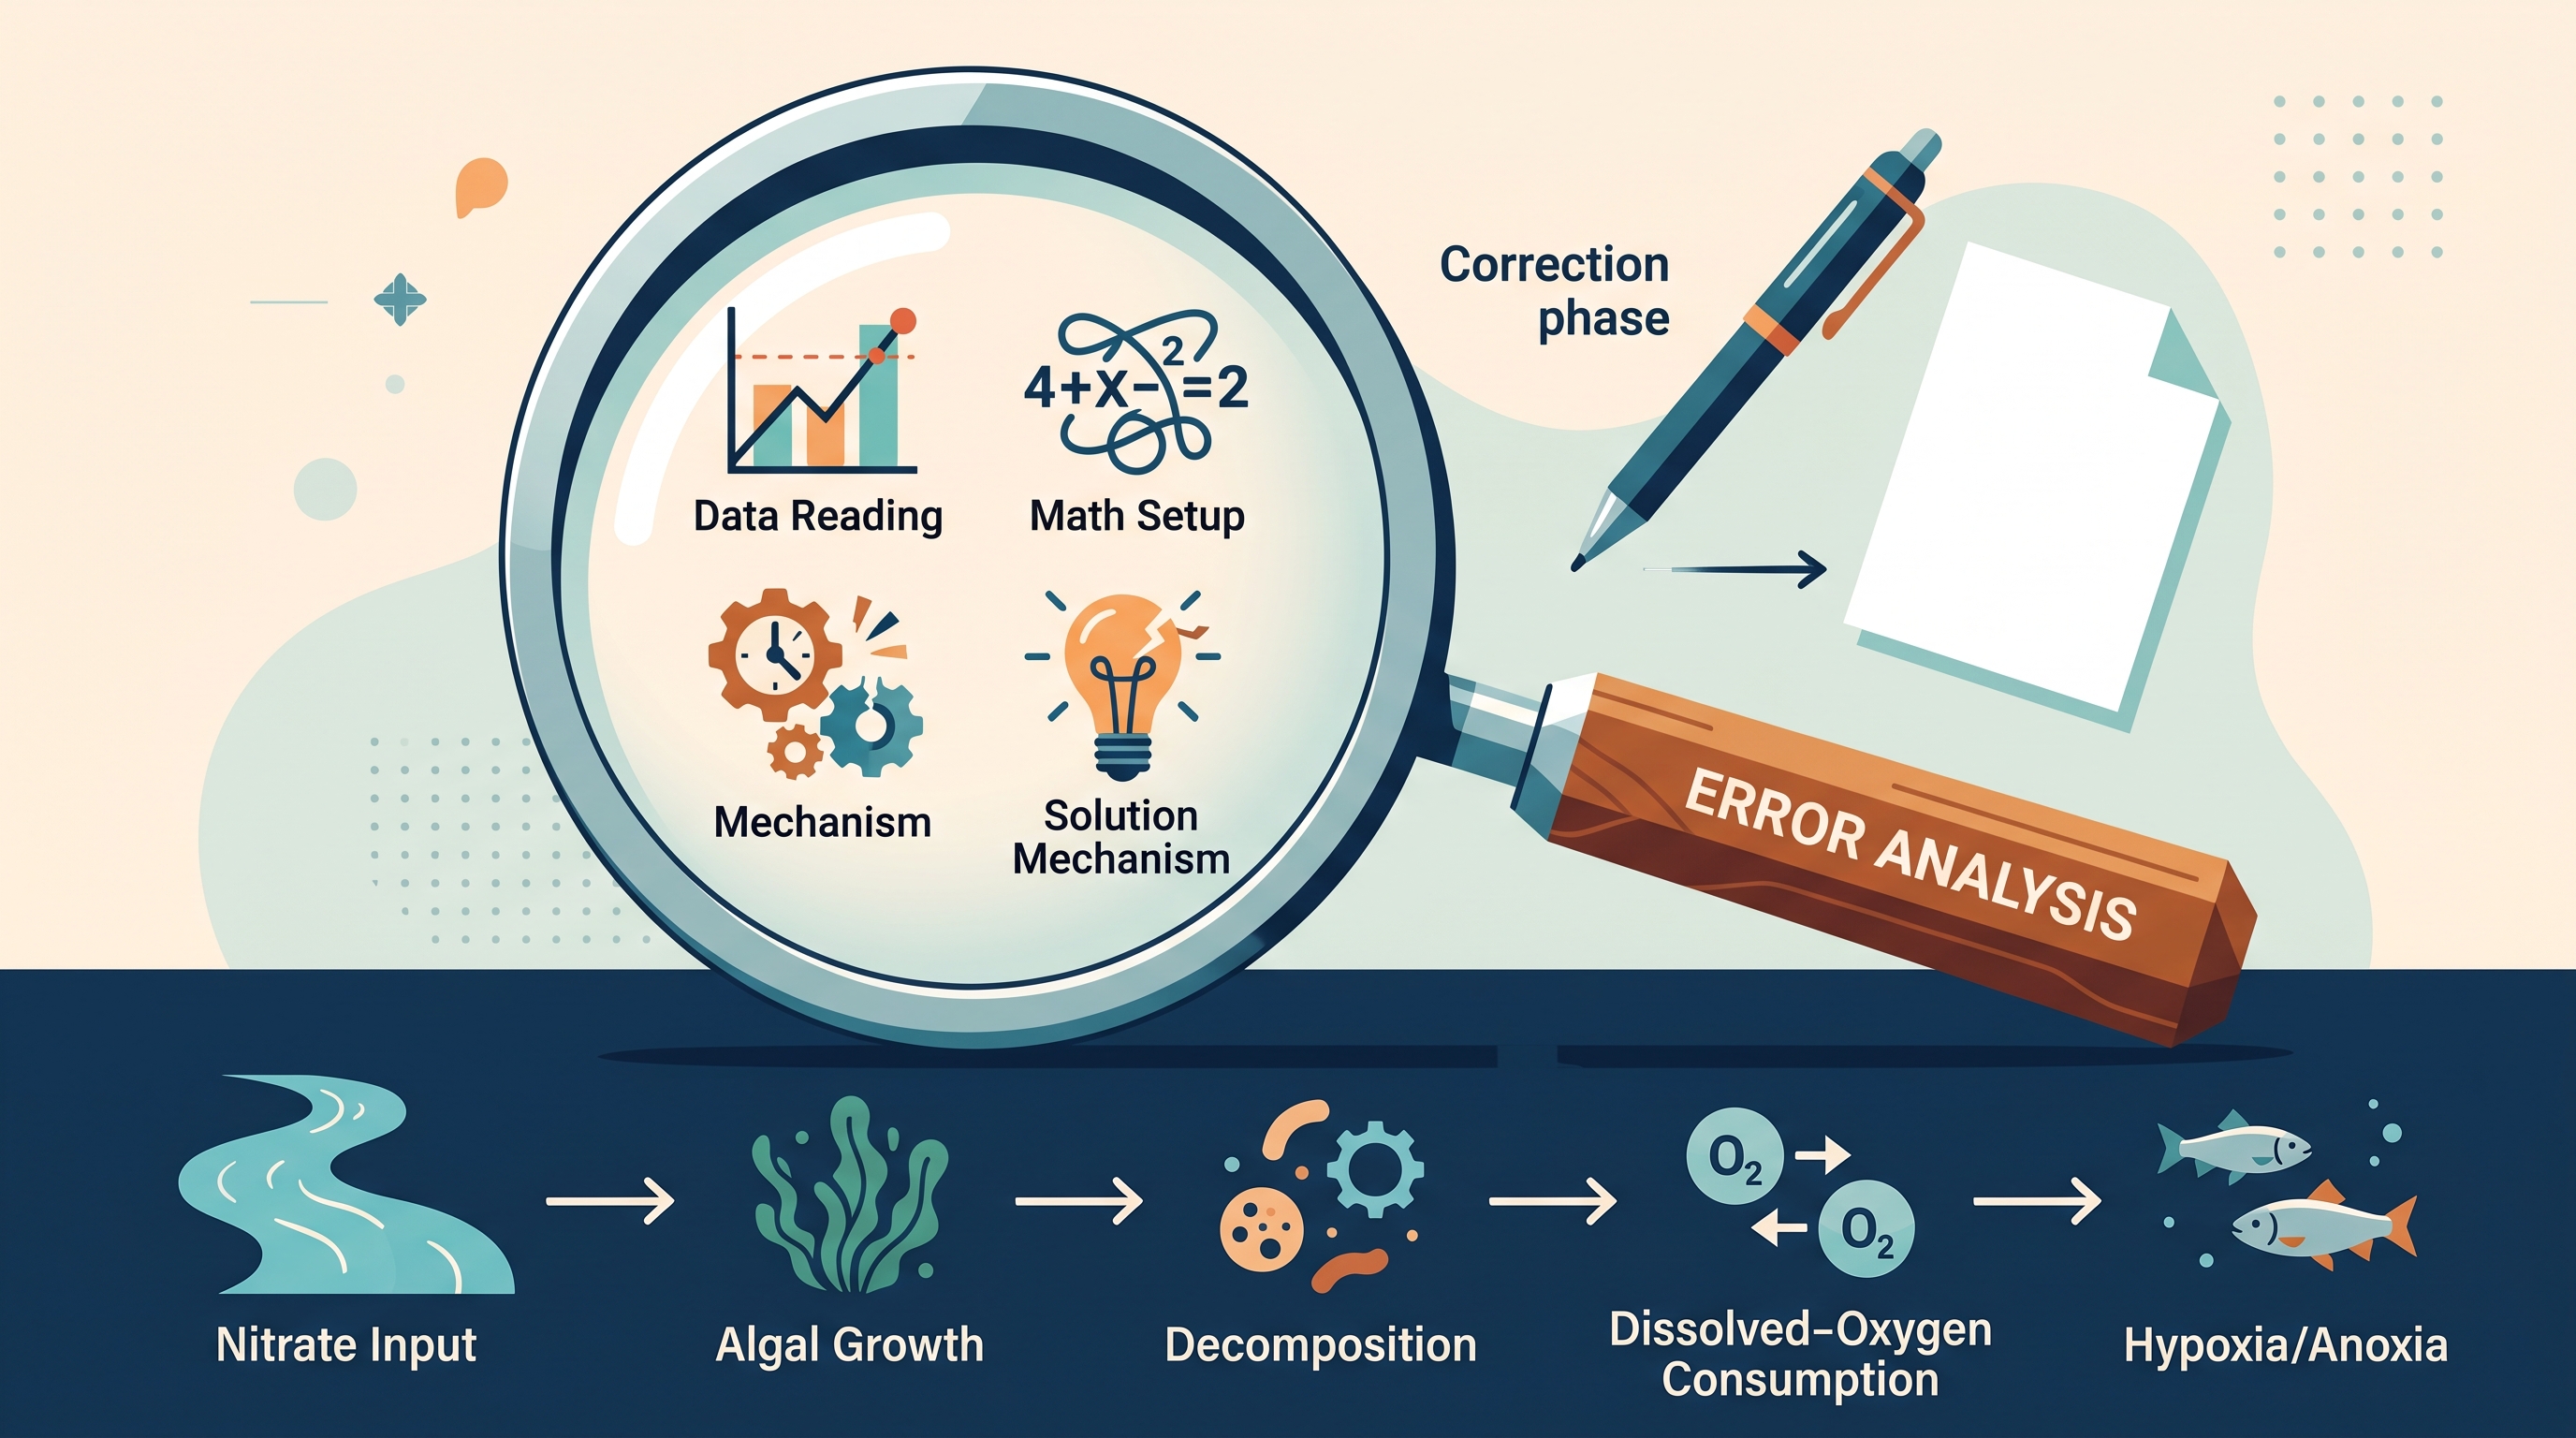
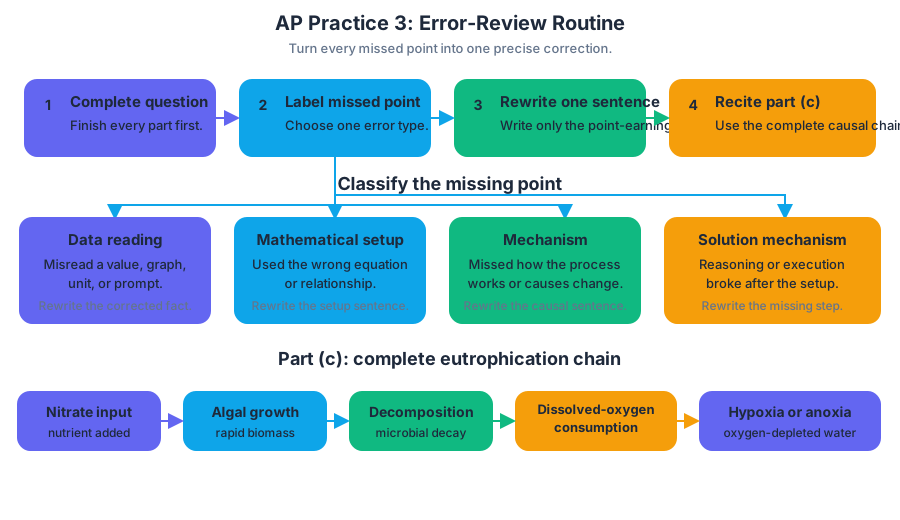
AP Practice 4
A strong AP Environmental Science data response does more than identify a trend: it uses evidence from a graph or table, performs the required calculation, and connects the result to an environmental mechanism.
AP Practice 4
A strong AP Environmental Science data response does more than identify a trend: it uses evidence from a graph or table, performs the required calculation, and connects the result to an environmental mechanism. This practice targets the quantitative data interpretation and calculations task type in the free-response section.
Exam context: The current AP Environmental Science exam includes a free-response section with three questions in $70$ minutes. A practical target for one data-focused question is approximately $23$ minutes, including reading, calculating, and checking units. The task below is original and unofficial.
The investigation: runoff from two watersheds
A city compares nitrate pollution from two watersheds after a storm. Watershed A contains restored wetlands; Watershed B contains mostly paved surfaces and storm drains. Researchers measure nitrate concentration in stream water and stream discharge at four times after rainfall.
| Time after storm | Watershed A nitrate concentration ($mg/L$) | Watershed A discharge ($L/s$) | Watershed B nitrate concentration ($mg/L$) | Watershed B discharge ($L/s$) |
|---|---|---|---|---|
| $1$ hour | $2.0$ | $80$ | $5.0$ | $140$ |
| $3$ hours | $1.5$ | $55$ | $4.0$ | $100$ |
| $6$ hours | $1.0$ | $35$ | $3.0$ | $65$ |
| $12$ hours | $0.7$ | $20$ | $2.0$ | $40$ |
Key relationship: Nitrate concentration describes how much nitrate is present per unit volume of water. Nitrate load describes the total rate at which nitrate moves downstream:
$$\text{nitrate load} = \text{nitrate concentration} \times \text{discharge}$$
Because $1\ mg/L$ multiplied by $1\ L/s$ equals $1\ mg/s$, the resulting load is measured in $mg/s$.
Practice prompt
(a) Calculate the nitrate load for Watershed A at $1$ hour after the storm. Show your setup and include units.
(b) Identify the relationship between time after the storm and nitrate concentration in Watershed B.
(c) Using the data, explain why Watershed B may deliver a greater total amount of nitrate to the stream even if its concentration later declines.
(d) Calculate the percentage by which Watershed B’s nitrate concentration exceeds Watershed A’s concentration at $3$ hours.
(e) Propose one environmental solution that could reduce nitrate delivery from Watershed B. Explain the mechanism by which the solution would work.
Worked reasoning
(a) Calculate a nitrate load
Use the concentration and discharge recorded for Watershed A at $1$ hour:
$$\text{load} = (2.0\ mg/L)(80\ L/s)$$
$$\text{load} = 160\ mg/s$$
The units are important: liters cancel, leaving $mg/s$. A response that gives only $160$ without units is incomplete because it does not identify whether the value represents concentration, mass, or rate.
(b) Interpret the trend
Watershed B’s nitrate concentration decreases as time after the storm increases: it falls from $5.0\ mg/L$ at $1$ hour to $2.0\ mg/L$ at $12$ hours. This is a negative relationship, or inverse trend, over the measured period.
(c) Distinguish concentration from total delivery
Watershed B has both higher nitrate concentrations and higher discharges than Watershed A at every recorded time. At $1$ hour, for example:
$$\text{Watershed B load}=(5.0\ mg/L)(140\ L/s)=700\ mg/s$$
Although the concentration later decreases, flowing water continues to transport nitrate. A high discharge can maintain a large nitrate load even when concentration is lower. This distinction is central: concentration is intensity per volume; load is the mass transported per time.
(d) Calculate percentage difference
At $3$ hours, Watershed B measures $4.0\ mg/L$ and Watershed A measures $1.5\ mg/L$. The percentage by which B exceeds A is:
$$\frac{4.0-1.5}{1.5}\times 100 = 166.7%$$
Watershed B’s nitrate concentration is therefore approximately $167%$ greater than Watershed A’s at $3$ hours. The denominator is Watershed A because A is the comparison baseline.
(e) Propose and justify a solution
One effective solution would be to install constructed wetlands or vegetated riparian buffers between paved areas and the stream. Vegetation slows runoff, increases infiltration, and allows soil microorganisms to remove nitrate through denitrification. The intervention addresses both major pathways shown by the data: excess runoff and elevated nitrate transport.
A vague answer such as “reduce pollution” does not explain the environmental mechanism. A high-scoring proposed solution identifies a specific action and connects it to a process that lowers nitrate concentration, discharge, or both.
What the examiner is looking for
| Response move | Evidence of successful reasoning |
|---|---|
| Calculation | Correct substitution, arithmetic, and units |
| Trend interpretation | Direction of change supported by at least two data values |
| Data-based explanation | Uses both concentration and discharge rather than discussing only one |
| Percentage calculation | Correct baseline and percentage format |
| Environmental solution | Specific intervention plus a scientifically valid mechanism |
Misconception check
Misconception: “A lower concentration always means less pollution.” Not necessarily. If discharge increases substantially, the stream can carry a greater nitrate load. For example, $2.0\ mg/L$ at $140\ L/s$ produces $280\ mg/s$, while $5.0\ mg/L$ at $40\ L/s$ produces only $200\ mg/s$.
Error-review routine
After completing a data-response question, check four things: Did you answer every lettered part? Did every calculation show a setup and units? Did each trend claim cite numerical evidence? Did every proposed solution include a mechanism? Mark the first point at which your reasoning failed—reading the table, choosing the equation, calculating, interpreting, or explaining—and redo only that step before reviewing the full answer.
Retrieval check
If discharge doubles while nitrate concentration stays constant, what happens to nitrate load? The load doubles, because:
$$\text{load} = \text{concentration} \times \text{discharge}$$
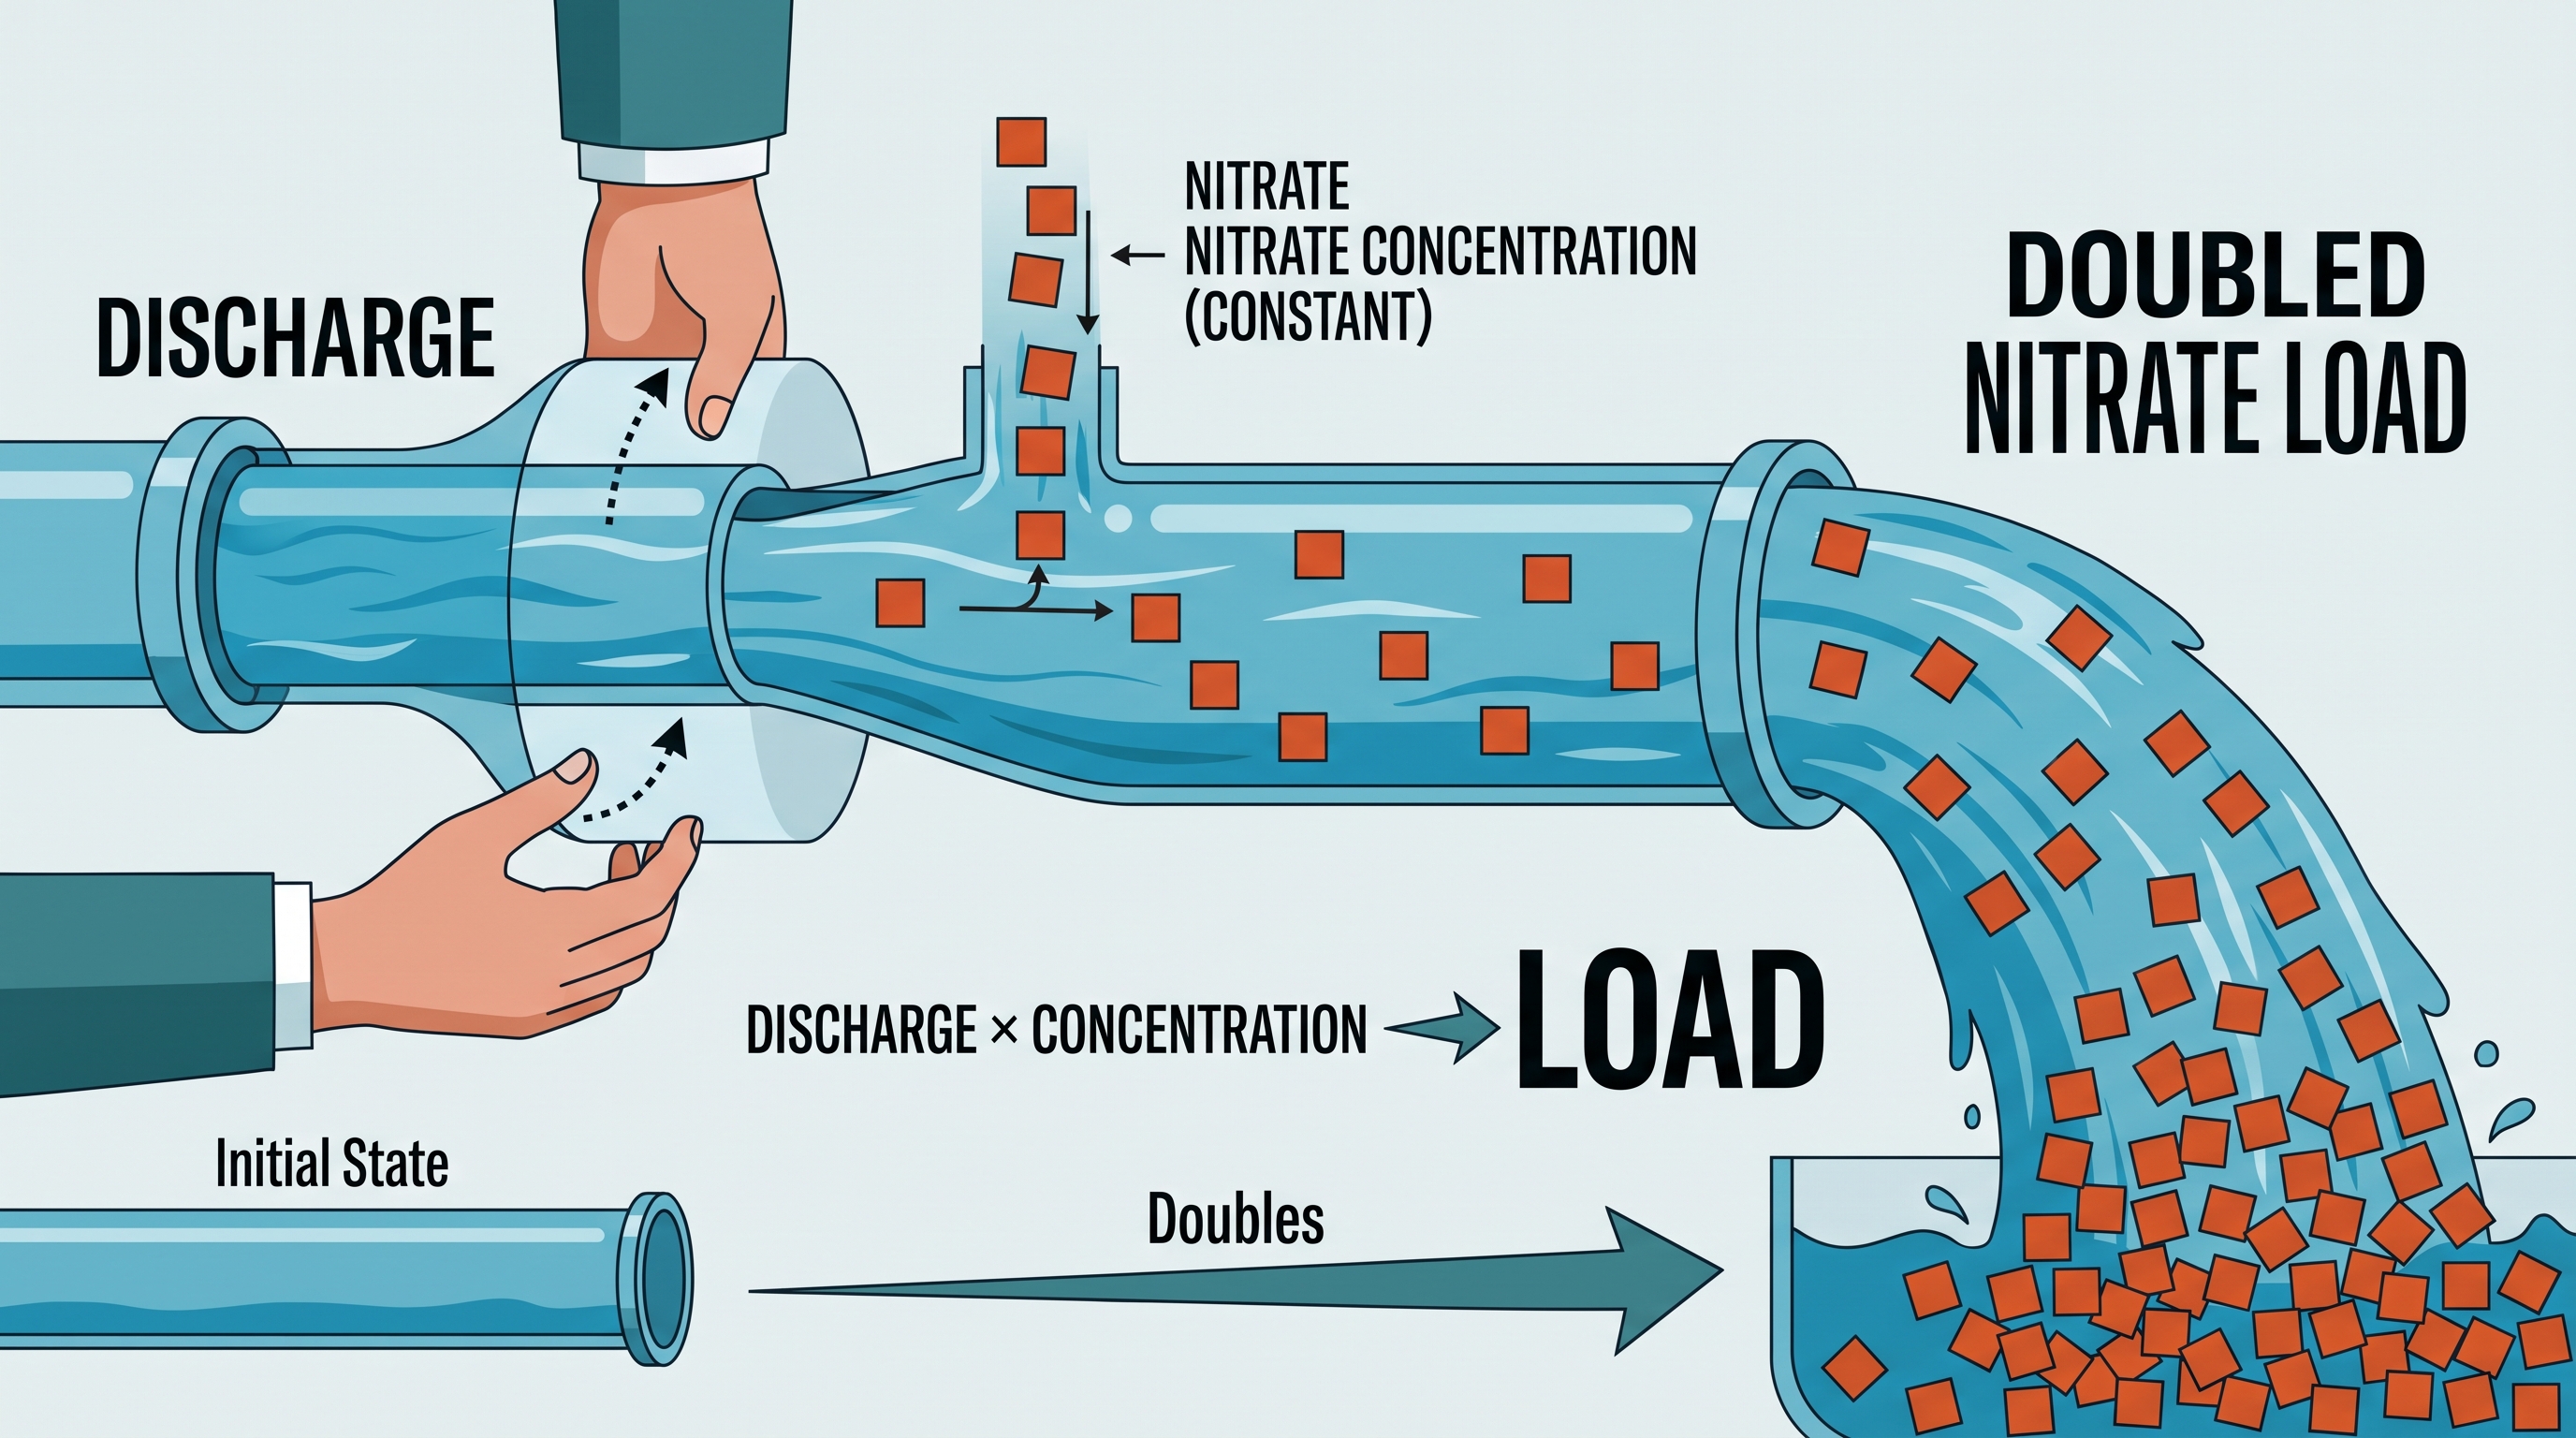
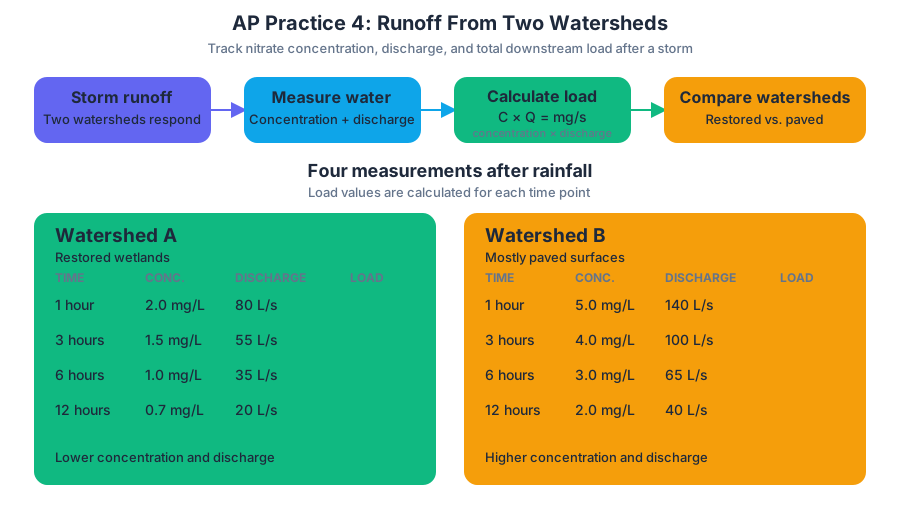
AP Practice 5
A lake receiving excess fertilizer can become biologically productive at first and biologically stressed soon afterward because algal growth and decomposition alter dissolved oxygen.
AP Practice 5
A lake receiving excess fertilizer can become biologically productive at first and biologically stressed soon afterward because algal growth and decomposition alter dissolved oxygen.
Task type: Quantitative data interpretation
This practice targets the free-response task type that asks you to interpret environmental data, perform calculations, and connect a numerical pattern to an ecological mechanism. The scenario combines Science Practice 5: Data Analysis, Science Practice 6: Mathematical Routines, Science Practice 1: Concept Application, and Science Practice 7: Environmental Solutions.
Suggested timing: Work for approximately $20$–$23$ minutes without looking at the solution. Reserve the last $2$ minutes to check units, arithmetic, and whether every explanation includes a mechanism rather than merely repeating the data.
Original practice scenario
A shallow freshwater lake lies downstream from agricultural fields. After heavy rainfall, dissolved phosphorus from fertilizer enters the lake. Researchers establish four enclosed experimental sections with similar initial conditions. Each section receives a different phosphorus concentration and is monitored for seven days.
| Phosphorus concentration in water ($mg/L$) | Algal biomass after seven days ($mg/L$) | Dissolved oxygen at dawn after seven days ($mg/L$) |
|---|---|---|
| $0.02$ | $4$ | $8.4$ |
| $0.06$ | $13$ | $6.9$ |
| $0.12$ | $28$ | $4.8$ |
| $0.20$ | $31$ | $3.1$ |
Questions
(a) Identify the relationship between phosphorus concentration and algal biomass shown in the data.
(b) Calculate the percentage decrease in dissolved oxygen between the section receiving $0.02\ mg/L$ phosphorus and the section receiving $0.20\ mg/L$ phosphorus. Show your setup.
(c) Use the data and an ecological mechanism to explain why the section with the greatest algal biomass has the lowest dissolved oxygen concentration at dawn.
(d) Describe one limitation of using these enclosed sections to predict conditions in the entire lake.
(e) Propose one management practice that could reduce the likelihood of oxygen depletion in the lake. Explain how the practice addresses the phosphorus source.
Worked solution
(a) Interpret the relationship
As phosphorus concentration increases from $0.02\ mg/L$ to $0.12\ mg/L$, algal biomass increases from $4\ mg/L$ to $28\ mg/L$. Biomass then increases only slightly, from $28\ mg/L$ to $31\ mg/L$, when phosphorus rises to $0.20\ mg/L.
A complete response identifies a positive relationship with a leveling-off pattern. Phosphorus appears to limit algal growth at lower concentrations, but another factor may become limiting at higher concentrations. The response should not claim that algal biomass increases indefinitely.
Scoring target — data interpretation: State the direction of the relationship and describe the important pattern in the data, including the reduced increase at the highest phosphorus concentration.
(b) Calculate percentage decrease
Use the initial dissolved oxygen concentration as the denominator:
$$ \text{Percentage decrease}
\frac{\text{initial value} - \text{final value}}{\text{initial value}} \times 100 $$
Substitute the values:
$$ \text{Percentage decrease}
\frac{8.4\ mg/L - 3.1\ mg/L}{8.4\ mg/L} \times 100 $$
$$
\frac{5.3}{8.4}\times 100 \approx 63.1% $$
The dissolved oxygen concentration decreased by approximately $63%$. A response that gives the correct number but omits the setup may lose the calculation point if the scoring criterion requires supporting work.
Scoring target — mathematical routine: Use the correct initial-value denominator, show the calculation, and report a reasonable rounded result with units or a clear percentage label.
(c) Explain the mechanism
Phosphorus stimulates algal growth, producing a large algal population. When algae die, bacteria decompose the organic matter; bacterial cellular respiration consumes dissolved oxygen. At night, algae and other organisms also respire without photosynthetic oxygen production, so oxygen concentration is especially low at dawn.
This is an example of eutrophication, the enrichment of a body of water with nutrients that can produce excessive biological growth and oxygen depletion. The data support the mechanism: the highest algal biomass, $31\ mg/L$, occurs with the lowest dawn dissolved oxygen, $3.1\ mg/L$.
Scoring target — concept application: Connect nutrient enrichment to algal growth, decomposition or respiration, and oxygen consumption. Merely stating “more algae means less oxygen” is incomplete because it does not identify the process causing the decrease.
(d) Identify a limitation
The enclosed sections may not reproduce the lake’s mixing, water flow, depth, temperature variation, species composition, or nutrient inputs. Therefore, the measured response may not represent the response of the entire lake.
A strong limitation names both the experimental difference and its consequence. For example, “The sections restrict water movement, so oxygen may decline more rapidly inside them than in the open lake” is stronger than “The experiment is not realistic.”
Scoring target — experimental interpretation: Identify a specific limitation that could affect the generalizability of the results.
(e) Propose a solution
Farmers could establish vegetated buffer strips between cropland and the lake. Plant roots and soil can retain or absorb phosphorus before runoff enters surface water, reducing nutrient delivery and the resulting algal growth.
Other defensible answers include applying fertilizer according to soil-test results, reducing fertilizer application before heavy rainfall, or improving erosion-control practices. The response must explain the pathway from the practice to reduced phosphorus input; naming a solution without that connection is not enough.
Scoring target — environmental solution: Propose a feasible practice and explain how it reduces the environmental cause or prevents the harmful effect.
Misconception check: “High algal biomass always means high oxygen”
Algae produce oxygen through photosynthesis during daylight, but the entire community consumes oxygen through cellular respiration. After algal cells die, decomposition can consume enough oxygen to create hypoxic conditions. Thus, a lake can show abundant algae at the surface while organisms below the surface experience oxygen stress.
Error-review routine
After completing the task, classify each missed or weak response:
- Pattern error: You described only one data point instead of the overall trend.
- Denominator error: You divided by the final value rather than the initial value.
- Mechanism error: You named eutrophication but did not explain decomposition or respiration.
- Generalization error: You gave a vague limitation without identifying its effect.
- Solution-link error: You proposed an action but did not connect it to phosphorus reduction.
For a second attempt, cover the solution, rewrite each response using a specific datum, a process, and—where relevant—a unit. The goal is not merely to obtain $63%$; it is to show how evidence, mathematics, ecological reasoning, and an intervention form one defensible environmental argument.
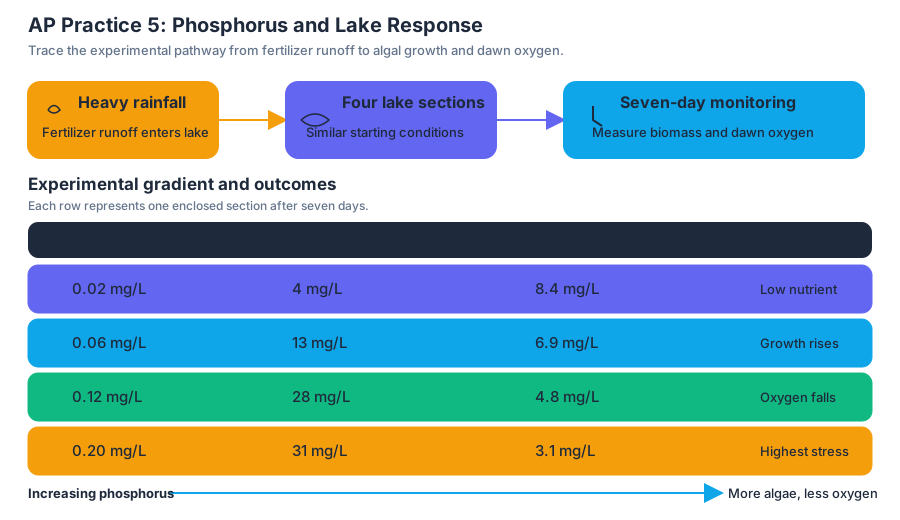
AP Practice 6
A strong environmental solution does more than name a desirable action: it identifies a specific problem, explains the environmental mechanism causing it, evaluates trade-offs, and predicts how the proposal could be measured.
AP Practice 6
A strong environmental solution does more than name a desirable action: it identifies a specific problem, explains the environmental mechanism causing it, evaluates trade-offs, and predicts how the proposal could be measured. This practice targets the free-response task type that asks you to propose an environmental solution using evidence and scientific reasoning.
Targeted science practices
This task most directly develops Science Practice 7: Environmental Solutions, while also requiring Science Practice 1: Concept Application, Science Practice 2: Visual Representations, Science Practice 5: Data Analysis, and Science Practice 6: Mathematical Routines.
| Science Practice | How it appears in this task |
|---|---|
| Science Practice 1: Concept Application | Apply eutrophication, nutrient cycling, and dissolved-oxygen concepts to a watershed problem. |
| Science Practice 2: Visual Representations | Interpret a runoff diagram or convert a proposed intervention into a causal flow. |
| Science Practice 5: Data Analysis | Use monitoring data to identify the most serious pollution source and support a proposal. |
| Science Practice 6: Mathematical Routines | Calculate a percentage change or nutrient-load reduction. |
| Science Practice 7: Environmental Solutions | Propose a feasible action, explain its mechanism, and evaluate environmental and social trade-offs. |
The solution-building chain
A reliable response follows the chain:
$$ \text{problem} \rightarrow \text{cause} \rightarrow \text{intervention} \rightarrow \text{mechanism} \rightarrow \text{evidence of success} \rightarrow \text{trade-off} $$
Do not jump directly from “pollution is bad” to “use more regulation.” The examiner rewards the connection between the proposal and the environmental process. For example, planting vegetation beside a stream is useful only if you explain that the roots stabilize soil and the vegetation slows runoff, allowing suspended sediment and dissolved nutrients to be retained before reaching the waterway.
Original practice task
A lake receives water from an agricultural watershed. During summer, the lake develops dense algal growth followed by fish deaths. Monitoring results are shown below.
| Sampling location | Nitrate concentration ($mg/L$) | Dissolved oxygen at dawn ($mg/L$) |
|---|---|---|
| Forested upstream area | $0.8$ | $8.4$ |
| Agricultural drainage ditch | $7.2$ | $6.1$ |
| Lake inlet | $5.9$ | $5.4$ |
| Open lake water | $3.1$ | $3.0$ |
(a) Identify the likely cause of the fish deaths.
(b) Propose one environmental solution that would reduce the problem.
(c) Explain the mechanism by which the proposed solution would improve lake conditions.
(d) The proposed solution is expected to reduce nitrate entering the lake from $5.9\ mg/L$ to $3.8\ mg/L$. Calculate the percentage decrease.
(e) Identify one limitation or trade-off associated with the solution and explain how it could be addressed.
Worked response
(a) Cause. The fish deaths are most likely caused by low dissolved oxygen resulting from eutrophication. Excess nitrate from agricultural drainage stimulates algal growth; when algae die, decomposers consume oxygen while breaking down the organic matter. The dawn dissolved-oxygen value of $3.0\ mg/L$ in the open lake indicates hypoxic conditions that can stress or kill fish.
(b) Solution. Establish a vegetated riparian buffer between agricultural fields and the drainage ditch. The buffer should contain dense perennial vegetation and be maintained along the portions of the watershed where runoff enters the ditch.
(c) Mechanism. Vegetation would slow surface runoff, increase infiltration, and absorb some nitrate through plant uptake. The buffer would therefore reduce the nitrate load reaching the lake. Less nitrate would limit algal production; less dead algal biomass would be decomposed, reducing oxygen consumption and increasing dissolved-oxygen concentration.
(d) Calculation.
$$ \text{Percentage decrease}
\frac{\text{initial concentration} - \text{final concentration}} {\text{initial concentration}} \times 100 $$
$$
\frac{5.9 - 3.8}{5.9}\times 100
35.6% $$
The nitrate concentration would decrease by approximately $36%$. A common scoring error is dividing by the final value, $3.8$, rather than the original value, $5.9$.
(e) Limitation and response. A riparian buffer removes land from agricultural production and may reduce short-term farm income. This limitation could be addressed through conservation payments, tax incentives, or assistance for farmers who install and maintain buffers. Monitoring nitrate and dawn dissolved oxygen before and after installation would test whether the intervention works.
What earns credit
An examiner-rewarded answer should contain these elements:
- a specific environmental problem, such as hypoxia caused by eutrophication;
- a feasible proposal rather than a vague command;
- a scientifically correct causal mechanism;
- a calculation with the correct setup, substitution, and units or percentage;
- one realistic limitation, stakeholder concern, or unintended effect;
- a method for measuring whether the solution succeeded.
Misconception check — “The algae directly use all the oxygen.” Algae generally produce oxygen during daylight photosynthesis. The major oxygen loss in this scenario occurs when decomposers respire while breaking down dead algal matter, especially when photosynthesis stops at night. That is why dawn measurements are especially informative.
Timing and error review
For a multi-part environmental-solutions free-response question, reserve roughly $20$–$25$ minutes. Spend the first $2$ minutes identifying the pollutant and process, then answer each lettered part directly; do not write a long introduction.
Afterward, label every missed point as one of four errors: content, evidence, calculation, or feasibility. Rewrite only the weakest sentence—for example, change “buffers stop pollution” to “buffers slow runoff and retain nutrients, reducing nitrate delivery to the lake.” That revision makes the mechanism observable, specific, and scientifically defensible.
Retrieval check
If nitrate entering a lake decreases but dawn dissolved oxygen does not increase, name one additional measurement you would collect and explain what it would reveal. A strong answer could identify chlorophyll concentration or algal biomass, because those data would show whether reduced nitrate actually decreased algal growth.
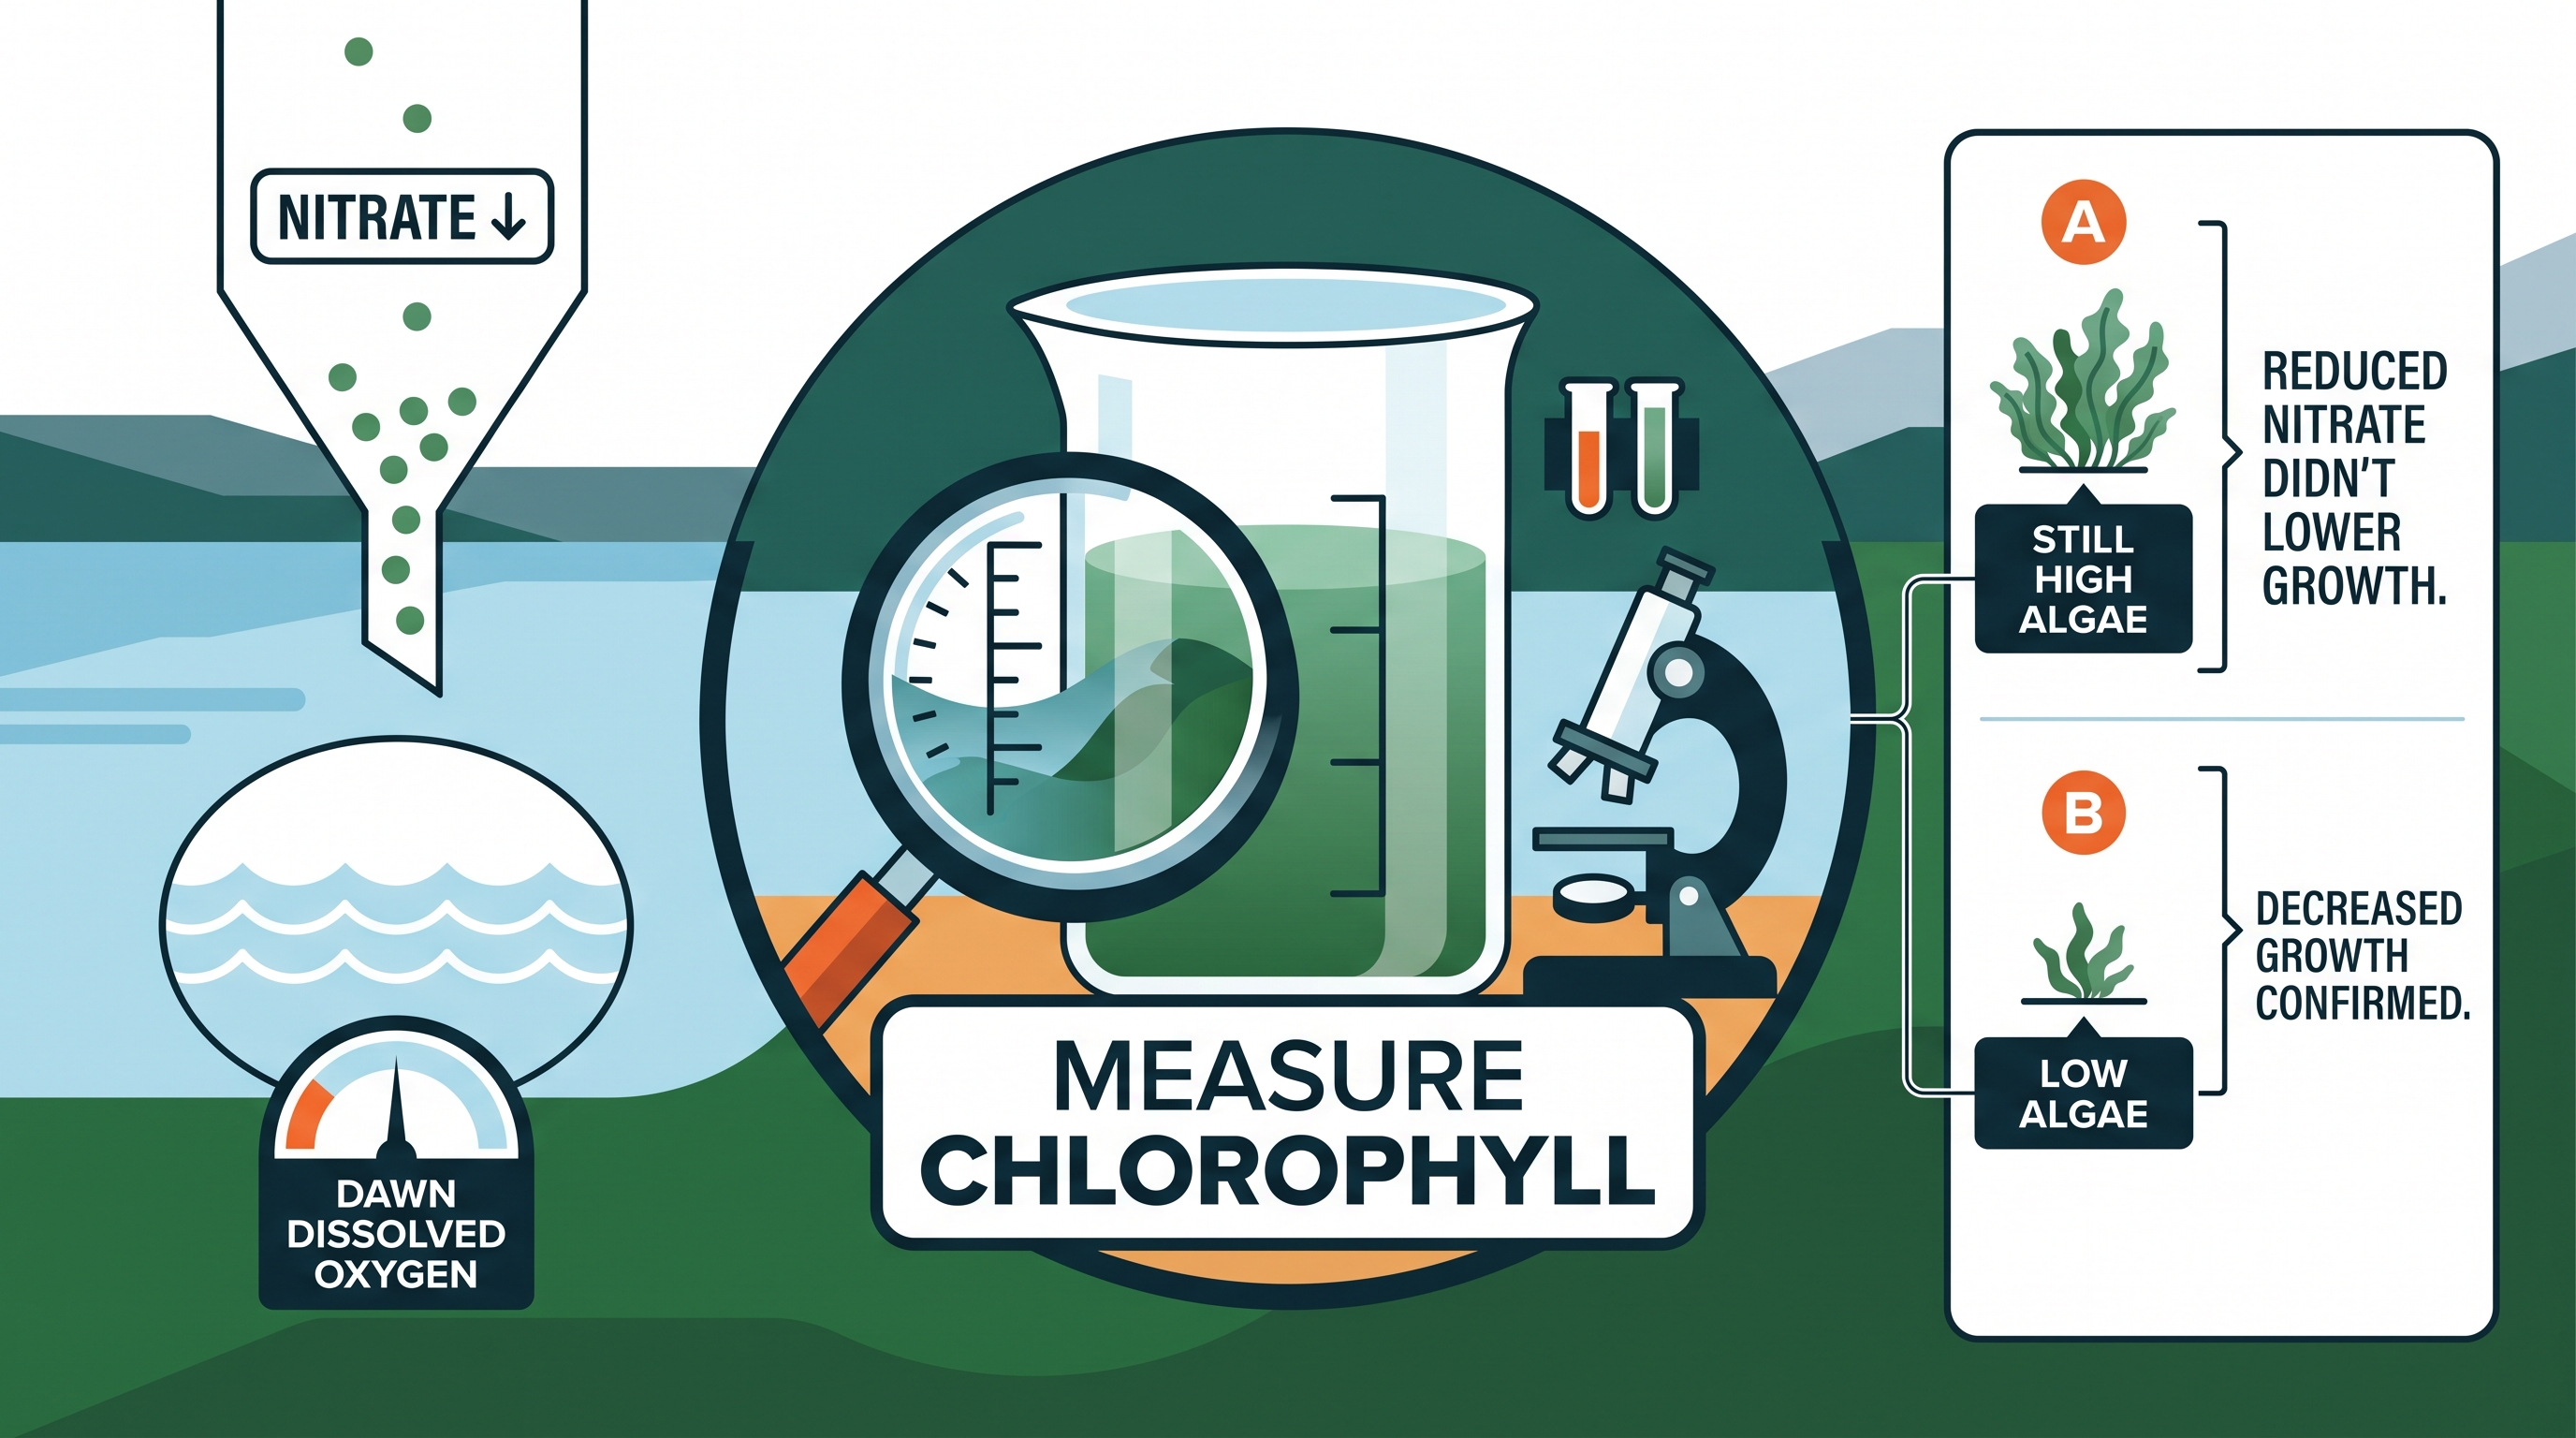
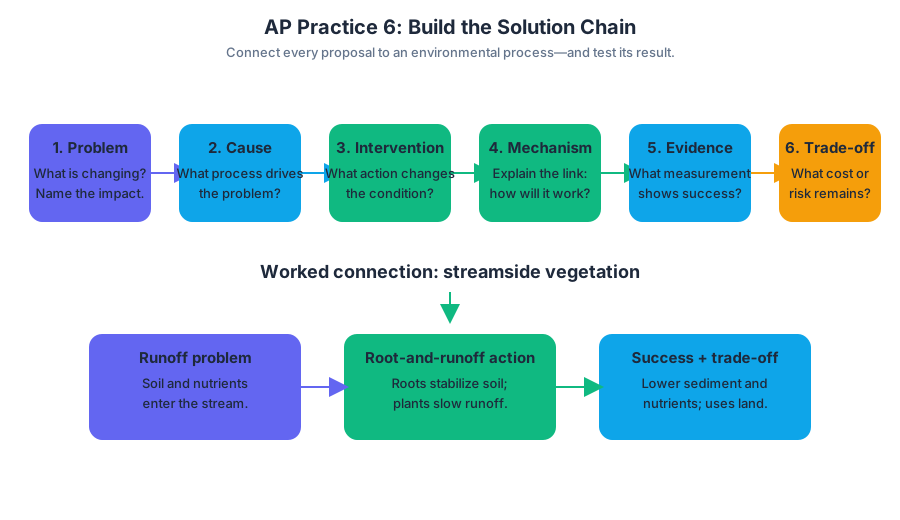
Source Materials
- AP Environmental Science Course and Exam Description
- Review the Clarifications (.pdf)
- AP Environmental Science Course Overview
- AP Environmental Science Course at a Glance
- AP Environmental Science Course at a Glance Poster
- AP Environmental Science
- AP Environmental Science
- AP Environmental Science Sample Syllabus 1
- Figure — AP Environmental Science Course and Exam Description (p. 1)
- Figure — AP Environmental Science Course and Exam Description (p. 17)
- Figure — AP Environmental Science Course and Exam Description (p. 25)
- AP Environmental Science Course and Exam Description Course Framework V.1 | 19
Study AP Environmental Science with AI — Free on Lykke
Sign up for free to generate personalized flashcards, quizzes, and study guides from this course. Chat with an AI tutor that knows the material.
Get Started FreeView this course wiki on Lykke · Browse all public course wikis