AP Biology
Institution: MIT
7 study materials · 67 sections
AP Biology students working the current College Board Course and Exam Description, including first-time students with no prior background, plus teachers reviewing the page for CED alignment.; Teach every official CED unit and every numbered topic at topic granularity.; Develop every AP skill / science-practice code explicitly and by name.; Replace description with teaching: worked contextual examples, named misconceptions, and in-flow retrieval checks.; Build an exam-practice unit covering every task type on the current exam.
Course Sections
Course Framework, Skills and Reasoning Processes
Key concepts: Course organization into eight biology units · Unit guides and suggested course sequence · AP Biology big ideas and crosscutting concepts · Science practices for analyzing biological information · Representing and describing data · Statistical tests and mathematical calculations · Scientific argumentation and justification of claims · Laboratory investigations and lab-program setup · Progress Checks and assessment reports · College-level content, skills, and reasoning processes
AP Biology is organized around one recurring question: How do biological systems store information, use energy, respond to change, evolve, and interact across levels of organization?
Course Framework, Skills and Reasoning Processes
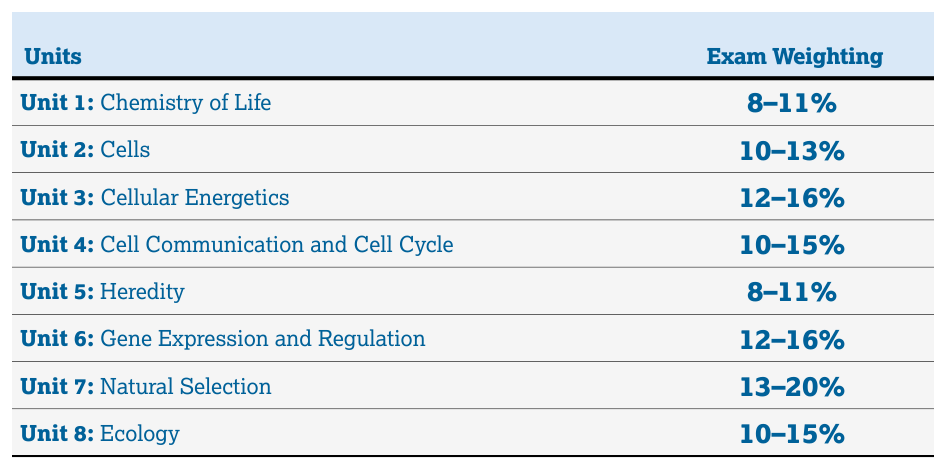
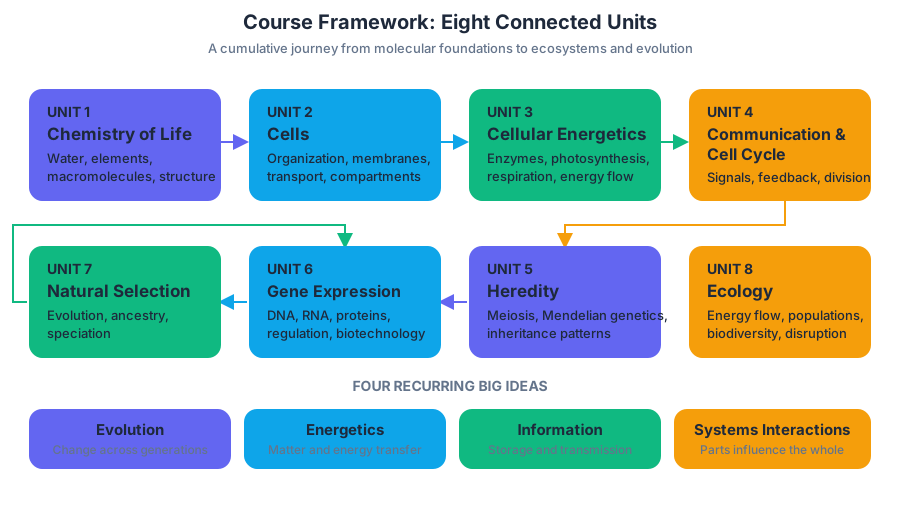
AP Biology is organized around one recurring question: How do biological systems store information, use energy, respond to change, evolve, and interact across levels of organization? The course follows eight connected units rather than eight isolated subjects.
| Unit | Central biological territory |
|---|---|
| Unit 1: Chemistry of Life | Water, elements, macromolecules, and biological structure |
| Unit 2: Cells | Cell organization, membranes, transport, and compartmentalization |
| Unit 3: Cellular Energetics | Enzymes, photosynthesis, respiration, and energy transfer |
| Unit 4: Cell Communication and Cell Cycle | Signaling, feedback, division, and cell-cycle regulation |
| Unit 5: Heredity | Meiosis, Mendelian genetics, and inheritance patterns |
| Unit 6: Gene Expression and Regulation | DNA, RNA, protein production, biotechnology, and specialization |
| Unit 7: Natural Selection | Evolutionary mechanisms, common ancestry, and speciation |
| Unit 8: Ecology | Energy flow, populations, communities, biodiversity, and ecosystem disruption |
The sequence is cumulative: chemistry supports cells; cells support energetics and communication; heredity and gene expression explain biological information; natural selection explains diversity; ecology examines interactions among organisms and their environments. The four recurring Big Ideas are Evolution, Energetics, Information Storage and Transmission, and Systems Interactions.
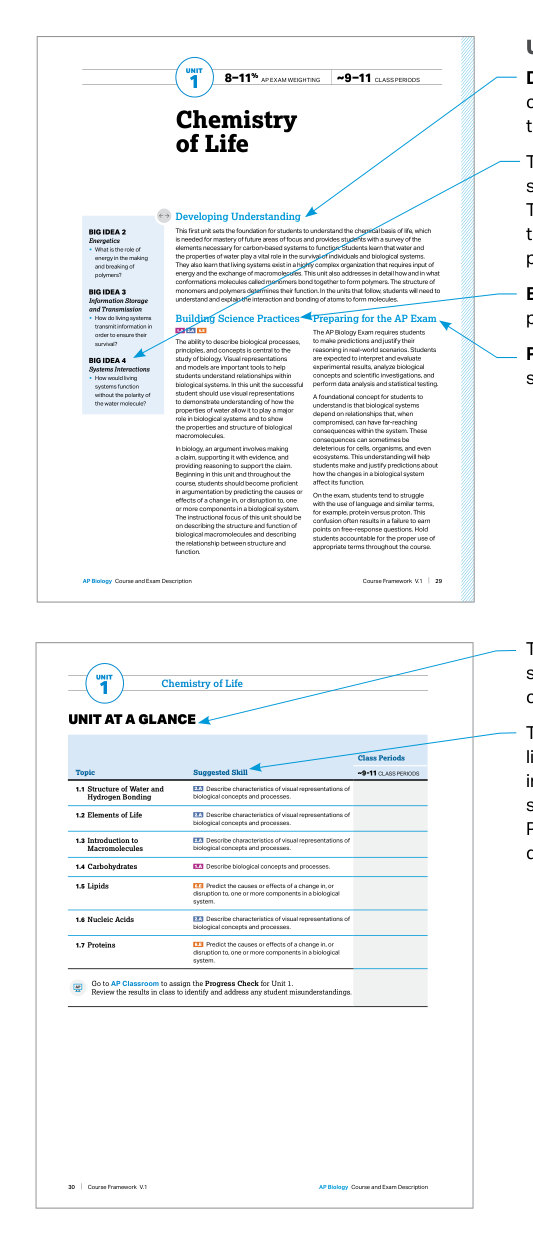
Unit guides and the suggested sequence
Unit guides provide a suggested sequence of commonly taught topics, together with the content and skills generally expected for college credit and/or placement. The suggested pacing assumes approximately $45$-minute classes meeting five days per week across a full academic year; it is guidance for planning, not a rule that every classroom must follow.
The course deliberately spirals its skills. A student may first construct a graph in Unit 1, interpret enzyme data in Unit 3, analyze inheritance results in Unit 5, and evaluate population data in Unit 7. The biological setting changes, but the reasoning pattern becomes more powerful and transferable.
A useful skill emphasis map looks like this:
- Units 1–3: Concept explanation, visual representations, data representation, and mathematical analysis.
- Units 4–6: Models of signaling and gene expression, experimental methods, and evidence-based argumentation.
- Units 7–8: Statistical reasoning, population and ecological graphs, causal explanations, and scientific claims.
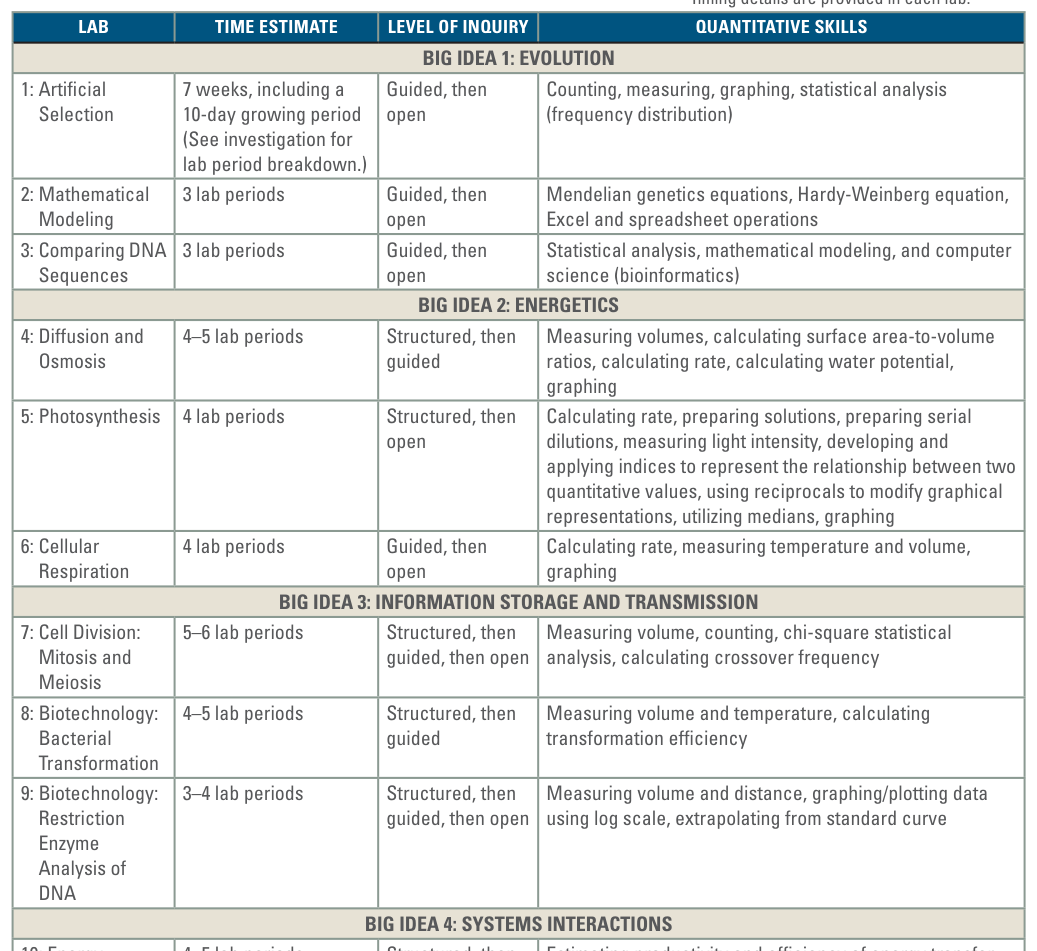
Laboratory investigations make this sequence concrete. Inquiry-based work asks students to pose questions, identify variables, collect data, analyze patterns, and connect evidence to biological principles. A laboratory notebook, report, or data table is therefore not separate from “content”; it is a place where biological reasoning becomes visible.
The six Science Practices
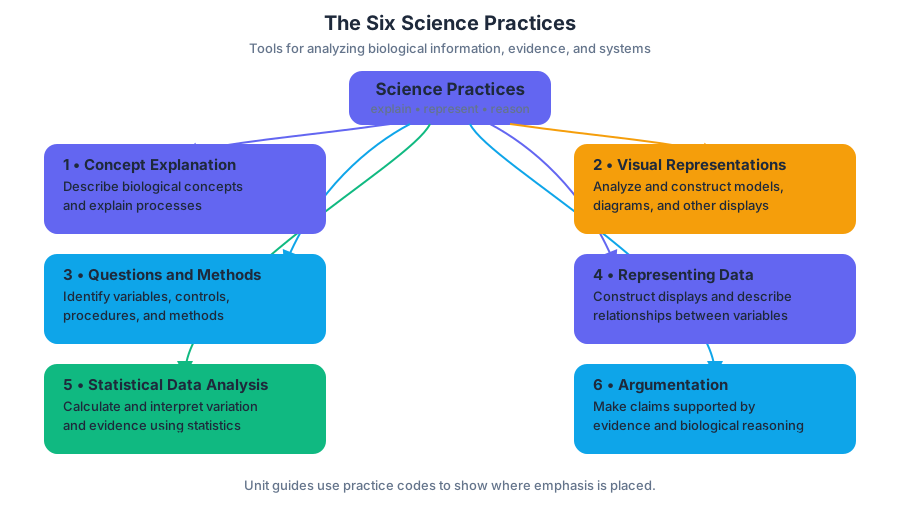
The six official Science Practices are the tools used to analyze biological information:
- Science Practice 1: Concept Explanation — describe and explain biological concepts and processes.
- Science Practice 2: Visual Representations — analyze, explain, and construct diagrams, models, and other representations.
- Science Practice 3: Questions and Methods — identify scientific questions, variables, controls, procedures, and appropriate methods.
- Science Practice 4: Representing and Describing Data — construct graphs and other displays and describe relationships between variables.
- Science Practice 5: Statistical Tests and Data Analysis — perform mathematical calculations and use statistics to interpret variation and evidence.
- Science Practice 6: Argumentation — make scientific claims and justify them with evidence and biological reasoning.
Important identifiers include 1.A, describing biological processes and concepts; 2.A, using and explaining visual representations and models; 5.C, performing chi-square hypothesis testing; and 6.E, predicting the causes or effects of a change in, or disruption to, one or more components in a biological system. Unit guides display these codes to show which practices receive particular emphasis.
Science Practice 4: Representing and Describing Data
A graph is an argument in visual form. To represent an experiment, place the independent variable—the factor deliberately changed—on the $x$-axis and the dependent variable—the measured response—on the $y$-axis. Label both axes with variables and units, choose a scale that reveals the pattern, and include a meaningful title or legend when needed.
For example, if increasing salt concentration changes seed germination, a graph can reveal whether germination decreases steadily, reaches a threshold, or remains unchanged. Describing the relationship means stating the observable pattern before explaining it: “As salt concentration increases, the percentage of germinated seeds decreases.”
Science Practice 5: Statistical Tests and Data Analysis
Mathematical analysis separates a pattern from random variation. The sample mean is
$$\bar{x}=\frac{1}{n}\sum x_i$$
where $n$ is sample size. Error bars may represent standard deviation, standard error, or a confidence interval; their meaning must be identified before drawing conclusions. Overlapping error bars do not automatically prove that two treatments are identical, and separated error bars do not automatically establish statistical significance.
For categorical inheritance data, the chi-square statistic compares observed values $o$ with expected values $e$:
$$\chi^2=\sum\frac{(o-e)^2}{e}$$
A large difference between observed and expected results produces a larger $\chi^2$, but the conclusion depends on degrees of freedom and the appropriate critical value.
Science Practice 6: Argumentation
A scientific argument has three linked parts: claim, evidence, and reasoning. The claim answers the biological question; evidence identifies relevant data; reasoning explains why those data support the claim using a biological mechanism or concept.
Strong argument: The treatment reduced enzyme activity because the data show a lower mean reaction rate, and the altered temperature likely changed the enzyme’s shape, reducing effective substrate binding.
The common misconception is that repeating the data is an explanation. “The treated group was lower” is evidence; “the treatment disrupted enzyme-substrate interactions” is reasoning. On assessments, a claim without evidence, or evidence without a biological link, remains incomplete.
Assessment and feedback loop
Progress Checks combine multiple-choice questions with rationales and free-response questions with scoring information. Teacher reports summarize assignment results, including Progress Checks, and identify class trends and areas of difficulty. Across both exam sections, students are expected not merely to remember biology, but to represent data, calculate, evaluate methods, and defend conclusions.
Retrieval check: A graph shows that oxygen production rises as light intensity increases, then levels off. Identify the independent and dependent variables, describe the relationship, and propose one biological explanation for the plateau. A complete response names the variables, states the trend precisely, and links the plateau to a limiting factor such as carbon dioxide availability or photosynthetic machinery.





1.1 Structure of Water and Hydrogen Bonding
Key concepts: Water molecules are polar · Polar covalent bonds between hydrogen and oxygen · Hydrogen bonding between water molecules · Hydrogen bonding within biological molecules · Water’s properties support living systems · High specific heat capacity · Maintenance of homeostatic body temperature · High heat of vaporization
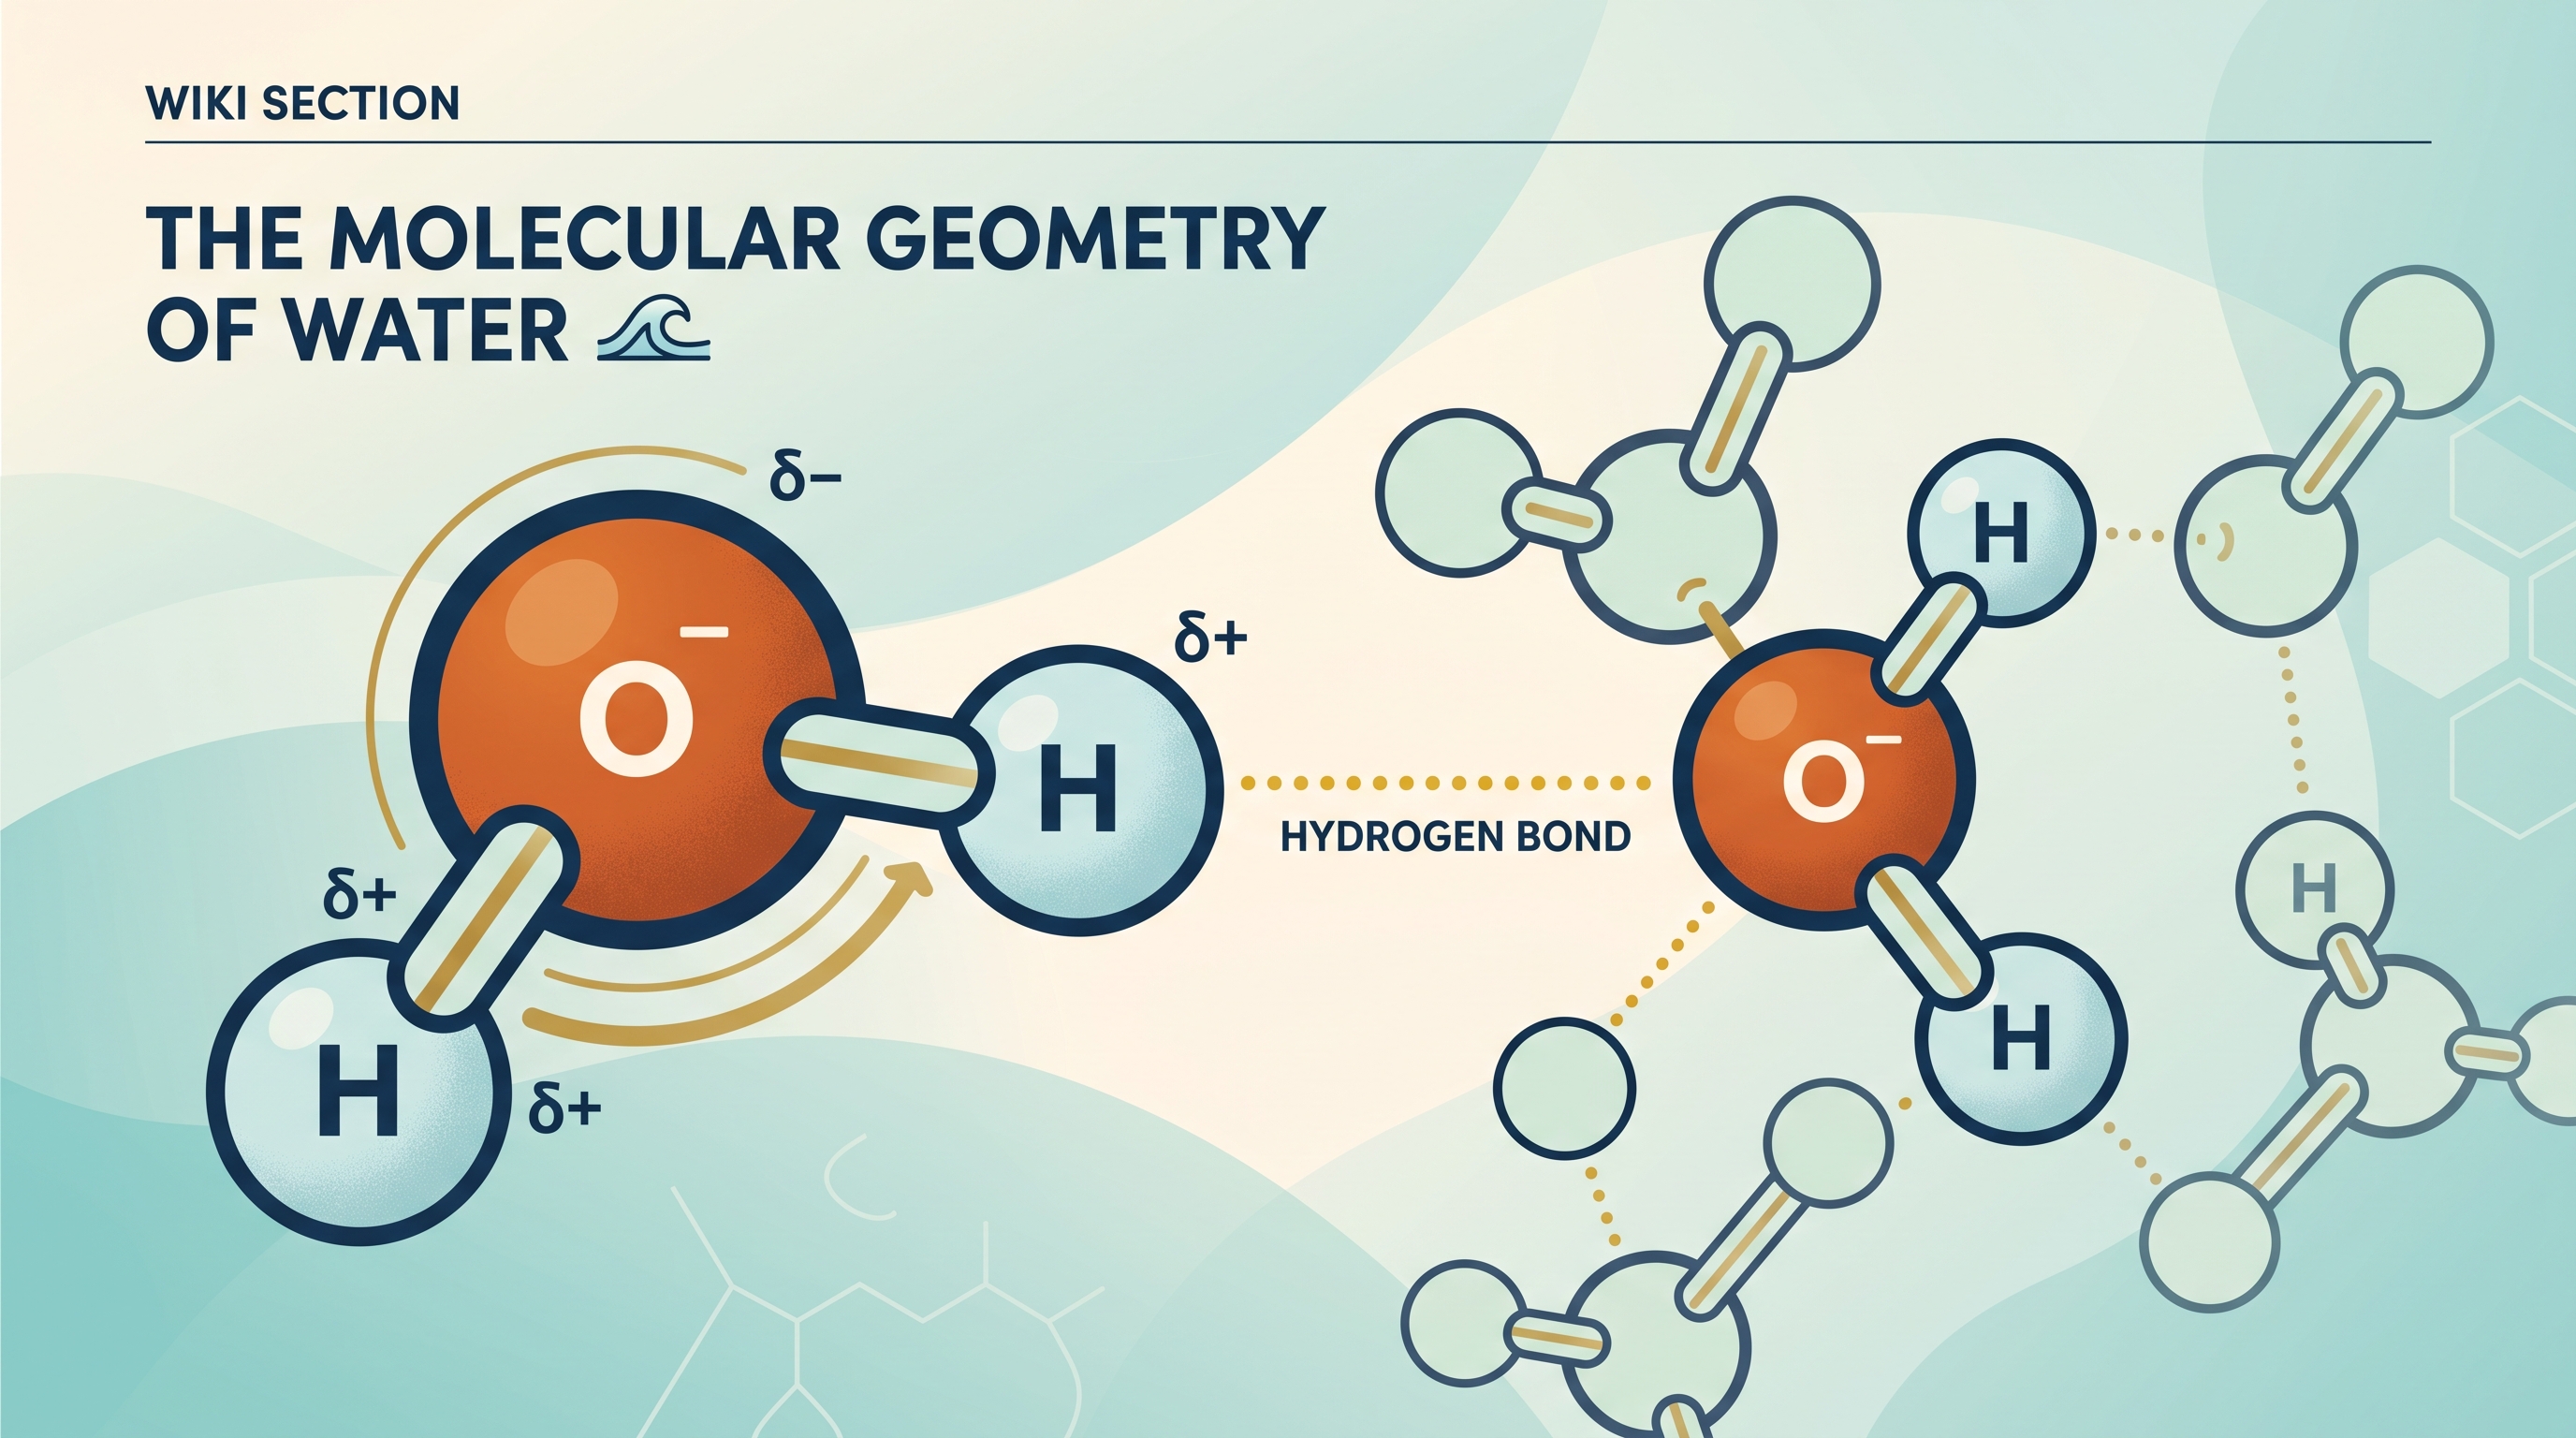
A water molecule can behave like a tiny electrical magnet: one side is slightly negative, the other slightly positive. That uneven charge distribution explains why water molecules cling to one another, why sweat cools the body, and why aquatic environments resist sudden temperature changes.
1.1 Structure of Water and Hydrogen Bonding
A water molecule can behave like a tiny electrical magnet: one side is slightly negative, the other slightly positive. That uneven charge distribution explains why water molecules cling to one another, why sweat cools the body, and why aquatic environments resist sudden temperature changes.
Learning Objective 1.1.A: Explain how the properties of water that result from its polarity and hydrogen bonding affect its biological function.
Polarity begins with polar covalent bonds
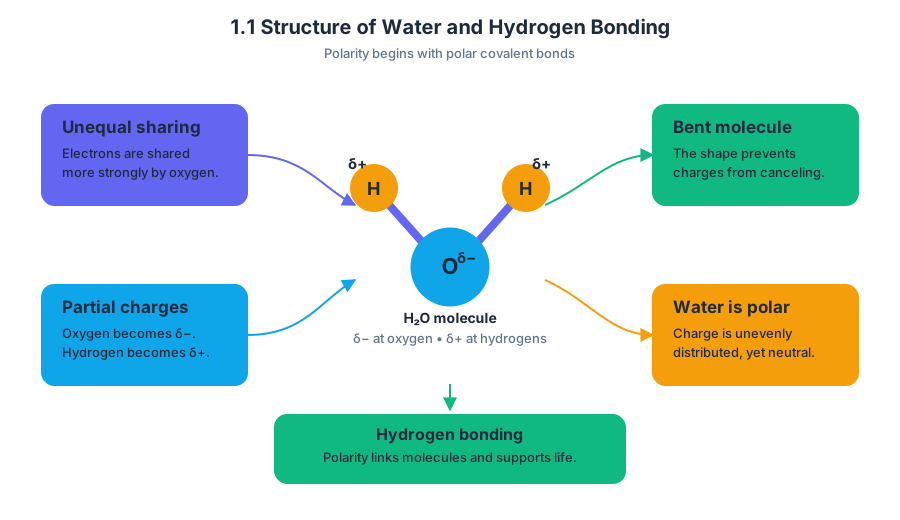
A polar covalent bond is a covalent bond in which electrons are shared unequally between atoms. In water, oxygen attracts the shared electrons more strongly than hydrogen does. Each oxygen-hydrogen bond therefore has a slight negative end near oxygen and a slight positive end near hydrogen.
The molecule’s bent shape prevents these partial charges from canceling. The oxygen end is slightly negative, written $\delta^-$, while the hydrogen ends are slightly positive, written $\delta^+$. Water is therefore polar: its charge is unevenly distributed even though the molecule as a whole is electrically neutral.
Essential Knowledge 1.1.A.1.i: Living systems depend on the properties of water to sustain life. Water has polarity because of the formation of polar covalent bonds between hydrogen and oxygen within water molecules. This polarity contributes to hydrogen bonding between and within biological molecules.
Hydrogen bonds: attraction between neighboring molecules
A hydrogen bond is a weak attraction between a partially positive hydrogen atom and a partially negative atom, commonly oxygen or nitrogen, in a nearby molecule or molecular region. The slightly positive hydrogen of one water molecule is attracted to the slightly negative oxygen of another.
A single hydrogen bond is much weaker than the covalent bonds inside a water molecule. However, enormous numbers of hydrogen bonds acting together produce important biological effects. Hydrogen bonds can also form within biological molecules, helping a molecule fold or maintain a particular shape.
These attractions produce several related properties:
- Cohesion is the attraction of water molecules to one another.
- Adhesion is the attraction of water to other polar surfaces.
- Surface tension is the resistance of the water’s surface to being broken or stretched.
Essential Knowledge 1.1.A.2: Hydrogen bonds between adjacent polar water molecules result in cohesion, adhesion, and surface tension. For example, cohesion helps maintain a continuous column of water in plant transport tissues, while adhesion helps water interact with the walls of those tissues.
Water resists rapid temperature change
Water has a high specific heat capacity, meaning that a relatively large amount of heat energy is required to raise the temperature of a given amount of water by $1^\circ\mathrm{C}$. Incoming thermal energy is absorbed partly by disrupting hydrogen bonds before the molecules’ average kinetic energy—and therefore temperature—increases substantially.
This property stabilizes biological temperature. Because cells and organisms contain substantial amounts of water, water helps buffer them against rapid environmental temperature changes. In an animal, that buffering supports homeostasis, the maintenance of relatively stable internal conditions.
Worked example: body-temperature homeostasis
On a hot day, an organism’s body receives heat from its surroundings. If its tissues contained little water, their temperature would rise rapidly. Because body water has a high specific heat capacity, much of the added energy can be absorbed with a smaller temperature increase, giving physiological mechanisms time to respond.
The organism may then use evaporation to remove heat. Water has a high heat of vaporization, meaning that considerable energy is required for liquid water molecules to escape into the gas phase. The highest-energy molecules leave first, so evaporation lowers the average kinetic energy of the remaining liquid and cools the surface.
Sweating illustrates both properties working together: water in the body resists rapid warming, and evaporation of sweat removes thermal energy from the skin. The result is evaporative cooling that helps maintain body temperature.
Essential Knowledge 1.1.A.1.ii: Water has a high specific heat capacity, which allows maintenance of homeostatic body temperature within living organisms.
Essential Knowledge 1.1.A.1.iii: Water has a high heat of vaporization, which allows evaporative cooling of the surrounding environment and helps maintain body temperature in living organisms.
Misconception check
Misconception: “Hydrogen bonds are the bonds inside a water molecule.” The oxygen-hydrogen bonds within one molecule are polar covalent bonds. Hydrogen bonds form mainly between neighboring water molecules, although hydrogen bonding can also occur between different regions of a biological molecule or between biological molecules.
Misconception: “High specific heat means water heats quickly.” The opposite is true: high specific heat means water requires substantial energy to increase its temperature. High heat of vaporization is the property involved directly when evaporation produces cooling.
AP Biology skills in action
This topic most directly develops Science Practice 1: Concept Explanation, especially 1.A Describe biological concepts and processes and 1.B Explain biological concepts and processes. A strong explanation must connect the chain: unequal electron sharing $\rightarrow$ polarity $\rightarrow$ hydrogen bonding $\rightarrow$ water properties $\rightarrow$ biological function.
It also uses Science Practice 2: Visual Representations, especially 2.A Describe characteristics of biological representations and 2.B Describe relationships among different representations, when interpreting a water-molecule diagram or a hydrogen-bond network. In an investigation comparing temperature change or evaporation, Science Practice 4: Representing and Describing Data, particularly 4.A Construct a graph and 4.B Describe data, supports evidence-based interpretation; Science Practice 6: Argumentation, especially 6.A Make a scientific claim, supports the claim that water’s properties help organisms maintain homeostasis.
Retrieval check
Why does water’s polarity lead to both cohesion and evaporative cooling? State the molecular cause first, then identify the property responsible for each biological effect. A complete response should mention polar covalent bonds, hydrogen bonding, cohesion, and high heat of vaporization.
1.2 Elements of Life
Key concepts: Inquiry-based biological investigation · DNA mutations and cellular replication · HPV infection and cervical cancer risk · Henrietta Lacks and ethical/scientific issues · DNA plasmid stability and degradation · Selection and care of experimental organisms · Energy and biomass flow from plants to butterfly larvae · Brassica plant–butterfly larva investigation · Quantitative trait measurement in plant biology · Data organization, visualization, and analysis
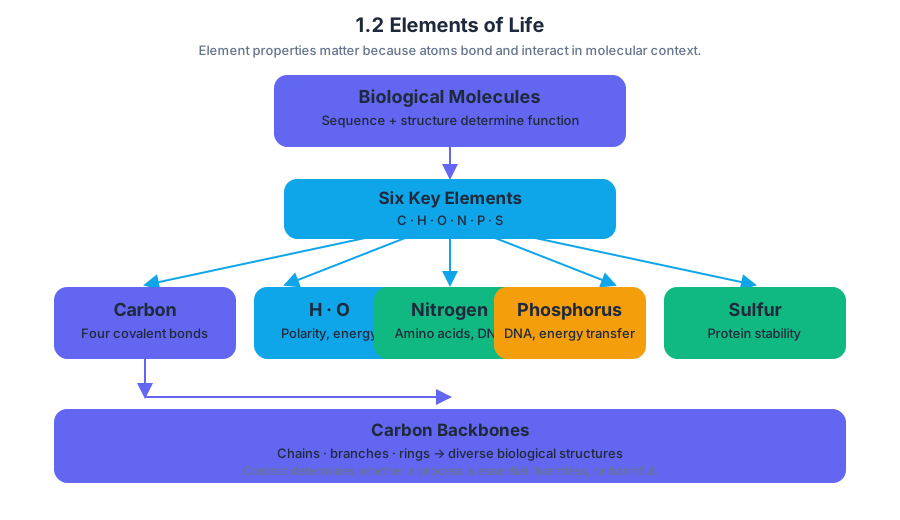
Carbon, hydrogen, oxygen, nitrogen, phosphorus, and sulfur make up most biological molecules, but their importance comes from how their atoms bond and interact, not simply from their presence.
1.2 Elements of Life
Carbon, hydrogen, oxygen, nitrogen, phosphorus, and sulfur make up most biological molecules, but their importance comes from how their atoms bond and interact, not simply from their presence. The same element can participate in harmless, essential, or harmful biological processes depending on its molecular context.
CED alignment — Topic 1.2 Elements of Life
Learning Objective 1.2.A: Describe the properties of the elements that make up biological macromolecules.
Essential Knowledge 1.A.1: The subcomponents of biological molecules and their sequence determine the properties of that molecule.
Carbon is especially versatile because each carbon atom can form four covalent bonds. This allows carbon atoms to build chains, branches, and rings that serve as biological backbones. Hydrogen and oxygen commonly contribute to polarity and energy transformations; nitrogen is central to amino acids and nucleic acids; phosphorus appears in nucleic acids and energy-transfer molecules; and sulfur helps stabilize some proteins.
From an element to a biological investigation
The most useful question is not merely “Which elements are present?” but “How can a change involving those elements alter a cell, organism, or ecosystem?” An investigation might ask whether an organism’s chemotactic response—movement toward or away from a chemical stimulus—is greater than its geotactic response to gravity or its phototactic response to light. The question becomes testable only after the responses are defined and measured, such as distance moved, percentage moving toward a stimulus, or time required to reach a target.
This illustrates inquiry-based biological investigation: begin with a biological question, identify the variables, select an organism that can be obtained and cared for responsibly, and organize observations into a form that can support an explanation. Experimental organisms should be readily available; insects may be caught or cultured, and plants may be grown on site or at home. Availability never removes the obligation to provide appropriate care, follow regulations, and respect all life. Vertebrate use may be restricted by local rules.
Worked example: a Brassica–butterfly system
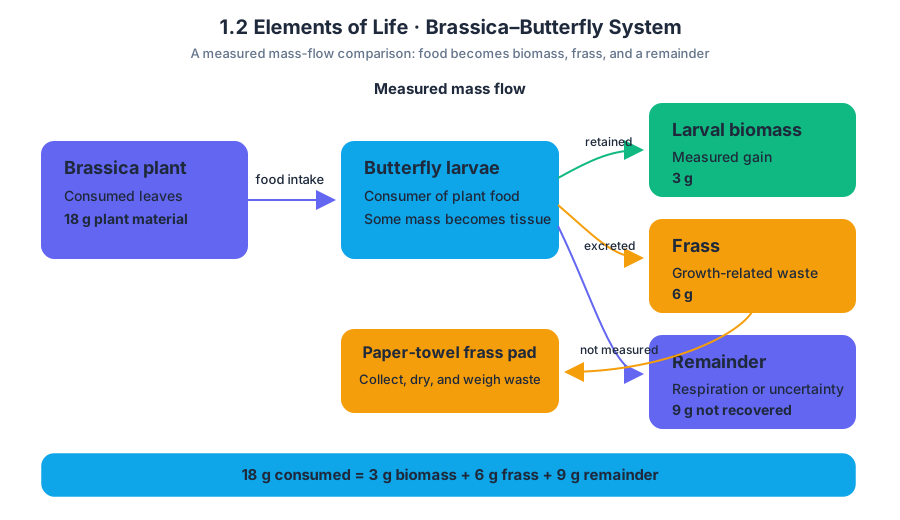
A Brassica barn can connect elemental biology to energy and biomass flow. Plants provide food for butterfly larvae, while the larvae gain some of the consumed plant biomass and lose some as growth-related waste called frass.
Suppose a group estimates that larvae consume $18\ \text{g}$ of plant material, gain $3\ \text{g}$ of biomass, and produce $6\ \text{g}$ of frass. The remaining mass represents material not recovered in those measured categories or uncertainty in the estimates. The group should not claim that all consumed biomass became larval tissue: some material is respired, and measurements may be incomplete. Converting comparable biomass measurements into energy units requires consistent units of mass, time, and energy.
A paper-towel frass pad makes waste collection visible and measurable. Students can then ask quantitative questions about plant height, stem color, or flower number and test whether those traits vary with environmental conditions or herbivore damage. The same setup can generate visual descriptions, calculations, and mathematical models rather than a single descriptive conclusion.
Mutations, HPV, and Henrietta Lacks
A mutation is a change in DNA. Normal cells can be affected when mutations alter information needed for DNA repair, cell-cycle control, or other cellular processes. If a cell with mutated DNA replicates, the altered DNA may be passed to its daughter cells; therefore, a local molecular change can become a population of cells with related abnormalities.
Human papillomavirus infection increases the risk of cervical cancer because viral effects can interfere with cellular regulation and DNA-integrity safeguards. The Henrietta Lacks case provides a concrete inquiry into what can happen when abnormal cells continue dividing and can be cultured as the HeLa cell line. It also raises scientific, legal, and racial issues: tissue removal without consent, access to medical information, the history of treatment at Johns Hopkins, and bias in research and health care.
Misconception check: HPV infection does not mean that cervical cancer is inevitable, and a mutation is not automatically harmful. The effect depends on which DNA sequence changes, how cellular regulation is altered, and whether the change is retained as cells replicate.
Plasmid stability and experimental design
Biological materials are not automatically stable simply because they are frozen. Plasmid DNA can degrade when stored in a frost-free freezer, whose repeated warming and cooling cycles can damage the sample. Before planning an experiment, investigators should check the material’s shelf life and storage requirements with the commercial vendor.
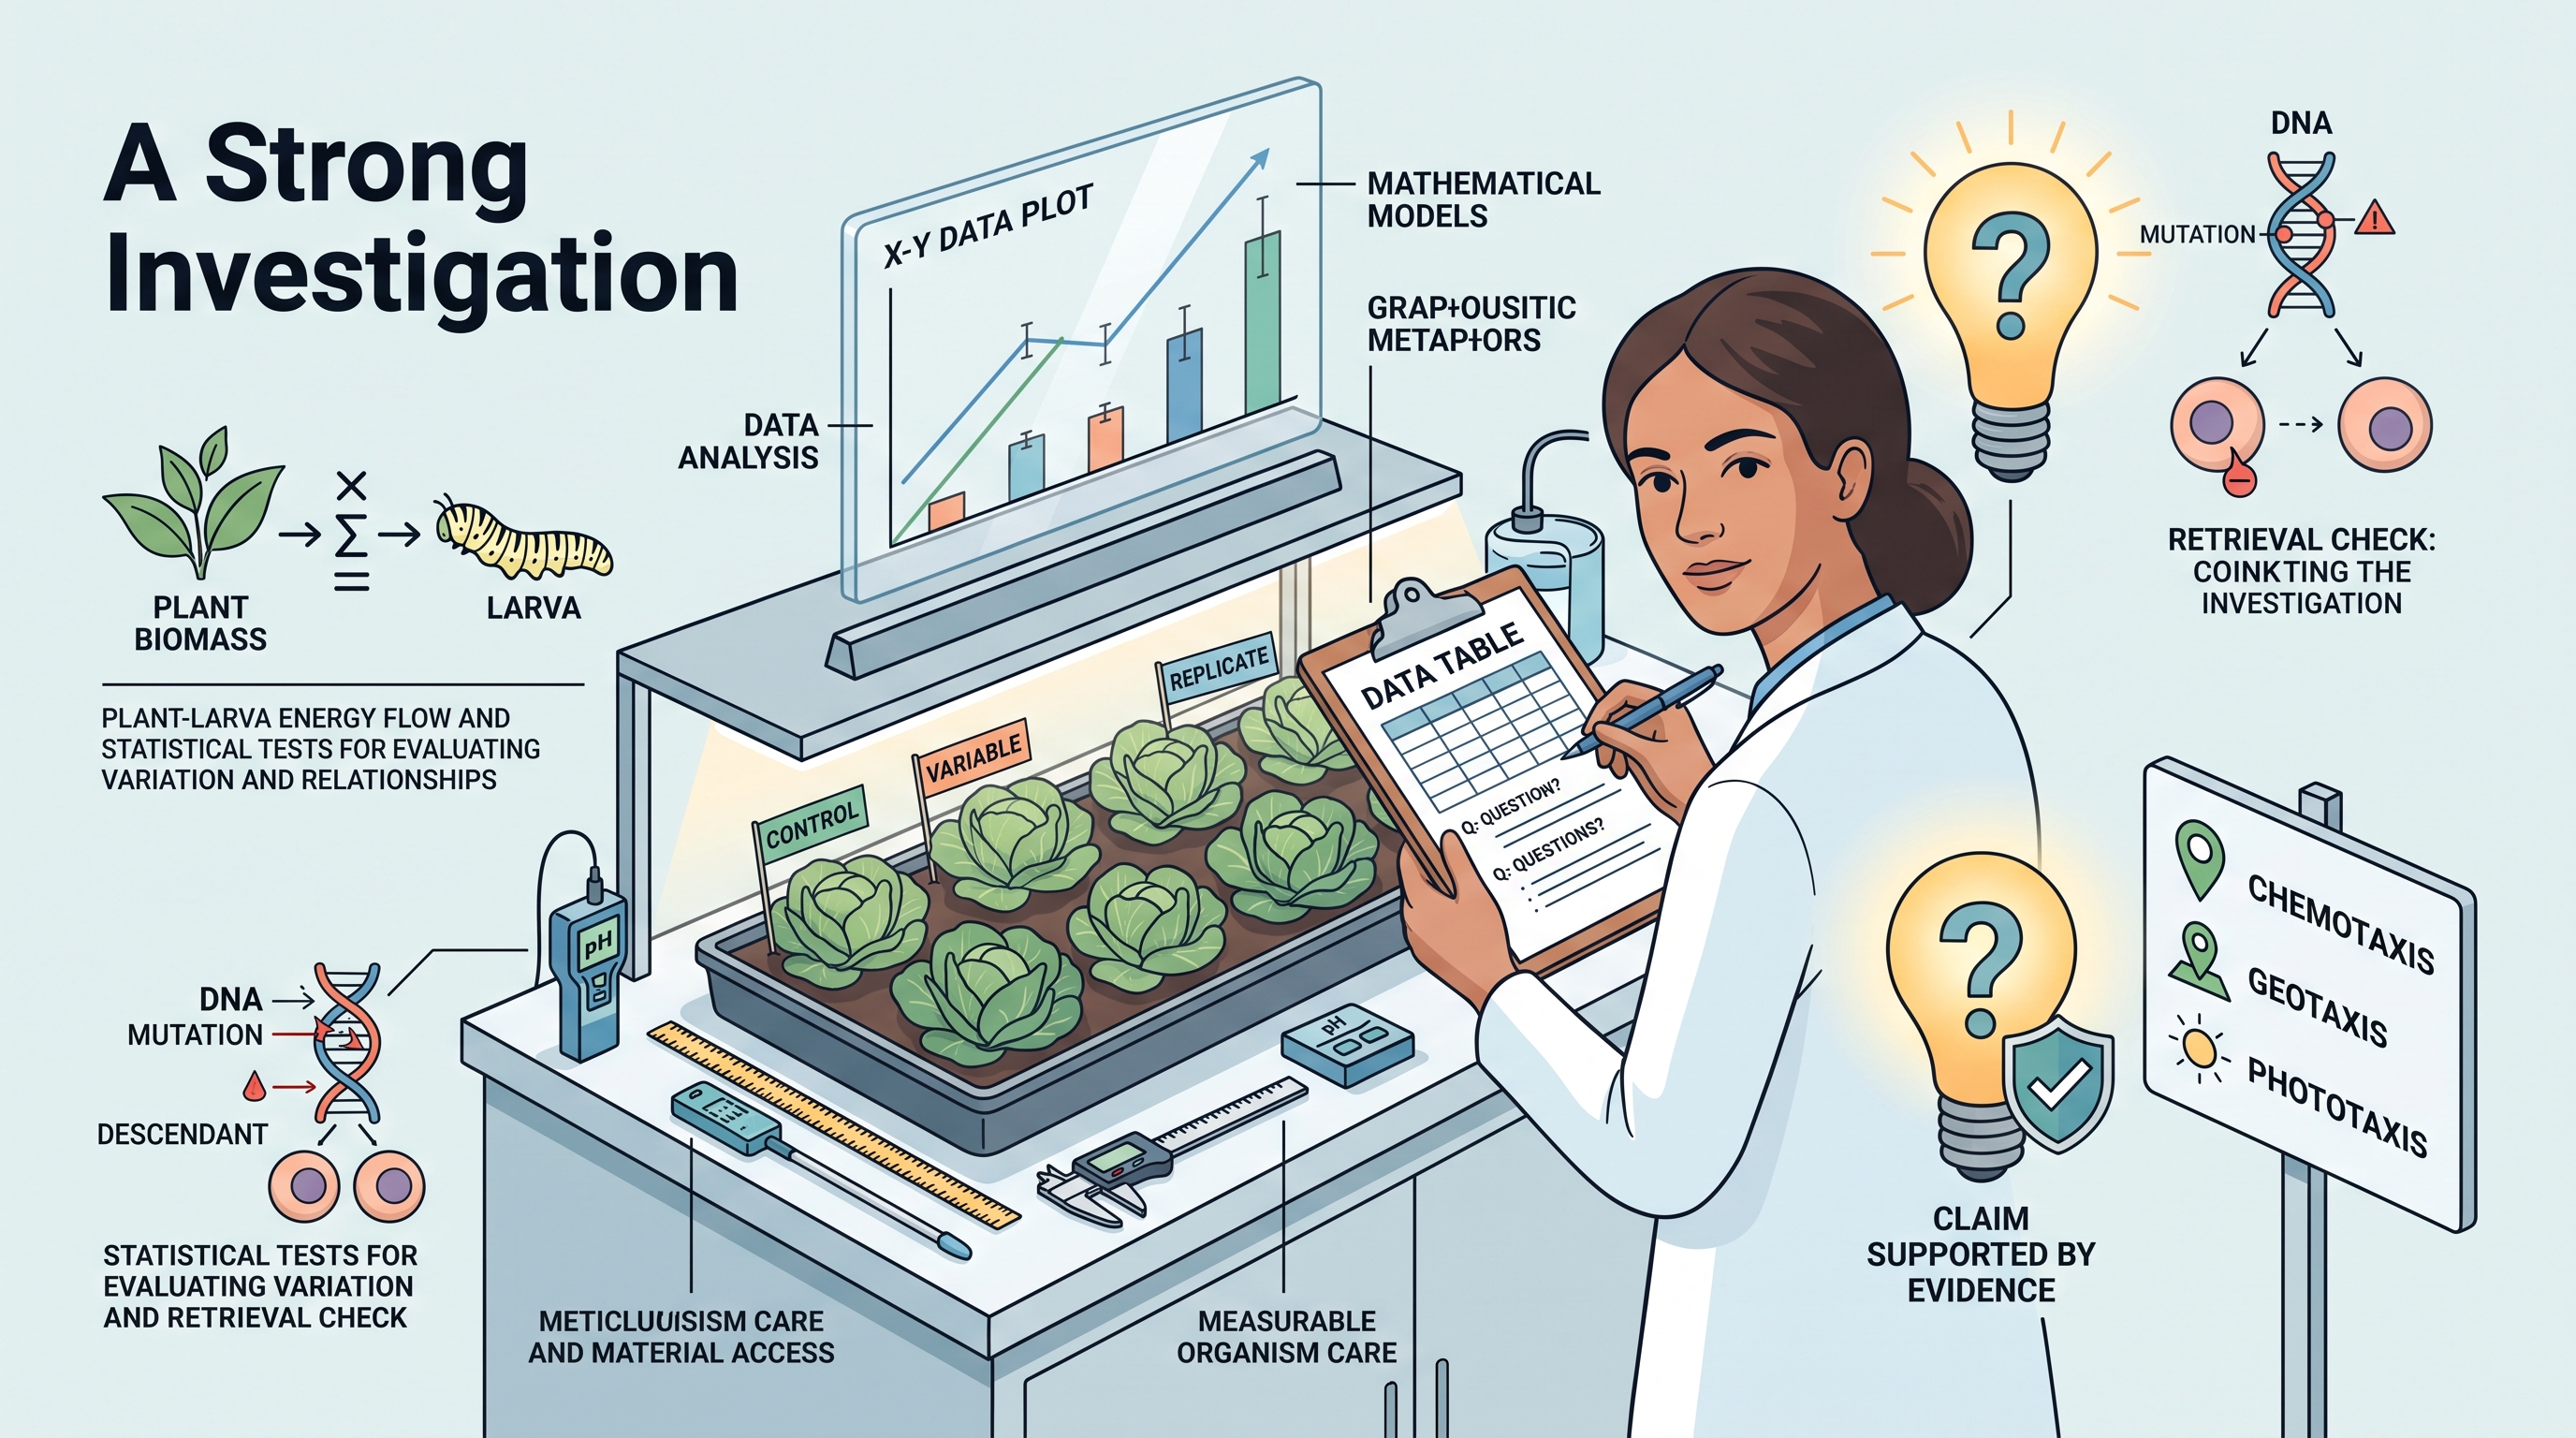
A strong investigation therefore includes organism care, material access, controls, replication, measurable variables, and a data table designed around the final question. Data should be analyzed with calculations, visual descriptions, and mathematical models, while conclusions must distinguish measured evidence from estimates.
AP Science Practices: Science Practice 1: Concept Explanation connects elemental composition to mutations, biomass, and cellular function. Science Practice 2: Visual Representations supports diagrams of DNA change and plant–larva energy flow. Science Practice 3: Questions and Methods is used to compare chemotaxis, geotaxis, and phototaxis and to design Brassica investigations. Science Practice 4: Representing and Describing Data organizes biomass, trait, and response measurements. Science Practice 5: Statistical Tests and Data Analysis evaluates variation and relationships. Science Practice 6: Argumentation requires a claim supported by evidence and biological reasoning.
Retrieval check: A plasmid sample was stored in a frost-free freezer and later produced inconsistent results. What should be checked first, and why? Then explain how a mutation in one cell could affect many descendant cells after replication.
1.3 Introduction to Macromolecules
Key concepts: Introduction to macromolecules · Communicating investigation results and conclusions · Postlab questions and activities · Extending an investigation · Planning an investigation by identifying what may be inaccurate · Determining which data are important to collect · Defining what the investigation is intended to find out · Using an investigation strategy to help diagnose and address misconceptions · The need for a constant input of energy · The exchange of macromolecules
A biological investigation becomes powerful when it turns a vague curiosity—What happens to macromolecules when cells receive a constant input of energy?—into a testable question, measurable data, and an evidence-based conclusion.
1.3 Introduction to Macromolecules
A biological investigation becomes powerful when it turns a vague curiosity—What happens to macromolecules when cells receive a constant input of energy?—into a testable question, measurable data, and an evidence-based conclusion. Macromolecules are large biological molecules whose structures allow them to build cells, store information, transfer energy, and support chemical reactions. Their functions depend not only on which elements they contain, but also on how their molecular subunits are arranged.
CED traceability: Topic 1.3 Introduction to Macromolecules; Learning Objective 1.3; Essential Knowledge 4.A.1 and 4.A.2. The central reasoning task is to connect molecular structure and interactions with biological function, then support that connection using investigative evidence.
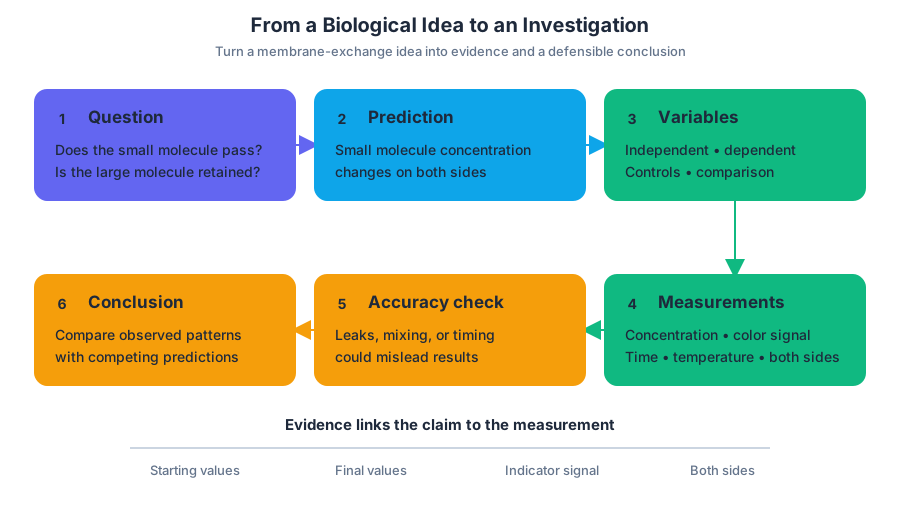
From a biological idea to an investigation
Suppose students investigate the exchange of macromolecules between two solutions separated by a membrane. Before touching equipment, they should identify what they hope to find out. A strong question might be: Does the membrane permit the movement of a small dissolved molecule while retaining a larger macromolecule? This question predicts a measurable change rather than merely asking whether “something happens.”
The investigation strategy should then identify the evidence needed to answer the question. Students might collect the starting and final concentrations of each substance, the color or other indicator signal, the time of exposure, the temperature, and measurements from both sides of the membrane. Data are important when they distinguish among explanations; recording every possible observation is less useful than measuring variables linked directly to the claim.
A useful planning chain is:
- Question: What molecular exchange is being tested?
- Prediction: If the membrane permits passage of the smaller molecule, its concentration should change on both sides.
- Variables: Define the independent variable, dependent variable, controlled variables, and comparison condition.
- Measurements: Decide which concentration, time, and environmental data are necessary.
- Accuracy check: Identify steps that could produce misleading results.
- Conclusion: Compare the observed pattern with competing predictions.
Using investigations to diagnose misconceptions
An investigation strategy is also a diagnostic tool. If a student believes that all macromolecules cross a membrane because molecules are constantly moving, the teacher can make that misconception explicit, predict its consequence, and test it against an alternative explanation: movement may occur, but membrane permeability may depend on molecular size or chemical properties.
The reasoning must be deliberate:
Misconception → predicted result → controlled test → comparison with alternatives → revised explanation
For example, the misconception predicts that both a small molecule and a large macromolecule will appear on the opposite side of the membrane. The alternative predicts that only the smaller molecule will cross. After the experiment, students compare the measured indicators with both predictions. If only the smaller molecule is detected across the membrane, the evidence supports selective exchange rather than unrestricted movement. If both appear, students must investigate other explanations, such as membrane damage, contamination, or an inaccurate detection method.
This process allows a teacher to diagnose and address misconceptions immediately instead of waiting until a final answer reveals confused reasoning. The goal is not simply to obtain the “expected” result; it is to determine which explanation best accounts for the complete data set.
Accuracy, uncertainty, and important data
Before collecting data, students should ask, What aspects of our methods or results may not be accurate? Possible problems include unequal starting volumes, inconsistent timing, temperature changes, a damaged membrane, imprecise volume measurements, or an indicator that cannot detect low concentrations. These are not minor technical details: each could change the apparent rate or direction of macromolecule exchange.
Students should distinguish accuracy, how close a measurement is to the true value, from precision, how consistent repeated measurements are. Repeated trials help reveal variation, but repetition does not automatically correct a systematic error. If every sample is measured with a miscalibrated instrument, the results may be precise yet inaccurate.
Communicating results and extending the investigation
A scientific conclusion must connect evidence to a claim. Instead of writing “the hypothesis was correct,” students should state the observed pattern, identify the data supporting it, and explain the biological mechanism consistent with that pattern. A clear report communicates methods, relevant data, uncertainty, graphical or visual representations, and a conclusion that does not exceed the evidence.
Postlab questions and activities should push students beyond reporting observations. They may ask students to explain unexpected results, identify limitations, distinguish correlation from causation, or propose a better control. An investigation can then be extended by changing one factor—such as membrane composition, temperature, molecular size, or exposure time—while keeping the remaining conditions constant.
AP Biology science practices in action
This topic most directly develops Science Practice 3: Questions and Methods, as students formulate investigable questions and plan controlled procedures; Science Practice 4: Representing and Describing Data, as they organize measurements and communicate patterns; and Science Practice 6: Argumentation, as they use evidence to support, revise, or reject explanations. It also invokes Science Practice 1: Concept Explanation when students connect macromolecule exchange to biological function and Science Practice 2: Visual Representations when they diagram membrane movement or experimental design.
Retrieval check: A result shows no detectable macromolecule exchange. Name two different explanations, identify one measurement that would help distinguish them, and state what result each explanation predicts.

1.4 Carbohydrates
A plant can build a rigid cell wall, a seed can store chemical energy, and an animal can fuel a sprint using molecules built largely from the same basic units: carbohydrates.
1.4 Carbohydrates
A plant can build a rigid cell wall, a seed can store chemical energy, and an animal can fuel a sprint using molecules built largely from the same basic units: carbohydrates. Their structure—especially the way sugar units are connected—determines whether a carbohydrate acts as a rapidly available fuel, a compact storage molecule, or a strong structural material.
From simple sugars to complex carbohydrates
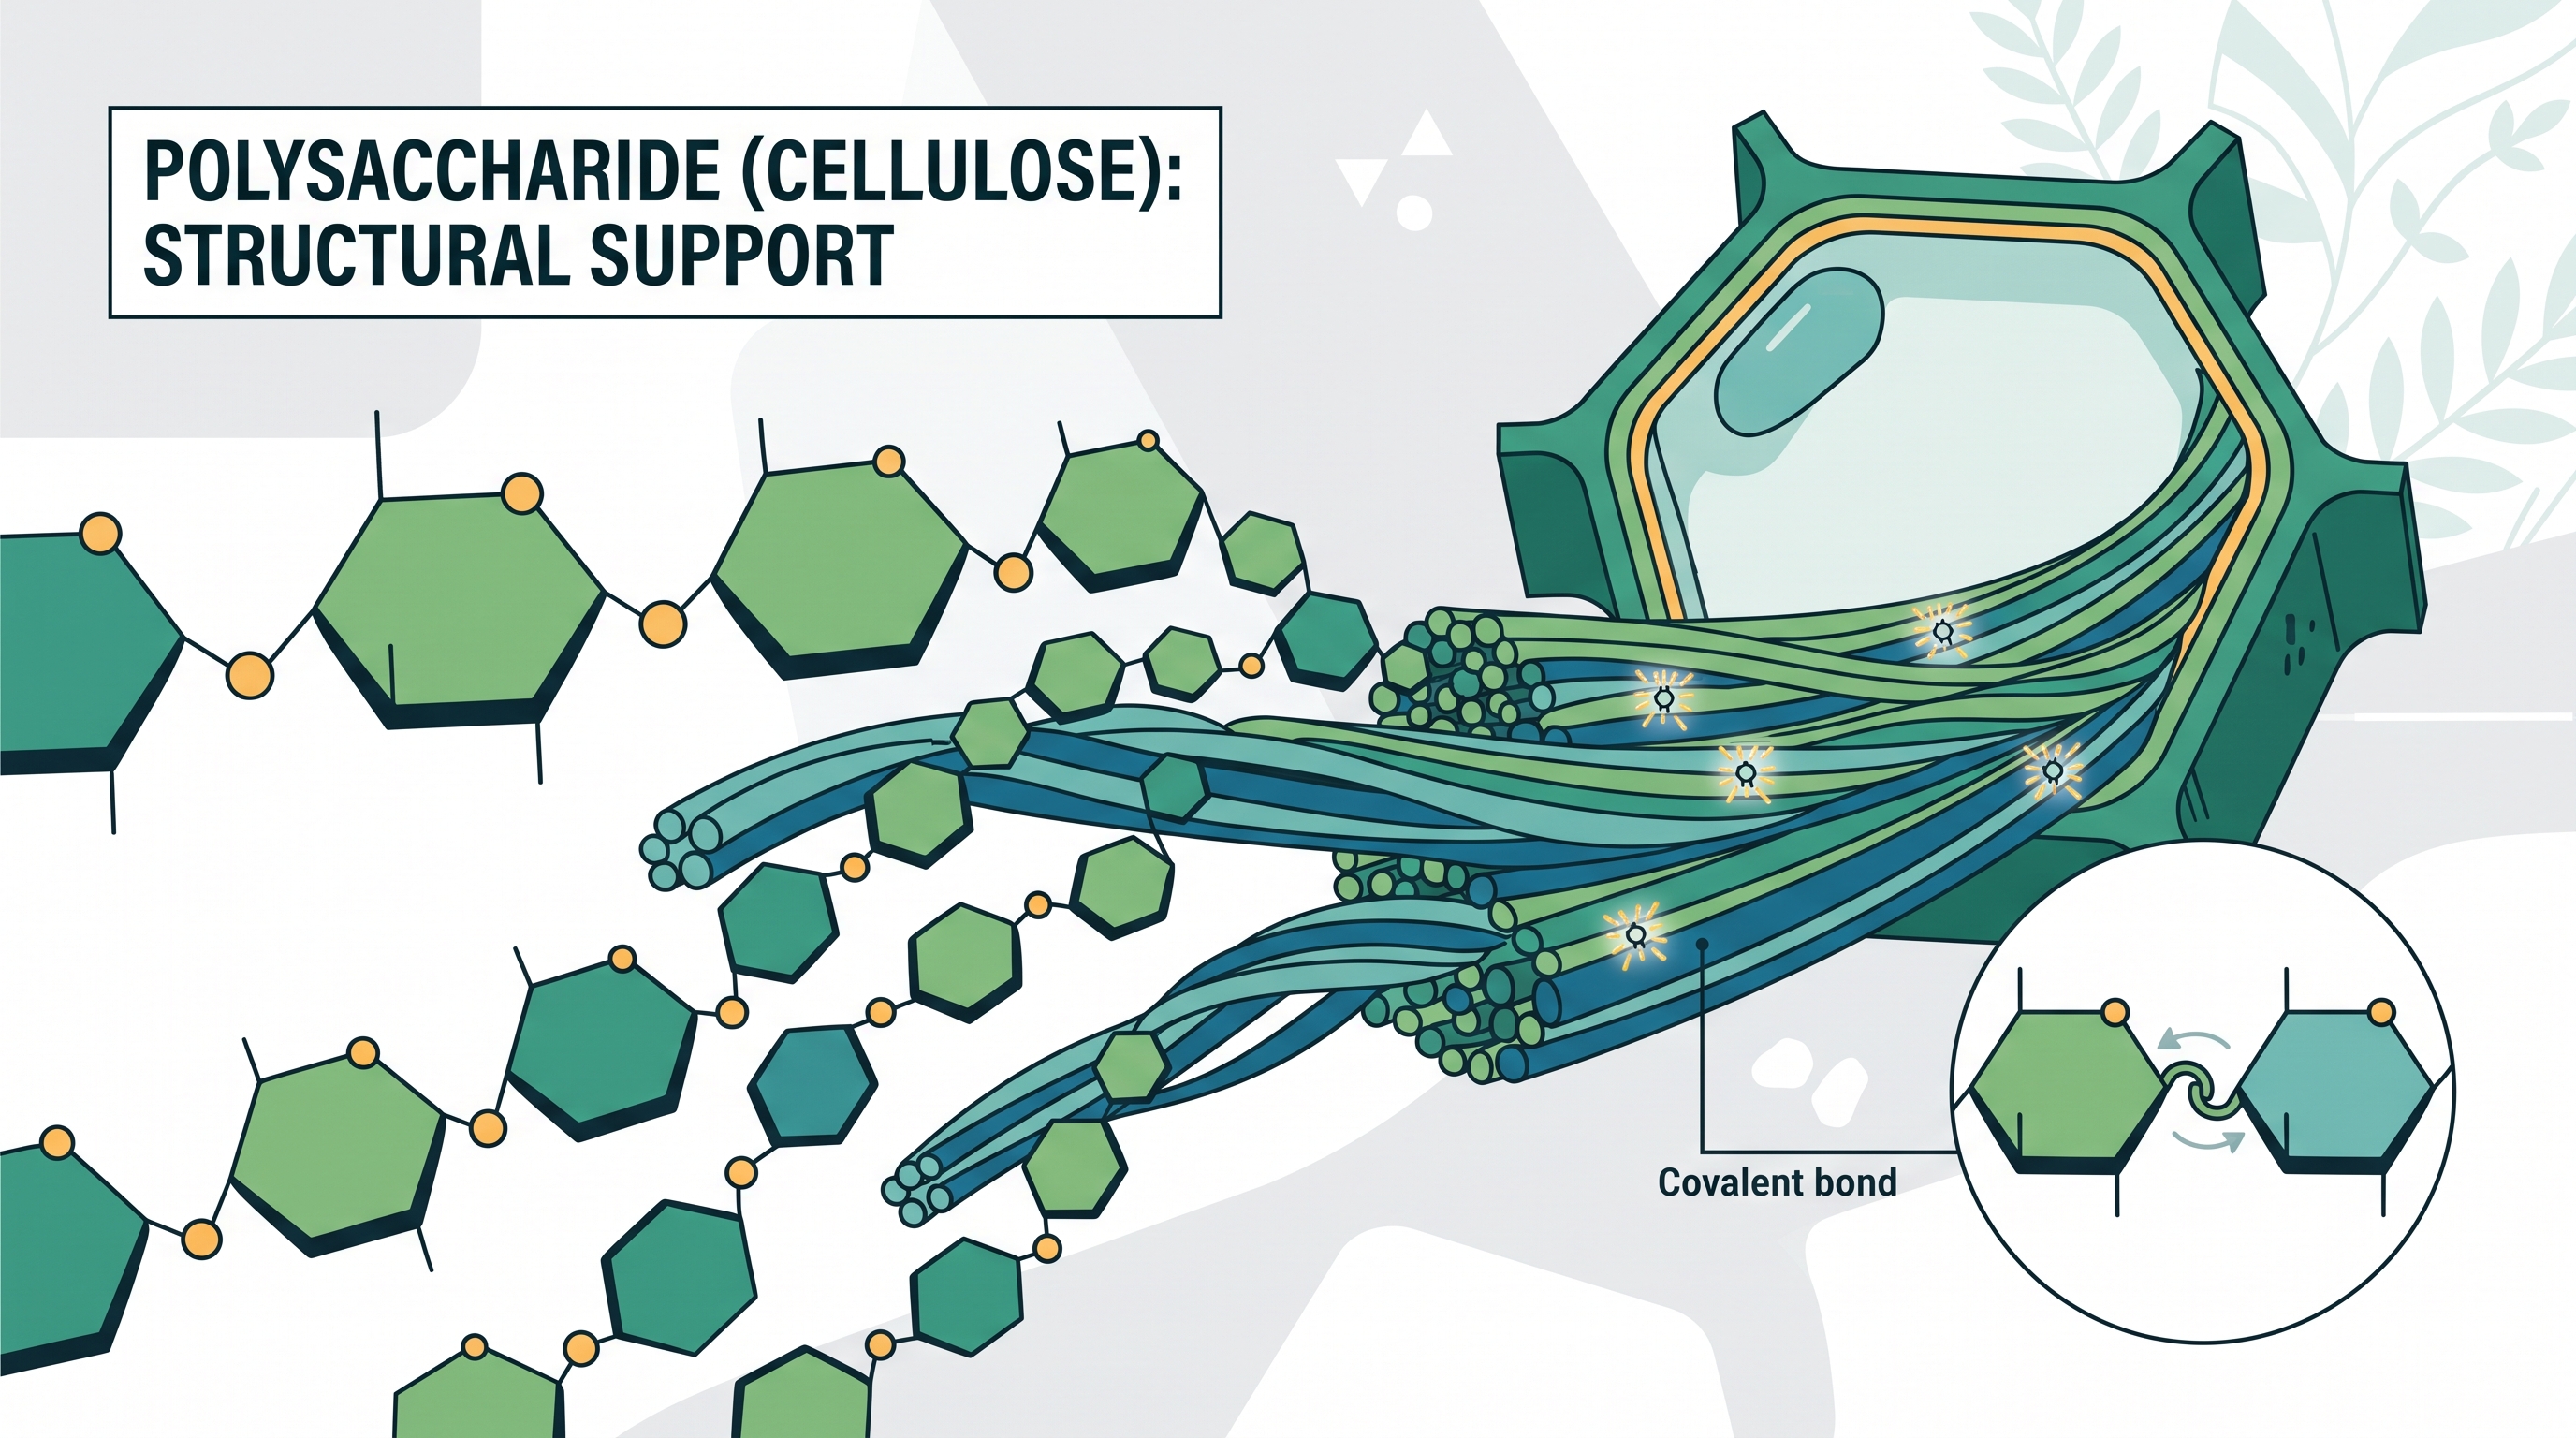
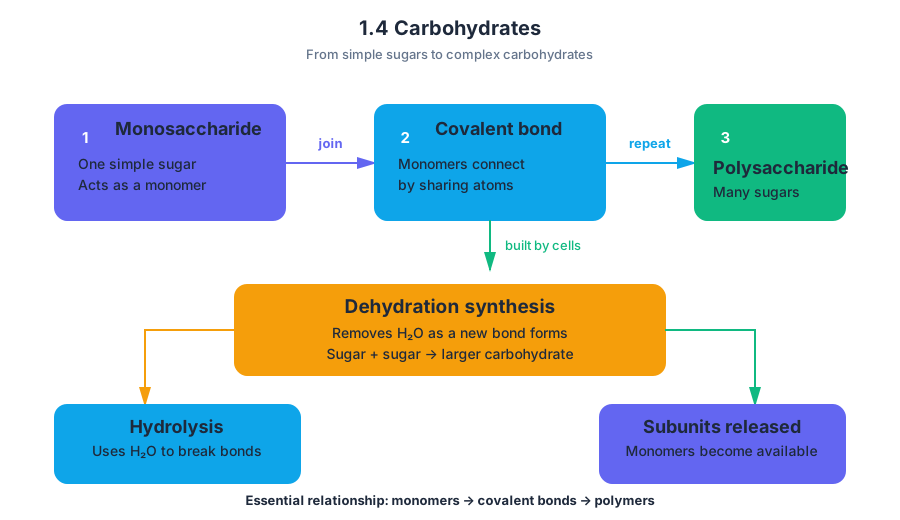
A monosaccharide is a single, simple sugar molecule. It functions as a monomer, meaning a small molecular building block that can be covalently joined to other monomers. A polysaccharide is a large carbohydrate polymer made from many monosaccharides connected by covalent bonds.
The essential relationship is:
When monosaccharides are joined, a dehydration synthesis reaction removes the components of a water molecule as a new covalent bond forms. The reverse process, hydrolysis, uses water to break that bond. These reactions are not merely vocabulary: they explain how cells assemble large carbohydrate molecules and later make their subunits available again.
Essential Knowledge EK 1.4.A.1: Monosaccharides (simple sugars) are the monomers for polysaccharides (complex carbohydrates). These monomers are connected by covalent bonds to form polymers such as complex carbohydrates.
One kind of building block, different biological jobs
Carbohydrates become functionally different because their sugar units can be arranged and connected in different ways. The resulting polymer may be suited for storage, rapid access to energy, or structural reinforcement.
| Carbohydrate | Biological role | Structural idea |
|---|---|---|
| Starch | Energy storage in plants | A polymer that stores many sugar units in a compact form |
| Glycogen | Energy storage in animals and other organisms | A highly accessible storage polymer |
| Cellulose | Structural support in plant cell walls | A strong polymer whose arrangement provides rigidity |
The important reasoning move is to connect structure to function. A storage carbohydrate can hold many sugar units until the organism needs them. A structural carbohydrate must instead resist forces and maintain the shape of tissues. Therefore, identifying a carbohydrate by name is less useful than explaining how its molecular organization supports its role.
Worked example: why a plant cell wall is not an energy reserve
Suppose a researcher compares two plant samples. Sample A contains abundant starch granules inside plant cells. Sample B contains abundant cellulose in cell walls. The researcher asks why both samples can contain carbohydrate polymers but serve different purposes.
Step 1: Identify the common principle. Both starch and cellulose are polysaccharides built from monosaccharide monomers joined by covalent bonds.
Step 2: Identify the different function. Starch is primarily a storage carbohydrate, so it provides a reserve of sugar units that can later support cellular energy demands. Cellulose is primarily structural, so it contributes strength and rigidity to the plant cell wall.
Step 3: Link function to organization. The different arrangement of their covalent connections produces polymers with different physical properties. Starch is organized for storage; cellulose forms strong structural material.
Conclusion: The samples differ not because one contains “real carbohydrate” and the other does not, but because carbohydrate structure allows the same broad class of molecules to perform different biological jobs.
Named misconception check: “All carbohydrates are immediate energy”
Misconception — “Carbohydrates are only quick energy.” Some carbohydrates can be broken down to provide usable sugar molecules, but not all carbohydrates function primarily as immediate fuel. Cellulose is a major structural material, while starch and glycogen are storage molecules. A correct explanation must distinguish chemical class from biological function.
A second misconception is that a polymer is simply a pile of monomers with no new properties. In reality, the way monomers are connected affects the polymer’s shape, strength, accessibility, and function. Covalent bonding creates the chain, but the organization of that chain helps determine what the organism can do with it.
AP skill in action
Science Practice 1 — Concept Explanation, Skill 1.A: “Describe biological concepts and processes.” For Topic 1.4, a strong response does more than define carbohydrate terms. It describes the relationship among monosaccharides, polysaccharides, covalent bonds, and biological function, then applies that relationship to examples such as cellulose, starch, or glycogen.
For example, instead of writing “cellulose is structural,” explain: Cellulose is a polysaccharide made from covalently connected monosaccharides; its molecular organization produces a strong material that supports plant cell walls. That answer identifies the molecule, its construction, and its function.
Retrieval check
A cell links many monosaccharides into a large carbohydrate. What type of molecule has been produced, what kind of bond connects its subunits, and which example—cellulose, starch, or glycogen—would best match structural support in a plant?
Answer: The product is a polysaccharide; its monosaccharides are connected by covalent bonds; and cellulose best matches structural support in a plant.
1.5 Lipids
A lipid’s behavior depends less on a single “lipid building block” than on how its subcomponents are assembled. Because lipids are typically nonpolar, they do not mix readily with water; this hydrophobic behavior helps organisms store energy and build boundaries between watery environments.
1.5 Lipids
A lipid’s behavior depends less on a single “lipid building block” than on how its subcomponents are assembled. Because lipids are typically nonpolar, they do not mix readily with water; this hydrophobic behavior helps organisms store energy and build boundaries between watery environments.
Learning Objective 1.5.A: Describe the structure and function of lipids.
Essential Knowledge 1.5.A.1: Lipids are typically nonpolar, hydrophobic molecules whose structure and function are derived from the way their subcomponents are assembled.
Why oil stays separate from water
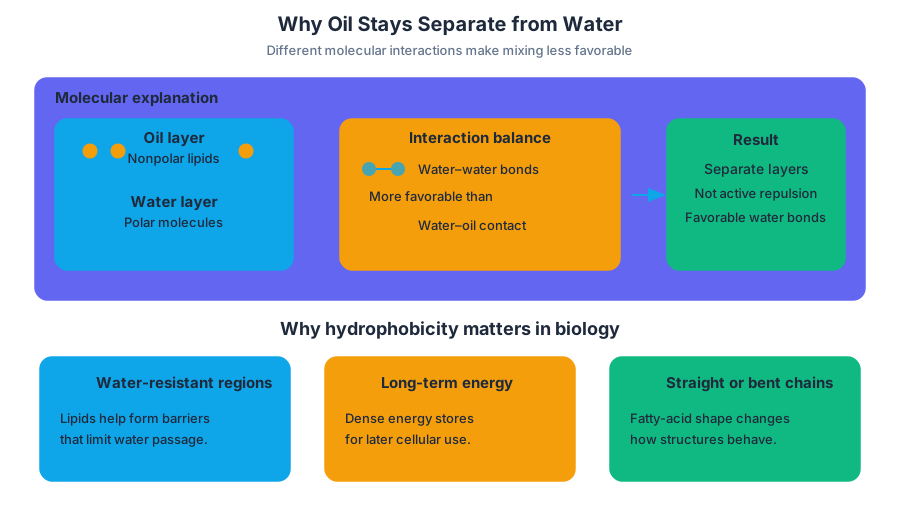
When cooking oil is poured into water, the two liquids form separate layers. Water molecules interact strongly with one another, while the nonpolar lipid molecules do not form comparable interactions with water. The result is not that oil is “repelled” by an active force; rather, water-water interactions are more favorable than mixing water with nonpolar molecules.
This hydrophobic property is biologically useful. Lipids can form water-resistant regions, serve as long-term energy stores, and contribute to structures whose behavior depends on whether their fatty-acid components are straight or bent.
Fatty acids: saturated versus unsaturated
A fatty acid is a hydrocarbon chain with a carboxyl group at one end. Its carbon-carbon bonding pattern determines whether it is saturated or unsaturated.
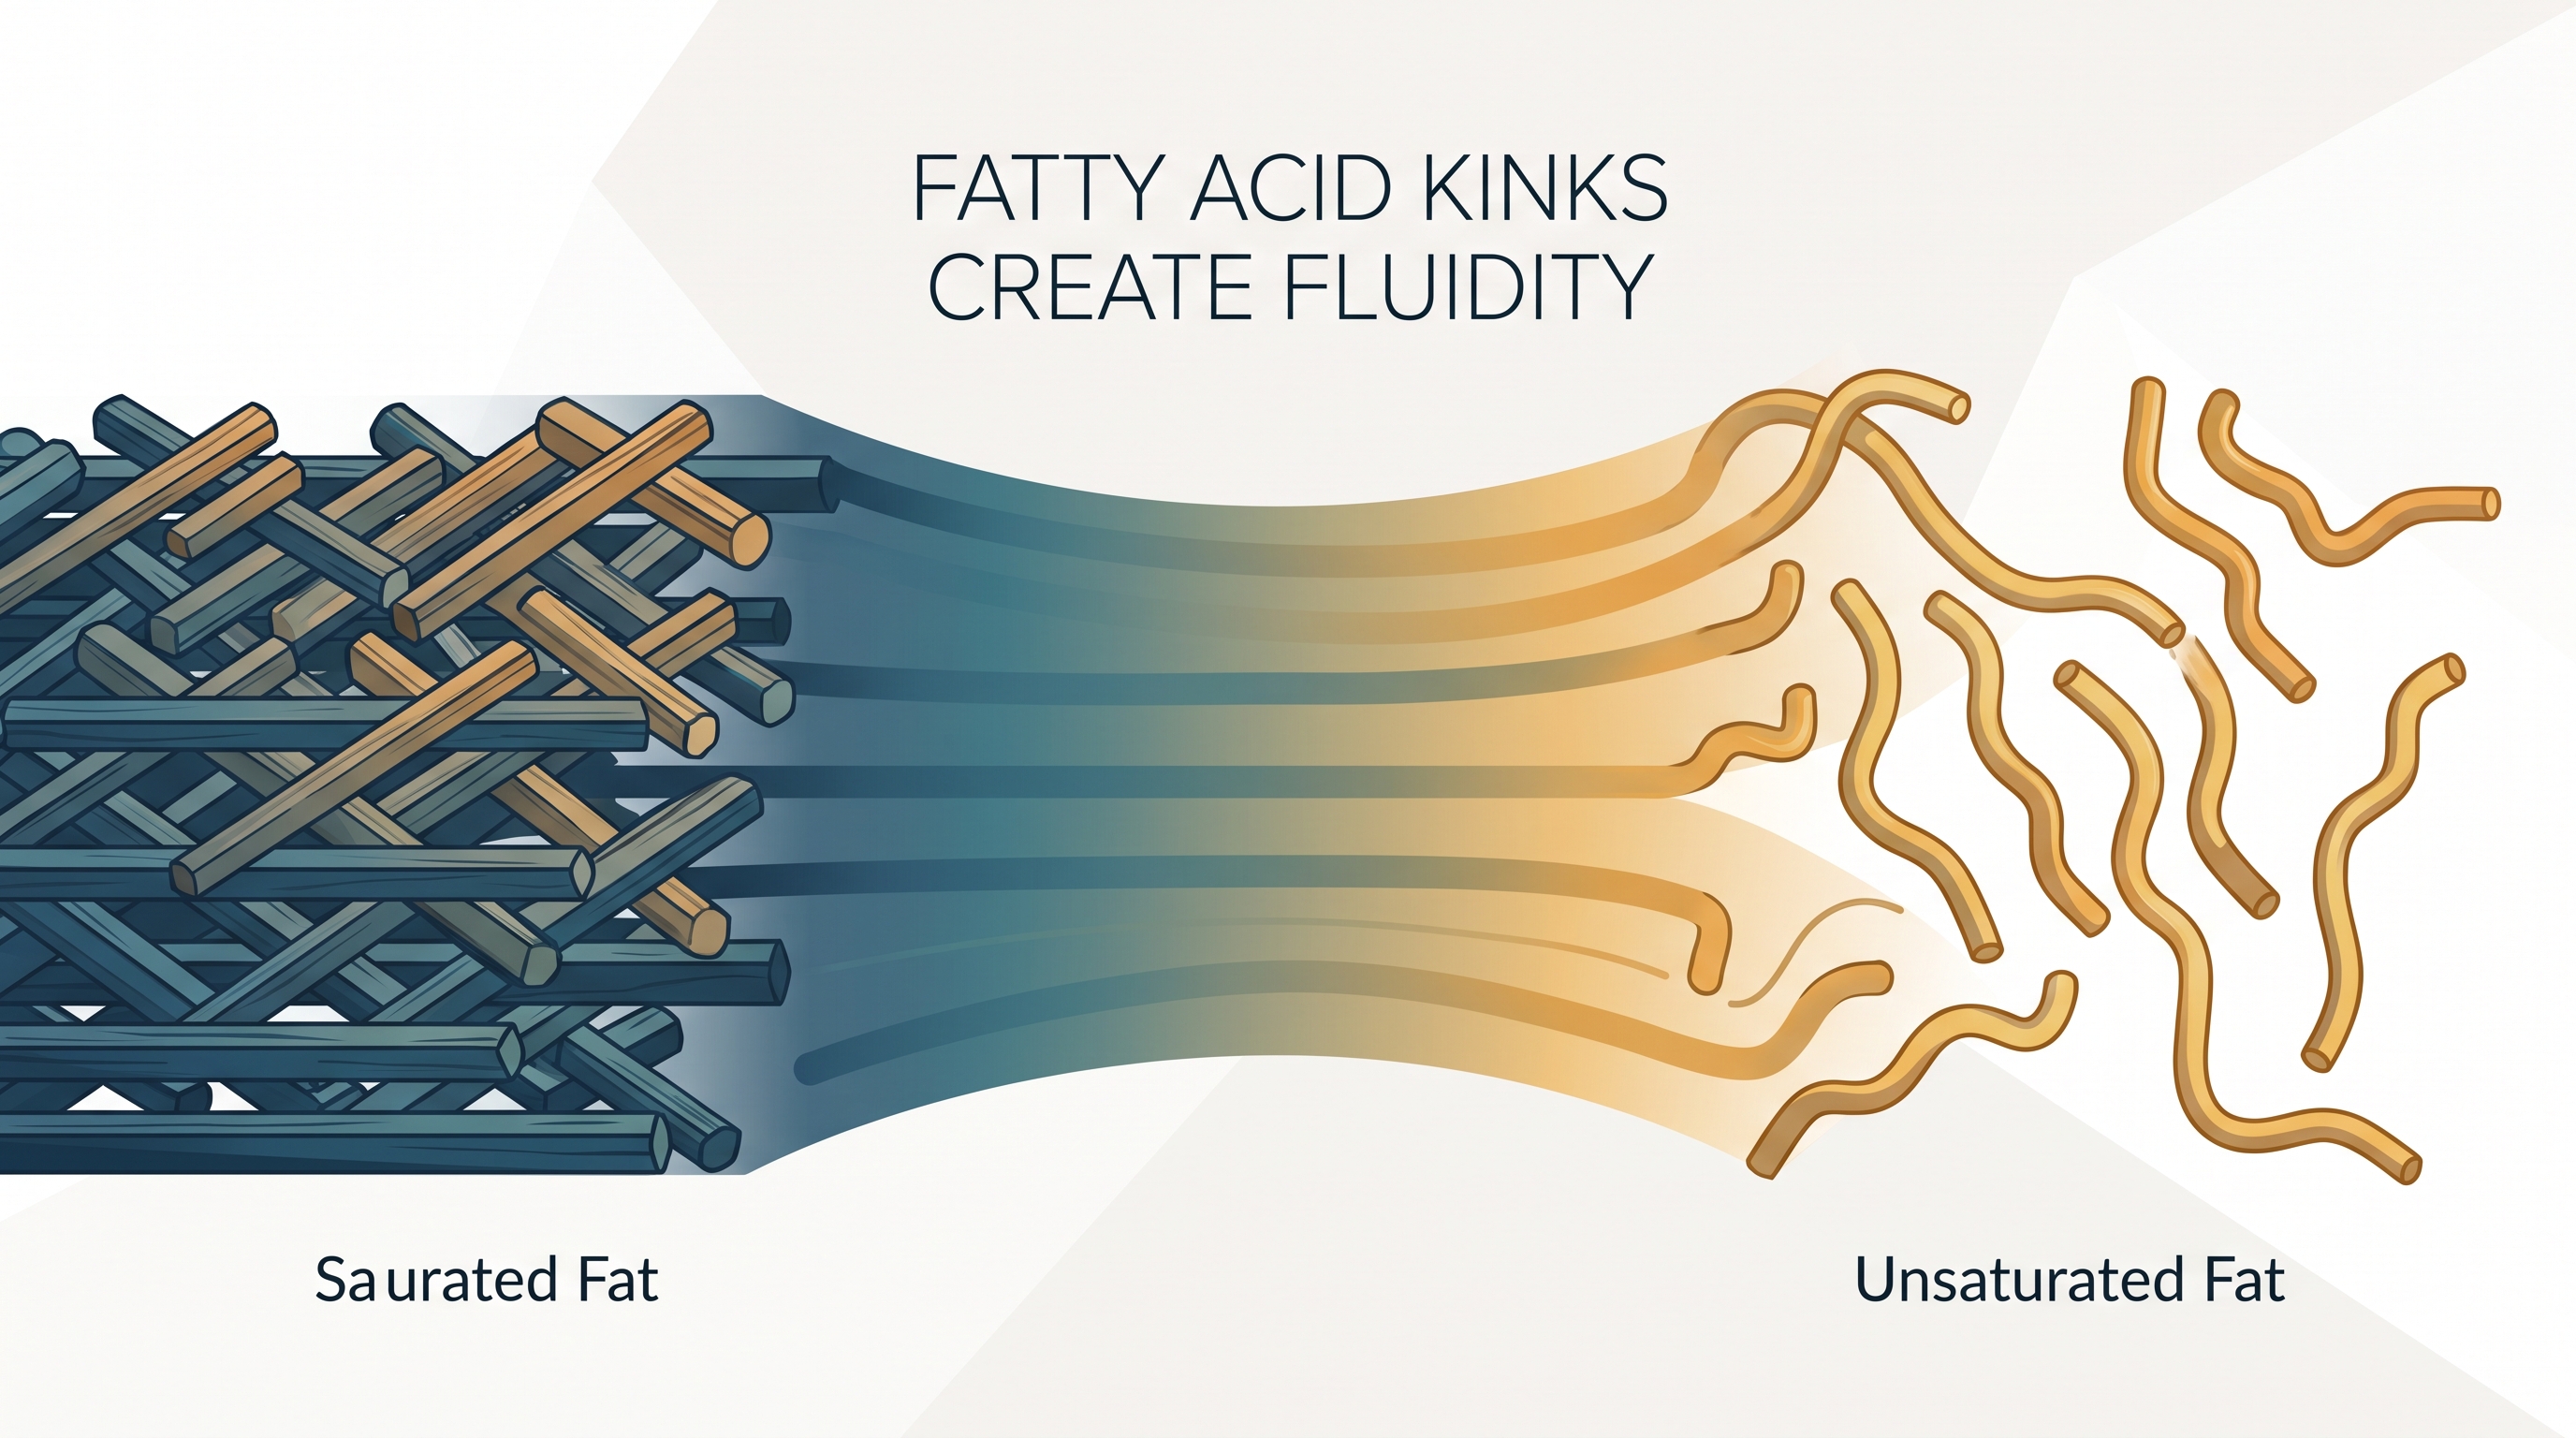
- Saturated fatty acids contain only single bonds between carbon atoms. Their chains remain relatively straight, allowing neighboring molecules to pack closely.
- Unsaturated fatty acids contain one or more carbon-carbon double bonds. A cis double bond introduces a bend, or kink, into the chain.
- The more unsaturated a lipid is, the more likely it is to remain liquid at room temperature.
The word saturated refers to hydrogen saturation: with only single carbon-carbon bonds, the chain holds as many hydrogen atoms as its carbon skeleton permits. A double bond reduces the number of attached hydrogens, making the fatty acid unsaturated.
Worked example: butter and olive oil
Suppose butter is firm on a kitchen counter while olive oil remains liquid. A useful explanation begins with structure rather than memorized food labels:
- Butter contains a greater proportion of fatty acids with straight, saturated chains.
- Straight chains can pack closely together.
- Close packing strengthens the collective attractions among lipid molecules.
- More energy is therefore required to disrupt the organized arrangement, so the material tends to be solid at room temperature.
- Olive oil contains a greater proportion of unsaturated fatty acids.
- Cis double bonds create kinks that interfere with close packing.
- The less efficiently packed molecules remain more mobile, so the lipid is more likely to be liquid at room temperature.
The key prediction is not simply “plant oils are liquid” or “animal fats are solid.” The stronger reasoning is: more unsaturated fatty-acid chains produce poorer packing and greater fluidity. This same structure-function logic becomes important when lipid molecules are assembled into biological membranes.
One structure, different behavior
Lipids are not one uniform substance. Their functions emerge from the arrangement of their subcomponents. Long hydrocarbon-rich regions make a molecule strongly nonpolar, while the presence and placement of double bonds alter chain shape, packing, and physical state.
| Fatty-acid structure | Chain shape | Packing | Expected physical behavior |
|---|---|---|---|
| Only single bonds | Relatively straight | Close | More likely solid |
| One or more double bonds | One or more bends may occur | Less close | More likely liquid |
| Greater unsaturation | More disrupted shape | Less efficient | Greater fluidity |
Misconception check: “All lipids are fats”
Misconception: Every lipid is a stored-fat molecule, and “lipid” and “fat” mean exactly the same thing.
Correction: Lipids are a broad group of typically nonpolar, hydrophobic molecules. Their shared feature is their chemical behavior and structure, not one identical shape or one single function. The structure of each lipid—and the way its subcomponents are assembled—helps determine whether it functions primarily in energy storage, water resistance, or cellular structure.
AP Biology reasoning in this topic
This topic is especially suited to Science Practice 2.A: Describe characteristics of visual representations of biological concepts and processes. On a molecular diagram, identify carbon chains, single bonds, double bonds, and the kink associated with a cis double bond. Then connect the visible shape to packing and fluidity rather than merely naming the molecule.
It also develops Science Practice 6.E: Predict the causes or effects of a change in, or disruption to, one or more components in a biological system. For example, increasing the proportion of unsaturated fatty acids should make a lipid mixture more fluid at room temperature because the added kinks reduce close packing.
Retrieval check
A lipid mixture changes from mostly saturated fatty acids to mostly unsaturated fatty acids. Predict its room-temperature state and explain the molecular cause in one sentence.
Answer: It should become more liquid because double bonds—especially cis double bonds—bend fatty-acid chains, reduce close packing, and increase fluidity.
1.6 Nucleic Acids
Key concepts: Nucleotides and nucleic acid synthesis · The 3′ hydroxyl and 5′ phosphate groups of nucleotide sugars · Determining nucleic acid sequences from overlapping fragments · Restriction endonucleases and DNA fragment generation · Determining allele frequencies using electrophoretic analysis · Alignment of the first five bases or amino acids · Gel electrophoresis of nucleic acids and amino acids · Agarose gels, electrical current, and conducting buffer · Bio-Rad modular laboratory research resources · Proteases, including bromelain and papain
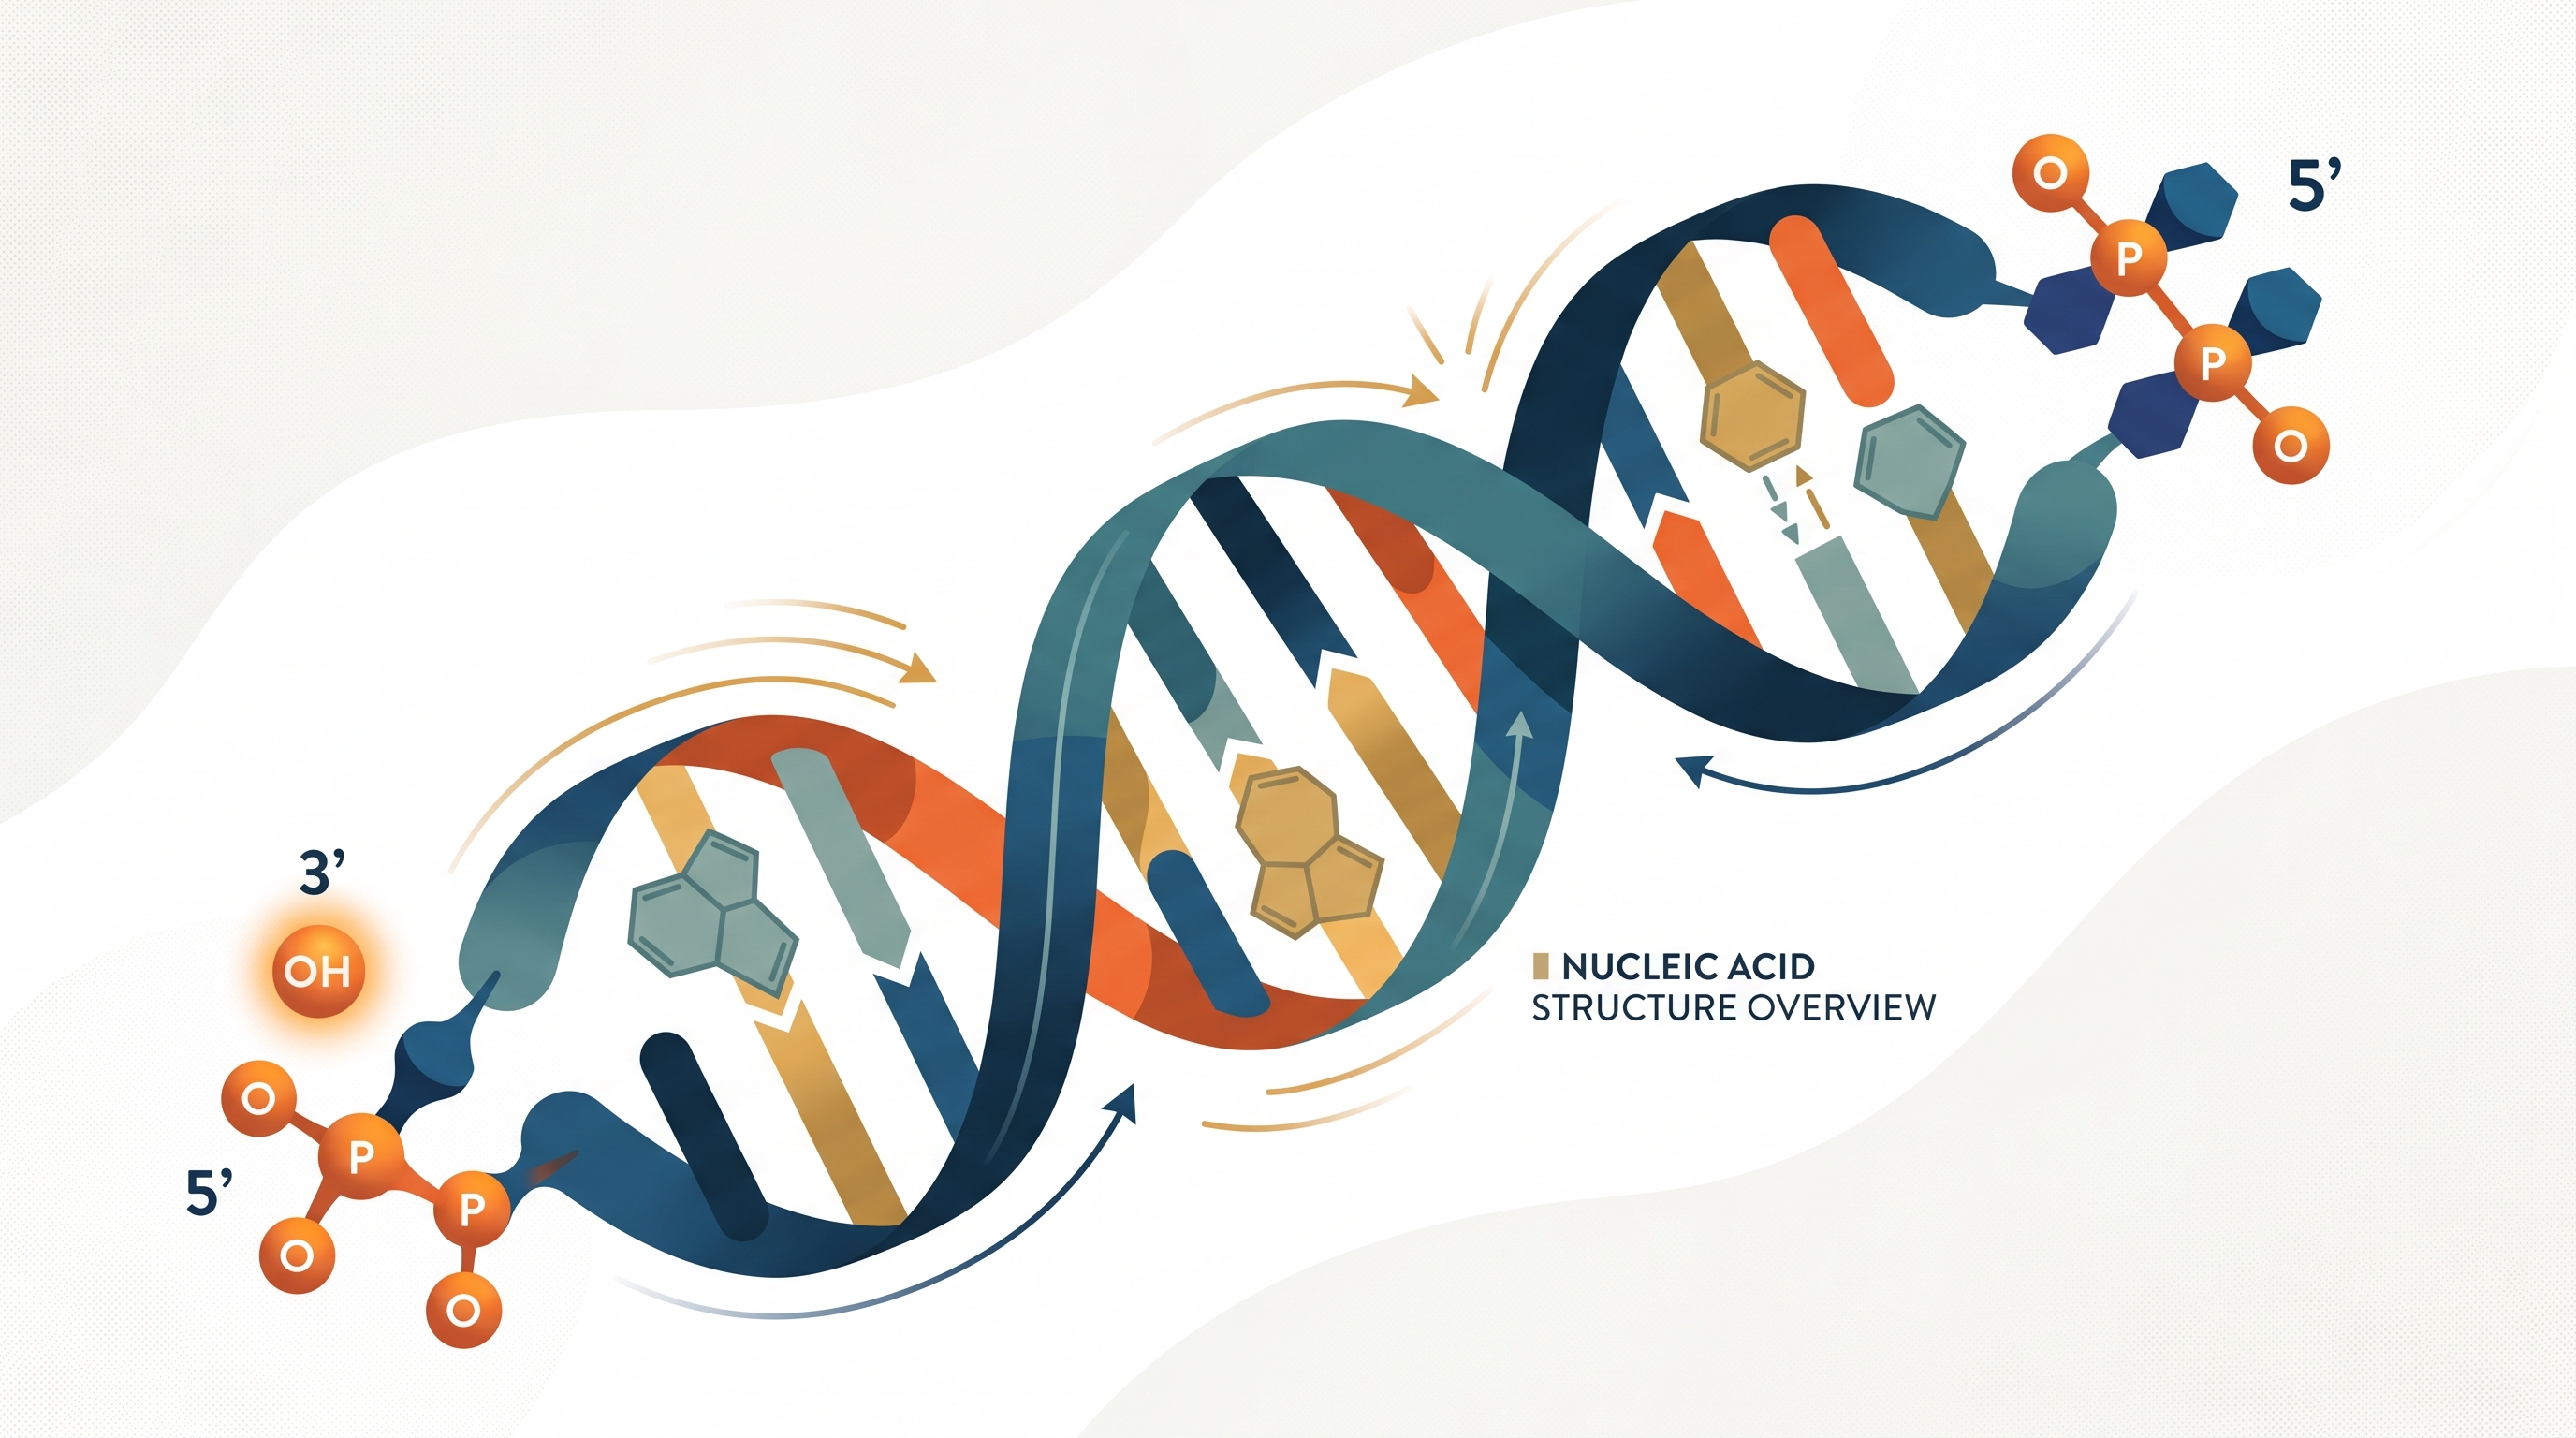
A DNA strand grows in one direction: new nucleotides are added to its free $3'$ end, where a $3'$ hydroxyl group can react with the incoming nucleotide’s $5'$ phosphate.
1.6 Nucleic Acids
A DNA strand grows in one direction: new nucleotides are added to its free $3'$ end, where a $3'$ hydroxyl group can react with the incoming nucleotide’s $5'$ phosphate. That directional chemistry explains how cells build nucleic acids, how scientists read unknown sequences, and how DNA fragments become evidence about alleles.
Learning Objective 1.6: Explain the connection between the sequence and the molecular structure of nucleic acids.
Essential Knowledge: Nucleic acids have a linear sequence of nucleotides. During nucleic acid synthesis, nucleotides are added to the $3'$ end of the growing strand, forming covalent bonds between nucleotides. The detailed molecular structures of specific nucleotides are beyond the scope of the AP Exam.
From nucleotide sugars to a growing strand
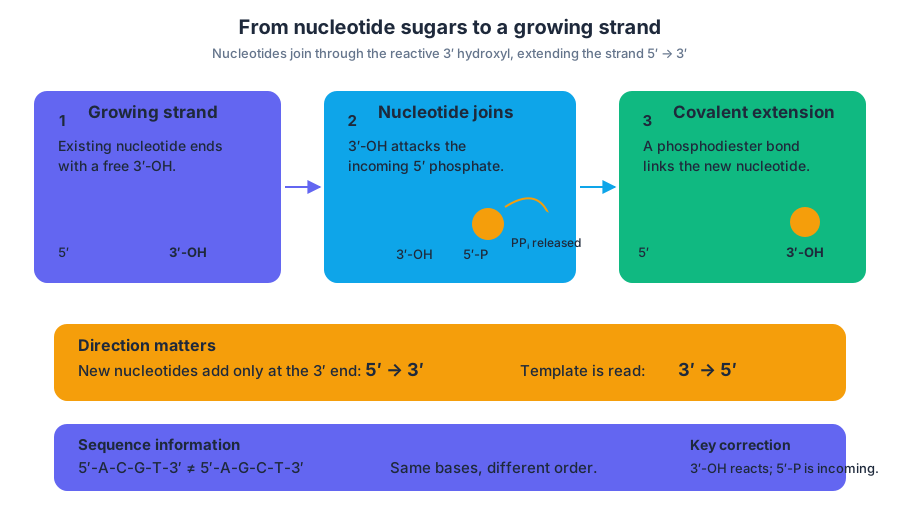
A nucleotide is the repeating subunit of a nucleic acid. In a nucleic-acid strand, each nucleotide contributes a sugar-phosphate portion to the backbone and a nitrogen-containing base that carries sequence information. The base sequence is linear: for example, $5'$-$A$-$C$-$G$-$T$-$3'$ is different from $5'$-$A$-$G$-$C$-$T$-$3'$, even though both strands contain the same kinds of bases.
The two ends of a strand are chemically different. The $3'$ end has a free hydroxyl group, written $3'$-$OH$, on the sugar; the $5'$ end is associated with a phosphate group. During synthesis, the $3'$ hydroxyl of the growing strand attacks the incoming nucleotide’s $5'$ phosphate. A covalent phosphodiester bond forms between the nucleotides, and pyrophosphate, $PP_i$, is released from the incoming nucleoside triphosphate.
The result is not random attachment. Because the new nucleotide is added to the $3'$ end, the strand is synthesized in the $5' \rightarrow 3'$ direction. Its complementary template is read in the opposite direction, $3' \rightarrow 5'$. This orientation is essential when interpreting sequence diagrams or deciding which end of a fragment can extend.
Misconception check: “The $5'$ end adds new nucleotides because it has the phosphate.”
Correction: The incoming nucleotide supplies the phosphate, but the growing strand supplies the reactive $3'$ hydroxyl. Addition occurs at the growing strand’s $3'$ end.
Reading a sequence from overlapping fragments
A long nucleic-acid sequence can be reconstructed from shorter fragments if the fragments overlap. The overlap acts like matching pieces of a biological sentence: align identical internal bases, then extend the sequence across the shared region.
Worked example. Suppose a sequencing procedure produces these fragments:
- Fragment 1: $5'$-$A C G T A$-$3'$
- Fragment 2: $5'$-$G T A C C$-$3'$
- Fragment 3: $5'$-$A C C G A$-$3'$
Fragment 1 and Fragment 2 overlap at $G T A$, giving $A C G T A C C$. Fragment 2 and Fragment 3 overlap at $A C C$, extending the reconstruction to:
$$5' - A C G T A C C G A - 3'$$
The same reasoning can be applied to the first five bases or amino acids in sequence-analysis exercises. Begin by aligning the shortest matching run, verify that the neighboring bases agree, and then report the sequence in the requested orientation. A single misplaced overlap can shift every later position, so sequence alignment is an evidence-matching task, not a guessing task.
Restriction endonucleases and DNA fragments
Restriction endonucleases are enzymes that cut DNA at particular recognition sequences. Their cuts generate fragments of different lengths. Scientists can compare those fragment patterns to create a genetic signature, map restriction sites, or distinguish DNA samples.
A restriction enzyme does not “read” the entire genome indiscriminately. It recognizes a specific DNA sequence and cleaves the phosphodiester backbone at or near that site. A nuclease is the broader category of enzyme that breaks nucleic acids; a restriction endonuclease is a more specific DNA-cutting tool used for controlled fragment generation.
Gel electrophoresis: separating fragments by movement
Gel electrophoresis separates molecules according to how rapidly they migrate through a porous gel when an electrical current is applied. Agarose, a gelatinlike material purified from seaweed, is dissolved in a current-carrying buffer and allowed to solidify around a comb, creating wells for DNA samples.
DNA carries an overall negative charge because of its phosphate groups, so DNA fragments migrate toward the positive electrode. Smaller fragments move more easily through the agarose pores and travel farther than larger fragments. Agarose gels can separate DNA fragments of roughly $200$ to $50{,}000$ base pairs.
Interpretation example: If individual A’s lane contains bands at the same positions as two different reference fragments, individual A may carry two distinguishable DNA variants. The band positions are evidence of fragment length; they are not themselves allele names unless the experiment defines which fragment corresponds to which allele.
Estimating allele frequency from electrophoretic data
Electrophoresis can reveal allele frequencies when enzymes or DNA fragments from multiple individuals produce distinguishable patterns. First classify each individual’s banding pattern as a genotype, then count allele copies—not merely the number of people showing a band.
For a diploid sample of $N$ individuals, there are $2N$ allele copies. If an allele appears $n$ times, its frequency is:
$$p=\frac{n}{2N}$$
For example, if $20$ individuals are analyzed and the target allele is counted $18$ times, then:
$$p=\frac{18}{40}=0.45$$
This calculation develops Science Practice 4: Representing and Describing Data, Science Practice 5: Statistical Tests and Data Analysis, and Science Practice 6: Argumentation. A strong conclusion identifies the observed band pattern, explains how it supports a genotype assignment, and connects the genotype counts to the allele-frequency calculation.
Retrieval check
Why does a strand synthesized from an incoming nucleotide triphosphate extend at its $3'$ end, and why does a smaller DNA fragment travel farther through agarose than a larger one? A complete answer should mention the growing strand’s $3'$ hydroxyl, the incoming nucleotide’s $5'$ phosphate, pyrophosphate release, DNA’s negative charge, and the gel’s porous structure.
1.7 Proteins
Key concepts: Absolute rate of a reaction · Measuring reaction rate over a specific amount of time · Absorbance as a measure of reaction rate · Anabolic reactions · Building sugar molecules in the Calvin cycle of photosynthesis · Baseline in chemical reactions
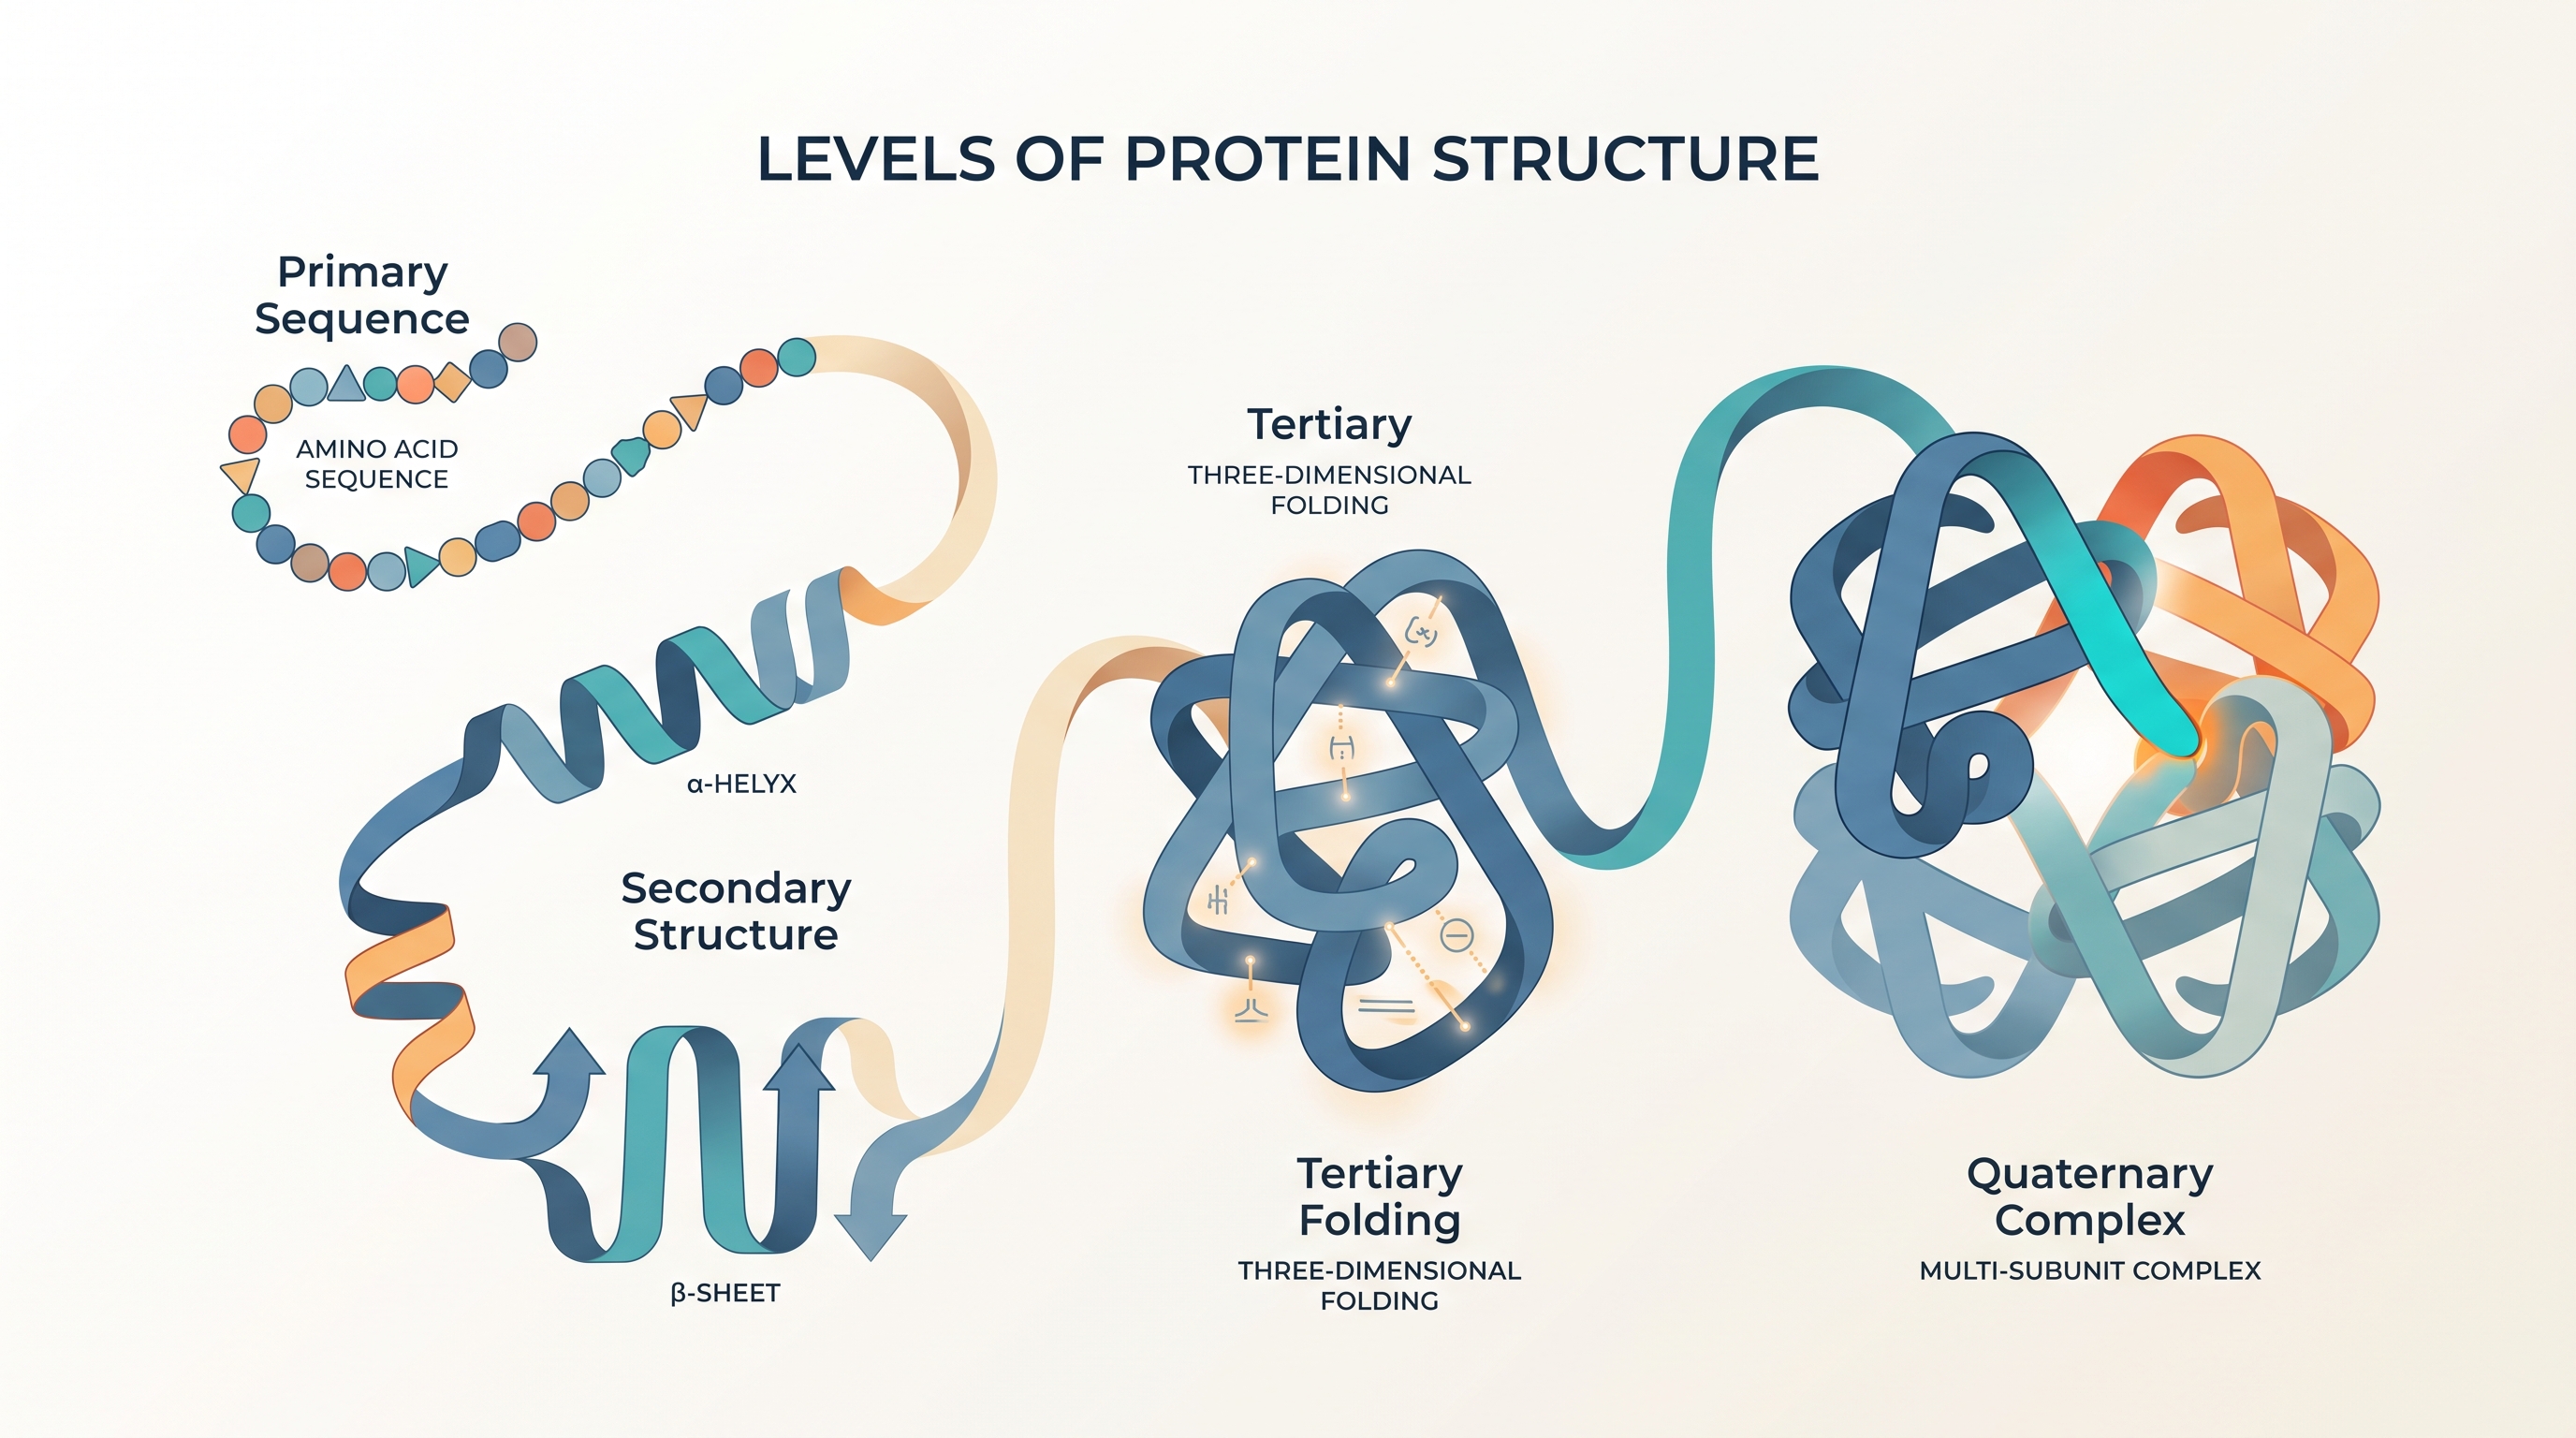
Proteins can act as enzymes that change how quickly chemical reactions occur. A protease, for example, is a protein enzyme that breaks down other proteins; the important experimental question is not merely whether the reaction happens, but how fast it happens.
1.7 Proteins
Proteins can act as enzymes that change how quickly chemical reactions occur. A protease, for example, is a protein enzyme that breaks down other proteins; the important experimental question is not merely whether the reaction happens, but how fast it happens.
CED traceability: Learning Objective LO 1.7-1; Essential Knowledge EK 1.A.3. Protein structure gives proteins specialized functions, including catalytic functions that can be measured quantitatively through reaction rate.
Reaction rate: turning change into a number
A reaction rate describes how much a measurable quantity changes during a specified interval. If an enzyme causes a colored product to accumulate, the reaction can be followed by measuring the solution’s absorbance, the amount of light absorbed by the sample at a chosen wavelength.
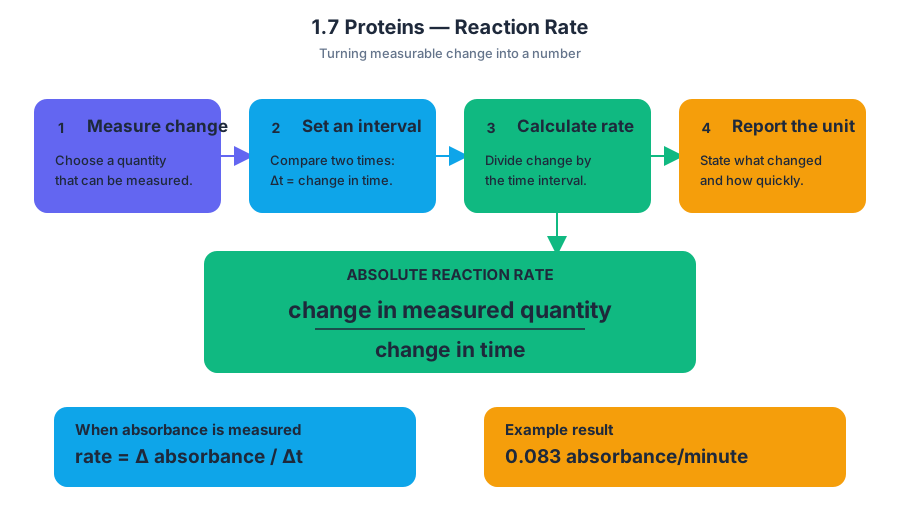
An absolute rate reports the total measured change per unit of time. It is calculated over a specific time interval rather than inferred from a vague statement such as “the reaction became faster.”
$$ \text{absolute reaction rate}=\frac{\text{change in measured quantity}}{\text{change in time}} $$
When absorbance is the measured quantity, the rate may be expressed as:
$$ \text{reaction rate}=\frac{\Delta \text{absorbance}}{\Delta t} $$
For example, a reaction with a rate of $0.083$ absorbance units per minute can be reported as:
$$ 0.083\ \text{absorbance/minute} $$
The unit matters: it tells you both what changed and how quickly it changed.
Worked example: measuring an enzyme reaction
Suppose a protease reaction has an absorbance of $0.20$ at $2$ minutes and $0.53$ at $6$ minutes. The absorbance increased by:
$$ \Delta A=0.53-0.20=0.33 $$
The elapsed time was:
$$ \Delta t=6-2=4\ \text{minutes} $$
Therefore, the absolute rate is:
$$ \frac{\Delta A}{\Delta t}
\frac{0.33}{4}
0.0825\ \text{absorbance/minute} $$
Rounded appropriately, the reaction rate is $0.083$ absorbance/minute.
This calculation does not mean that the absorbance increased by $0.083$ during the entire experiment. It means that, over the selected four-minute interval, the average increase was $0.083$ absorbance units per minute.
Why the baseline matters
A baseline is a standard reference condition used for comparison. In a chemical reaction investigation, the baseline establishes what happens when the experimental factor has not been changed—for example, when the usual enzyme concentration, temperature, or substrate concentration is used.
A baseline helps separate the effect of the manipulated variable from changes caused by the measuring instrument, the reaction mixture, or time itself. If a solution already has an absorbance of $0.20$ before the reaction begins, that starting value should not automatically be interpreted as product formed during the measured interval.
A useful visual model is:
initial absorbance ───────────────► final absorbance
       A_i                                  A_f

             change = A_f - A_i
             rate = (A_f - A_i) / (t_f - t_i)
The baseline is the starting reference, not necessarily zero.
Anabolic reactions and protein enzymes
An anabolic reaction builds a larger molecule from smaller molecules and generally requires an input of energy. In photosynthesis, the Calvin cycle contains anabolic reactions that build sugar molecules from smaller carbon-containing compounds.
This contrasts with the action of proteases, which catalyze breakdown reactions. The distinction is about molecular direction:
| Reaction type | Molecular effect | Example |
|---|---|---|
| Anabolic | Builds larger molecules | Sugar formation in the Calvin cycle |
| Catabolic | Breaks larger molecules into smaller molecules | Protein breakdown by a protease |
The enzyme itself is not consumed as the reaction proceeds. Instead, its protein structure allows it to interact with particular reactants and lower the activation energy required for the reaction. Measuring absorbance over time provides evidence of the enzyme’s activity, while the reaction’s biological context explains what the enzyme is doing.
Misconception check: “A higher absorbance always means a faster reaction”
Misconception: The sample with the greatest final absorbance must have had the fastest reaction.
Correction: Final absorbance measures how much light the sample absorbed at the endpoint; reaction rate measures how rapidly absorbance changed over a defined interval. A sample may finish with a high absorbance because it started high, reacted for longer, or produced more total product—not because its rate was greatest.
To compare rates fairly, use the same time interval or calculate each absolute rate from the relevant initial and final measurements. Also compare experimental values with the baseline before attributing the difference to the enzyme or treatment.
Retrieval check
A reaction’s absorbance changes from $0.14$ to $0.47$ in $5$ minutes. What is its absolute rate, and what does the unit mean?
The calculation is:
$$ \frac{0.47-0.14}{5}
\frac{0.33}{5}
0.066\ \text{absorbance/minute} $$
The value means that absorbance increased by an average of $0.066$ absorbance units per minute during that measured interval.
2.1 Cell Structure and Function
Key concepts: Cellular membranes and their role in separating internal and external environments · Phospholipid bilayers in plasma and cell membranes · Hydrophobic/nonpolar, hydrophilic/polar, and ionic chemical properties · Fats as energy-storage molecules that support cell function · Steroids as hormones involved in growth, development, energy metabolism, and homeostasis · Cholesterol as a structural component that stabilizes animal cell membranes · Organelles and their contributions to cellular structure and function · Chloroplasts as double-membrane organelles where photosynthesis occurs · Mitochondrial folds and efficient ATP synthesis · Biological systems using energy and molecular building blocks to grow, reproduce, and maintain dynamic homeostasis
A cell survives because its membrane creates a controlled boundary: it separates the cell’s internal environment from the external environment while still allowing selected substances to cross.
2.1 Cell Structure and Function
A cell survives because its membrane creates a controlled boundary: it separates the cell’s internal environment from the external environment while still allowing selected substances to cross. That boundary is not a rigid wall; it is a dynamic, lipid-based surface whose chemical properties determine which molecules interact with it, enter it, or remain outside.
Learning Objective 2.1.A: Describe the structure and function of cells.
Essential Knowledge 2.1.A.1–2.1.A.2: Cell structures are related to their functions, and differences between prokaryotic and eukaryotic cells reflect different levels of internal organization.
Membranes as selective boundaries
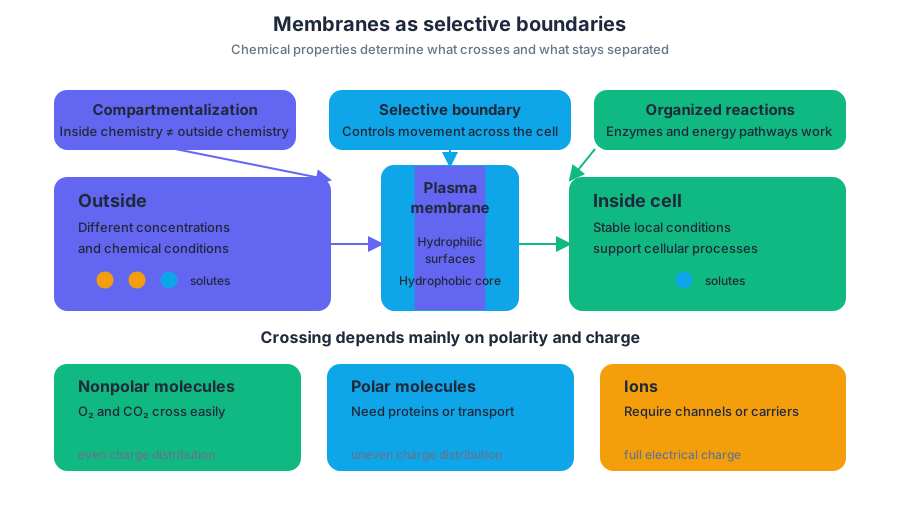
The plasma membrane is the cell’s outer boundary. Its central job is compartmentalization, meaning that it keeps the chemistry inside a cell different from the chemistry outside. This separation makes cellular processes possible: enzymes can operate at appropriate concentrations, ions can be distributed unevenly, and energy-converting reactions can occur in organized locations.
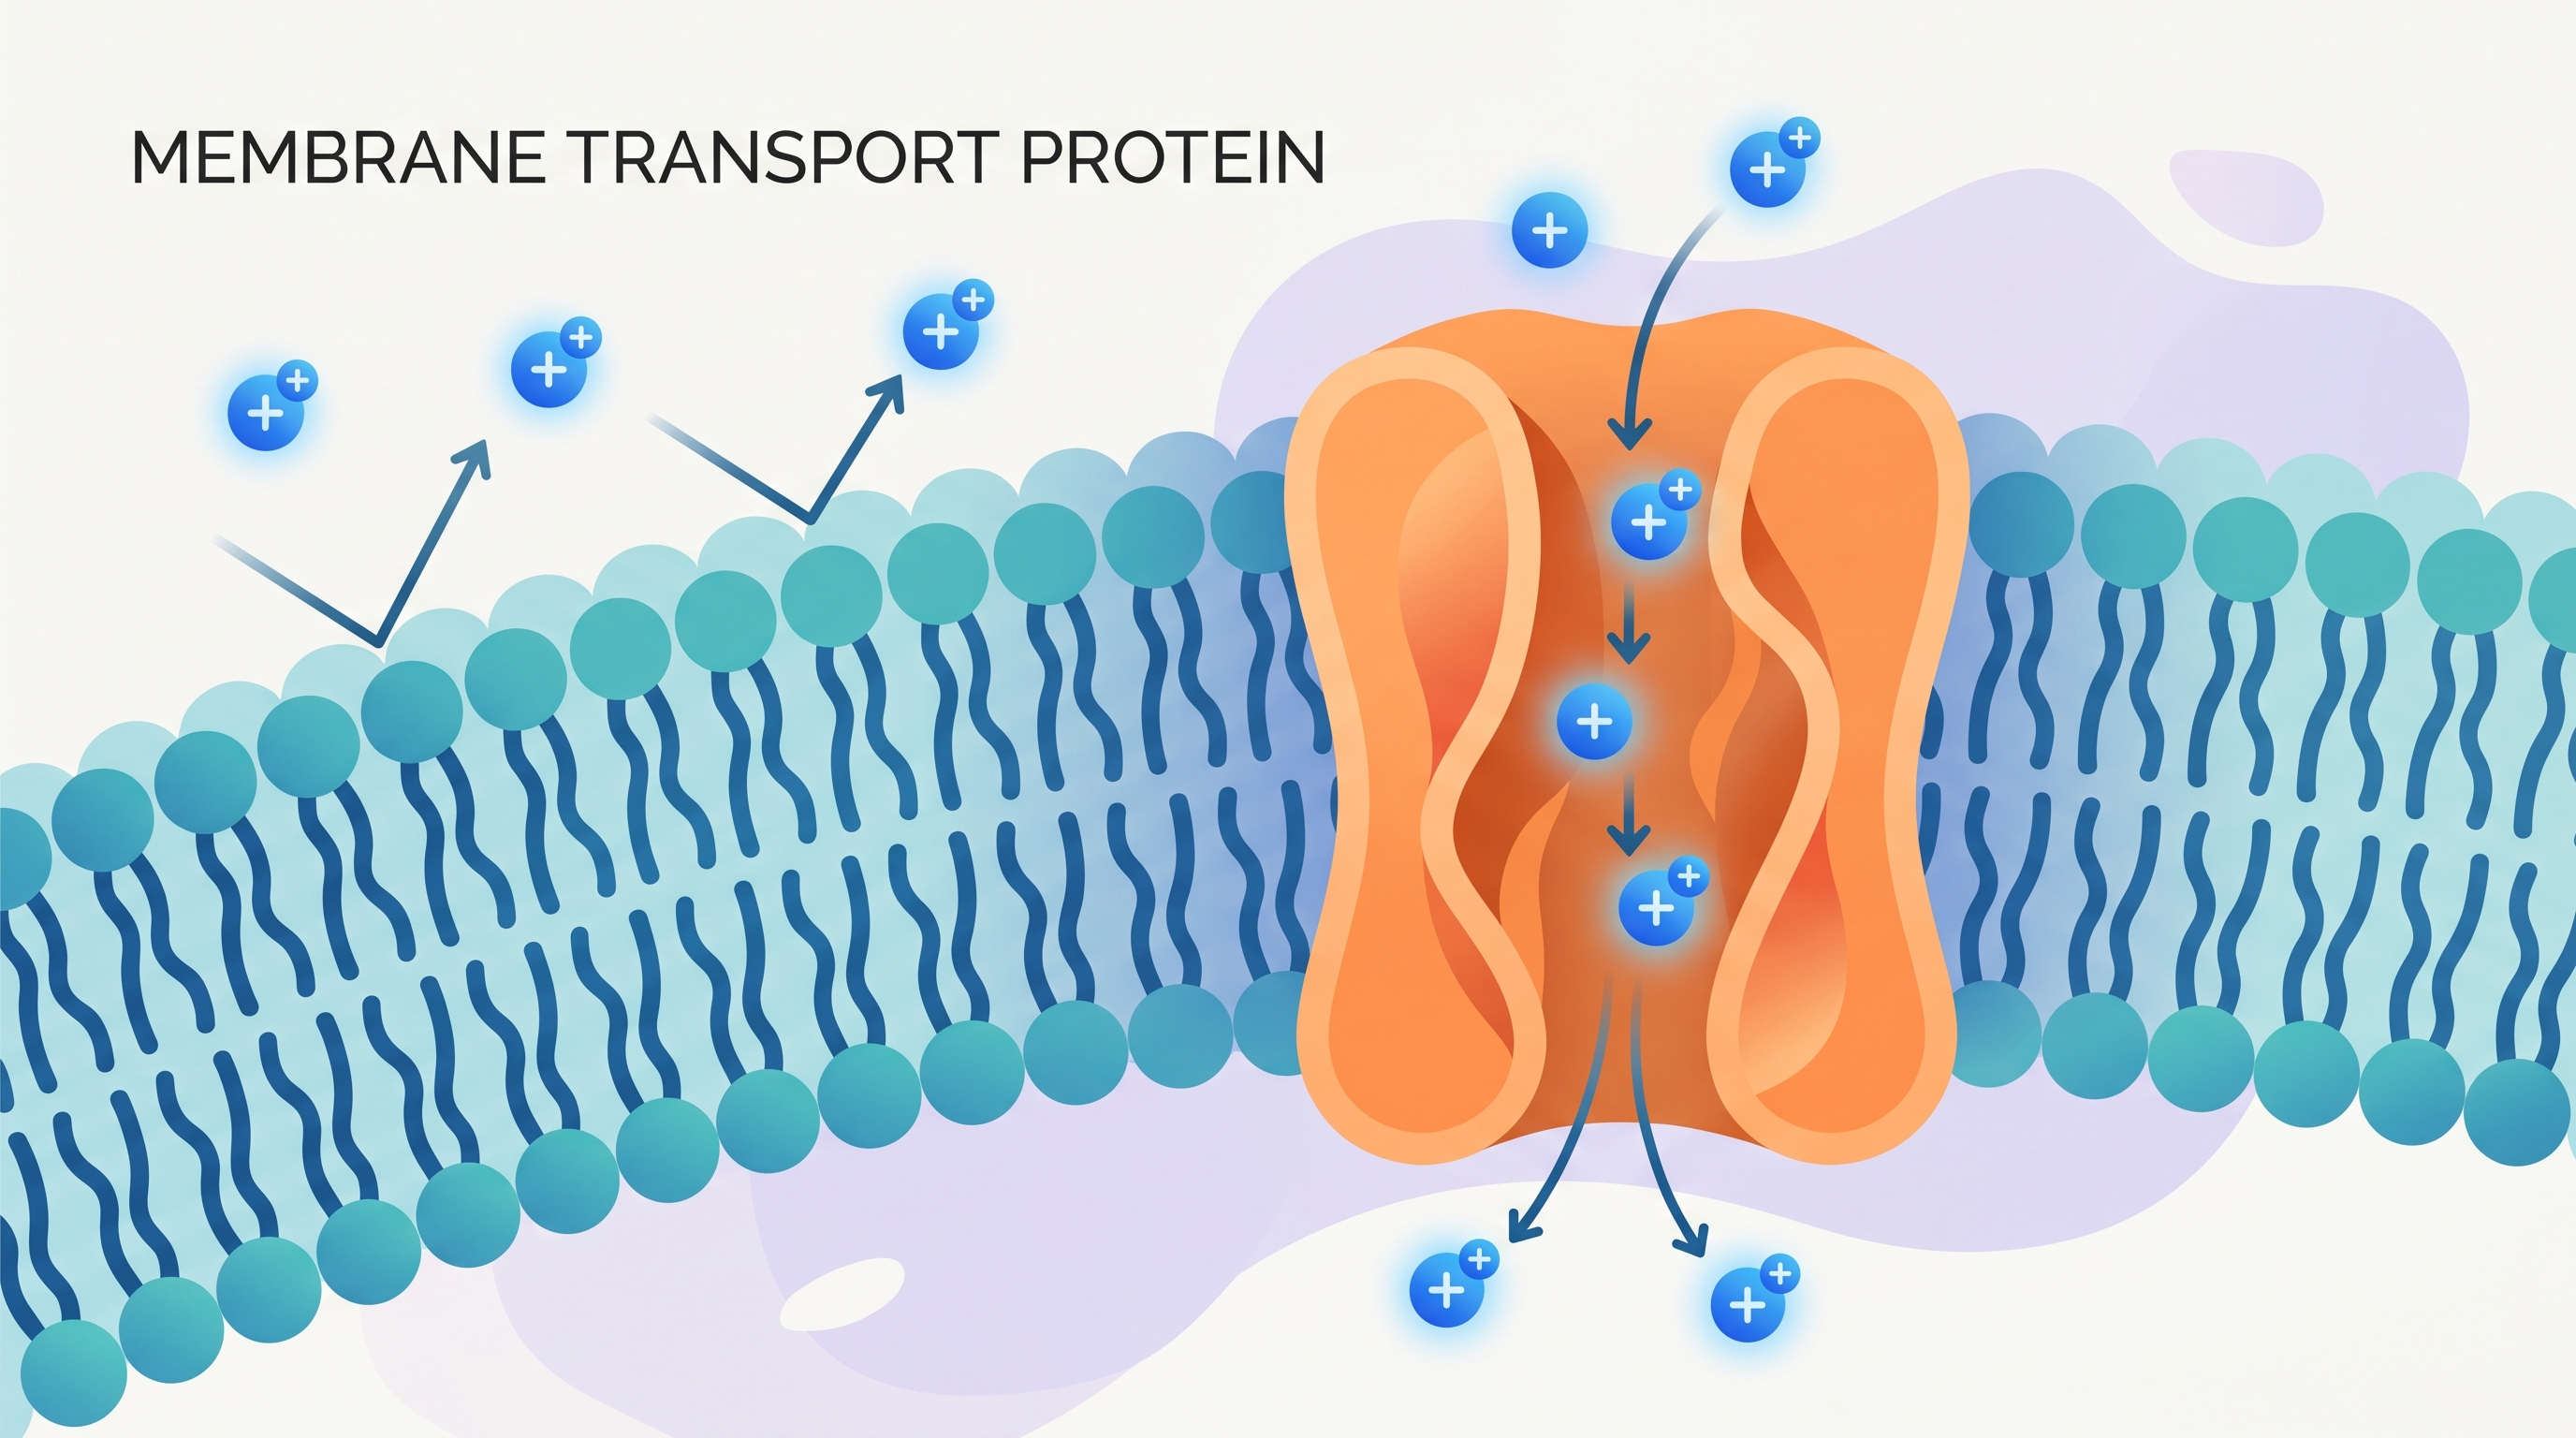
A membrane’s interior is largely hydrophobic, meaning that it avoids water and interacts poorly with charged or polar substances. Its surfaces interact more readily with water. As a result, small nonpolar molecules such as $O_2$ and $CO_2$ can pass through the membrane relatively easily, whereas many ions and polar molecules require membrane proteins or other transport mechanisms.
The important distinction is chemical, not simply physical. A molecule’s size matters, but its polarity and charge often matter more for crossing a membrane. Nonpolar molecules distribute their charge relatively evenly; polar molecules have uneven charge distribution; ions carry a full electrical charge. These properties influence membrane interactions, transport, signaling, and cellular targeting.
The phospholipid bilayer
Phospholipids group together to form the lipid bilayers found in plasma membranes and other cell membranes. A bilayer has two opposing layers of phospholipids, creating a hydrophobic interior between water-facing surfaces. This arrangement forms a stable boundary because the molecules organize according to their chemical interactions with water.
The membrane therefore behaves like a selective filter rather than an open doorway. Its lipid composition and associated proteins determine whether a substance crosses by direct diffusion, through a channel or carrier, or not at all. The molecular structure of specific lipids is beyond the required scope here; the functional principle is the relationship between chemical properties and membrane behavior.
Lipids support both structure and physiology
Lipids are not a single-purpose group. Fats provide long-term energy storage and support cell function. In mammals, stored fat can also provide insulation, reducing heat loss and helping maintain body temperature. Their energy-storage role connects molecular structure to whole-organism physiology: the same class of molecules can help supply fuel and protect against thermal stress.
Steroids, including cholesterol, are lipids. Steroid hormones act as chemical signals that support growth and development, energy metabolism, and homeostasis—the maintenance of relatively stable internal conditions. A hormone can travel from its site of production to target cells, where it changes cellular activity.
Cholesterol has a distinct structural role in animal cell membranes. It helps stabilize the membrane, preventing it from becoming excessively loose or excessively rigid as conditions change. Cholesterol is therefore both a lipid and a membrane component; it should not be treated only as a hormone.
Organelles use membranes to organize work
Eukaryotic cells use internal membranes to create specialized compartments. Chloroplasts contain a double membrane and are the location of photosynthesis. Mitochondria also use internal membrane organization; folds in their membranes provide a larger surface on which ATP can be synthesized more efficiently. The general principle is structure supports function: membrane boundaries and folds organize reactions and increase useful working area.
A useful way to apply this principle is to predict what happens when membrane structure changes. If a membrane becomes too permeable, ion gradients and concentration differences can collapse. If its internal surface area is increased by folds, more energy-producing machinery can operate simultaneously, improving the efficiency of ATP synthesis.
Worked example: connecting chemistry to transport
Suppose a cell is placed in an environment containing equal concentrations of $O_2$ and a charged ion. The $O_2$ concentration inside the cell is lower than outside, while the ion concentration is also higher outside. Predict their movement.
Because $O_2$ is small and nonpolar, it can move directly through the hydrophobic membrane interior by diffusion, from outside to inside. The charged ion cannot cross the hydrophobic interior freely; it requires a membrane protein, and its movement may depend on both the concentration gradient and the electrical gradient. The prediction follows from chemical properties rather than from the molecule’s name alone.
This reasoning can be tested experimentally by measuring the movement of a substance across membranes with different lipid compositions. Science Practice 3.C, Identify experimental procedures that are aligned to the question, requires choosing a procedure that actually measures permeability. Science Practice 5.D, Use data to evaluate a hypothesis or prediction, including rejecting or failing to reject the null hypothesis, can be applied by comparing measured transport rates between membrane treatments rather than merely describing the appearance of the cells.
Misconception check
Misconception: “All lipids are just stored fat.” Fats are important energy-storage molecules, but steroids function in signaling, cholesterol stabilizes animal membranes, and phospholipids form bilayers. A second misconception is that a membrane blocks everything; in reality, its selective permeability allows some substances to cross readily while restricting others.
Retrieval check
A molecule is electrically charged and cannot pass directly through the hydrophobic interior of a plasma membrane. What membrane feature would most directly allow its movement, and why?
Answer: A membrane transport protein, such as a channel or carrier, because the protein provides a pathway that avoids direct contact between the ion and the hydrophobic lipid interior.
2.2 Cell Size
Key concepts: Cell size and shape · Surface area-to-volume relationships · Cell size limitations · Cell membranes with many convolutions · Diffusion gradients · Osmosis gradients · Water movement into or out of plant cells · Plant-cell internal (turgor) pressure · Measuring cell-size effects through weight change
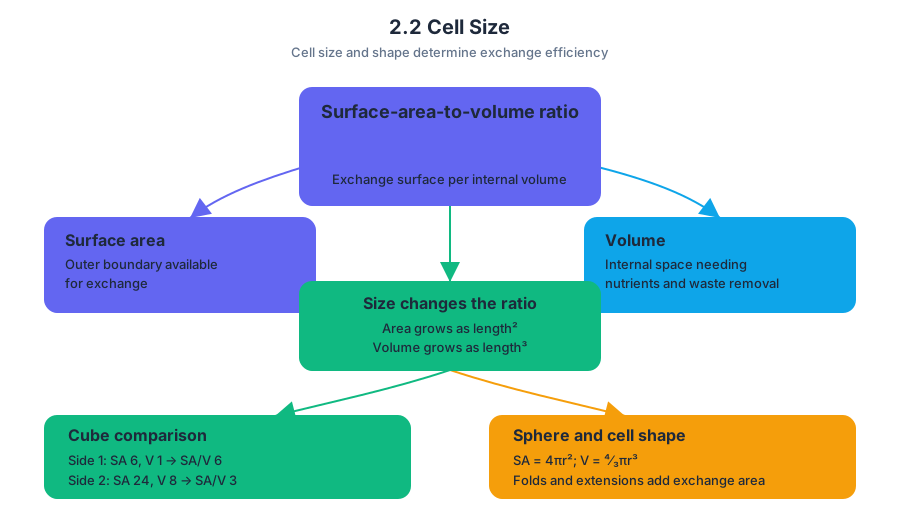
Most cells are small because exchange with the environment depends on surface area, while the cell’s chemical demands depend on volume. As a cell grows, volume increases faster than surface area, making it increasingly difficult to obtain materials and remove wastes quickly enough.
2.2 Cell Size
Most cells are small because exchange with the environment depends on surface area, while the cell’s chemical demands depend on volume. As a cell grows, volume increases faster than surface area, making it increasingly difficult to obtain materials and remove wastes quickly enough.
Cell size and shape
A cell’s surface area is the total area of its outer boundary available for exchange; its volume is the amount of internal space that requires nutrients, water, and waste removal. The relationship between these quantities is summarized by the surface-area-to-volume ratio, written as $\frac{SA}{V}$.
Consider two cubes. A cube with side length $1$ has surface area $6$ and volume $1$, so its ratio is $\frac{6}{1}=6$. A cube with side length $2$ has surface area $24$ and volume $8$, so its ratio is $\frac{24}{8}=3$. Doubling the side length quadruples surface area but increases volume eightfold; the larger cube therefore has less exchange surface per unit of internal volume.
The same pattern appears in a sphere: surface area is $4\pi r^2$, whereas volume is $\frac{4}{3}\pi r^3$. Because area depends on $r^2$ but volume depends on $r^3$, increasing radius causes volume to outpace surface area. Cell shape can partly solve this problem: intestinal epithelial cells and plant root-hair cells extend or fold their exchange surfaces, allowing more membrane area without requiring a proportionate increase in internal volume.
Membranes with many convolutions
A convolution is a fold, projection, or repeated contour that increases surface area. Many small cells and specialized cells have highly convoluted membranes because extra exchange surface supports faster movement of nutrients, gases, water, or wastes. The key idea is not that folding makes a cell smaller; it gives the cell more boundary through which exchange can occur.
Common misconception — “Large cells simply need more food.” The deeper limitation is geometric. A larger cell needs more resources because it has greater volume, but its surface area does not increase at the same rate. Even if substances can cross the membrane, the available exchange surface may be insufficient to support the entire interior.
Diffusion gradients
Diffusion is the net movement of particles from a region of higher concentration to a region of lower concentration. This difference is a concentration gradient. Diffusion is driven by the gradient, not by a cell “wanting” a substance to move; as the gradient becomes smaller, net movement slows until dynamic equilibrium is reached.
For a cell, short diffusion distances matter. A small cell places most of its cytoplasm close to the membrane, so oxygen or dissolved nutrients can reach the interior efficiently. A large, spherical cell has a relatively distant center, combining a lower $\frac{SA}{V}$ with a longer path for diffusion.
Osmosis gradients and plant-cell pressure
Osmosis is the net movement of water across a selectively permeable membrane in response to a water-potential gradient. Water tends to move toward the side with lower water potential, often the side with a higher effective solute concentration. Thus, water movement depends on a gradient rather than on the solute concentration of one solution considered in isolation.
In a plant cell, water entering the cell pushes the plasma membrane against the cell wall, producing internal turgor pressure. Turgor helps support leaves and stems. If water leaves the cell in a sufficiently concentrated surrounding solution, turgor pressure falls and the cell may become flaccid; severe water loss can cause the membrane to pull away from the wall.
Common misconception — “Water always moves into a plant cell because plants need water.” Water moves according to the water-potential gradient. A plant cell can lose water to its surroundings if the surrounding environment has lower water potential, such as after saltwater is applied to the soil.
Worked investigation: measuring cell response
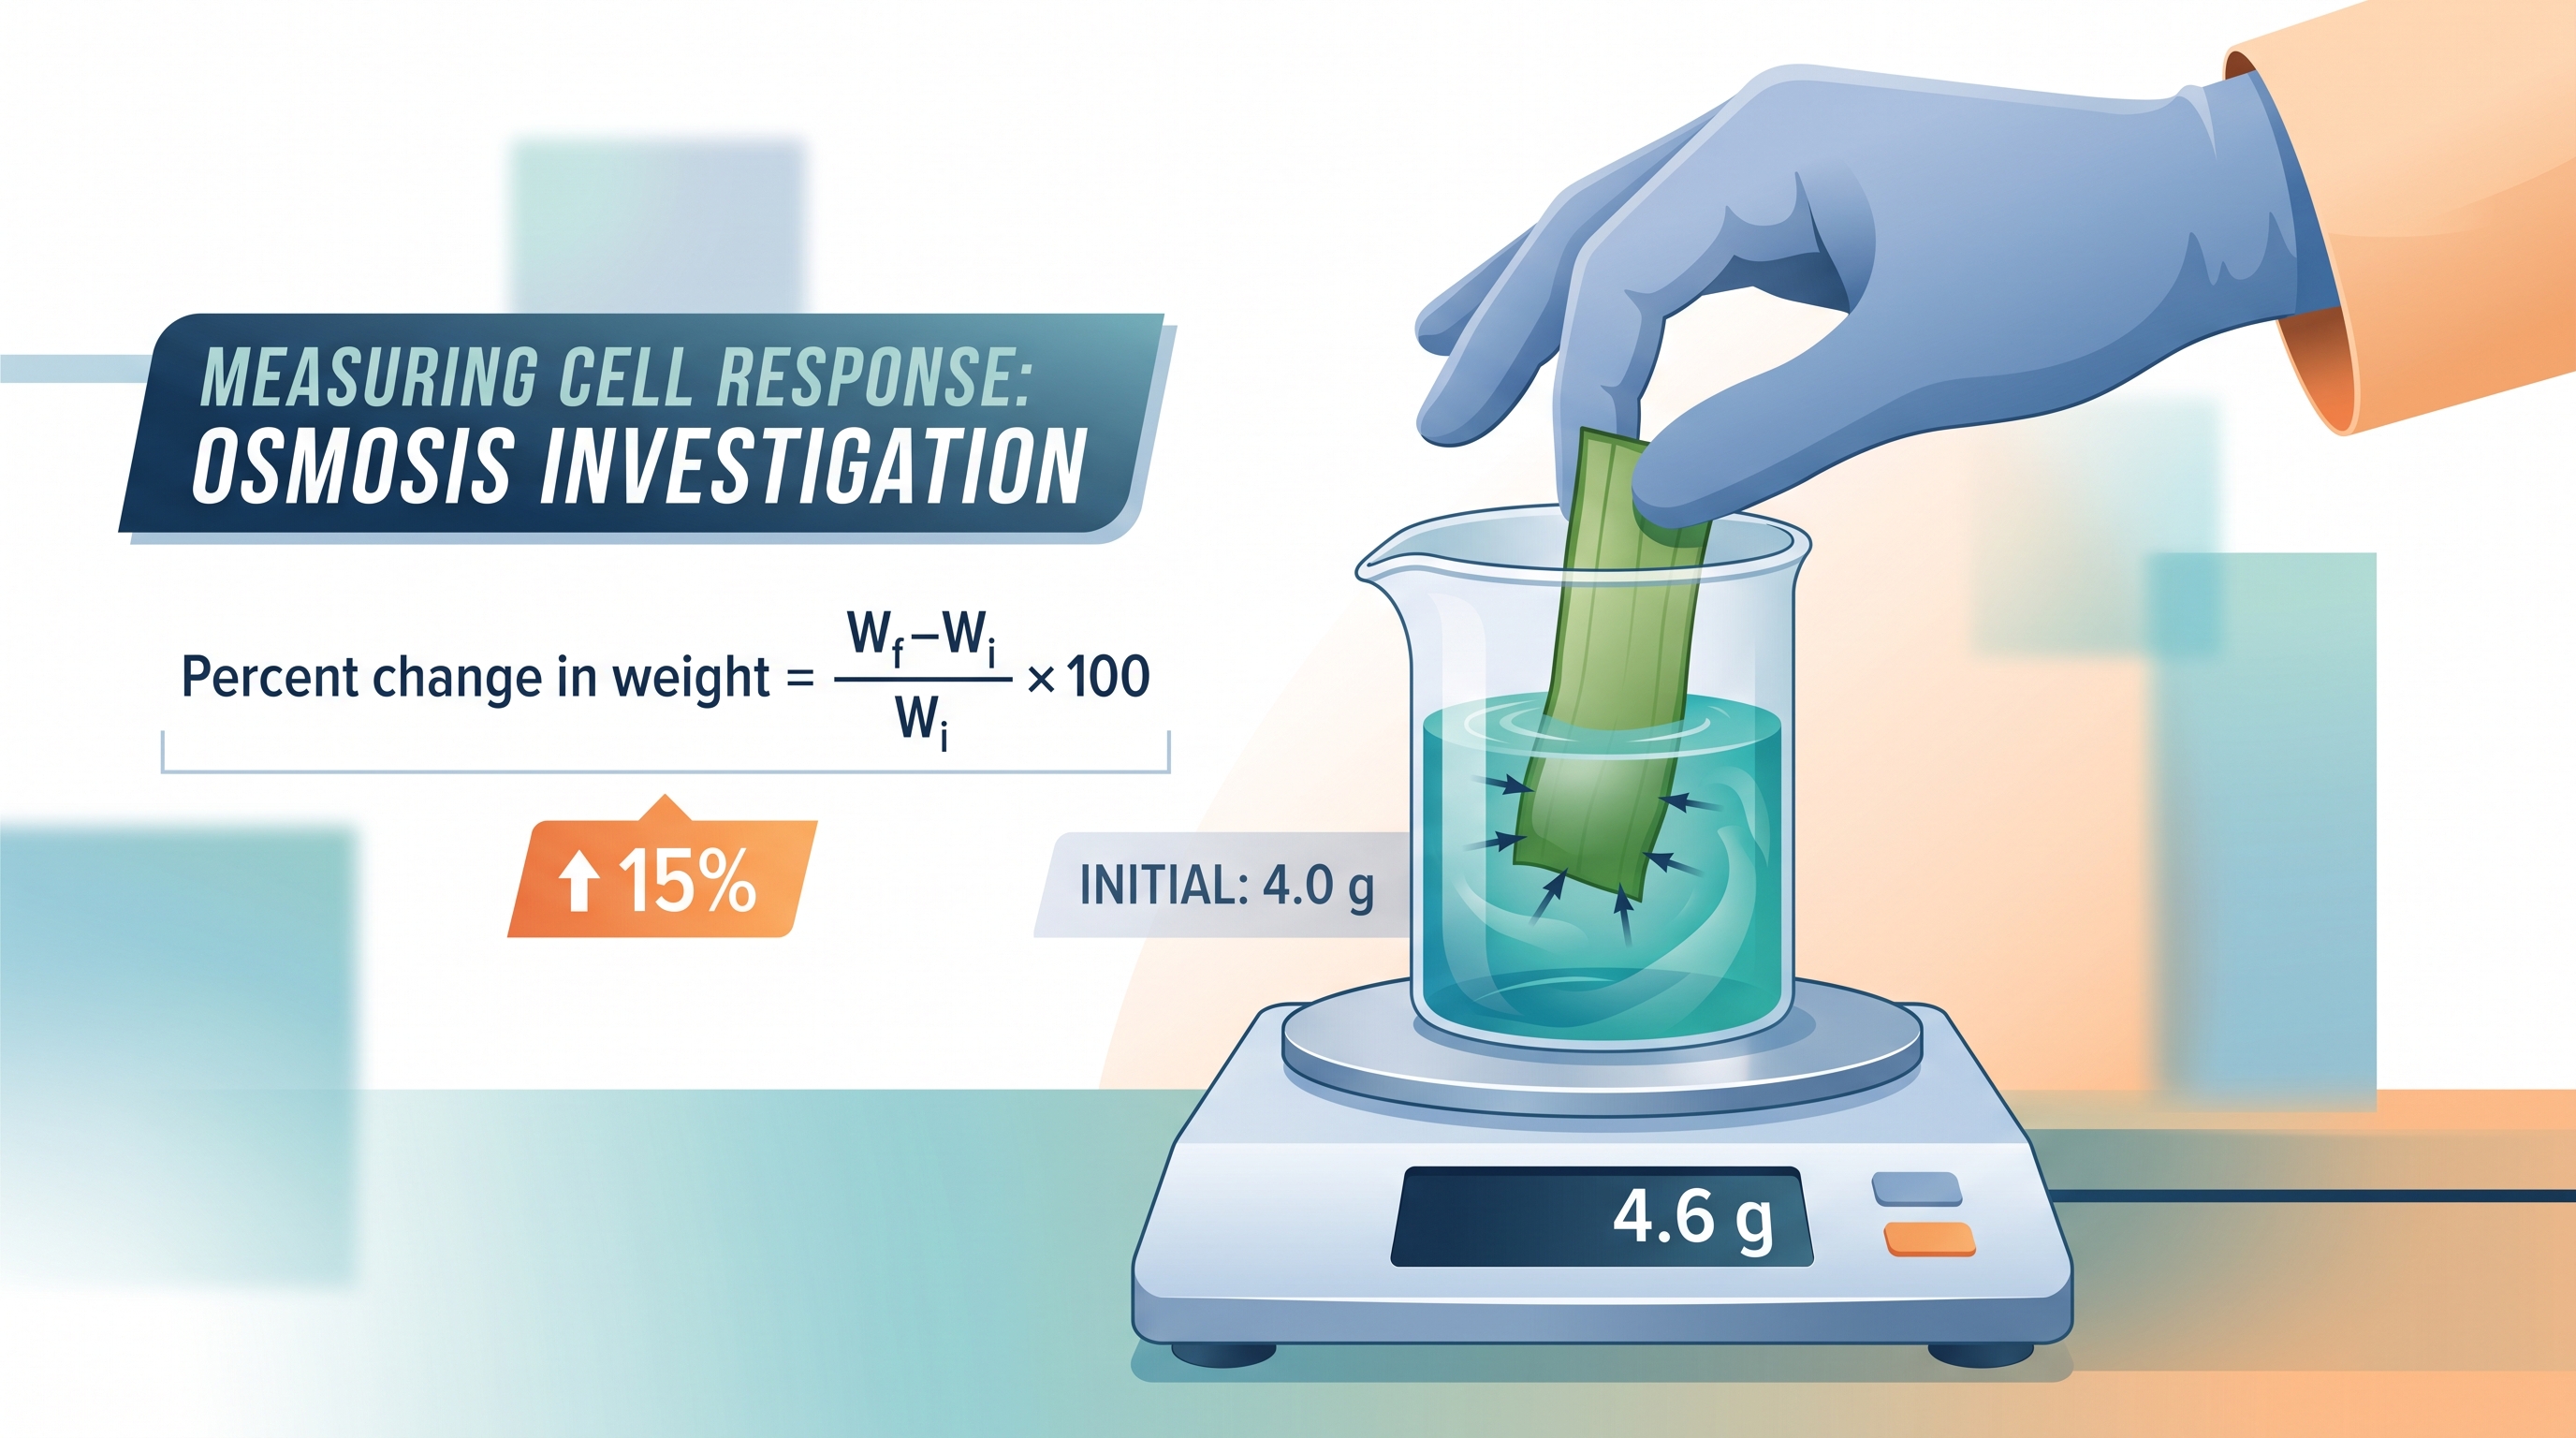
Suppose a piece of plant tissue is placed in a solution to test osmosis. First record its initial weight, $W_i$. After $30$ minutes, remove the tissue, measure its final weight, $W_f$, and record both values. Calculate percent change in weight with:
$$ \text{Percent change in weight}
\frac{W_f-W_i}{W_i}\times 100 $$
If $W_i=4.0\ \text{g}$ and $W_f=4.6\ \text{g}$, then:
$$ \frac{4.6-4.0}{4.0}\times 100
15% $$
A positive result indicates net water gain; a negative result indicates net water loss; a result near $0%$ suggests little net water movement over the measurement period. The solution producing approximately no weight change estimates an isotonic condition for that tissue.
Retrieval check: A cell’s radius increases by a factor of $2$. By what factors do its surface area and volume increase, and why does this make diffusion more challenging? What would a negative percent change in tissue weight reveal about the direction of net water movement?
2.3 Plasma Membrane
Key concepts: Plasma membrane · Selective permeability · Phospholipid bilayer · Membrane proteins · Diffusion and osmosis · Transport across membranes · Active transport against a concentration gradient · Endocytosis · Homeostasis · Movement of water in nonwalled animal cells
A cell survives by controlling what crosses its boundary. The plasma membrane is the selectively permeable barrier that separates a cell’s internal environment from its surroundings, allowing some substances to enter or leave while restricting others.
2.3 Plasma Membrane
A cell survives by controlling what crosses its boundary. The plasma membrane is the selectively permeable barrier that separates a cell’s internal environment from its surroundings, allowing some substances to enter or leave while restricting others.
Learning Objective 2.3.A: Describe the role of the plasma membrane in maintaining homeostasis.
Essential Knowledge 2.3.A.1: Cellular membranes regulate movement of materials to help maintain homeostasis. The membrane must admit useful materials, remove wastes, preserve concentration gradients, and prevent uncontrolled water movement.
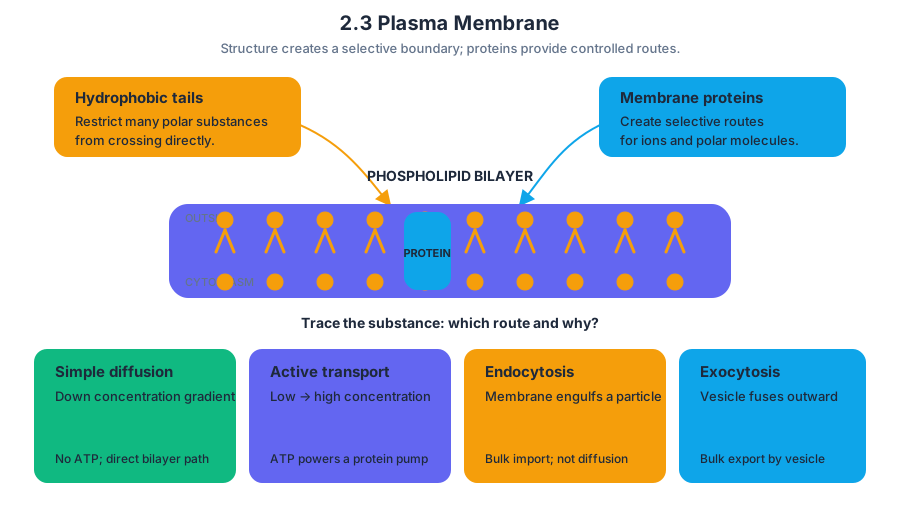
A phospholipid bilayer: a boundary with a built-in filter
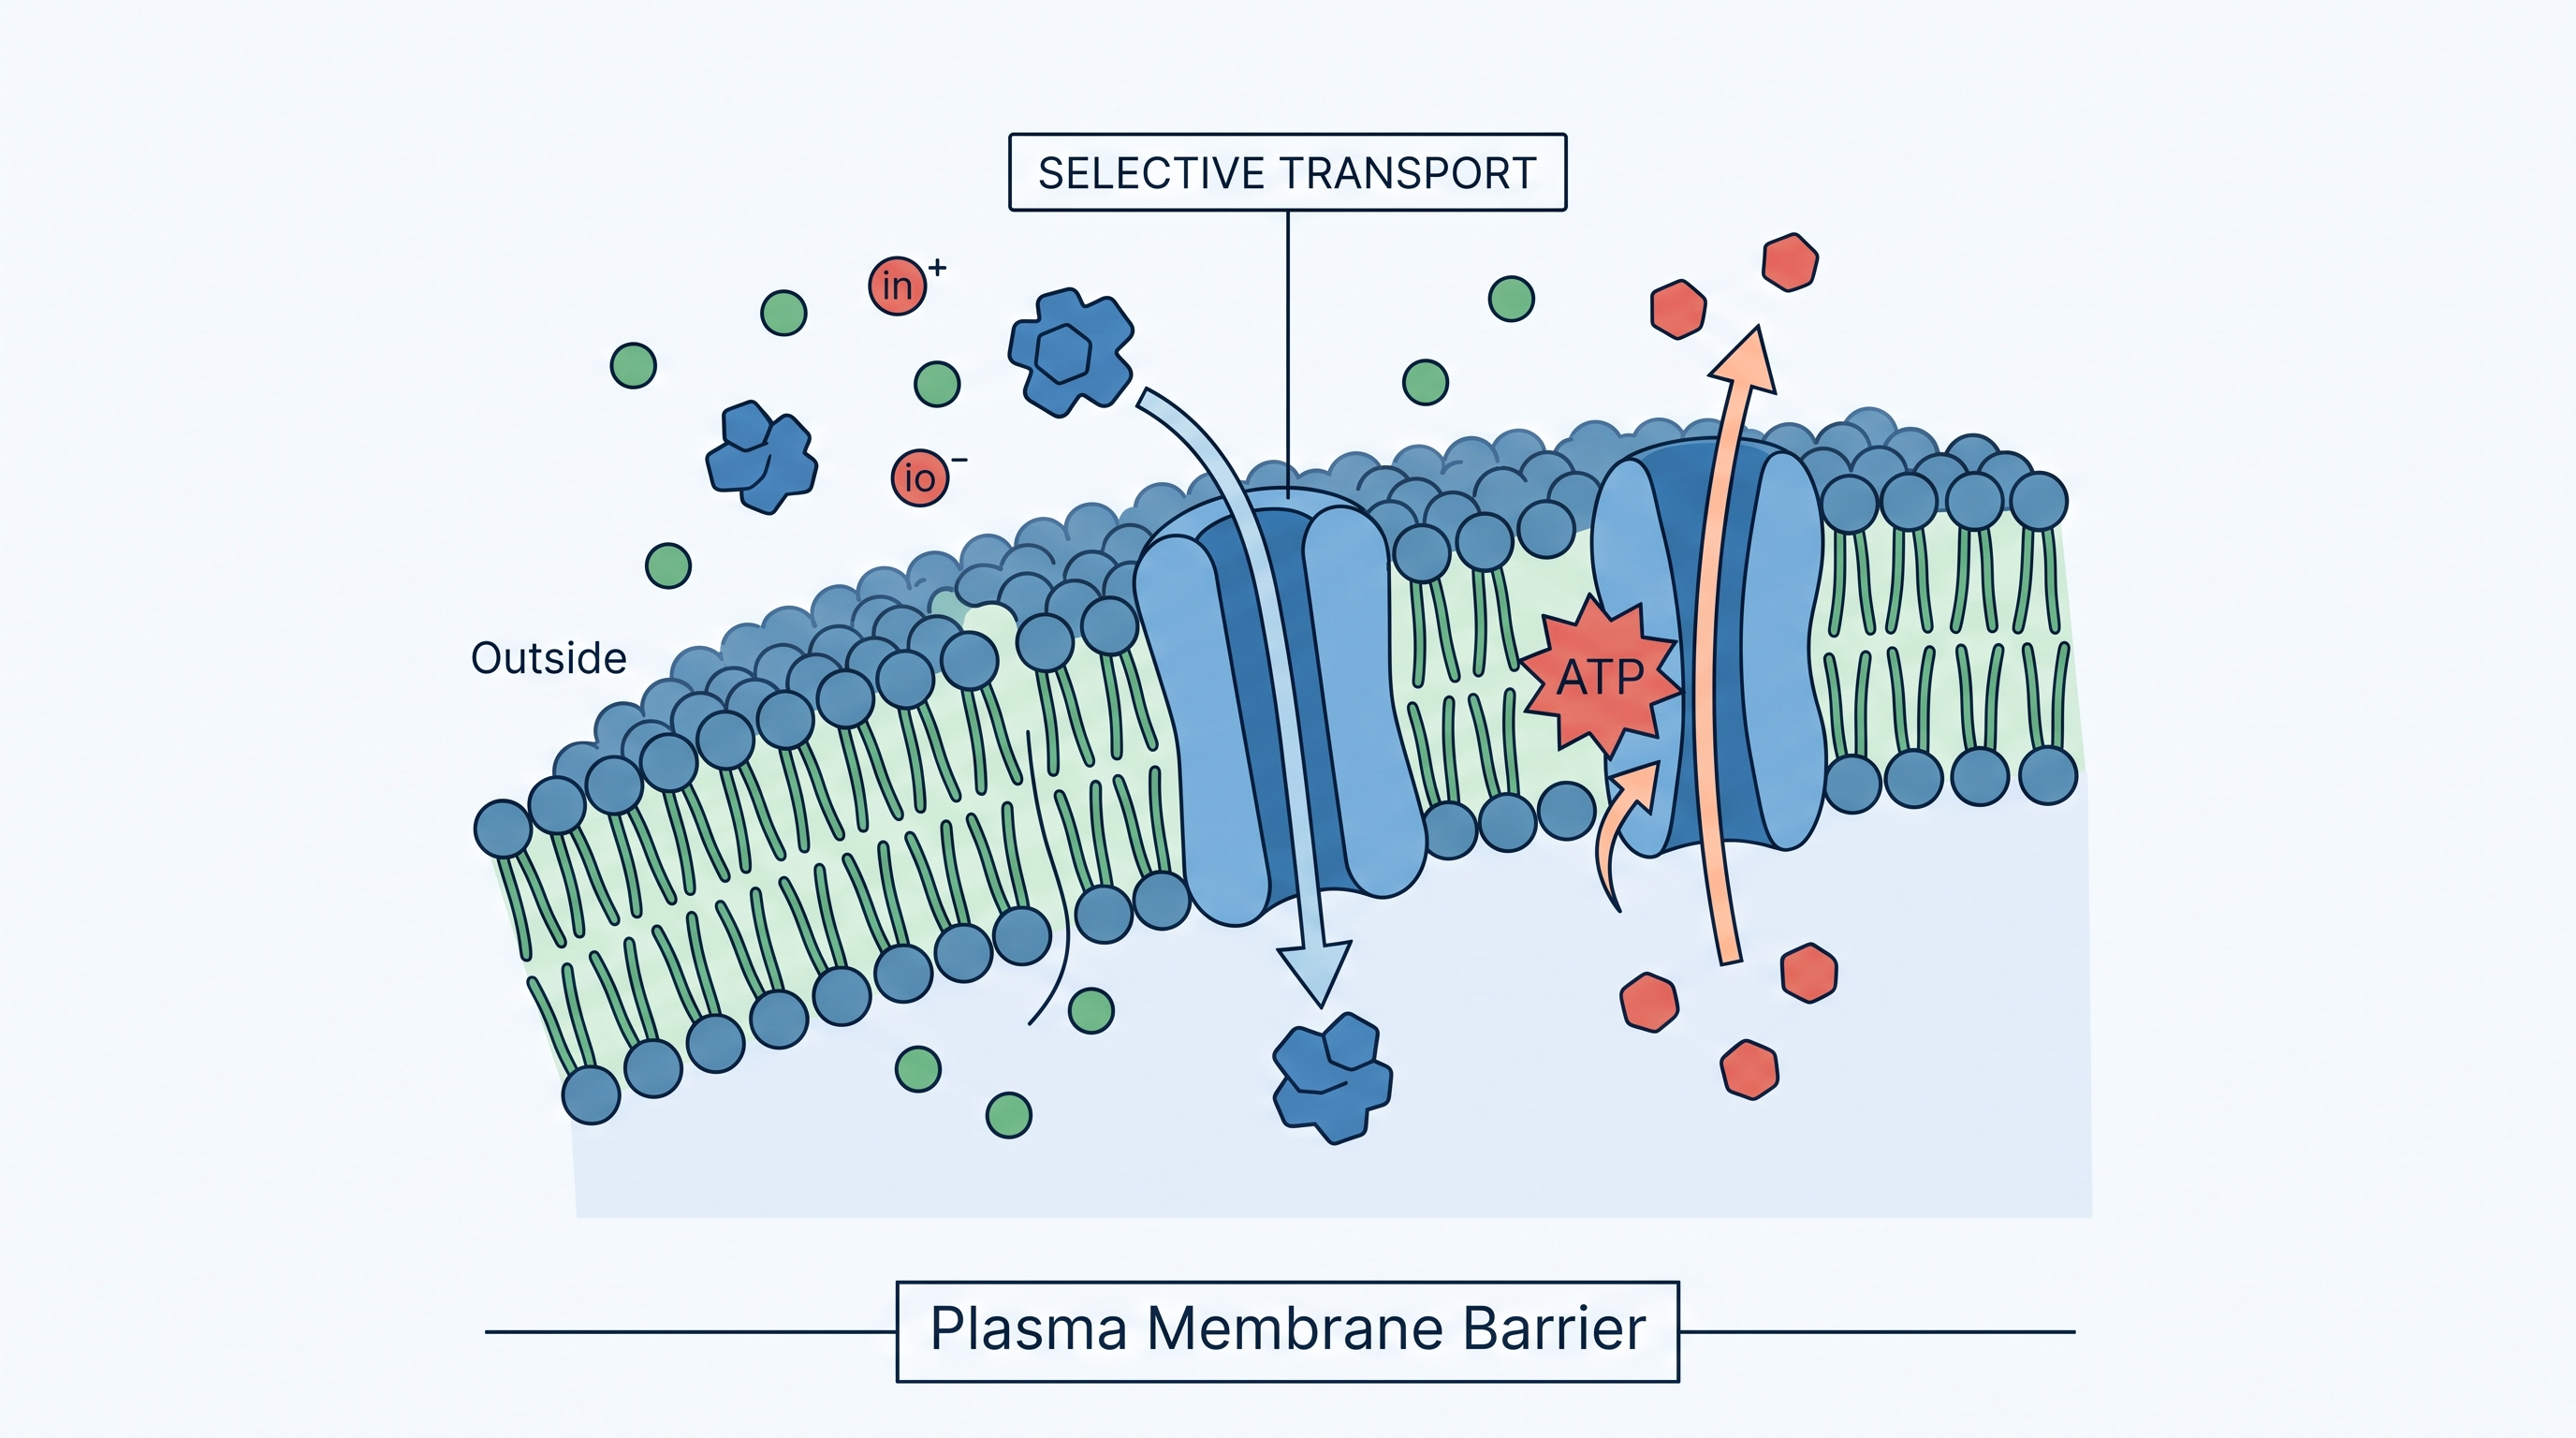
The plasma membrane consists primarily of a phospholipid bilayer—two layers of phospholipid molecules. Each phospholipid has a hydrophilic, or water-attracting, phosphate head and hydrophobic, or water-repelling, fatty-acid tails.
In an aqueous environment, the heads face the cytoplasm and extracellular fluid, while the tails point inward toward one another. This creates a water-compatible surface on both sides and a nonpolar interior that restricts many charged or polar substances.
| Membrane feature | Structural property | Transport consequence |
|---|---|---|
| Phosphate heads | Hydrophilic | Face water on both sides |
| Fatty-acid tails | Hydrophobic | Form a selective internal barrier |
| Embedded proteins | Specific shapes and chemical regions | Provide channels, carriers, receptors, or pumps |
| Vesicles | Membrane-bound compartments | Move very large materials |
The membrane is not a rigid wall. Its phospholipids and many proteins can move laterally, giving the membrane a flexible, dynamic structure. Membrane proteins extend partly or completely through the bilayer, and their amino-acid regions interact differently with the hydrophobic interior and watery environments.
Membrane proteins and transport routes
Membrane proteins make specific forms of transport possible. Protein channels provide hydrophilic passageways for selected ions or molecules. Transport proteins can bind substances and change shape, carrying them across the bilayer. Other proteins act as receptors or pumps, linking membrane transport to cell signaling and energy use.
The plasma membrane is distinct from the membranes surrounding organelles, although both are selectively permeable. Together, these membranes create cellular compartmentalization: different regions of a eukaryotic cell can maintain different chemical conditions and perform specialized functions.
Passive transport, active transport, and vesicles
Diffusion is the net movement of particles from a region of higher concentration to a region of lower concentration, driven by random molecular motion. It does not require cellular energy. Osmosis is the diffusion of water across a selectively permeable membrane.
Active transport moves molecules from regions of low concentration to regions of high concentration. Because this movement is against the concentration gradient, it requires energy, commonly supplied by ATP or by an energy-releasing ion gradient.
Very large molecules or substantial amounts of material cannot pass through an ordinary membrane protein. In endocytosis, the plasma membrane folds inward and pinches off to form a vesicle containing external material. In exocytosis, an internal transport vesicle fuses with the plasma membrane and releases its contents outside the cell.
Worked example: why an animal cell can burst
Place an animal cell in a solution whose solute concentration is lower than the cell’s internal solute concentration. Water moves into the cell by osmosis because the membrane permits water movement, while many solutes cannot cross freely.
The cell swells because it has no cell wall to resist expansion. Continued water entry can cause lysis, or bursting. In contrast, water leaving an animal cell causes it to shrink, a process called crenation. The membrane’s selective permeability therefore directly affects cell survival.
Misconception check
Misconception: “All movement across a membrane is diffusion.” Diffusion is passive movement down a concentration gradient, but active transport moves substances against a gradient and requires energy. Endocytosis and exocytosis move bulk material using vesicles rather than allowing individual molecules to diffuse through the bilayer.
AP skill connection and retrieval check
For Science Practice 1: Concept Explanation, connect structure to function: hydrophobic tails restrict many polar substances, while membrane proteins create selective routes. For Science Practice 2: Visual Representations, trace a substance through a bilayer diagram and identify whether its path represents diffusion, active transport, endocytosis, or exocytosis.
Retrieval check: A cell uses ATP to move an ion from low concentration to high concentration, then engulfs a large particle. Name the two transport mechanisms and explain why neither process is simple diffusion.
2.4 Membrane Permeability
Key concepts: Membrane permeability · Dialysis tubing as a selectively permeable membrane · Size-dependent passage of solutes · Ovalbumin permeability · Dissociation of ionic compounds · Non-dissociation of covalent compounds · Osmolarity · Water potential
A membrane can separate two solutions while still allowing some molecules to cross; this property is called selective permeability. In a classic dialysis-tubing experiment, the central question is: Which solutes can pass through the membrane, and how does each solute change water movement?
2.4 Membrane Permeability
A membrane can separate two solutions while still allowing some molecules to cross; this property is called selective permeability. In a classic dialysis-tubing experiment, the central question is: Which solutes can pass through the membrane, and how does each solute change water movement?
Learning Objective 2.4.A: Describe the mechanisms that allow cells to maintain homeostasis.
Essential Knowledge 2.4.A.1: Cell membranes are selectively permeable because of their structure and the properties of the substances crossing them.
A molecular “sieve,” not an open doorway
Dialysis tubing acts as a model selectively permeable membrane. Its microscopic pores permit relatively small particles to move through, while larger molecules are retained. Passage therefore depends on a solute’s size and chemical properties—not simply on whether the solute is dissolved.
Imagine filling dialysis tubing with a mixture of starch and glucose, then placing it in water. Glucose molecules are small enough to pass through the tubing; starch molecules are much larger and remain inside. If the outside solution contains iodine that reacts with starch, the color change can reveal whether the larger polymer crossed the membrane.
The same logic applies to ovalbumin, a large protein found in egg white. An experiment using ovalbumin asks whether this protein can pass through dialysis tubing. Because ovalbumin is much larger than small ions or simple sugars, the prediction is that it will remain inside the tubing, although the result must be tested rather than assumed.
Dissociation changes the number of particles
A solute’s effect on a solution depends partly on how many dissolved particles it produces. Dissociation is the separation of an ionic compound into its component ions when it dissolves. Sodium chloride, $NaCl$, is ionic:
$$ NaCl_{(s)} \rightarrow Na^+{(aq)} + Cl^-{(aq)} $$
One formula unit of $NaCl$ therefore produces approximately two dissolved particles. By contrast, sucrose, $C_{12}H_{22}O_{11}$, is a covalent compound. It dissolves as intact molecules:
$$ C_{12}H_{22}O_{11(s)} \rightarrow C_{12}H_{22}O_{11(aq)} $$
Sucrose does not dissociate into ions, so one sucrose molecule remains one dissolved particle. The distinction matters because osmolarity is the total concentration of dissolved particles, measured in osmoles per liter. Equal molar concentrations of $NaCl$ and sucrose do not have equal osmolarities: ideally, $1\ \mathrm{mol,L^{-1}}$ of $NaCl$ contributes about $2\ \mathrm{osmol,L^{-1}}$, whereas $1\ \mathrm{mol,L^{-1}}$ of sucrose contributes about $1\ \mathrm{osmol,L^{-1}}$.
From particle number to water potential
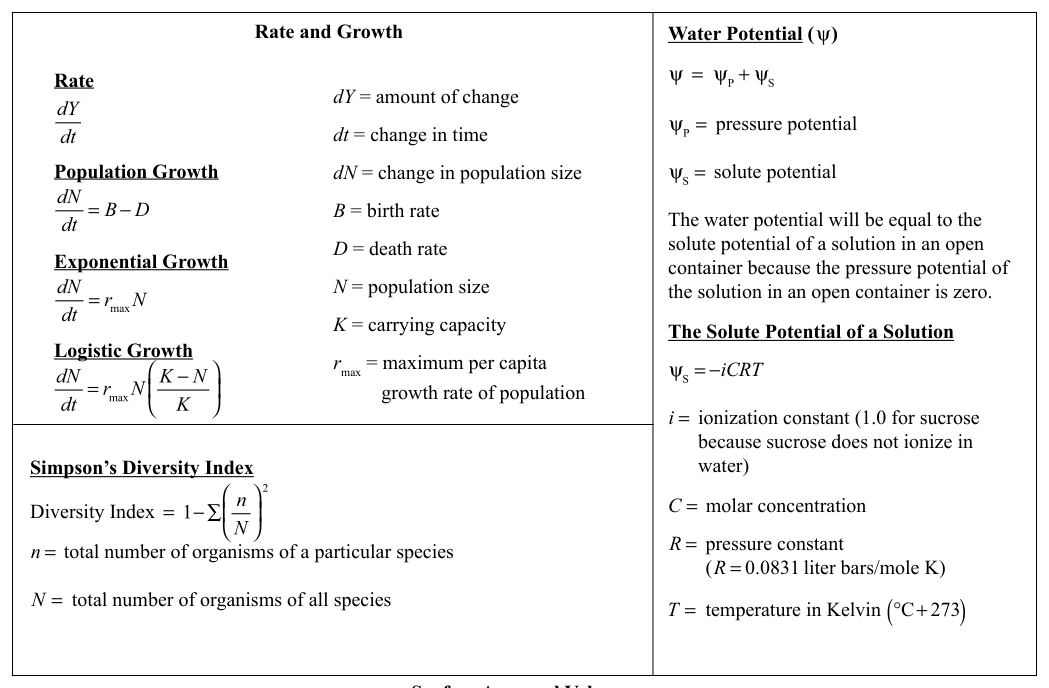
More dissolved particles generally make solute potential, $\Psi_s$, more negative. Water potential is described by:
$$\Psi=\Psi_s+\Psi_p$$
where $\Psi$ is total water potential, $\Psi_s$ is solute potential, and $\Psi_p$ is pressure potential. In an open dialysis-tubing setup, pressure potential is often treated as negligible, so differences in solute concentration strongly influence the direction of water movement.
For an ideal dilute solution, solute potential can be estimated with:
$$\Psi_s=-iCRT$$
Here, $i$ is the van’t Hoff factor—the approximate number of particles produced per dissolved formula unit—$C$ is molar concentration, $R$ is the gas constant, and $T$ is absolute temperature in kelvins. Because $NaCl$ has a larger $i$ than sucrose, the same molar concentration of $NaCl$ produces a more negative $\Psi_s$ and a stronger tendency to draw water across a membrane that retains the solute.
Worked example: interpreting a dialysis experiment
Suppose a dialysis bag containing ovalbumin and dissolved $NaCl$ gains mass after being placed in distilled water. The reasoning chain is:
- The bag contains more dissolved particles than the surrounding water.
- The membrane allows water to cross.
- Ovalbumin is probably too large to leave, while small ions may be able to pass depending on the tubing’s pore size.
- The bag’s lower water potential causes net water entry.
- If the bag’s mass changes from $20.0\ \mathrm{g}$ to $23.0\ \mathrm{g}$, then:
$$%\ \mathrm{change\ in\ mass}=\frac{23.0-20.0}{20.0}\times100=15%$$
The percentage change is more useful than the raw change alone when different bags begin with different masses. A living cell can be analyzed by the same principle: the external solution at which there is no net mass change is approximately isotonic to the cell, allowing an estimate of the cell’s internal solute concentration.
Misconception check
Misconception: “A covalent solute produces no particles in water.” Sucrose does produce dissolved particles—it simply does not split into ions. The correct comparison is one intact sucrose molecule versus multiple ions produced by an ionic compound such as $NaCl$.
Misconception: “If a molecule dissolves, it must cross the membrane.” Dissolving and crossing are different events. Ovalbumin can be suspended or dissolved inside the bag while remaining unable to pass through its pores.
AP Science Practices in action
This investigation develops Science Practice 1: Concept Explanation, especially explaining how dissociation changes osmolarity and water potential; Science Practice 2: Visual Representations, by diagramming solute movement and water movement; Science Practice 3: Questions and Methods, by predicting whether ovalbumin crosses dialysis tubing; Science Practice 4: Representing and Describing Data, by graphing mass or percent change; Science Practice 5: Statistical Tests and Data Analysis, by comparing replicated treatments; and Science Practice 6: Argumentation, by using mass-change evidence to support or reject a permeability claim.
Retrieval check: A dialysis bag contains $0.10\ \mathrm{M}$ sucrose, and another contains $0.10\ \mathrm{M}$ $NaCl$. Assuming ideal behavior and equal pressure, which bag has the more negative solute potential, and why? Explain your answer using dissociation, not merely molar concentration.
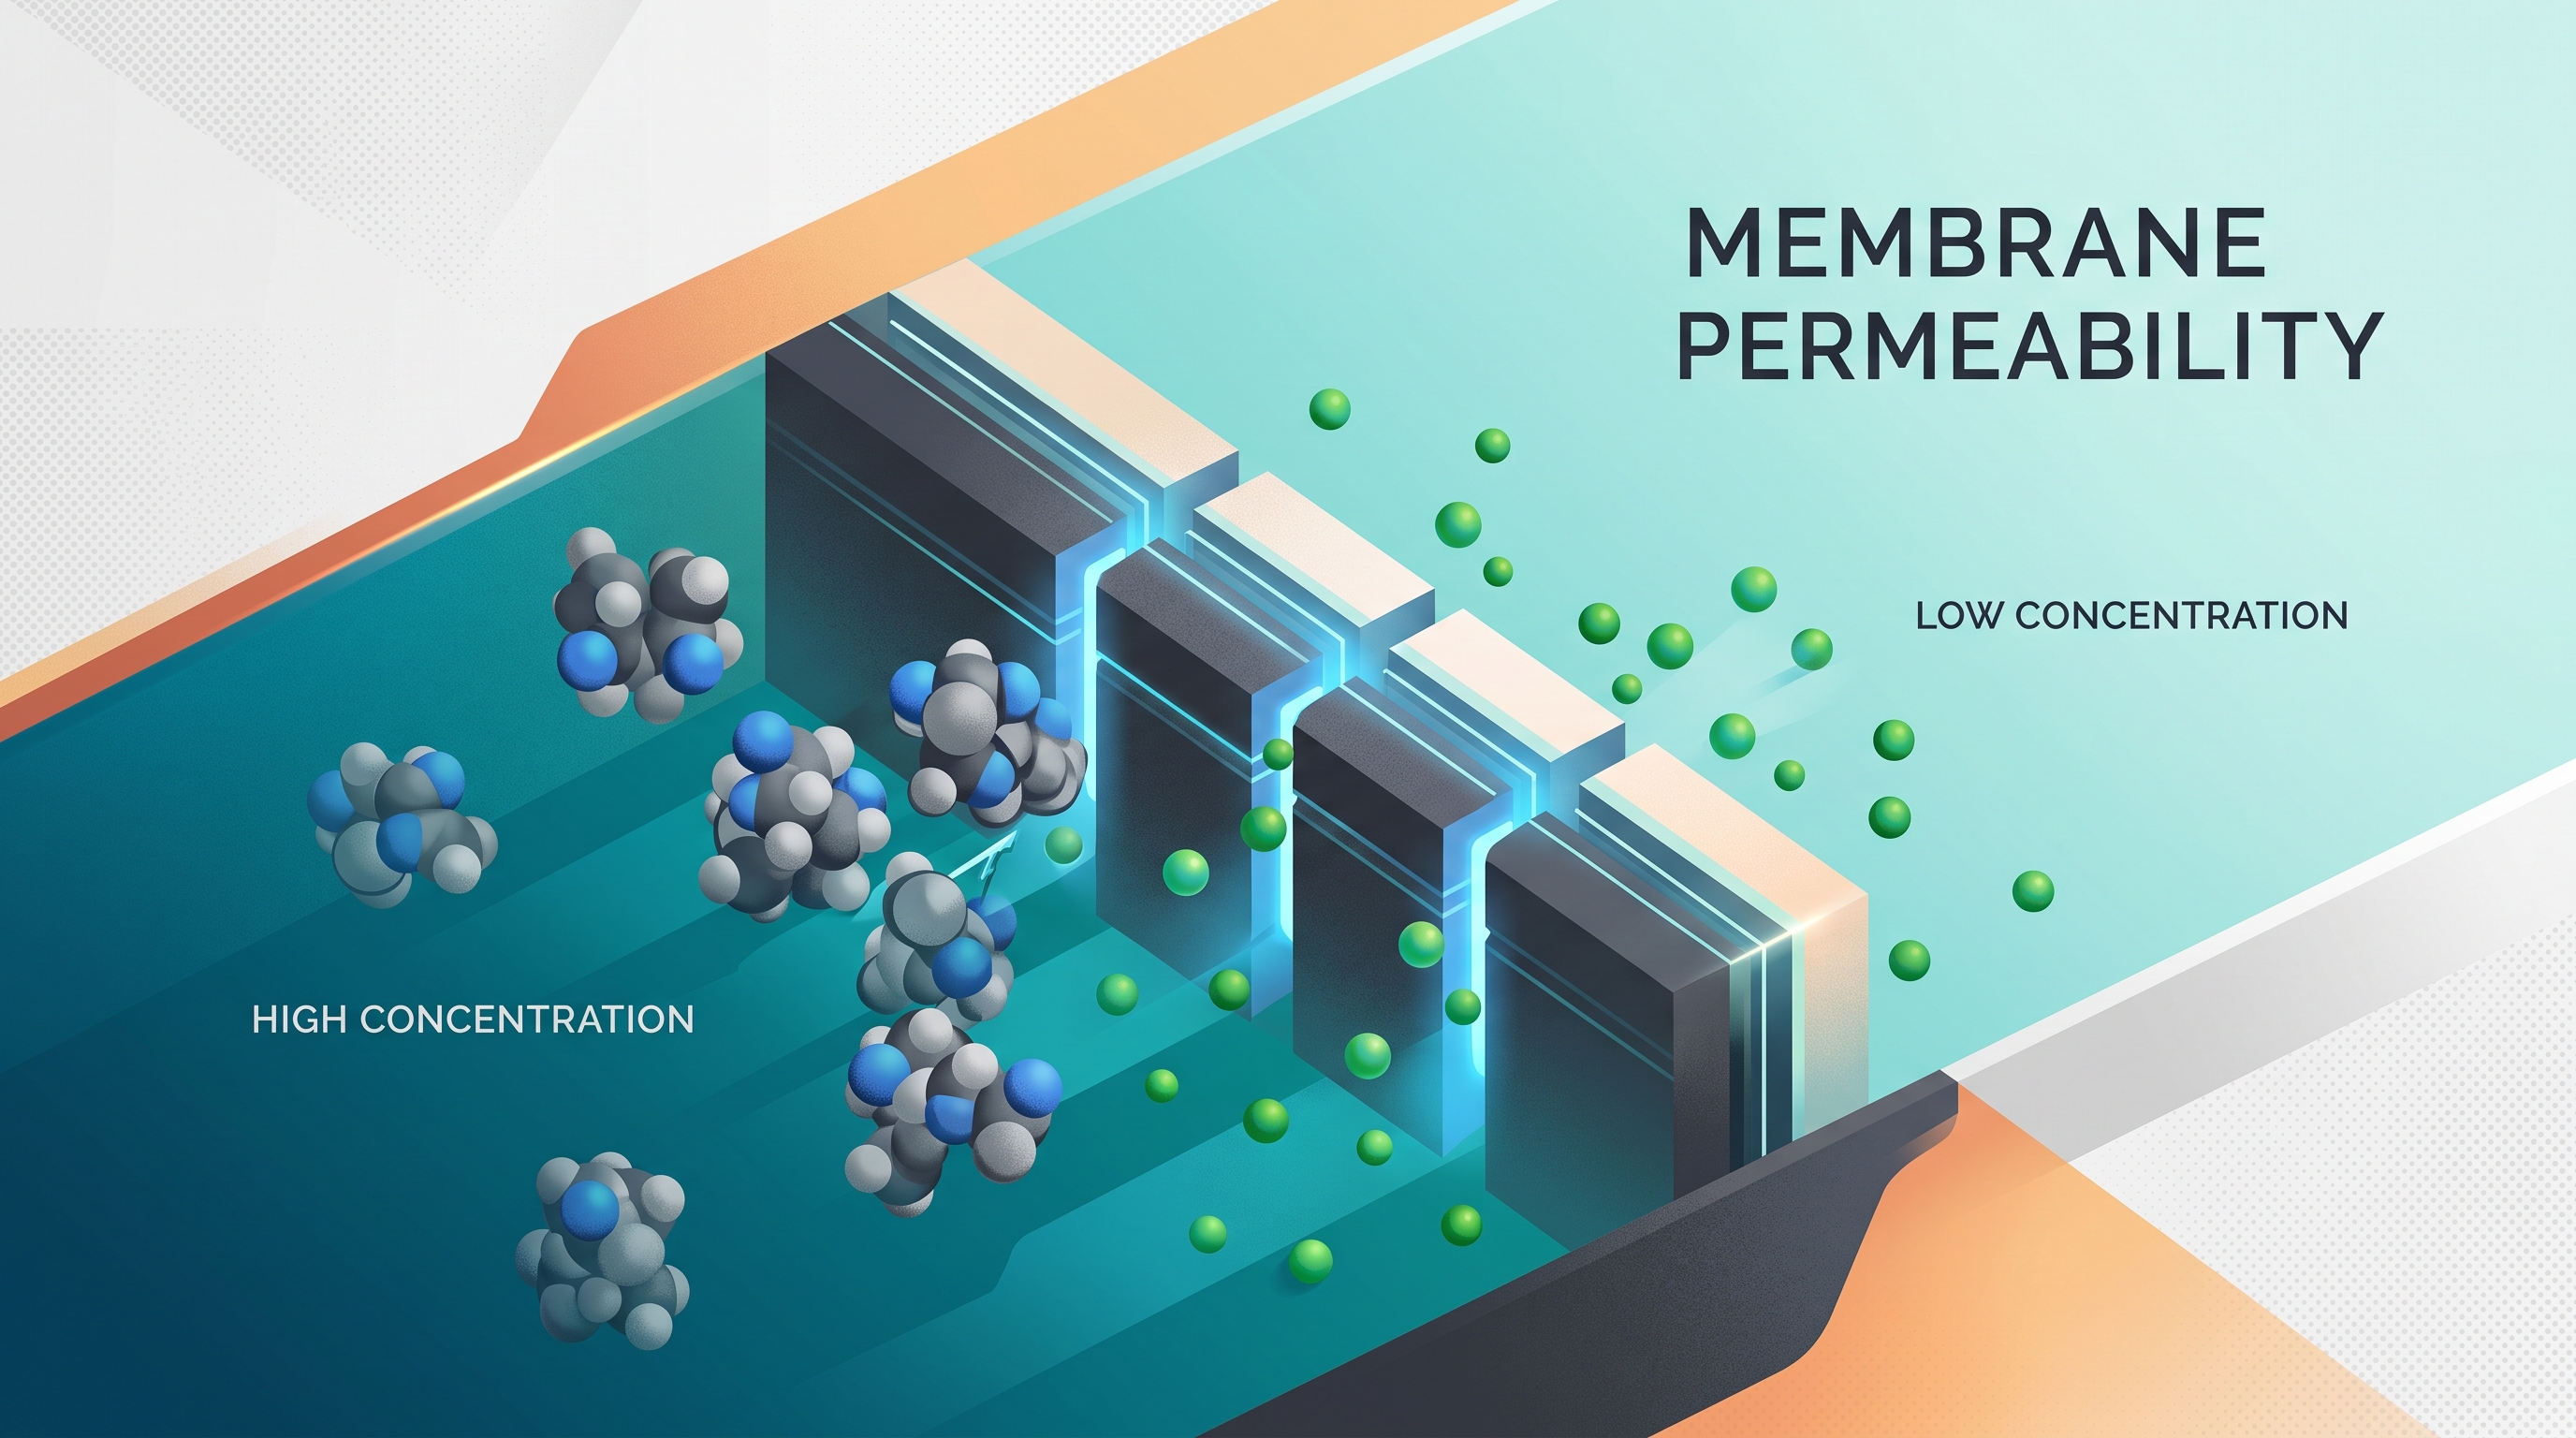
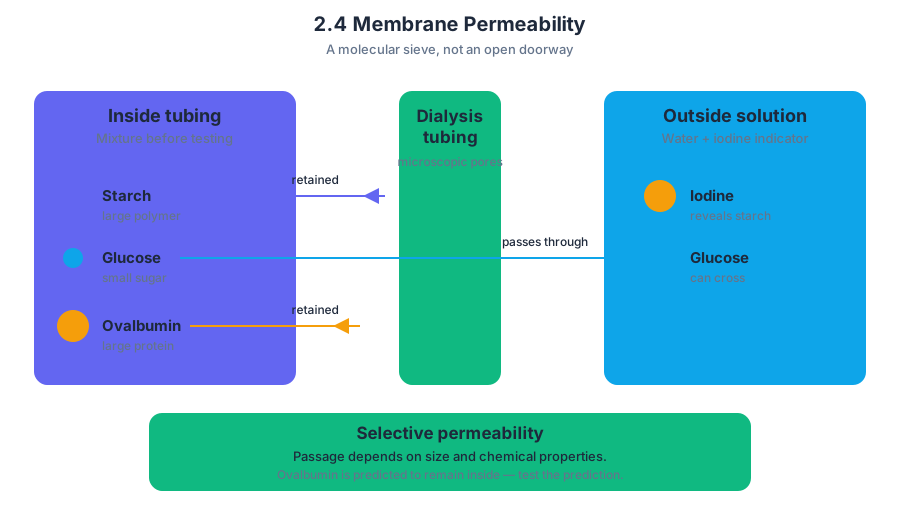
2.5 Membrane Transport
Key concepts: Membrane transport · Water potential · Water movement across a cell membrane · Plant cells · Surrounding environment · Transpiration · Lipids · Facilitated diffusion · Experimental investigations
Water moves across a plant cell membrane from higher water potential to lower water potential. If a plant cell has a lower water potential than the surrounding environment, the cell will gain water because water moves down the water-potential gradient—from the surroundings into the cell.
2.5 Membrane Transport
Water moves across a plant cell membrane from higher water potential to lower water potential. If a plant cell has a lower water potential than the surrounding environment, the cell will gain water because water moves down the water-potential gradient—from the surroundings into the cell.
Water potential, $\Psi$, is the tendency of water to move. Water moves spontaneously from higher $\Psi$ to lower $\Psi$.
A useful model is:
$$ \Psi = \Psi_s + \Psi_p $$
where $\Psi_s$ is solute potential, the effect of dissolved substances, and $\Psi_p$ is pressure potential, the effect of physical pressure on water. Dissolved solutes make $\Psi_s$ more negative. Therefore, a cell containing more solute may have a lower total water potential than its environment, even if the cell is under similar pressure.
Water movement across a plant cell membrane
Imagine a plant cell surrounded by a solution with $\Psi = -0.2$ MPa. The cell has $\Psi = -0.6$ MPa because its interior contains a greater concentration of dissolved solutes. Water moves into the cell:
$$ -0.2\ \text{MPa} \longrightarrow -0.6\ \text{MPa} $$
The direction may seem counterintuitive because $-0.6$ is numerically smaller, but it represents lower water potential. As water enters, pressure against the cell wall increases. This pressure potential can raise the cell’s total $\Psi$ until the movement of water slows or reaches equilibrium.
The cell membrane does not act like an open doorway. Its lipid bilayer provides a hydrophobic interior that restricts many charged or polar substances, while particular molecules can cross through membrane proteins. Water may cross the bilayer slowly, but plant cells also rely heavily on aquaporins—membrane proteins that provide channels for rapid water movement. The transport mechanism must therefore be explained together with the membrane’s lipid structure and selective proteins.
Why transpiration changes the system
Transpiration is the loss of water vapor from plant surfaces, especially through leaves. When water evaporates from moist leaf surfaces, the water remaining in the leaf becomes more concentrated, lowering the leaf’s water potential. This creates a gradient that helps draw water upward through the plant, from the roots toward the leaves.
The chain of events is:
- Water evaporates from leaf surfaces.
- Evaporation lowers leaf water potential.
- Water moves into leaf cells and through their tissues.
- Cohesion between water molecules helps maintain a continuous water column in the xylem.
- Water is pulled upward from the roots, where water entered because of water-potential differences.
This is why a plant’s water movement cannot be understood by examining only one cell. A cell membrane regulates local transport, while evaporation at the leaf creates a larger-scale gradient. Open stomata generally increase gas exchange and transpiration; closed stomata reduce water loss but also limit carbon dioxide entry for photosynthesis.
Passive transport and membrane proteins
Passive transport moves substances down their concentration or electrochemical gradients without direct cellular energy input. Small nonpolar molecules, such as oxygen, can diffuse through the lipid bilayer. Other substances require proteins: a channel provides a passageway, while a carrier changes shape to move a substance across the membrane. This protein-assisted passive movement is called facilitated diffusion; its detailed mechanisms depend on the molecule and the protein involved.
A common mistake is to treat every movement through a protein as active transport. The decisive question is not whether a protein is involved, but whether the substance moves down its gradient or against it. Movement down a gradient is passive; movement against a gradient requires an energy source, usually ATP or an ion gradient.
Investigation entry point
Before conducting their own experiments, students encounter introductory questions that activate concepts such as osmosis, diffusion, active transport, photosynthesis, and transpiration. The prediction about a plant cell with lower water potential is not merely a vocabulary exercise: students must represent the direction of water movement in an annotated diagram and then use evidence from an investigation to evaluate that prediction.
For an experimental diagram, label the surrounding solution, the cell membrane, the cell interior, both water-potential values, and an arrow pointing from higher $\Psi$ to lower $\Psi$. A strong annotation explains why the arrow points inward: the cell’s lower water potential creates the driving force for water entry.
AP skills and identifiers
This topic develops the official science practices 1. Explanation of Concepts, 2. Visual Representations, 3. Questions and Methods, 4. Representing and Describing Data, 5. Statistical Tests and Data Analysis, and 6. Argumentation. In particular, a student should be able to explain a water-potential gradient, draw the transport model, predict an experimental outcome, represent changes in cell mass or water content, analyze variation among trials, and use evidence to defend or revise the prediction.
The investigation is associated with the identifiers IST-5.A, ENE-3.D, and SYI-1.H. These identifiers connect membrane transport to information-based scientific reasoning, energy and matter movement, and systems-level interpretation.
Misconception check: A plant cell does not automatically lose water because it is placed in a solution containing solute. Determine the direction by comparing water potentials, not by counting solute particles in only one compartment.
Retrieval check: A plant cell has $\Psi = -0.4$ MPa and its surrounding solution has $\Psi = -0.7$ MPa. Which way will water initially move, and what change caused by transpiration could make water continue entering the leaf?
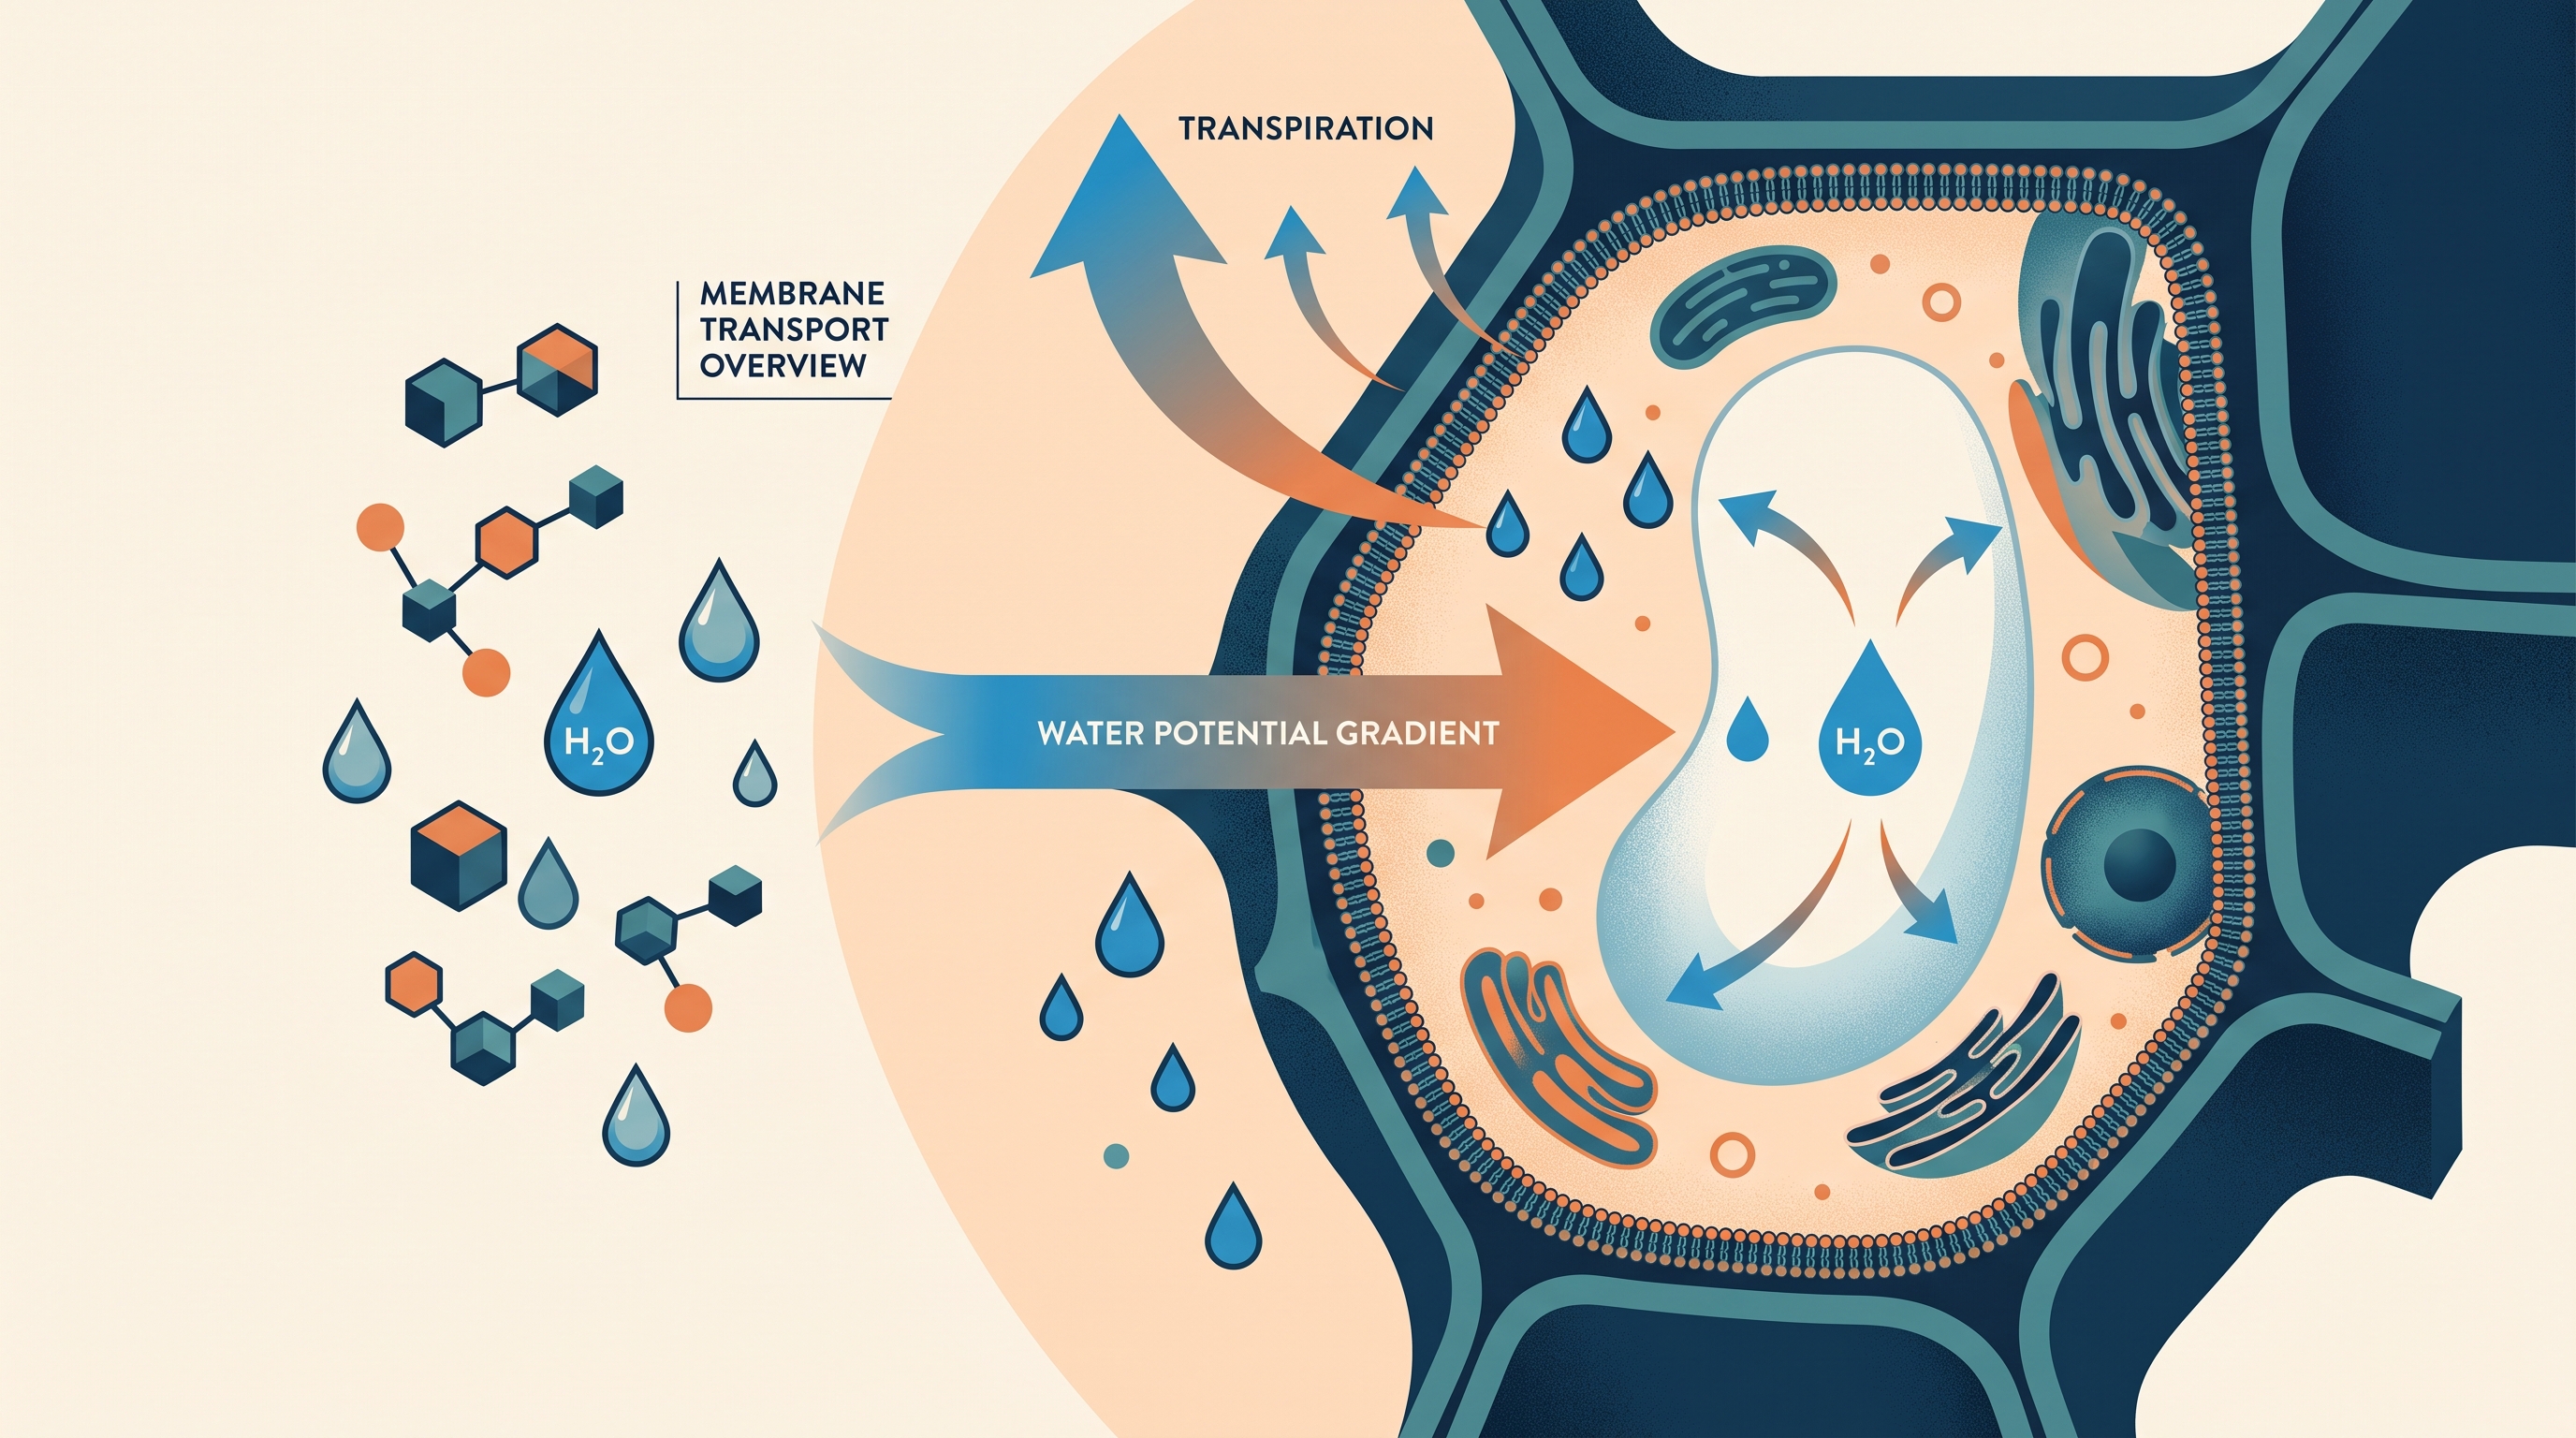
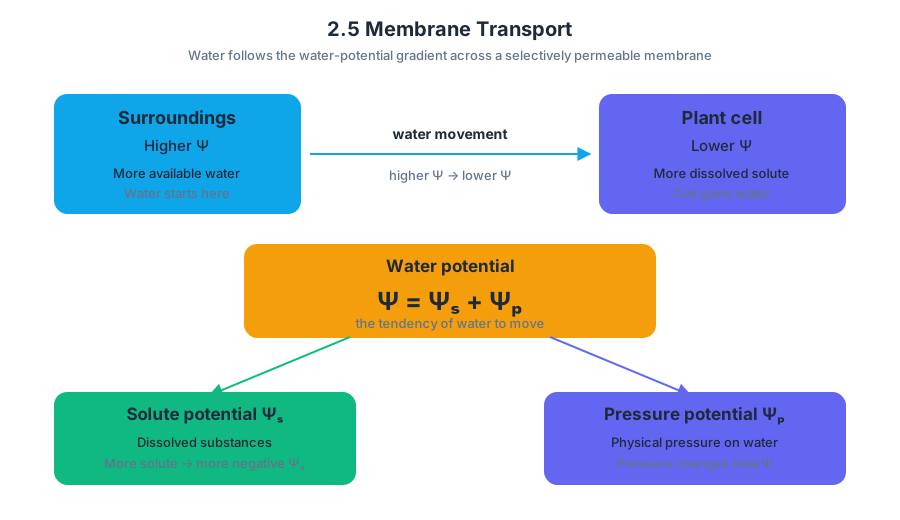
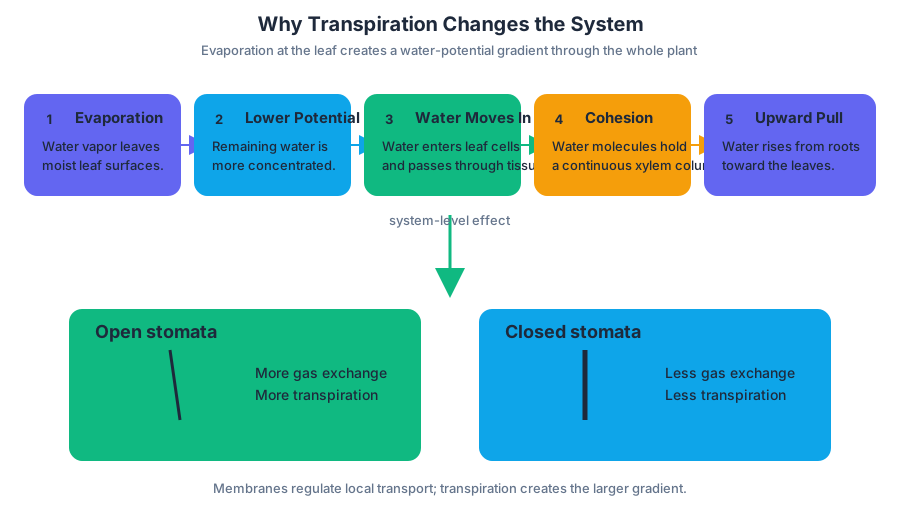
2.6 Facilitated Diffusion
Key concepts: Diffusion is a nondirectional process caused by random molecular motion · Kinetic energy affects the extent and rate of diffusion · Particles move from areas of high concentration to areas of low concentration · The diffusion rate depends on the concentration gradient · Surface area-to-volume ratio influences diffusion rate · Intestinal villi and root hair cells are adaptations that facilitate nutrient uptake · Diffusion can be investigated using dialysis tubing and solutions of differing concentrations · Students can design experiments to test factors affecting diffusion · Molarity is calculated from moles of solute per liter of solution · Indicator color changes and accessible household materials can demonstrate diffusion-related principles
A molecule can move across a membrane without cellular energy input, yet still require a protein doorway. Facilitated diffusion is the passive movement of a substance down its concentration gradient through a membrane protein.
2.6 Facilitated Diffusion
A molecule can move across a membrane without cellular energy input, yet still require a protein doorway. Facilitated diffusion is the passive movement of a substance down its concentration gradient through a membrane protein. The protein does not push the molecule uphill; it makes a membrane crossing possible for a substance that cannot easily pass through the hydrophobic interior of the phospholipid bilayer.
Learning Objective 2.6: Explain how facilitated diffusion moves specific substances across a membrane.
Essential Knowledge 2.6.A: Facilitated diffusion allows specific substances to cross selectively permeable membranes down their concentration gradients.
Random motion creates directional net movement
Individual particles move randomly and nondirectionally because of their kinetic energy—the energy associated with motion. If particles are more concentrated in one region, however, more particles leave that region than enter it during a given interval. The result is net movement from high concentration to low concentration, even though every individual particle continues moving randomly.
A coin-drop demonstration makes this distinction visible. Drop coins from a low height onto a table: they spread a short distance. Drop them from a greater height: the coins strike with more kinetic energy and spread farther in many directions. The spreading is not aimed outward by the coins; greater random motion produces a greater distribution.
Key distinction: Diffusion is nondirectional at the molecular level but produces directional net movement down a concentration gradient.
The concentration gradient—the difference in concentration between two regions—affects diffusion rate. A steep gradient produces faster net diffusion because the imbalance between the two sides is larger. As the concentrations become more similar, net diffusion slows. At dynamic equilibrium, molecules still move in both directions, but movement in one direction balances movement in the other.
Why facilitated diffusion needs proteins
Small nonpolar molecules can often cross the lipid bilayer directly, but ions and many polar molecules cannot cross its hydrophobic interior efficiently. Channel proteins provide hydrophilic passageways, whereas carrier proteins bind particular molecules and change shape to move them across. Both mechanisms preserve the essential features of facilitated diffusion: specificity, passive movement, and dependence on the concentration gradient.
For example, glucose is polar and relatively large. A glucose transporter can bind glucose on the side where glucose concentration is higher, change conformation, and release glucose on the lower-concentration side. If the gradient disappears, the transporter no longer produces net glucose movement in either direction; if the lower-concentration side becomes higher, net movement reverses.
Misconception check — “Facilitated” means active: It does not. Facilitated diffusion requires a membrane protein, but it does not require ATP. A protein doorway is not an energy pump.
Surface area, volume, and diffusion rate
Diffusion is faster when a structure has a large surface area-to-volume ratio, written as $\frac{SA}{V}$. Surface area provides space for exchange; volume represents the amount of material that must be supplied. As an object becomes larger without changing shape, its volume increases faster than its surface area, so diffusion becomes less effective.
For a cube with side length $s$:
$$SA = 6s^2$$
$$V = s^3$$
$$\frac{SA}{V} = \frac{6s^2}{s^3} = \frac{6}{s}$$
A cube with $s=1\ \text{cm}$ has $SA=6\ \text{cm}^2$, $V=1\ \text{cm}^3$, and $\frac{SA}{V}=6:1$. A cube with $s=2\ \text{cm}$ has $SA=24\ \text{cm}^2$, $V=8\ \text{cm}^3$, and $\frac{SA}{V}=3:1$. The larger cube has more total surface area but a lower ratio, so each unit of internal volume has less exchange surface available.
Biological exchange surfaces
Intestinal villi and root hair cells are adaptations that increase surface area for nutrient uptake. Villi project into the intestine, while root hairs extend into soil; both create extensive exchange surfaces without requiring a proportionally large increase in volume. A larger surface area can increase the number of membrane proteins available for facilitated diffusion and shorten the distance substances must travel.
In an agar investigation, differently sized artificial cells can be placed in a solution that changes color as diffusion proceeds. Students can measure the depth of the color change, calculate each object’s $\frac{SA}{V}$, and compare diffusion rate. The independent variable might be object size, the dependent variable might be diffusion depth per unit time, and temperature, agar concentration, and solution concentration should be controlled.
Dialysis tubing as a membrane model
Dialysis tubing models selective movement across a membrane. Its pores allow small ions and molecules—including water and glucose—to pass, but restrict larger molecules such as starch and proteins. Placing different solutions inside and outside the tubing allows students to test which substances cross and whether movement follows the concentration gradient.
Molarity expresses concentration as moles per liter:
$$M=\frac{\text{moles of solute}}{\text{liters of solution}}$$
For $5%$ ovalbumin, use $50\ \text{g}$ per $1\ \text{L}$ and a molecular mass of $45{,}000\ \text{g mol}^{-1}$:
$$M=\frac{50\ \text{g}}{45{,}000\ \text{g mol}^{-1}}\div 1\ \text{L}\approx 0.0011\ \text{M}$$
This calculation matters because diffusion comparisons require concentrations to be described quantitatively, not merely as “more” or “less” concentrated.
AP Biology science practices in action
This topic most directly uses Science Practice 1: Concept Explanation—especially explaining why concentration gradients produce net movement; Science Practice 2: Visual Representations—interpreting membrane diagrams and surface-area models; Science Practice 3: Questions and Methods—designing a diffusion investigation; Science Practice 4: Representing and Describing Data—graphing diffusion rate against $\frac{SA}{V}$; Science Practice 5: Statistical Tests and Data Analysis—comparing replicated treatments and identifying variation; and Science Practice 6: Argumentation—using evidence to support a claim about which factor affects diffusion.
Retrieval check: Two cells have the same volume, but Cell A has twice the surface area of Cell B. Which cell should exchange materials faster, and why? A strong answer identifies Cell A’s larger $\frac{SA}{V}$ and connects that ratio to more exchange surface per unit volume—not simply to “more membrane.”
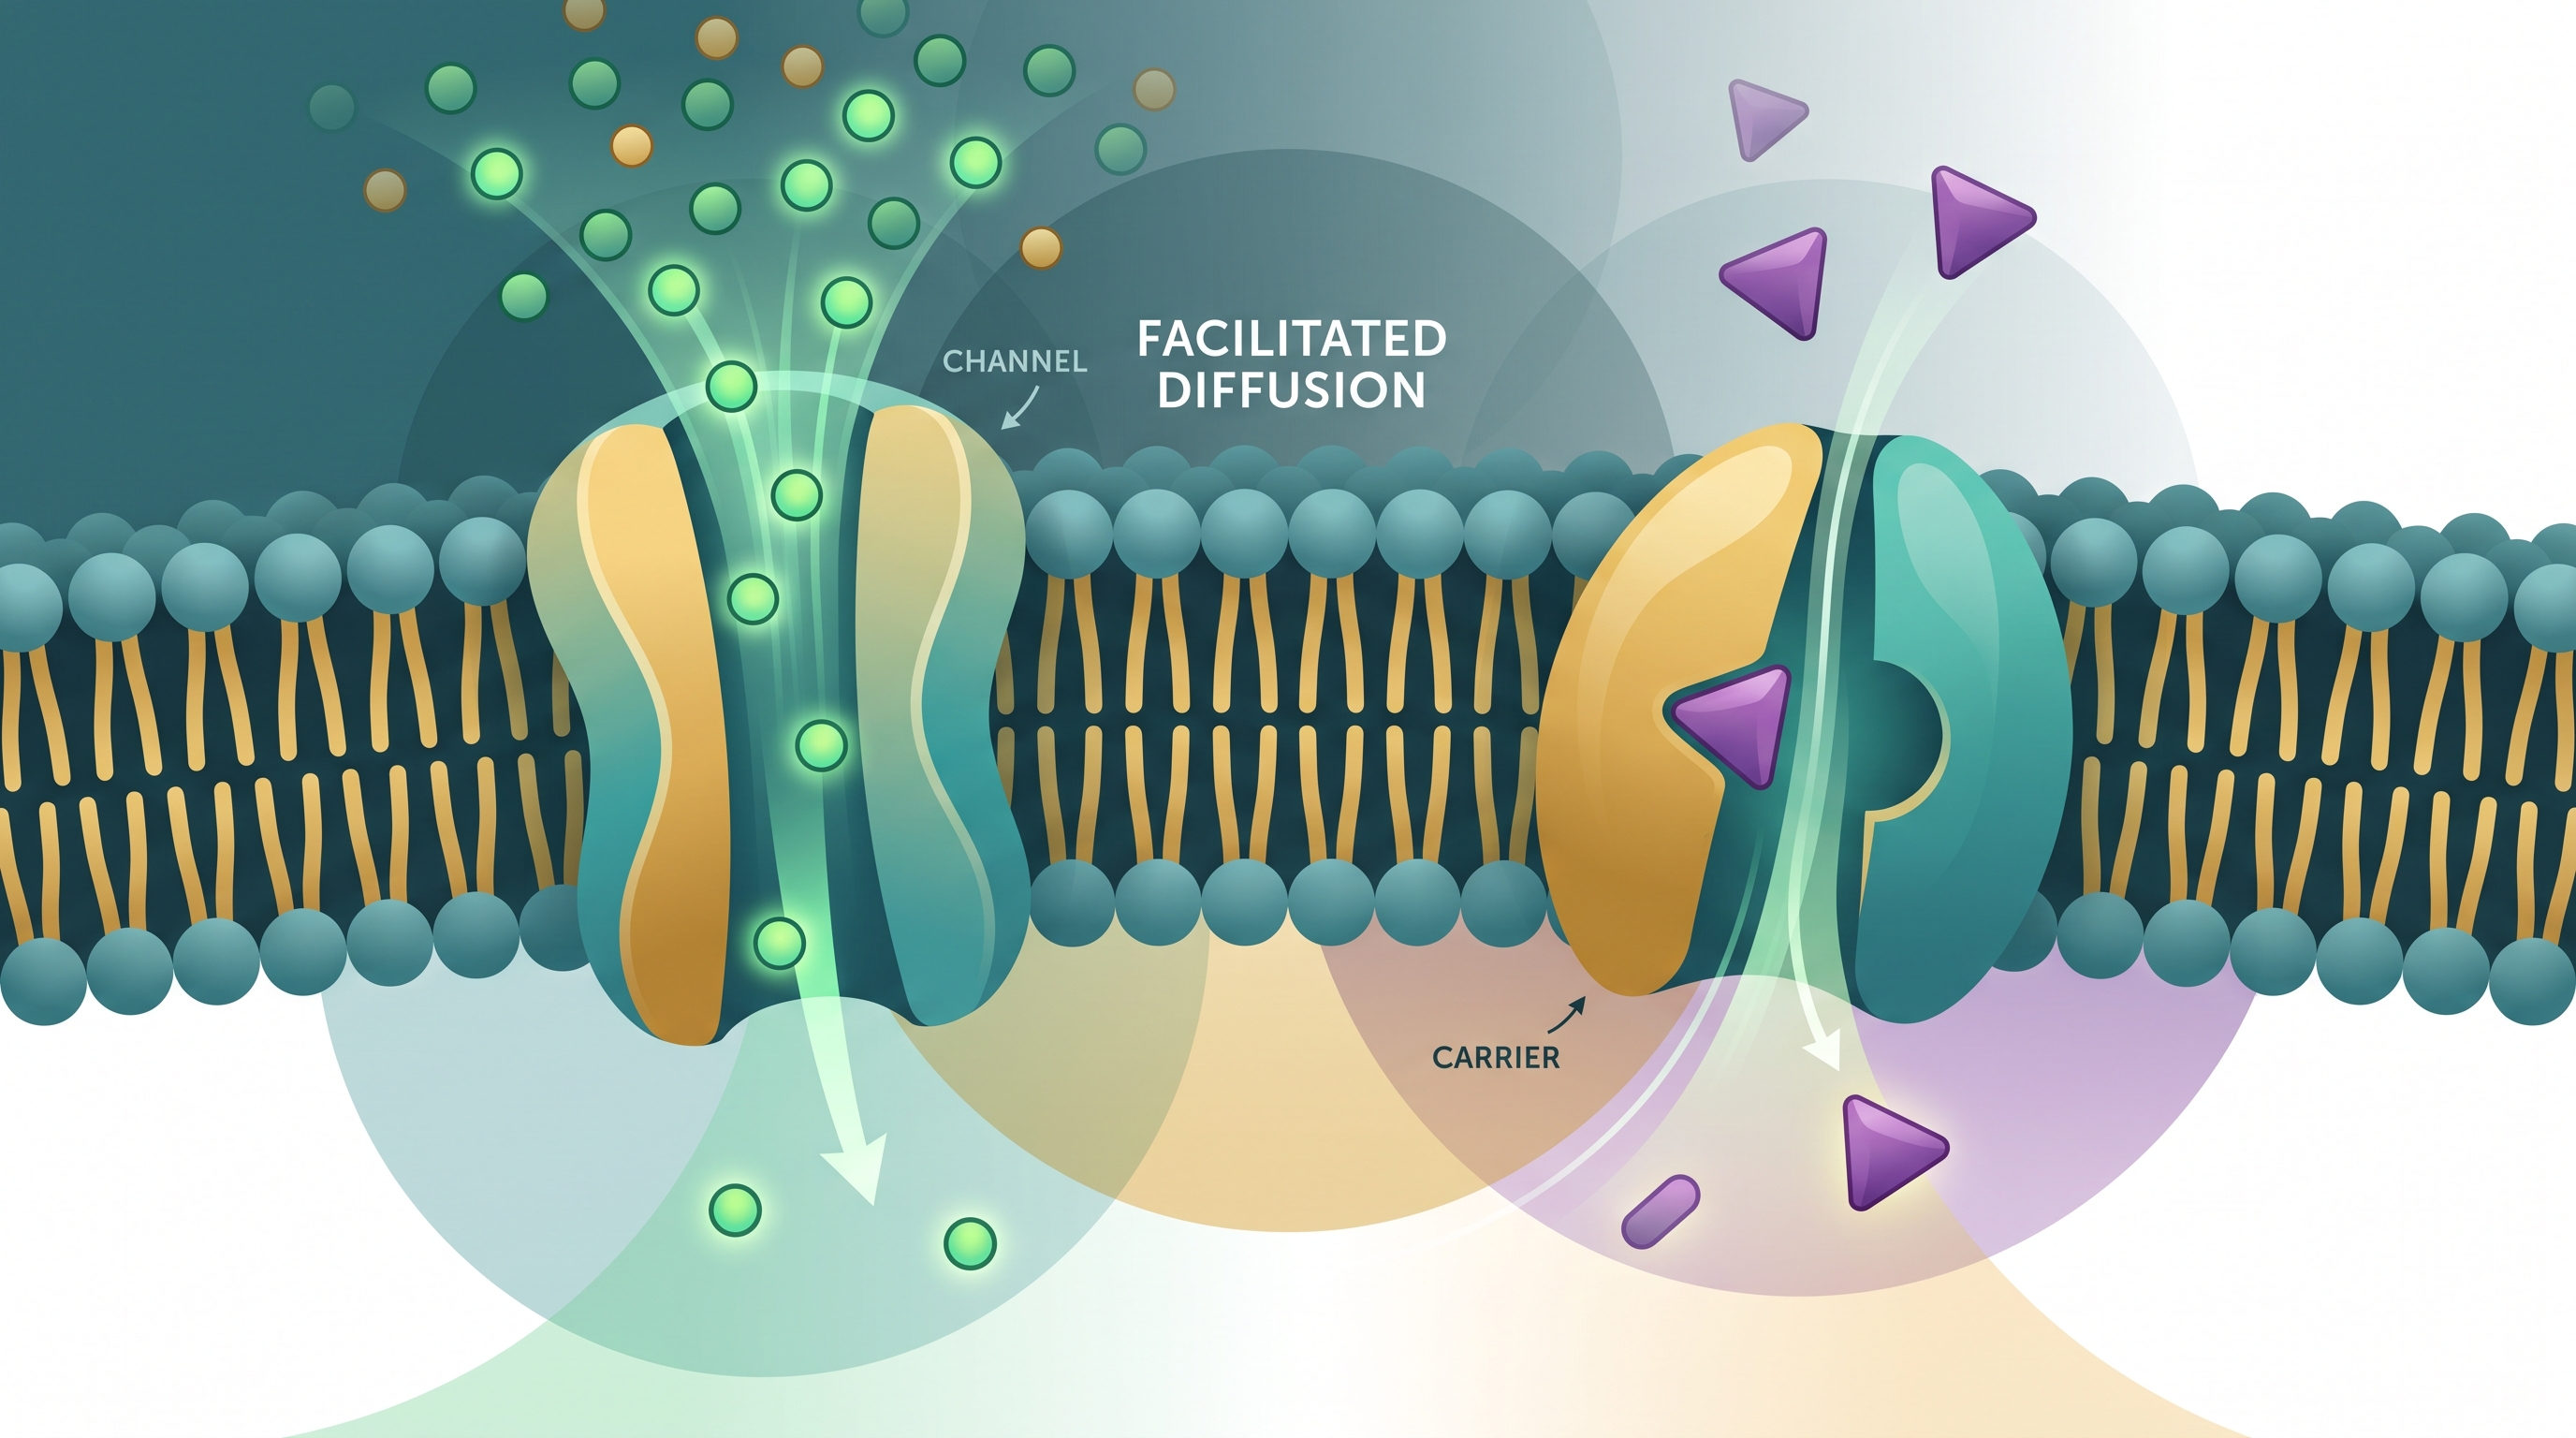
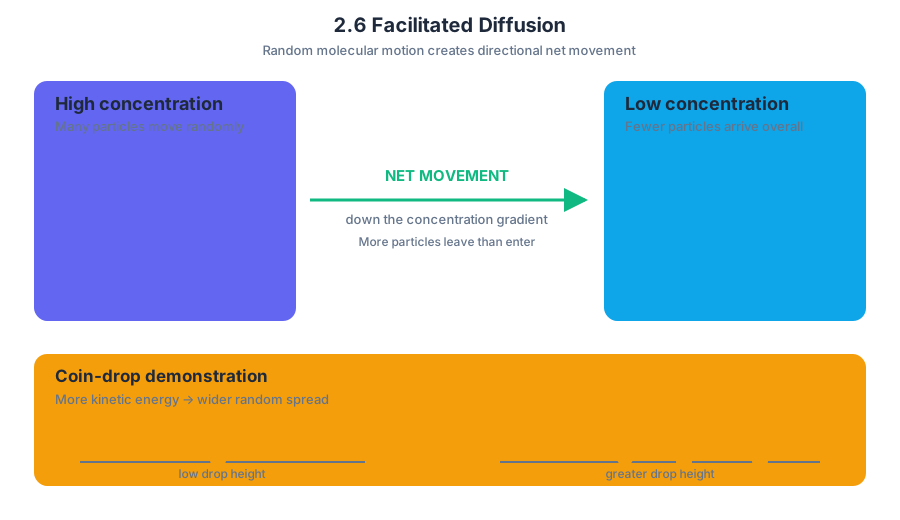
2.7 Tonicity and Osmoregulation
A cell placed in concentrated saltwater can lose so much water that its membrane pulls away from the cell wall. The salt does not need to enter the cell to cause this change: water moves across the selectively permeable membrane toward the side with lower water potential.
2.7 Tonicity and Osmoregulation
A cell placed in concentrated saltwater can lose so much water that its membrane pulls away from the cell wall. The salt does not need to enter the cell to cause this change: water moves across the selectively permeable membrane toward the side with lower water potential. Tonicity predicts how a solution changes cell volume, while osmoregulation is the active control of water balance and internal solute concentration.
Investigative question: Why does a plant cell become firm in fresh water but shrink in saltwater?
Water potential: the driving force for water movement
Water potential, written as $\Psi$, measures the tendency of water to move. Water moves spontaneously from higher water potential to lower water potential. Pure water under ordinary atmospheric pressure has $\Psi = 0$; adding dissolved solutes makes water potential more negative because solute particles reduce the freedom of water molecules to move.
For a solution, water potential is the sum of solute potential and pressure potential:
$$ \Psi = \Psi_s + \Psi_p $$
Solute potential is calculated as:
$$ \Psi_s = -iCRT $$
Here, $i$ is the ionization constant, $C$ is solute concentration in $\text{mol L}^{-1}$, $R$ is the pressure constant, and $T$ is absolute temperature in kelvins. The negative sign is essential: increasing solute concentration makes $\Psi_s$ more negative.
Pressure potential, $\Psi_p$, represents physical pressure pushing on water. In a plant cell, water entering the cell presses the plasma membrane against the cell wall, producing positive turgor pressure. This pressure can raise the cell’s total water potential and eventually oppose additional water entry.
Tonicity predicts cell-volume change
Tonicity compares the concentration of nonpenetrating solutes outside and inside a cell. A hypertonic solution has a higher effective solute concentration outside the cell, so water leaves and the cell shrinks. A hypotonic solution has a lower effective solute concentration outside, so water enters and the cell swells. An isotonic solution produces no net water movement and therefore no sustained change in cell volume.
The terms are always relative to the cell. A solution containing $0.3\ \text{mol L}^{-1}$ solute may be hypertonic to one cell and hypotonic to another, depending on the cell’s internal solute concentration and on whether the solute can cross the membrane.
| External solution | Net water movement | Animal cell | Plant cell |
|---|---|---|---|
| Hypotonic | Into the cell | Swells; may lyse | Becomes turgid |
| Isotonic | None overall | Maintains volume | Often flaccid |
| Hypertonic | Out of the cell | Shrivels | Plasmolyzes |
A crucial distinction is that water moves; tonicity does not. Tonicity describes the resulting effect of solute differences on water movement. Also, a freely penetrating solute may temporarily affect water movement but cannot maintain a lasting tonicity difference once it crosses the membrane.
Worked example: a plant cell in salt solution
Suppose a plant cell has a water potential of $-0.20\ \text{MPa}$, while the surrounding salt solution has a water potential of $-0.60\ \text{MPa}$. Water moves from the cell, where $\Psi=-0.20\ \text{MPa}$ is higher, into the solution, where $\Psi=-0.60\ \text{MPa}$ is lower.
As water leaves, the vacuole loses volume and the plasma membrane may pull away from the cell wall. This condition is plasmolysis. If the external solution is diluted, its water potential rises; the direction of movement can reverse, and water reenters until pressure potential and solute potential produce equilibrium.
Osmoregulation keeps internal conditions usable
Osmoregulation maintains water balance and allows organisms to control internal solute concentrations (Essential Knowledge 2.7.B.2). Cells and organisms must regulate because membranes separate environments with different solute concentrations, and uncontrolled water movement can disrupt cell shape, enzyme function, and chemical reactions.
A freshwater organism usually gains water because its body fluids are more concentrated than the surrounding water. It can release dilute urine and actively take up ions. A marine organism tends to lose water to seawater and must conserve water while controlling salt intake and excretion. Plants regulate water balance through cell walls, vacuoles, stomata, and transport of water and ions.
AP reasoning: graph, predict, argue
This topic directly develops Science Practice 4: Representing and Describing Data, especially 4.A Construct a graph to represent the data. In a potato-mass investigation, graph external solute concentration on the $x$-axis and percent change in mass on the $y$-axis. The concentration at which the trend crosses $0%$ change estimates the isotonic point.
It also develops Science Practice 6: Argumentation, including 6.E Predict the causes or effects of a change in, or disruption to, one or more components in a biological system. A strong prediction links evidence to mechanism: “Increasing external salt concentration will decrease tissue mass because it lowers external $\Psi$, causing net water loss.”
Misconception check: “Isotonic means water stops moving.”
No. Water molecules continue crossing in both directions; isotonic means the two directions occur at equal rates, producing no net volume change.
Retrieval check: A cell has $\Psi=-0.45\ \text{MPa}$ and is placed in a solution with $\Psi=-0.10\ \text{MPa}$. Which way does net water move, and is the solution hypertonic or hypotonic relative to the cell? Answer: Water moves into the cell because $-0.10\ \text{MPa}$ is the higher water potential; the solution is hypotonic relative to the cell.
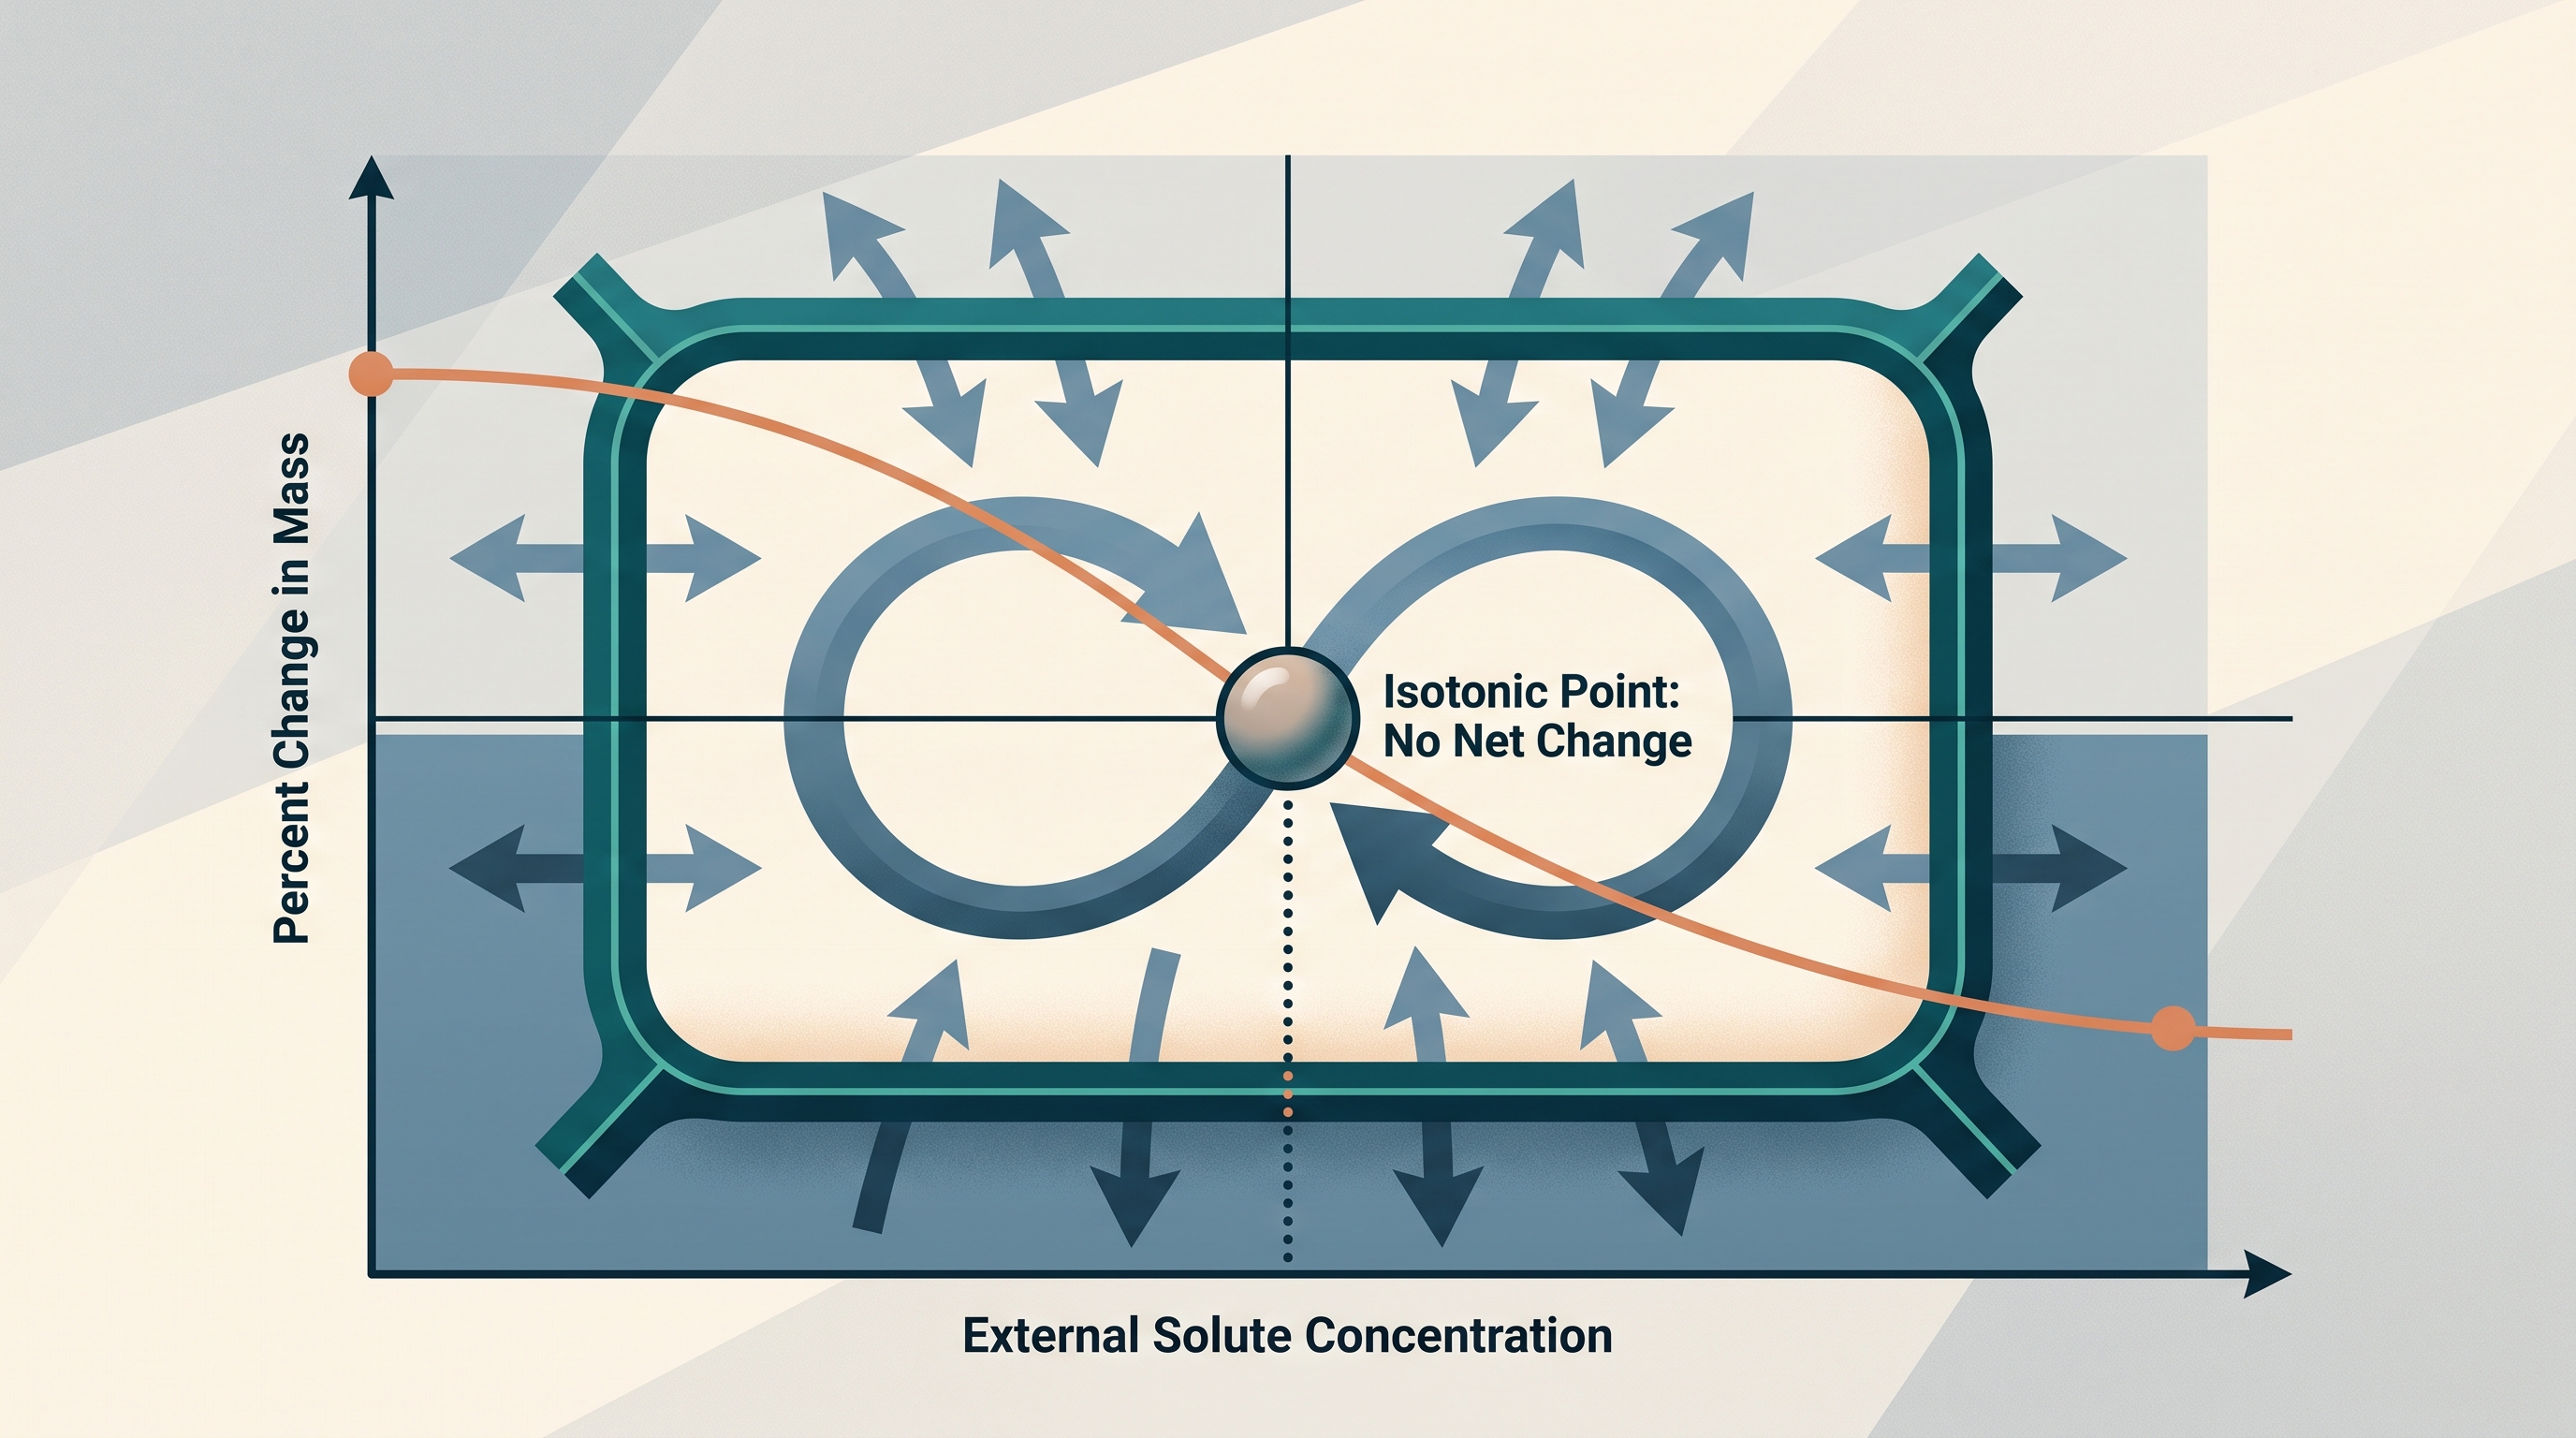
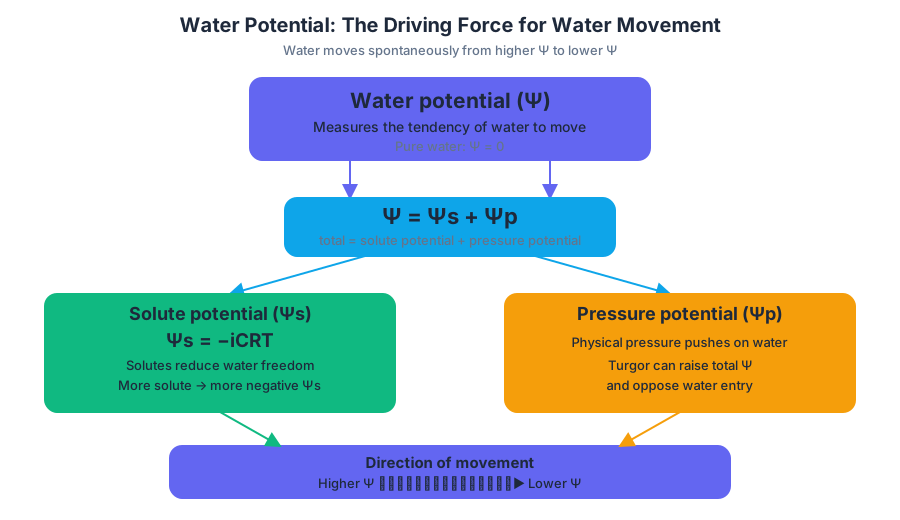
2.8 Mechanisms of Transport
Key concepts: Homeostasis · Transport mechanisms in plants · Osmosis · Diffusion · Active transport · Water absorption by plants · Ion absorption by plants · Nutrient absorption by plants · Transport of dissolved nutrients · Maintaining proper balances of water, ions, and nutrients
A plant can lift water from soil to leaves, balance dissolved ions inside its cells, and deliver nutrients throughout its body without a pump running through every root.
2.8 Mechanisms of Transport
A plant can lift water from soil to leaves, balance dissolved ions inside its cells, and deliver nutrients throughout its body without a pump running through every root. It accomplishes this through three linked mechanisms: osmosis, diffusion, and active transport.
CED traceability: Topic 2.8 Mechanisms of Transport; Learning Objective 2.8; Essential Knowledge 2.B.1.
The central biological problem is homeostasis: plants must accumulate sufficient quantities of water, ions, and other nutrients while keeping those materials properly balanced.
The transport problem: gaining materials without losing control
Root cells contact soil, but contact alone does not guarantee absorption. Water and dissolved nutrients must cross selectively permeable cell membranes, move through root tissues, enter the xylem, and travel upward to stems and leaves. At every stage, the plant must regulate the amounts entering and leaving; too little water causes wilting, while excessive loss can damage or kill the plant.
A useful way to visualize the pathway is:
$$ \text{soil} \rightarrow \text{root cells} \rightarrow \text{root xylem} \rightarrow \text{stems} \rightarrow \text{leaves} $$
The transported materials include both water and dissolved nutrients, especially ions. Their movement is not governed by one universal mechanism. The direction and energy requirements depend on the concentration gradient, the water-potential gradient, the membrane proteins present, and whether the cell must move a substance against its gradient.
Osmosis: water follows water potential
Osmosis is the movement of water across a selectively permeable membrane from higher water potential to lower water potential. Water potential describes the tendency of water to move; water with higher free energy and more available water has a higher water potential, whereas water with lower free energy and less available water has a lower water potential.
$$ \text{high water potential} \rightarrow \text{low water potential} $$
In a root, dissolved ions and other solutes can make the water potential inside root cells lower than that of the surrounding soil solution. Water therefore enters the root by osmosis. The water then moves across successive cells toward the xylem, where the overall water-potential gradient can continue upward toward the leaves.
Worked example: why water enters a root
Suppose the soil solution has a relatively high water potential, while root cells contain accumulated ions that lower their water potential. The membrane allows water to cross more readily than many solutes.
- Water begins outside the root, where its water potential is higher.
- The root-cell interior has lower water potential because it contains more dissolved solute.
- Water moves into the root cells by osmosis.
- As water enters, it can pass from cell to cell toward the xylem.
- Transpiration—the evaporation of water from leaf surfaces—removes water at the shoot, helping maintain the directional gradient through the plant.
The plant is not “pulling” individual water molecules upward with a cellular motor. Instead, evaporation at the leaf and differences in water potential help maintain continuous water movement through the xylem.
Diffusion: particles spread down a gradient
Diffusion is the net movement of particles from a region of higher concentration to a region of lower concentration, caused by random molecular motion. It requires no direct input of cellular energy. Small molecules may cross a membrane directly, while other substances diffuse through membrane proteins; the decisive feature is movement down a concentration or electrochemical gradient.
Diffusion contributes to plant transport when dissolved substances move from areas where they are more concentrated toward areas where they are less concentrated. For example, an ion may diffuse through an appropriate channel if the ion’s electrochemical gradient favors movement into the cell.
Active transport: spending energy to build gradients
Active transport moves a substance against its concentration or electrochemical gradient and requires energy, usually supplied by ATP. Membrane pumps and transport proteins use this energy to accumulate ions and nutrients inside root cells even when diffusion would move them outward.
Active transport is therefore more than a way to move materials. It creates gradients that make other transport possible:
$$ \text{ATP use} \rightarrow \text{ion gradient} \rightarrow \text{nutrient uptake and water movement} $$
For instance, a root cell can actively transport mineral ions from dilute soil into its cytoplasm. The resulting increase in internal solute concentration can lower the cell’s water potential, encouraging additional water to enter by osmosis. In this way, active transport and osmosis operate as a connected system rather than as isolated processes.
Homeostasis in the whole plant
Homeostasis is the maintenance of a relatively stable internal environment despite external changes. Plant transport supports homeostasis by controlling water, ions, and nutrients: roots absorb materials, xylem distributes water and dissolved nutrients upward, and leaves lose water through transpiration.
A plant facing dry air may lose water from its leaves faster than roots can replace it. If the imbalance becomes severe, cells lose turgor, the plant wilts, and continued water loss can lead to death. Transport mechanisms must therefore maintain both supply and balance.
Misconception check
Misconception: “All plant absorption is passive.”
Correction: osmosis and diffusion are passive, but plants also use active transport to accumulate ions and nutrients against gradients. The energy used for active ion transport can indirectly support water absorption by changing water potential.
AP Biology science practices in this topic
This topic is commonly assessed through Science Practice 1: Concept Explanation, when explaining why a substance moves in a particular direction; Science Practice 2: Visual Representations, when interpreting a root-to-leaf transport diagram; Science Practice 5: Statistical Tests and Data Analysis, when analyzing water-uptake or transpiration data; and Science Practice 6: Argumentation, when using evidence to argue that a treatment changes transport or homeostasis.
Retrieval check
A root cell actively accumulates ions from dilute soil. Predict what happens to the root cell’s water potential and explain why water may subsequently enter. A complete answer states that ion accumulation lowers the cell’s water potential, creating a gradient that favors water movement into the cell by osmosis.
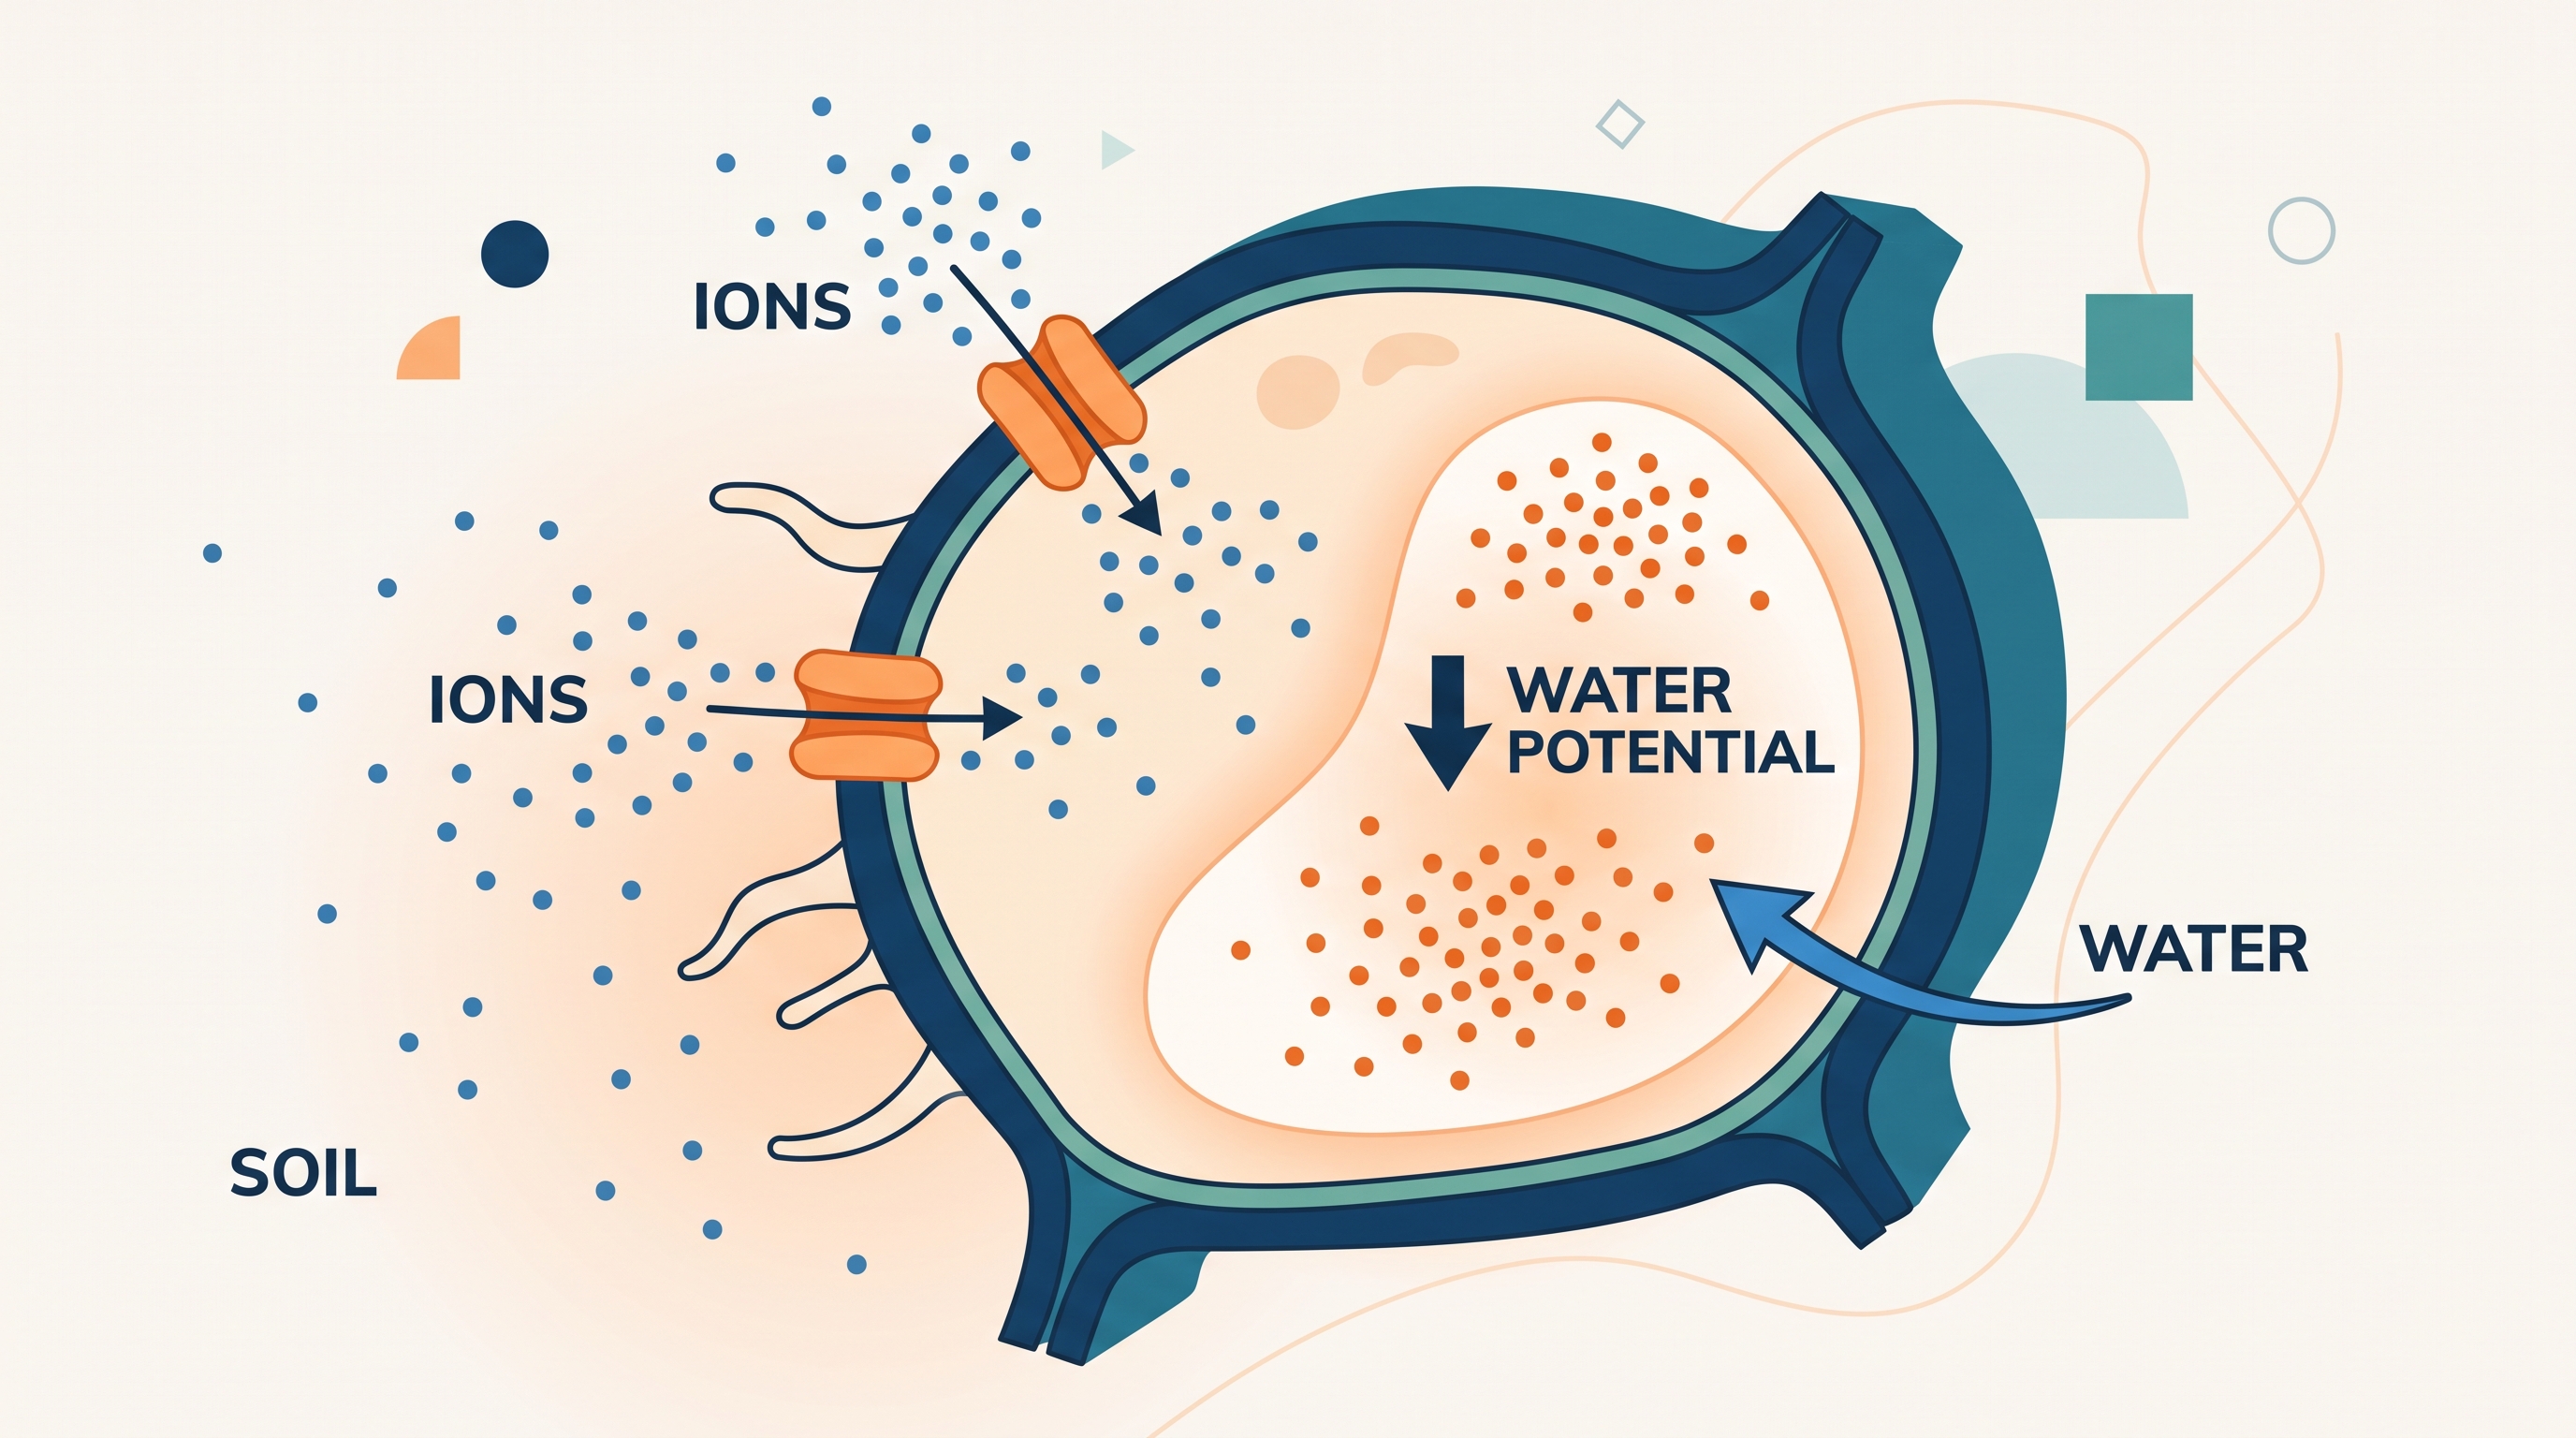
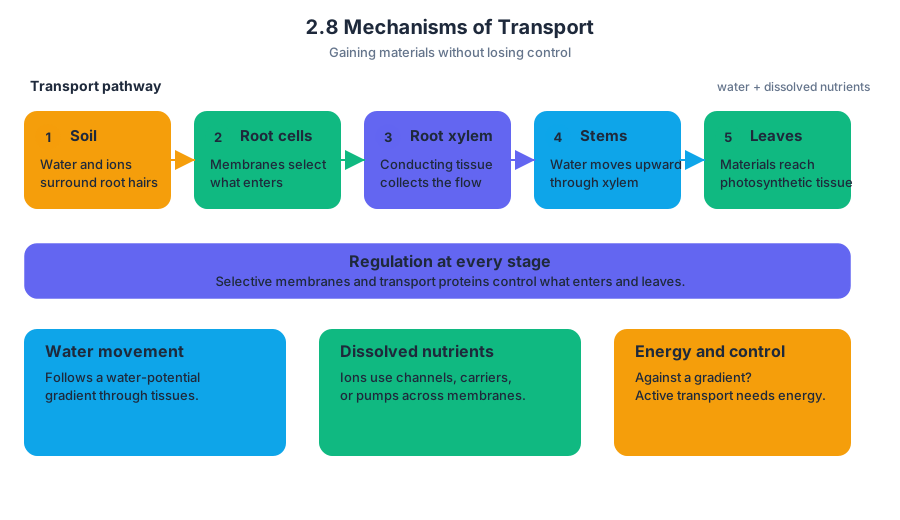
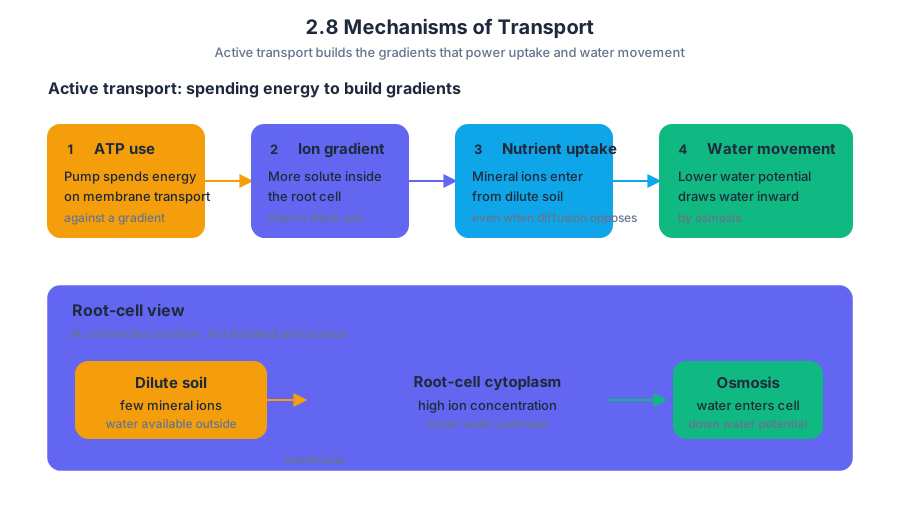
2.9 Cell Compartmentalization
A eukaryotic cell is not a single reaction vessel; it is a coordinated network of specialized spaces. Cell compartmentalization is the organization of cellular activities into distinct regions, often enclosed by membranes, so that different processes can occur efficiently and under different conditions.
2.9 Cell Compartmentalization
A eukaryotic cell is not a single reaction vessel; it is a coordinated network of specialized spaces. Cell compartmentalization is the organization of cellular activities into distinct regions, often enclosed by membranes, so that different processes can occur efficiently and under different conditions.
A lysosome, for example, contains enzymes that work best in an acidic environment. If those enzymes were freely mixed throughout the cytoplasm, they could damage important cellular components. By enclosing them within a membrane-bound organelle, the cell creates a controlled microenvironment: the lysosome can maintain conditions suitable for digestion while the surrounding cytoplasm remains relatively stable.
Why compartments improve cell function
Internal membranes divide the cell into spaces with different chemical conditions. These spaces can vary in pH, ion concentration, enzymes, substrates, and surface area. Such separation allows incompatible reactions to occur simultaneously and places related steps of a pathway close together.
The major advantages of compartmentalization include:
- Isolation: potentially harmful reactions or substances remain contained.
- Efficiency: enzymes and substrates can be concentrated in the same location.
- Organization: sequential reactions can occur in a particular order.
- Regulation: each compartment can maintain conditions that favor its own processes.
- Surface-area specialization: folded membranes provide extensive surfaces for proteins involved in transport or energy conversion.
The endoplasmic reticulum illustrates this organization. The rough endoplasmic reticulum provides membrane surfaces containing ribosomes, where many proteins destined for secretion or membranes are synthesized. The smooth endoplasmic reticulum has different functions, including lipid synthesis and detoxification. These activities occur in connected membrane regions but are not identical because their structures and associated proteins differ.
Structure and function must be explained together
A frequent AP Biology error is to identify an organelle correctly but describe only its name or a vague function. A stronger explanation connects structure to function: the organelle’s physical features make its role possible.
For instance, mitochondria contain an inner membrane folded into cristae. The folds increase membrane surface area, allowing more electron-transport proteins and ATP synthase molecules to operate. The inner membrane also separates the mitochondrial matrix from the intermembrane space, enabling a proton gradient to form. Thus, the mitochondrion’s compartmentalized structure supports efficient ATP production.
Chloroplasts use a comparable organizational principle. Their thylakoid membranes contain the photosynthetic electron-transfer components, while the surrounding stroma contains enzymes involved in carbon fixation. Separating these locations allows light-dependent reactions and carbon-fixation reactions to occur in chemically distinct environments while remaining coordinated.
A worked example: predicting the effect of lost compartmentalization
Suppose a mutation causes the membrane surrounding a lysosome to become highly permeable. Predict the cellular consequences by tracing structure to function:
- Lysosomal enzymes and acidic contents could leak into the cytoplasm.
- The lysosome would lose its specialized internal conditions.
- Degradative reactions could occur in inappropriate locations.
- Cellular macromolecules and organelles could be damaged.
- The cell’s ability to recycle materials would decline.
The key reasoning is not merely “the lysosome stops working.” Loss of the membrane disrupts the compartment’s chemical environment and releases substances that should have remained localized. The result follows from the relationship between membrane boundary, internal conditions, and biochemical function.
Misconception check: “More compartments are always better”
Misconception: Compartmentalization is universally beneficial and has no cost.
Correction: Compartments improve control and efficiency, but they also require energy and coordination. Materials must be transported between organelles, membranes must be maintained, and signals must regulate when substances enter or leave. A compartment that becomes isolated from the rest of the cell cannot contribute effectively to whole-cell function.
This is why cellular organization involves both separation and communication. Organelles do not function as independent “mini-cells”; vesicles, transport proteins, cytoskeletal elements, and signaling systems connect their activities.
AP reasoning focus
Topic 2.9 Cell Compartmentalization is especially suited to Science Practice 1: Concept Explanation, because responses must explain how organelle structures support cellular processes. It also uses Science Practice 2: Visual Representations when interpreting organelle diagrams, and Science Practice 6: Argumentation when defending a claim about compartment function with evidence.
The essential-knowledge identifier 2.9.B emphasizes that internal membranes organize cellular processes. In particular, 2.9.B.1 requires explaining how internal membranes facilitate cellular processes by creating specialized environments. For argumentation, 6.B: Support a claim with evidence from biological principles, concepts, processes, and data means that a claim such as “membrane damage reduces ATP production” must be supported by the relevant structural and biochemical evidence, not by an organelle label alone.
Retrieval check
A cell contains an organelle whose interior must remain acidic for its enzymes to function. Predict two consequences if the organelle’s surrounding membrane loses its ability to maintain a separate internal environment. A complete answer should name both the change in the organelle’s conditions and the effect on the cell’s other components.
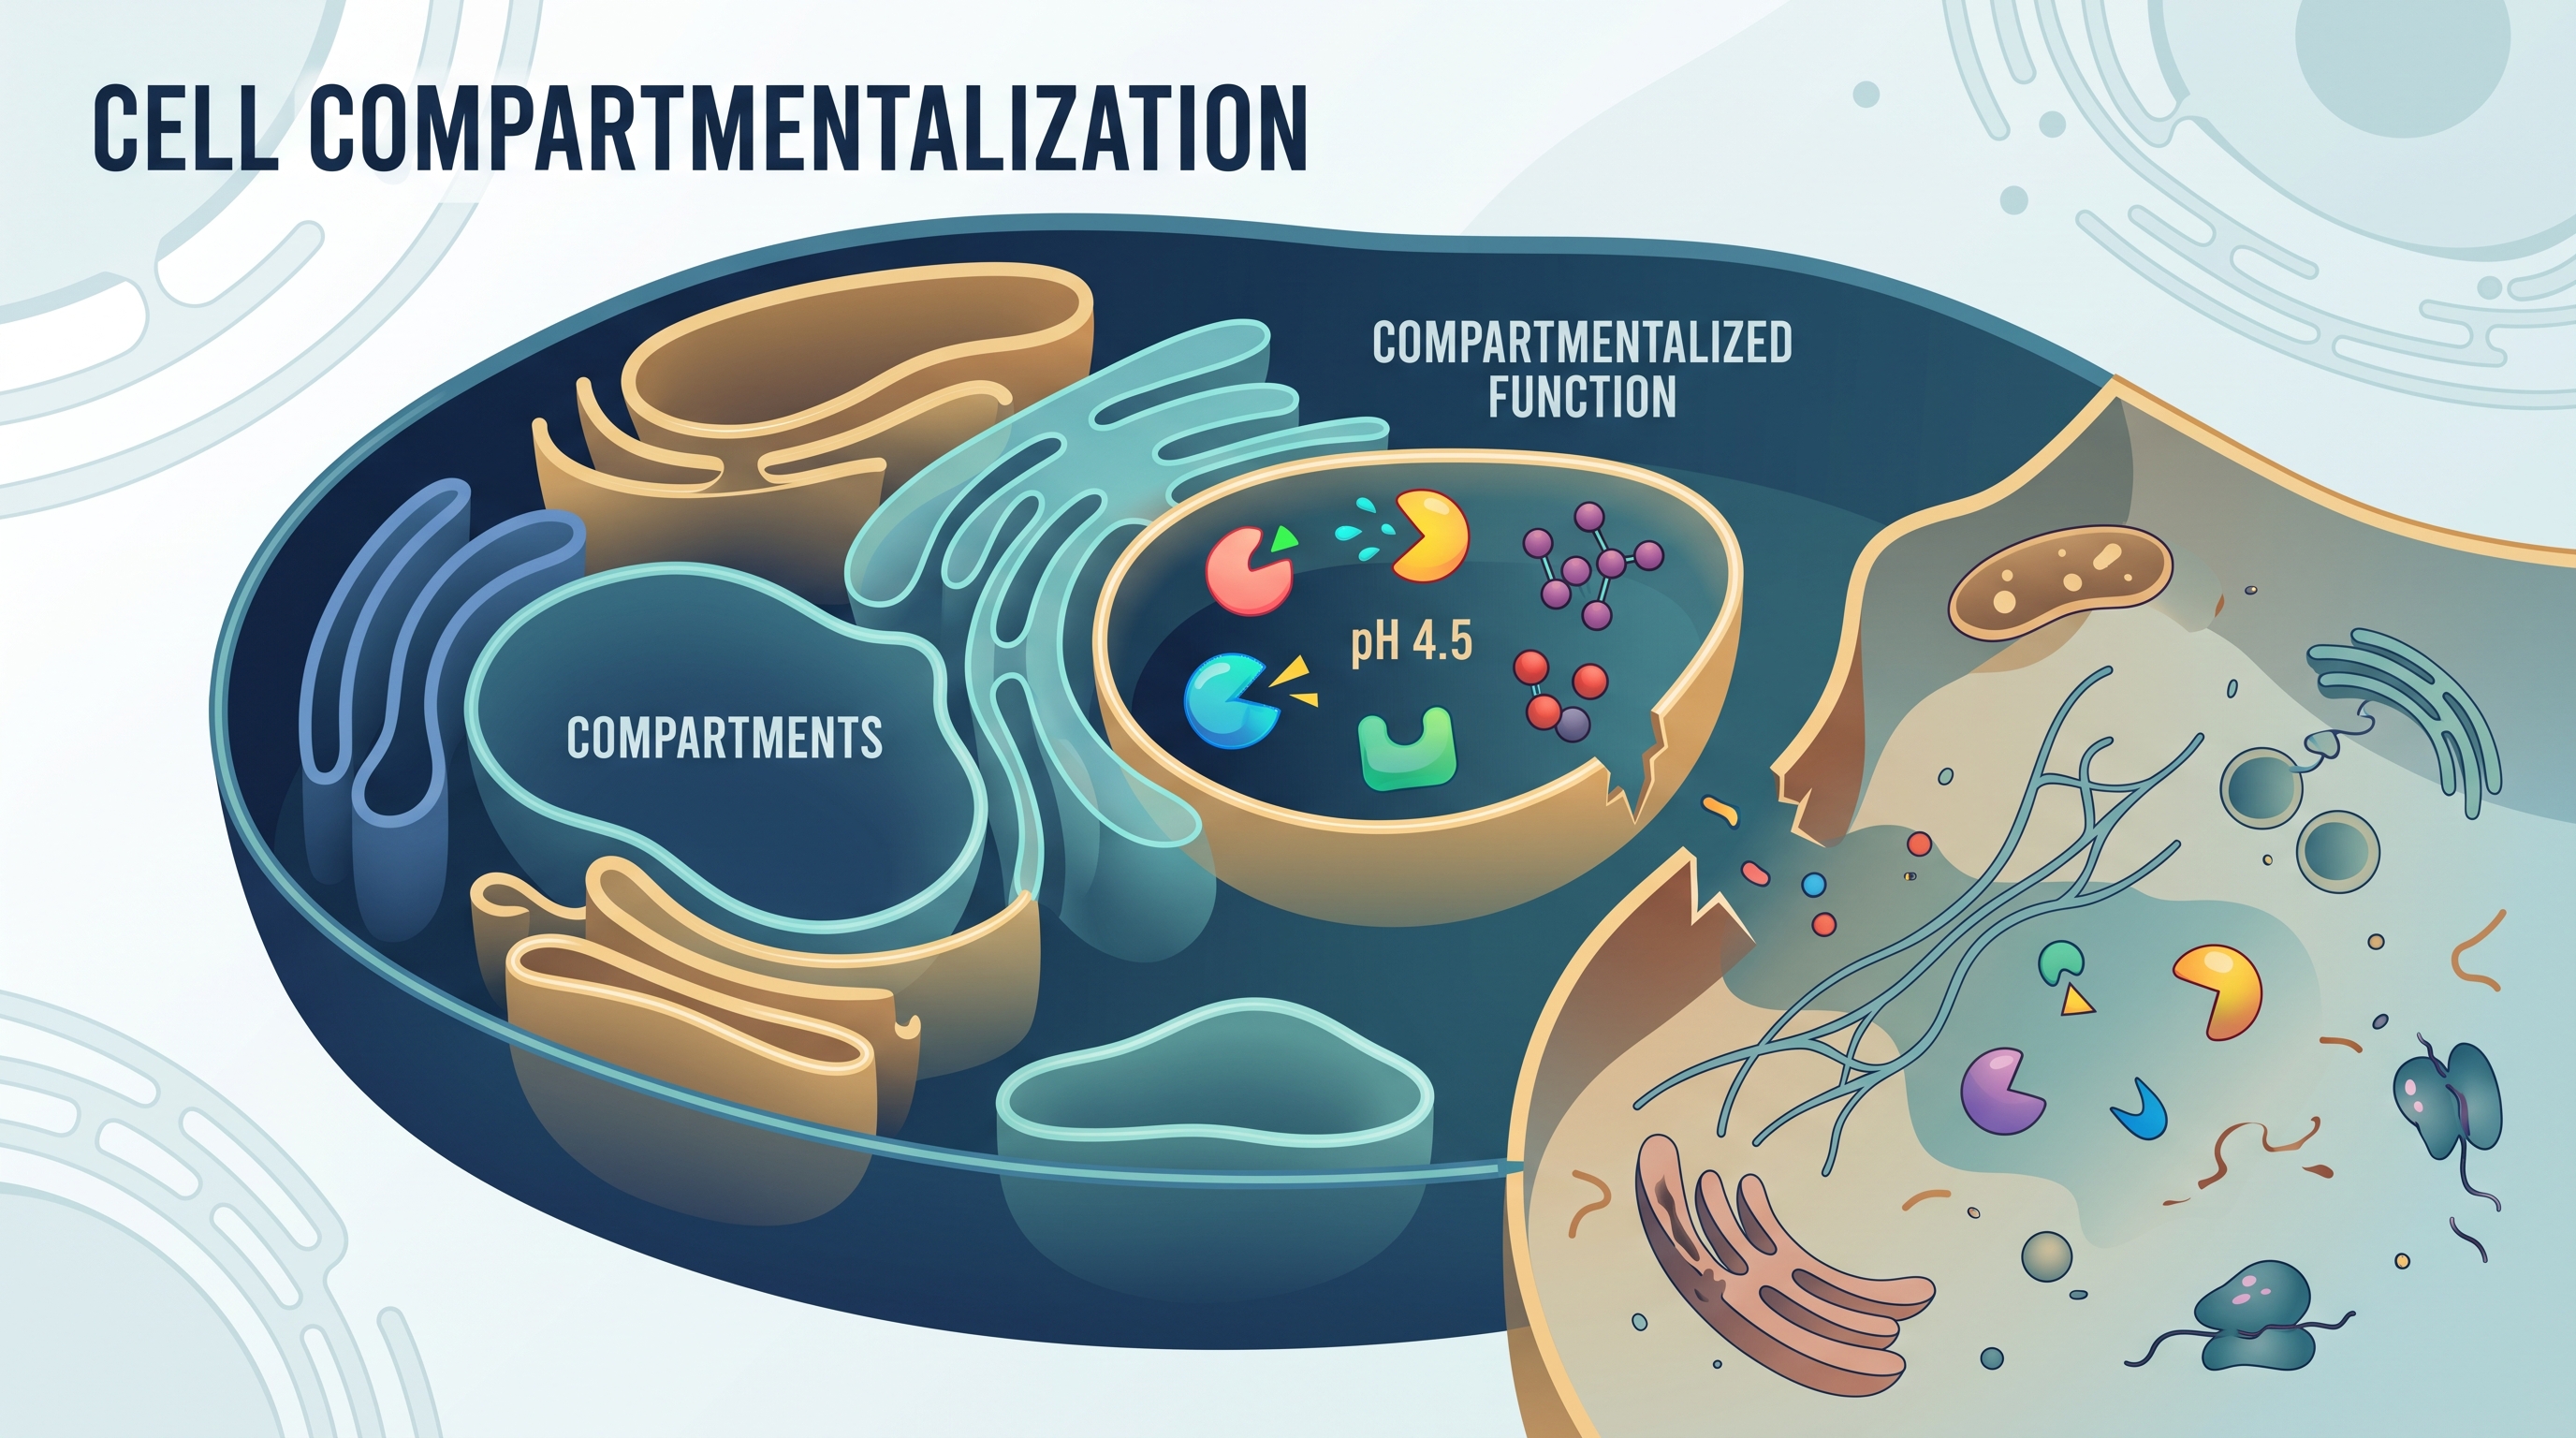
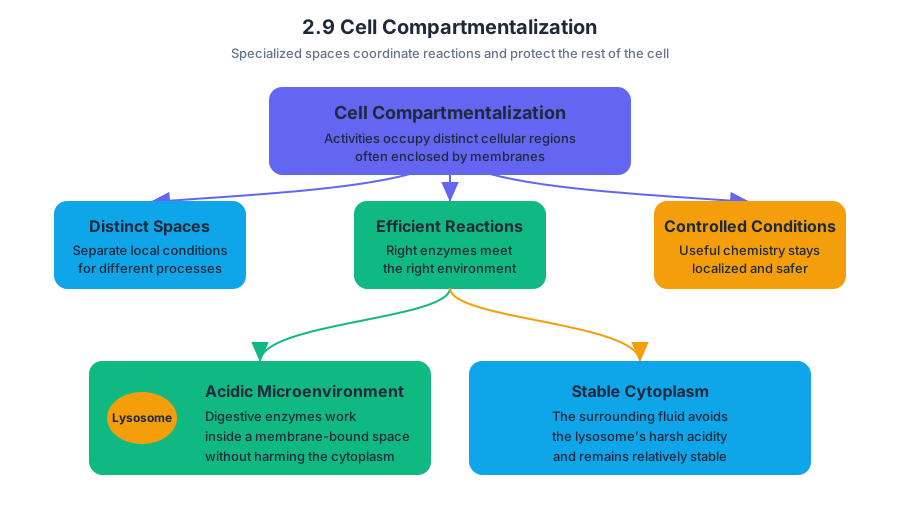
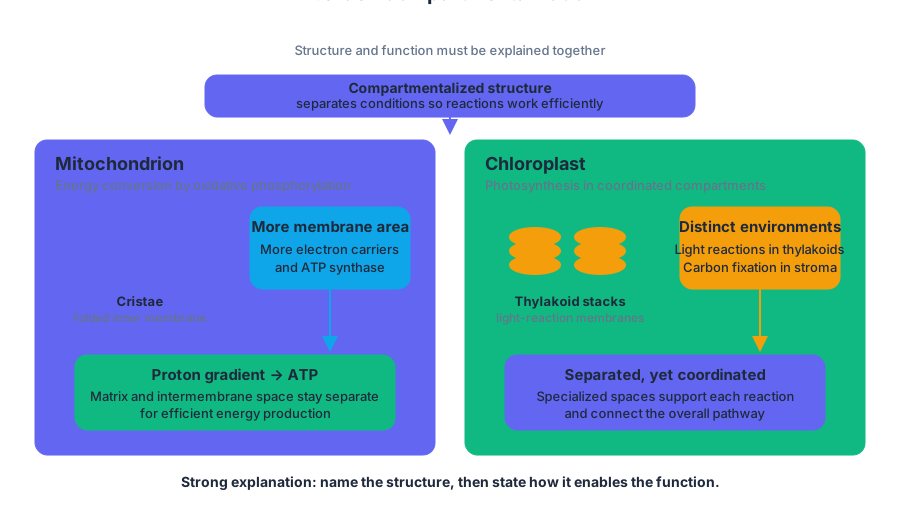
2.10 Origins of Cell Compartmentalization
Key concepts: Cell size · Plasma membrane · Membrane permeability · Membrane transport · Facilitated diffusion · Visual representations · Statistical tests and data analysis · Questions and methods · Cell transport
Eukaryotic cells may have become complex when one cell began living inside another, transforming separate organisms into a coordinated cellular system. This idea, called the endosymbiotic theory, explains the evolutionary origin of mitochondria and chloroplasts and provides a powerful argument for how internal…
2.10 Origins of Cell Compartmentalization
Eukaryotic cells may have become complex when one cell began living inside another, transforming separate organisms into a coordinated cellular system. This idea, called the endosymbiotic theory, explains the evolutionary origin of mitochondria and chloroplasts and provides a powerful argument for how internal compartments arose.
CED alignment: Topic 2.10 Origins of Cell Compartmentalization; Learning Objective 2.10-1; Essential Knowledge 2.A.3; Science Practice 6: Argumentation.
The central idea: endosymbiosis
An endosymbiont is an organism that lives inside another organism and benefits from the relationship. Under the endosymbiotic theory, an ancestral host cell engulfed a free-living bacterium. Instead of digesting it, the host retained it as a permanent internal partner. Over evolutionary time, the bacterium supplied useful metabolic functions while the host supplied protection and access to nutrients.
The most widely accepted model proposes two major events:
- An ancestral host cell incorporated an aerobic bacterium, which evolved into the mitochondrion.
- In some lineages, a eukaryotic cell containing mitochondria incorporated a photosynthetic cyanobacterium, which evolved into the chloroplast.
The result was not merely a larger cell. It was a cell with specialized internal regions: mitochondria could generate ATP through aerobic respiration, chloroplasts could capture light energy, and the surrounding host could coordinate these activities with other cellular processes.
Evidence for an evolutionary origin
The argument for endosymbiosis depends on several independent lines of evidence. Mitochondria and chloroplasts contain their own small, usually circular DNA; bacteria also commonly possess circular chromosomes. Both organelles contain ribosomes that resemble bacterial ribosomes more closely than the ribosomes found in the eukaryotic cytoplasm.
Their reproduction is another important clue. Mitochondria and chloroplasts divide by a process resembling binary fission, the way many bacteria reproduce. They also possess double membranes: the inner membrane is consistent with the engulfed bacterium’s original membrane, while the outer membrane is consistent with the host cell’s engulfing vesicle.
These observations are stronger together than separately. A circular genome alone does not prove bacterial ancestry, but circular DNA, bacterial-like ribosomes, binary-fission-like division, and double membranes form a converging pattern.
Worked argument: from observation to conclusion
Suppose researchers compare a mitochondrion with a free-living bacterium and find that both have circular DNA, similar ribosomal RNA sequences, and division by constriction. The researchers also observe that the mitochondrion has two surrounding membranes.
A strong Science Practice 6: Argumentation response would connect each observation to the claim:
- Claim: Mitochondria descended from bacteria that entered an ancestral host cell.
- Evidence: Mitochondria share bacterial-like genetic material, ribosomal features, reproductive behavior, and membrane structure.
- Reasoning: These similarities are expected if mitochondria originated from engulfed bacteria, but are less readily explained by the idea that mitochondria formed entirely from the host cell’s internal membranes.
The conclusion should remain appropriately qualified: evidence supports the endosymbiotic theory; it does not show that a modern mitochondrion is simply an unchanged bacterium. Evolution after incorporation produced extensive genetic transfer and dependence between the organelle and host.
Why membranes and transport matter
Compartmentalization works only when membranes create controlled boundaries. The plasma membrane and organelle membranes are selectively permeable, so molecules do not move randomly between every region of the cell. Transport proteins, concentration gradients, and energy-dependent mechanisms allow the cell to control which substances enter, leave, or remain within a compartment.
This arrangement creates local chemical conditions. For example, mitochondria maintain membrane-associated gradients that support ATP production. A compartment can therefore concentrate enzymes and substrates, separate incompatible reactions, and increase the efficiency of linked pathways.
Cell size also matters. As a cell becomes larger, its volume can increase faster than its surface area, making exchange with the environment less efficient. Internal membranes add functional membrane surface and divide the cytoplasm into regions, helping a large eukaryotic cell manage transport and chemical reactions.
Misconception check
Misconception: “Endosymbiosis means the host cell swallowed a bacterium and immediately became a modern eukaryote.”
Correction: Endosymbiosis describes a long evolutionary process. The internal partner and host became increasingly interdependent, and some genes originally located in the endosymbiont were transferred to the host nucleus.
Misconception: “Mitochondria and chloroplasts are independent cells inside cells.”
Correction: They retain some bacterial features but cannot generally survive as fully independent organisms because modern organelles depend on the host cell for many proteins and regulatory functions.
Retrieval and interpretation check
A newly studied organelle contains circular DNA, bacterial-like ribosomes, divides by binary fission, and has a double membrane. Which explanation is best supported, and why?
Answer: The organelle likely originated through endosymbiosis. The conclusion is supported not by one observation, but by the converging evidence of bacterial-like genetic material, translation machinery, reproduction, and membrane structure. A complete argument would compare these traits with appropriate bacterial and eukaryotic controls and evaluate alternative explanations.
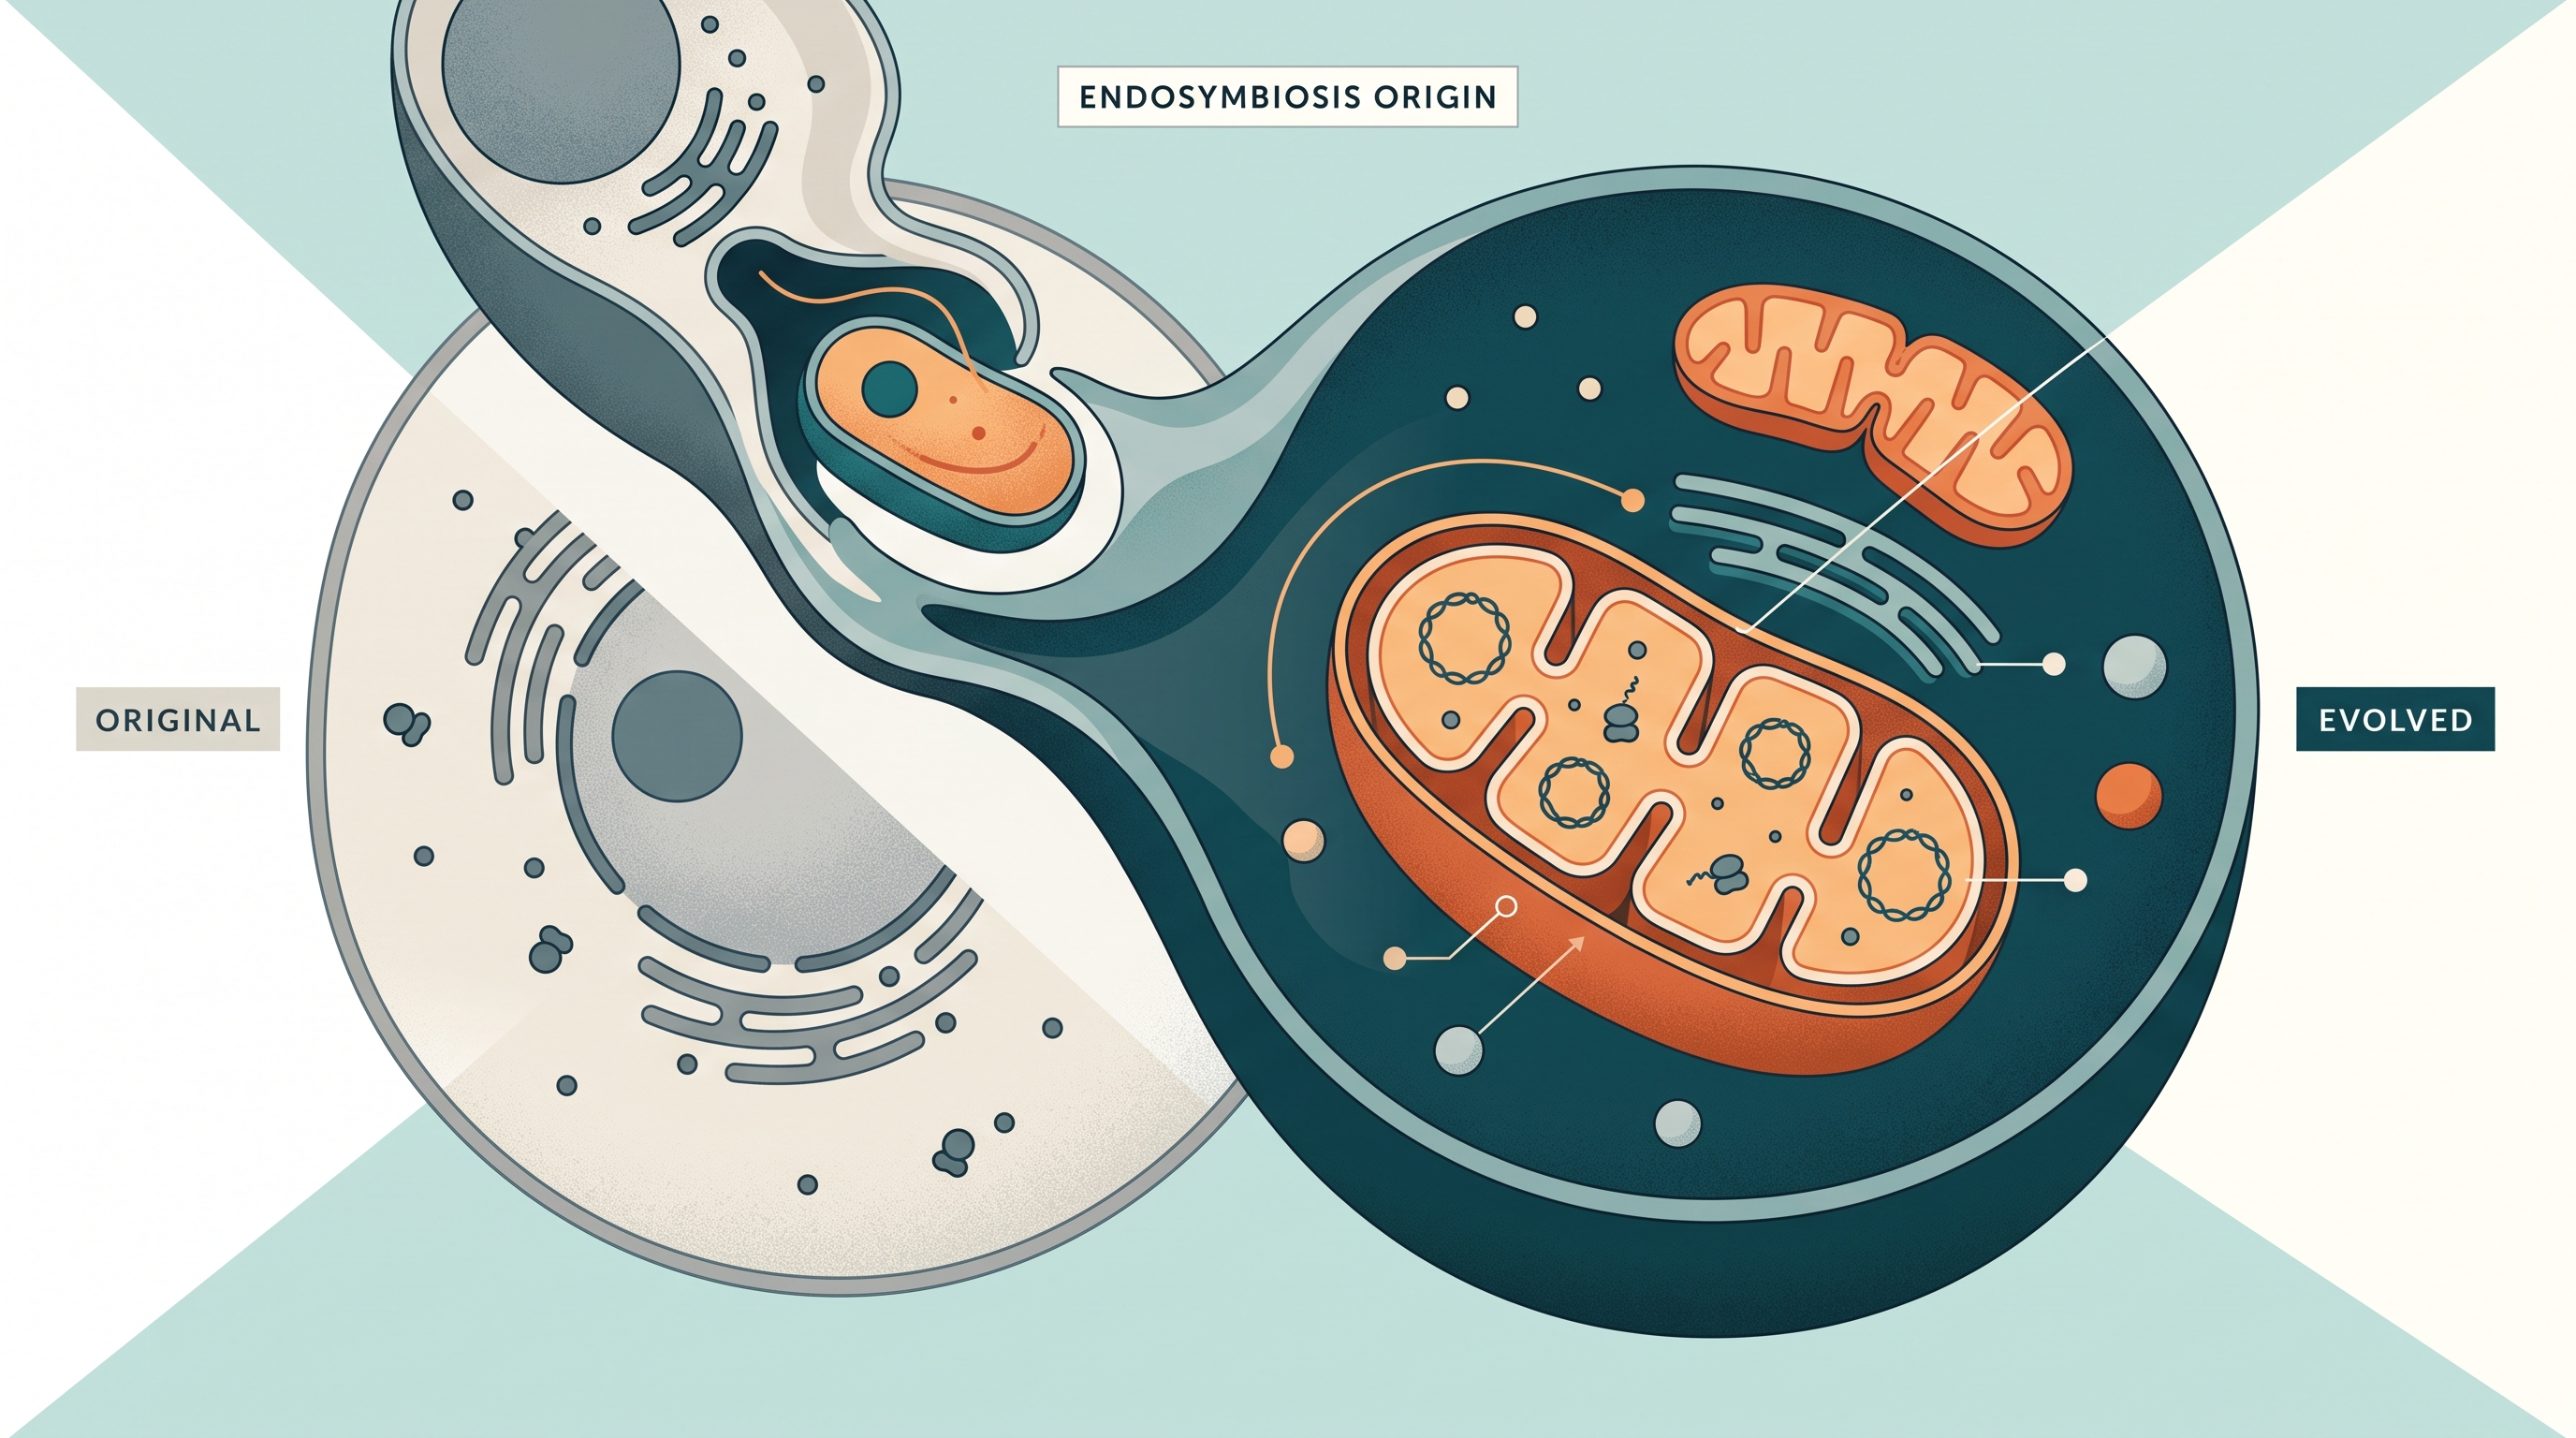
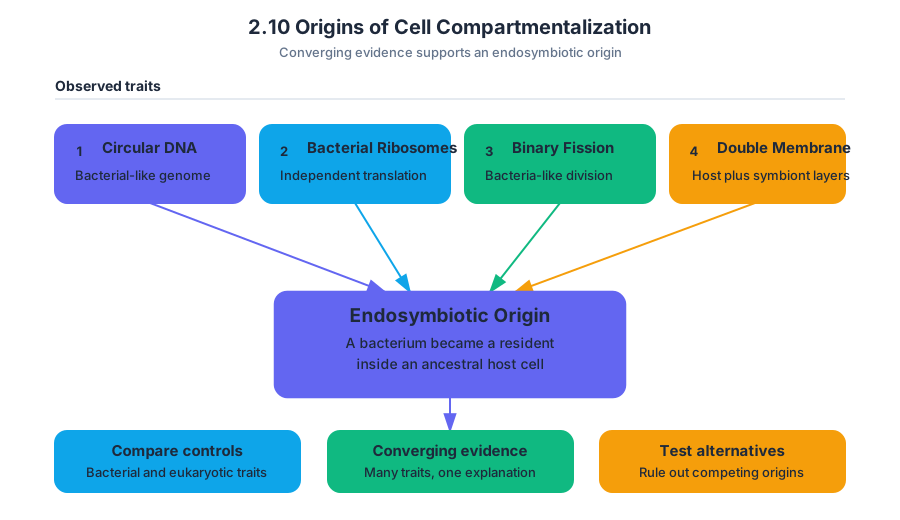
3.1 Enzymes
Key concepts: Enzymes as biological catalysts · Lowering activation energy · Enzyme active sites and substrate specificity · Protein shape and enzyme function · Denaturation and disruption of enzymatic activity · Abiotic and biotic factors affecting enzyme activity · Temperature effects on enzymatic reactions · Enzyme concentration effects on enzymatic reactions · Peroxidase activity assays
A raw potato can turn a colorless peroxide solution visibly darker because peroxidase, an enzyme, accelerates the reaction. The enzyme does not supply energy or become the product; it provides a lower-energy route from reactants to products.
3.1 Enzymes
A raw potato can turn a colorless peroxide solution visibly darker because peroxidase, an enzyme, accelerates the reaction. The enzyme does not supply energy or become the product; it provides a lower-energy route from reactants to products.
Catalysts and activation energy
A catalyst is a substance that increases the rate of a chemical reaction without being consumed overall. Enzymes are biological catalysts. They speed reactions by lowering the activation energy, the minimum energy needed for reactant molecules to reach the unstable transitional arrangement from which products can form.
Without an enzyme, substrate molecules may collide in many unproductive orientations. An enzyme binds particular substrate molecules and forms an enzyme–substrate complex, positioning them so that the transition state is easier to reach. The enzyme changes the pathway and reaction rate, but it does not change the overall energy difference between reactants and products.
A useful analogy is a mountain pass: reactants and products are on opposite sides of the same mountain, but an enzyme creates a lower pass through the mountain. The starting and ending elevations remain the same; only the barrier between them is reduced.
Active sites and substrate specificity
An enzyme’s active site is the region where substrate molecules bind and the reaction is facilitated. Its three-dimensional shape, chemical properties, and arrangement of amino acid side chains selectively allow certain substrates to bind. This selectivity is called substrate specificity.
The active site is not merely a rigid hole into which any molecule of the right size fits. Binding depends on complementary shape and chemical interactions. Once the substrate binds, small changes in the enzyme’s shape can improve the fit and help strain or orient chemical bonds in the substrate.
Key distinction: An enzyme’s specificity determines which substrate can bind; catalytic activity determines how the bound substrate is converted into product.
Misconception check — “Enzymes make impossible reactions possible.” Enzymes accelerate reactions that are chemically possible under the conditions. They lower activation energy; they do not violate conservation of energy or guarantee that every collision produces product.
Protein shape determines function
Because an enzyme is a protein, its function depends on its folded shape. If the protein’s structure changes, the active site can change as well. Denaturation is the disruption of a protein’s shape, often severe enough to destroy its function. A denatured enzyme may still contain the same amino acid sequence, but its active site may no longer bind the substrate correctly.
This explains why an enzyme can lose activity when its structure is disrupted. The immediate problem is not that the substrate disappears; it is that the enzyme–substrate complex can no longer form effectively.
Worked investigation: peroxidase activity
Suppose a student asks: How does enzyme concentration affect the rate of peroxidase activity? The student prepares identical reaction mixtures, changes only the amount of peroxidase, and observes the color produced after the same time interval.
The reasoning proceeds as follows:
- Independent variable: peroxidase concentration.
- Dependent variable: reaction rate, estimated from color intensity over a fixed time.
- Controlled variables: substrate concentration, temperature, pH, reaction volume, mixing, observation time, and light conditions.
- Prediction: with sufficient substrate, increasing enzyme concentration should increase the reaction rate because more active sites are available.
- Interpretation: darker color in the same time indicates more product formation and therefore a higher reaction rate.
A basic assay can also test temperature by keeping enzyme and substrate concentrations constant while varying temperature. A color palette can help compare peroxidase activity across treatments, but a quantitative measurement—such as color intensity recorded consistently—supports stronger comparisons than visual judgment alone.
The rate can be represented as product formed per unit time, such as $\Delta[\text{product}]/\Delta t$. Replicate trials are important because a single color difference might result from uneven mixing, inaccurate volumes, or differences in sample preparation rather than from the tested factor.
AP Biology skill connection
This investigation specifically uses Science Practice 3: Questions and Methods, especially 3.A Identify or pose a testable question, 3.B State a scientific hypothesis, and 3.C Identify experimental procedures. It also uses Science Practice 4: Representing and Describing Data—4.A Construct data representations, 4.B Describe data, and 4.C Identify patterns or relationships—to compare reaction rates. A defensible conclusion uses Science Practice 6: Argumentation, including 6.A Make a scientific claim and 6.B Support a claim with evidence.
For example: “Higher peroxidase concentration increased the reaction rate” is a claim. The evidence must identify the observed color or measured product differences, while the reasoning connects those differences to the greater number of available active sites. The conclusion should say whether the results support or contradict the hypothesis, not claim proof from one investigation.
Retrieval check
A mutation changes one amino acid in an enzyme, and the enzyme no longer converts its substrate efficiently. What is the most direct explanation? The amino acid change altered the protein’s three-dimensional shape or chemical properties, disrupting the active site and reducing formation of the enzyme–substrate complex.
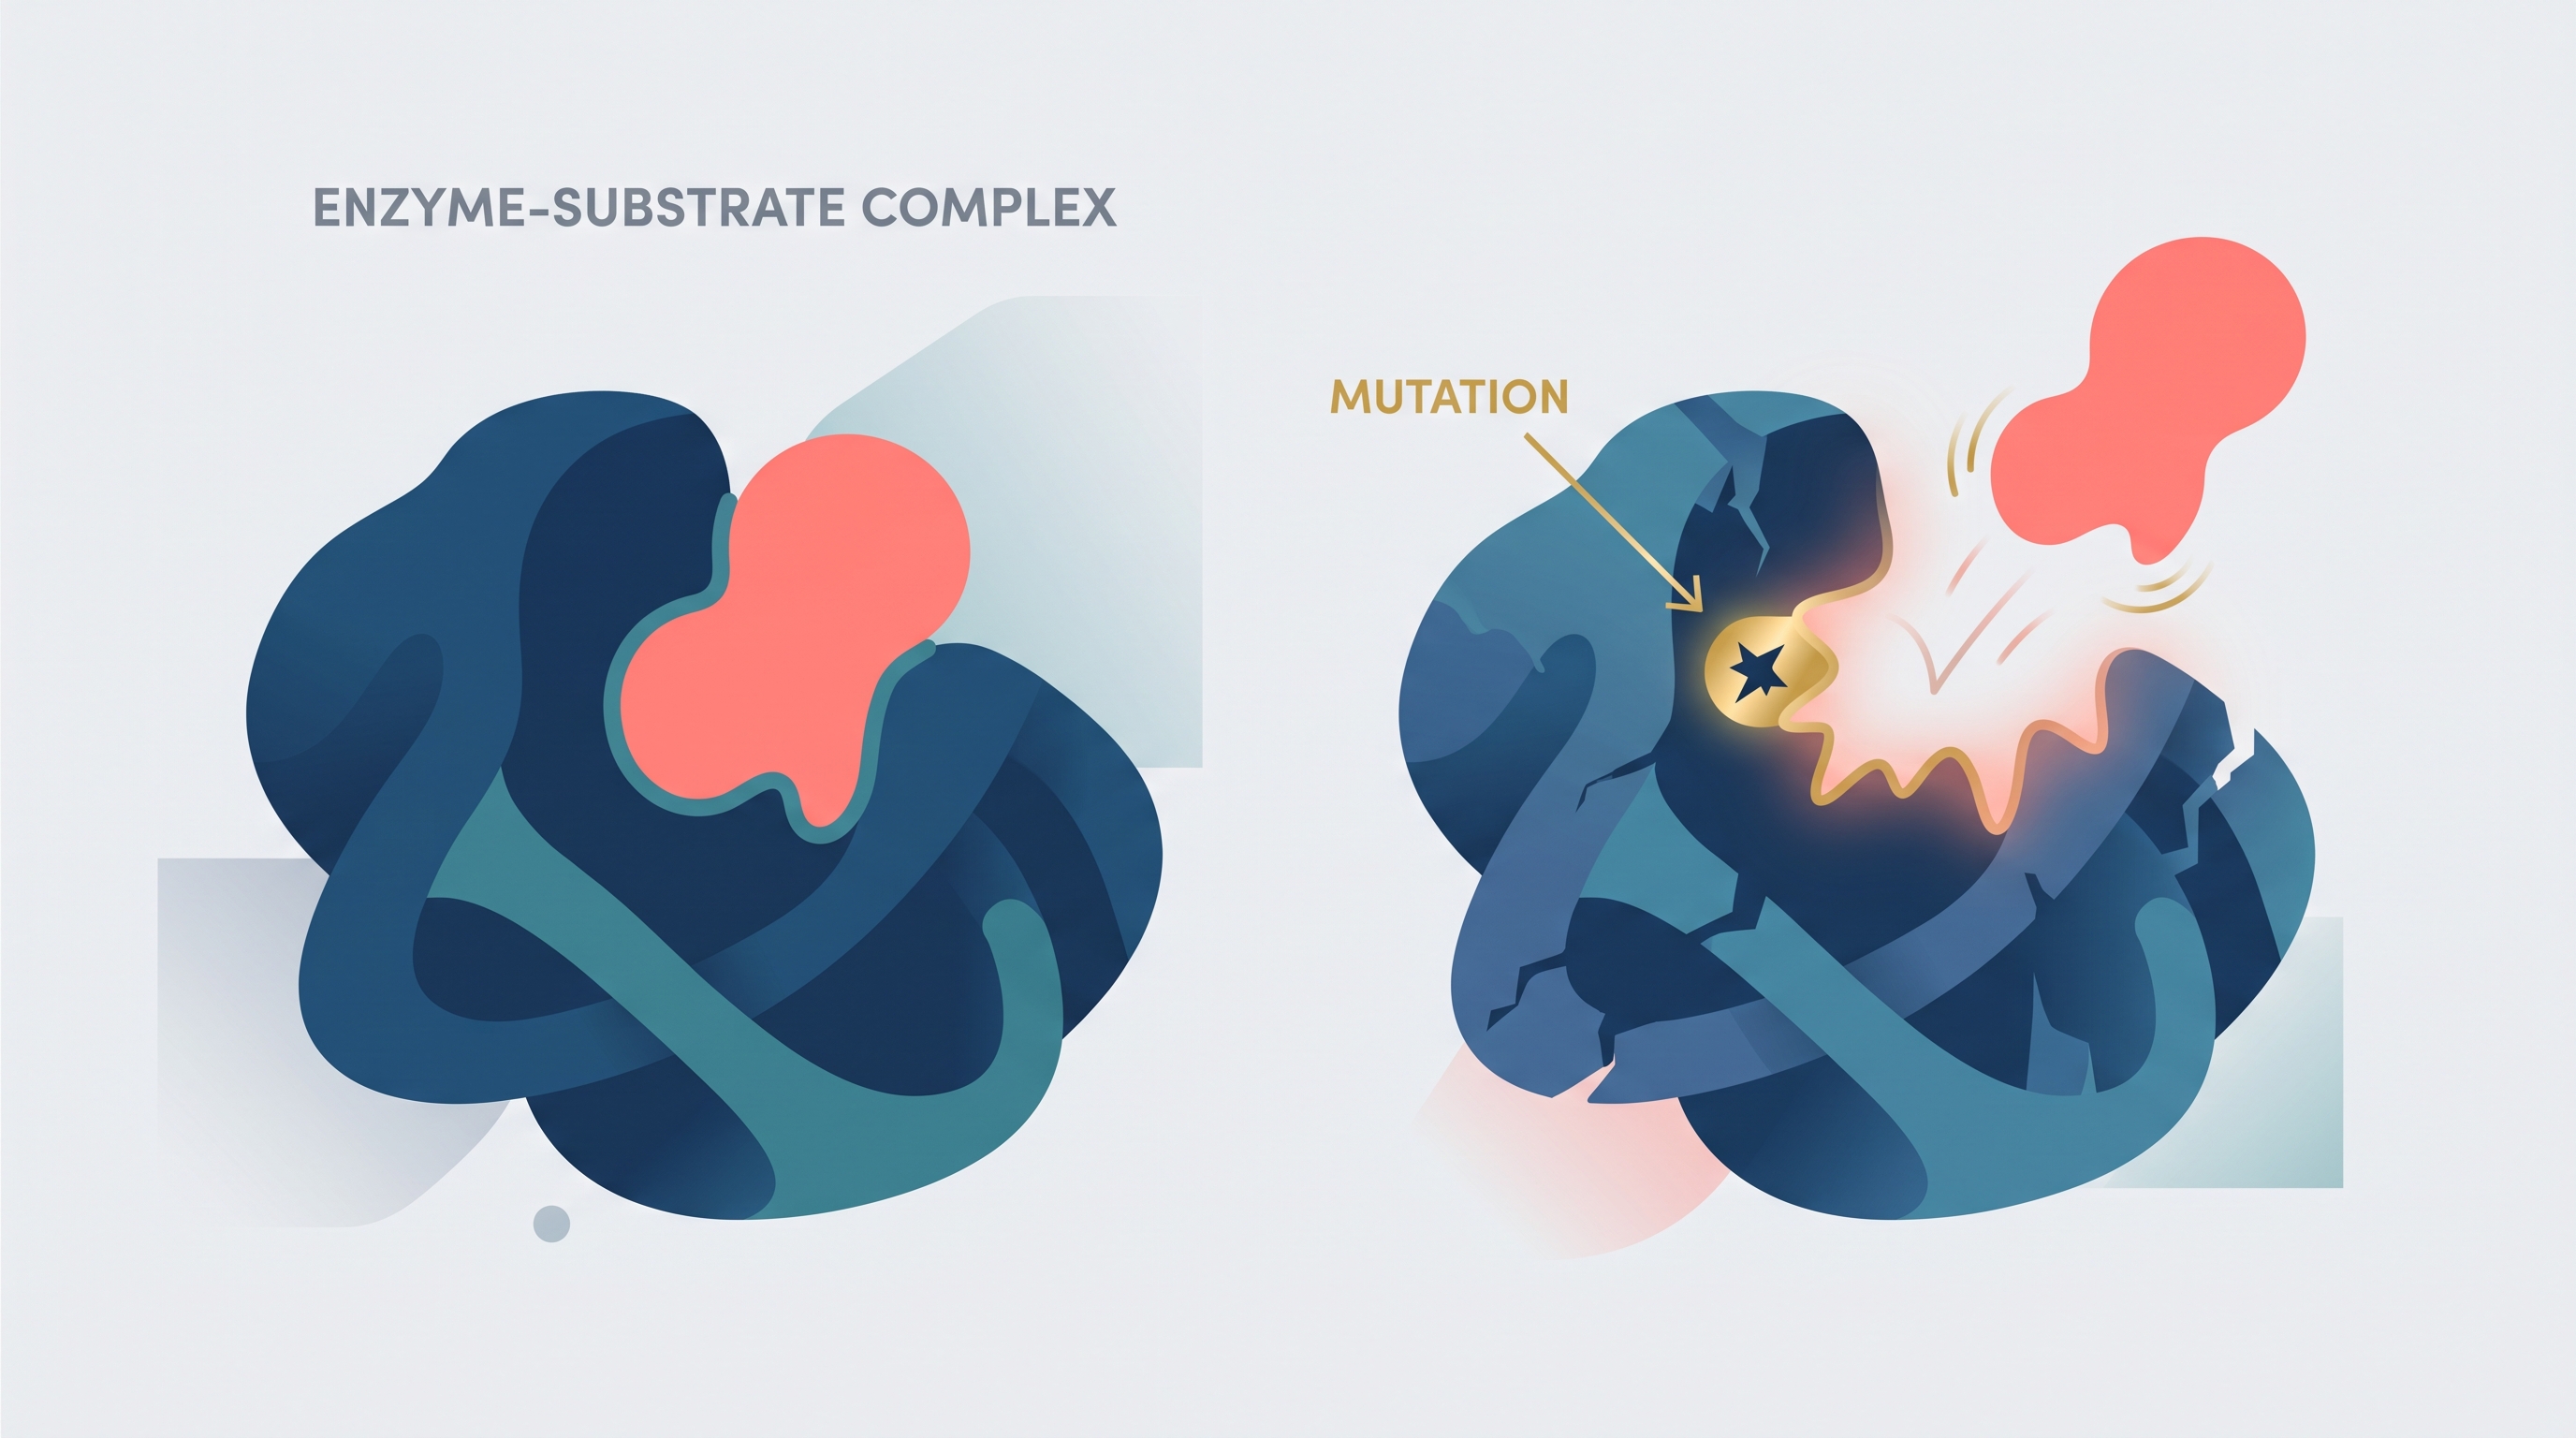
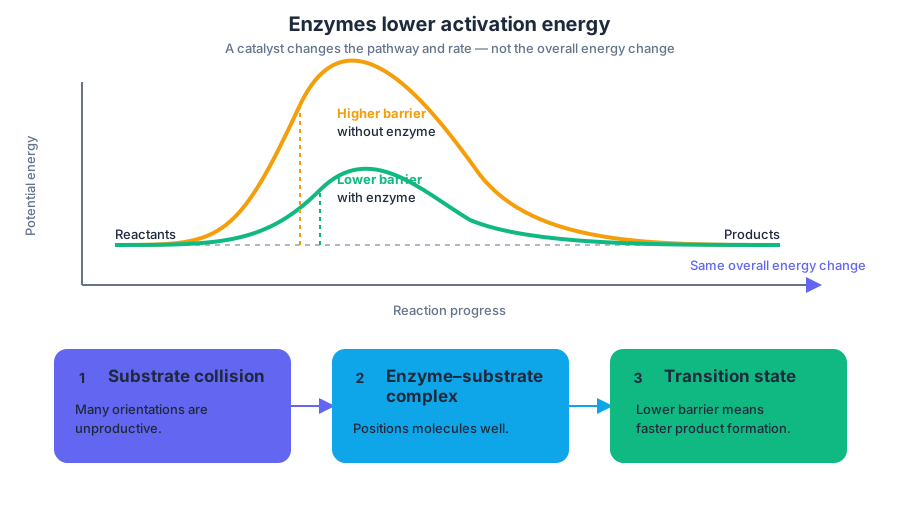
3.2 Environmental Impacts on Enzyme Function
Key concepts: Enzyme molecular structure · Environmental temperature effects on enzymes · Environmental pH effects on enzymes · Hydrogen bonds in enzyme structure · Enzyme activity and catalytic efficiency · Enzyme denaturation · Reversible denaturation · Cellular environment and concentrations · Thermal energy and reaction kinetics
An enzyme can lose its catalytic power without losing a single amino acid: a shift in temperature or pH can disturb the weak interactions that hold its three-dimensional shape together.
3.2 Environmental Impacts on Enzyme Function
An enzyme can lose its catalytic power without losing a single amino acid: a shift in temperature or pH can disturb the weak interactions that hold its three-dimensional shape together. The central question is therefore: How can the cellular environment change the structure of an enzyme and, in turn, change the rate of a reaction?
Learning Objective 3.2.A: Explain how changes to the structure of an enzyme may affect its function.
Essential Knowledge 3.2.A.1: Change to the molecular structure of a component in an enzymatic system may result in a change to its function or efficiency.
Structure is the condition for function
An enzyme’s catalytic efficiency depends on the precise shape of regions that interact with its substrate. That shape is maintained not only by strong covalent bonds but also by many weaker interactions, including hydrogen bonds—attractions between a partially positive hydrogen and an electronegative atom in another part of a molecule.
When temperature or pH changes, hydrogen bonds and other interactions can be disrupted. The enzyme may still be present in the solution, but its active site may no longer have the correct shape or chemical environment for effective substrate binding and catalysis.
The causal chain is:
- Environmental change
- Disruption of hydrogen bonds and other interactions
- Altered enzyme structure
- Changed active-site shape or chemistry
- Changed catalytic efficiency
- Changed reaction rate
Temperature: more motion, then structural damage
Temperature affects enzyme activity in two connected ways. At moderate temperatures, increasing temperature increases molecular motion, so enzyme and substrate molecules collide more frequently and with greater kinetic energy. More successful collisions can increase reaction rate.
Beyond an enzyme’s optimal temperature, however, thermal energy can disrupt the interactions maintaining its structure. The enzyme begins to unfold or change shape, so catalytic efficiency declines. Thus, enzyme activity often rises toward an optimum and then falls sharply rather than increasing indefinitely.
Worked example — a protease reaction: A protease breaks down a protein substrate. At $10^\circ\text{C}$, molecules move relatively slowly, so productive collisions are infrequent. At $37^\circ\text{C}$, collisions may occur more often and the reaction may proceed faster. At $80^\circ\text{C}$, disrupted hydrogen bonds can alter the protease’s structure; even though molecular motion is high, the damaged active site may catalyze the reaction poorly or not at all.
pH: changing charge and shape
pH measures the acidity of a solution. A pH outside an enzyme’s optimal range can alter the charges of amino-acid side chains within the protein. Those charge changes can disrupt hydrogen bonds and other attractions, changing the enzyme’s structure and the chemical interactions needed for catalysis.
A strongly acidic or basic environment does not merely make a reaction “faster” or “slower” in a vague way. It may change the enzyme molecule itself. Different enzymes therefore have different pH optima because their structures and cellular locations differ.
Denaturation may be permanent—or reversible
Denaturation is the disruption of a protein’s structure that eliminates or greatly reduces its ability to catalyze reactions. Temperature, pH, or another chemical change in the environment can cause denaturation.
Essential Knowledge 3.2.A.1.i: Denaturation of proteins, such as enzymes, occurs when the protein structure is disrupted by a change in temperature, pH, or chemical environment, eliminating the ability to catalyze reactions.
Denaturation is not automatically permanent. In some cases, when the environmental condition returns to a suitable range, the enzyme can refold and regain activity.
Essential Knowledge 3.2.A.2: In some cases, enzyme denaturation is reversible, allowing the enzyme to regain activity.
Concentrations and inhibitors also change reaction efficiency
The cellular environment includes the relative concentrations of substrates and products. If substrate concentration increases while enzyme availability remains constant, reaction rate may increase until the enzymes are operating near capacity. Accumulated product can reduce net forward progress, so substrate-to-product balance matters.
Learning Objective 3.2.B: Explain how the cellular environment affects enzyme activity.
Essential Knowledge 3.2.B.1: The relative concentrations of substrates and products determine how efficiently an enzymatic reaction proceeds.
Environmental effects can also involve inhibitors. A competitive inhibitor reversibly occupies the active site and competes with substrate. A noncompetitive inhibitor binds elsewhere, causing a conformational change that reduces enzyme function.
Misconception check
Misconception: “Cold temperatures denature enzymes.” Usually, low temperature slows molecular motion and reduces collision frequency; it does not necessarily destroy the enzyme’s structure. High temperature, extreme pH, and damaging chemical environments are more directly associated with structural disruption, although the exact response depends on the enzyme.
AP skills and retrieval check
This topic develops ENE-1.F: Explain how changes to the structure of an enzyme may affect its function, ENE-1.G: Explain how the cellular environment affects enzyme activity, and SYI-3.A: Explain the connection between variation in the number and types of molecules within cells to the ability of the organism to survive and/or reproduce in different environments. In an investigation, these skills require connecting a manipulated condition to molecular structure, reaction data, and biological consequence.
Quick check: An enzyme’s activity falls after exposure to extreme pH but returns when the enzyme is placed in its usual pH range. What does this suggest? The best interpretation is that the pH caused a reversible structural change, rather than permanent destruction of the enzyme.
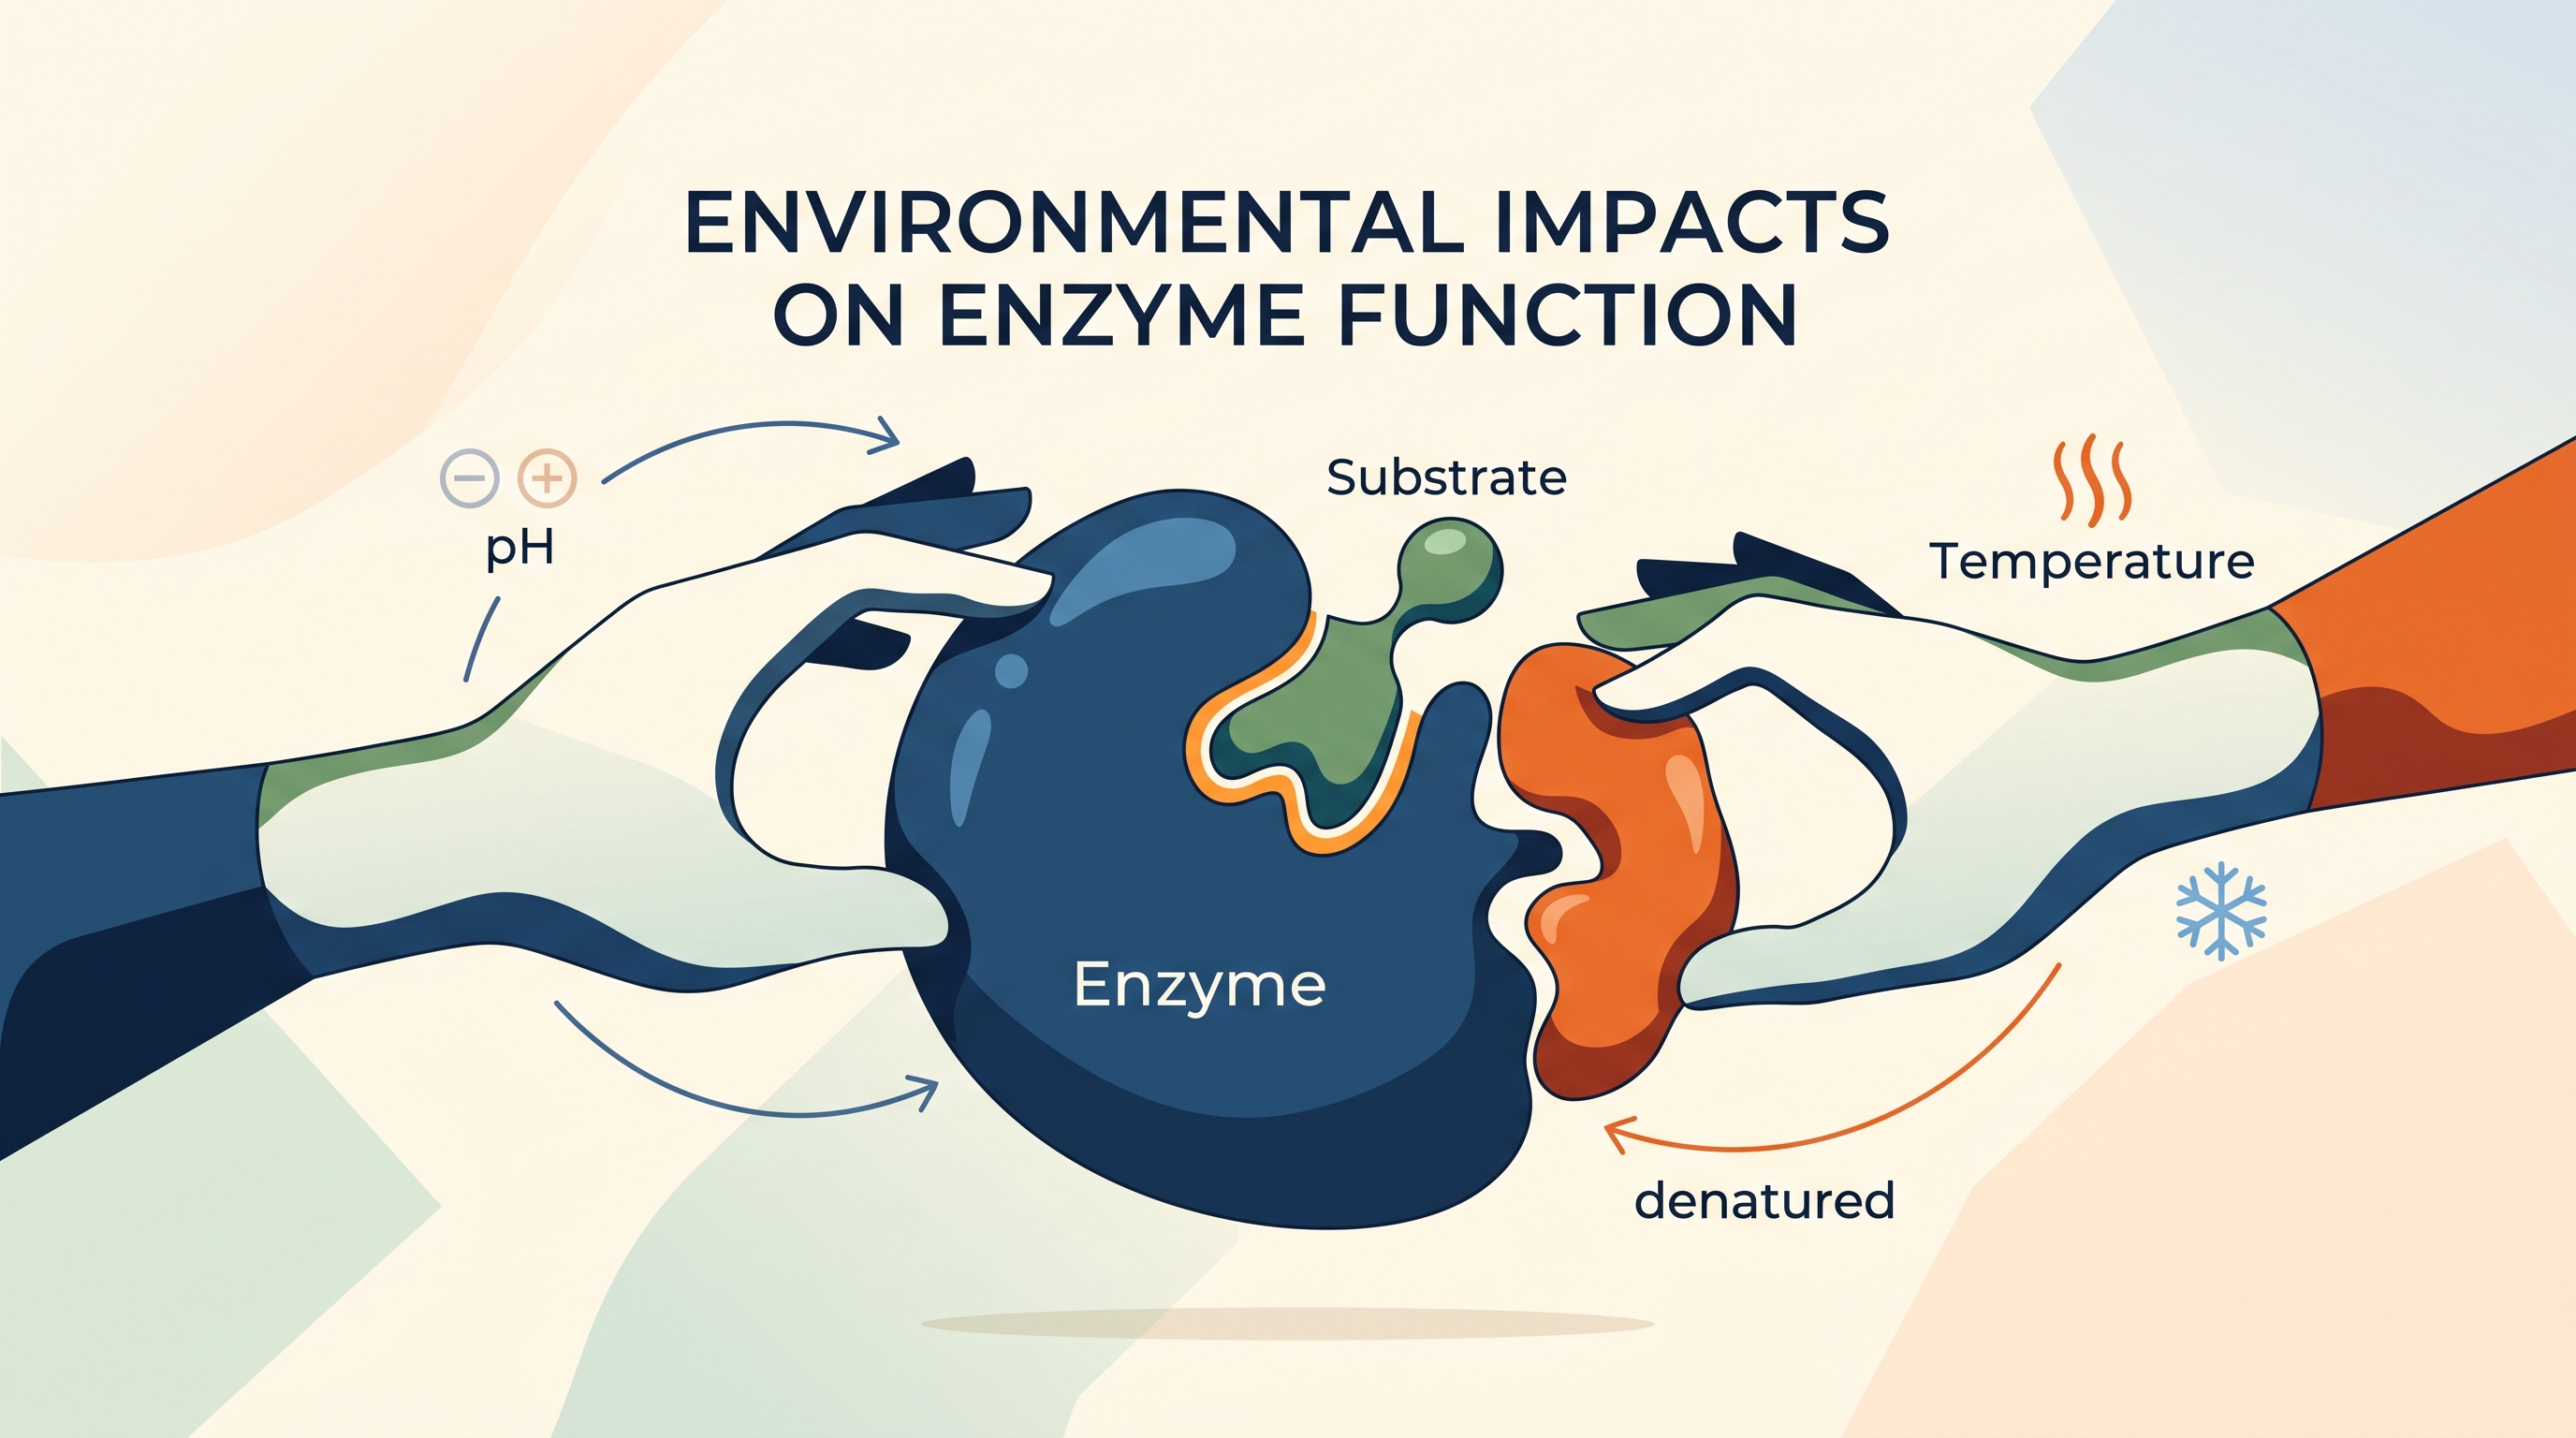
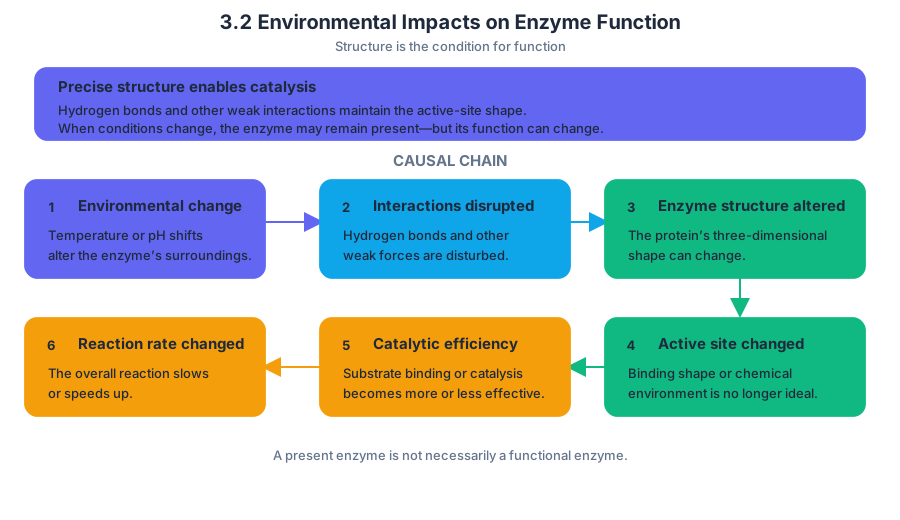
3.3 Cellular Energy
Key concepts: Cellular respiration · Glycolysis · Energy availability from respiration · Measuring respiration rate · Oxygen consumption · Carbon dioxide production · Investigation of cellular respiration · Effects of temperature on respiration · Effects of developmental stage on respiration · Energy storage as oil versus starch
Cellular respiration is the process by which cells release energy stored in glucose and other biological macromolecules so that the energy can power cellular functions.
3.3 Cellular Energy
Cellular respiration is the process by which cells release energy stored in glucose and other biological macromolecules so that the energy can power cellular functions. A cell does not “make energy” from nothing; it converts chemical energy into usable forms, especially ATP.
Investigative question: How can we determine how quickly a living organism is releasing energy?
From stored glucose to usable ATP
A useful analogy is a rechargeable payment system. Glucose contains energy, but many cellular processes cannot spend that energy directly. During respiration, the cell transfers some of glucose’s energy into ATP, a molecule whose phosphate group can be transferred to power processes such as active transport, movement, synthesis, and cell division.
The overall chemical relationship for aerobic cellular respiration can be represented as:
$$ C_6H_{12}O_6 + 6O_2 \rightarrow 6CO_2 + 6H_2O + \text{usable chemical energy in ATP and other energy carriers} $$
This equation is a summary, not a single reaction. Cellular respiration consists of linked biochemical pathways. Glycolysis is the first major pathway: it releases energy from glucose to form ATP from ADP and inorganic phosphate, produces NADH from NAD$^+$, and produces pyruvate.
CED alignment: Learning Objective ENE-1.L — Explain how cells obtain energy from biological macromolecules in order to power cellular functions.
Essential Knowledge 3.5.B.1 — Glycolysis is a biochemical pathway that releases the energy in glucose molecules to form ATP, NADH, and pyruvate.
Pyruvate is transported from the cytosol into the mitochondrion, where further oxidation releases electrons during the Krebs cycle. The detailed memorization of every step in glycolysis and the Krebs cycle, and every structure involved, is beyond the required scope. The important reasoning pattern is the movement of energy and electrons from a biological macromolecule into ATP and electron carriers.
Respiration rate: measure what enters or leaves
Because respiration uses oxygen and produces carbon dioxide, its rate can be estimated without measuring every intracellular reaction. Respiration rate means the amount of respiration occurring per unit time. Investigators commonly measure either oxygen consumption or carbon dioxide production.
| Measurement | What it indicates | Typical interpretation |
|---|---|---|
| Oxygen consumption | The rate at which $O_2$ leaves the surrounding air or solution | Faster decrease in $O_2$ per unit time indicates a higher respiration rate |
| Carbon dioxide production | The rate at which $CO_2$ enters the surrounding air or solution | Faster increase in $CO_2$ per unit time indicates a higher respiration rate |
The critical comparison is not simply the final amount of gas. It is the change in gas amount divided by elapsed time:
$$\text{respiration rate}=\frac{\Delta O_2\text{ consumed}}{\Delta t}$$
or
$$\text{respiration rate}=\frac{\Delta CO_2\text{ produced}}{\Delta t}$$
For example, suppose germinating seeds consume $18\ \text{mL}$ of $O_2$ in $30\ \text{min}$, while a second group consumes $30\ \text{mL}$ in the same time. Their rates are:
$$\frac{18\ \text{mL}}{30\ \text{min}}=0.60\ \text{mL},\text{min}^{-1}$$
and
$$\frac{30\ \text{mL}}{30\ \text{min}}=1.00\ \text{mL},\text{min}^{-1}$$
The second group has the greater respiration rate. On a graph, Science Practice 4.A: Construct a graph, plot, or chart requires time on the independent-variable axis and gas amount on the dependent-variable axis. The slope represents the rate; a steeper oxygen-decrease or carbon-dioxide-increase trend indicates faster respiration.
Investigation 6: comparing living seeds
Investigation 6: Cellular Respiration asks, “What factors affect the rate of cellular respiration in multicellular organisms?” Temperature is one environmental factor that can be investigated. A valid design could compare groups of seeds at several temperatures while keeping seed number, developmental stage, measurement time, and apparatus constant.
Developmental stage also matters. Newly germinating seeds may have different energy demands from seeds that have been germinating for several days. Seeds can also store energy in different forms: Wisconsin Fast Plants are an example of oil-storing seeds, whereas grass seeds are an example of starch-storing seeds. These differences can lead to testable predictions about respiration rate, but the data—not the prediction alone—must support the conclusion.
A strong claim might state: “Seeds at temperature $T_2$ respired faster than seeds at temperature $T_1$.” To support it under Science Practice 6.B: Support a claim with evidence from biological principles, concepts, processes, and/or data, the response must identify the measured difference and connect it to the biological principle that respiration releases energy for cellular work. A claim without numerical or graphical evidence is incomplete.
Common misconception — “More oxygen means more respiration.”
Respiration rate is not the total oxygen present. It is the rate of oxygen consumption. A container can begin with more $O_2$ yet show a slower respiration rate if its oxygen decreases only slightly over the same interval.
Common misconception — “Plants only respire in the dark.”
Living plant cells respire whenever they require energy. Light affects photosynthesis, but respiration is the energy-releasing process being measured here.
Retrieval check
A respirometer records oxygen consumption of $12\ \text{mL}$ in $20\ \text{min}$ for one seed group and $15\ \text{mL}$ in $30\ \text{min}$ for another. Which group respired faster, and what evidence supports your answer?
The first group: its rate is $12/20=0.60\ \text{mL},\text{min}^{-1}$, whereas the second is $15/30=0.50\ \text{mL},\text{min}^{-1}$. The correct comparison uses the slope, not the total oxygen consumed.
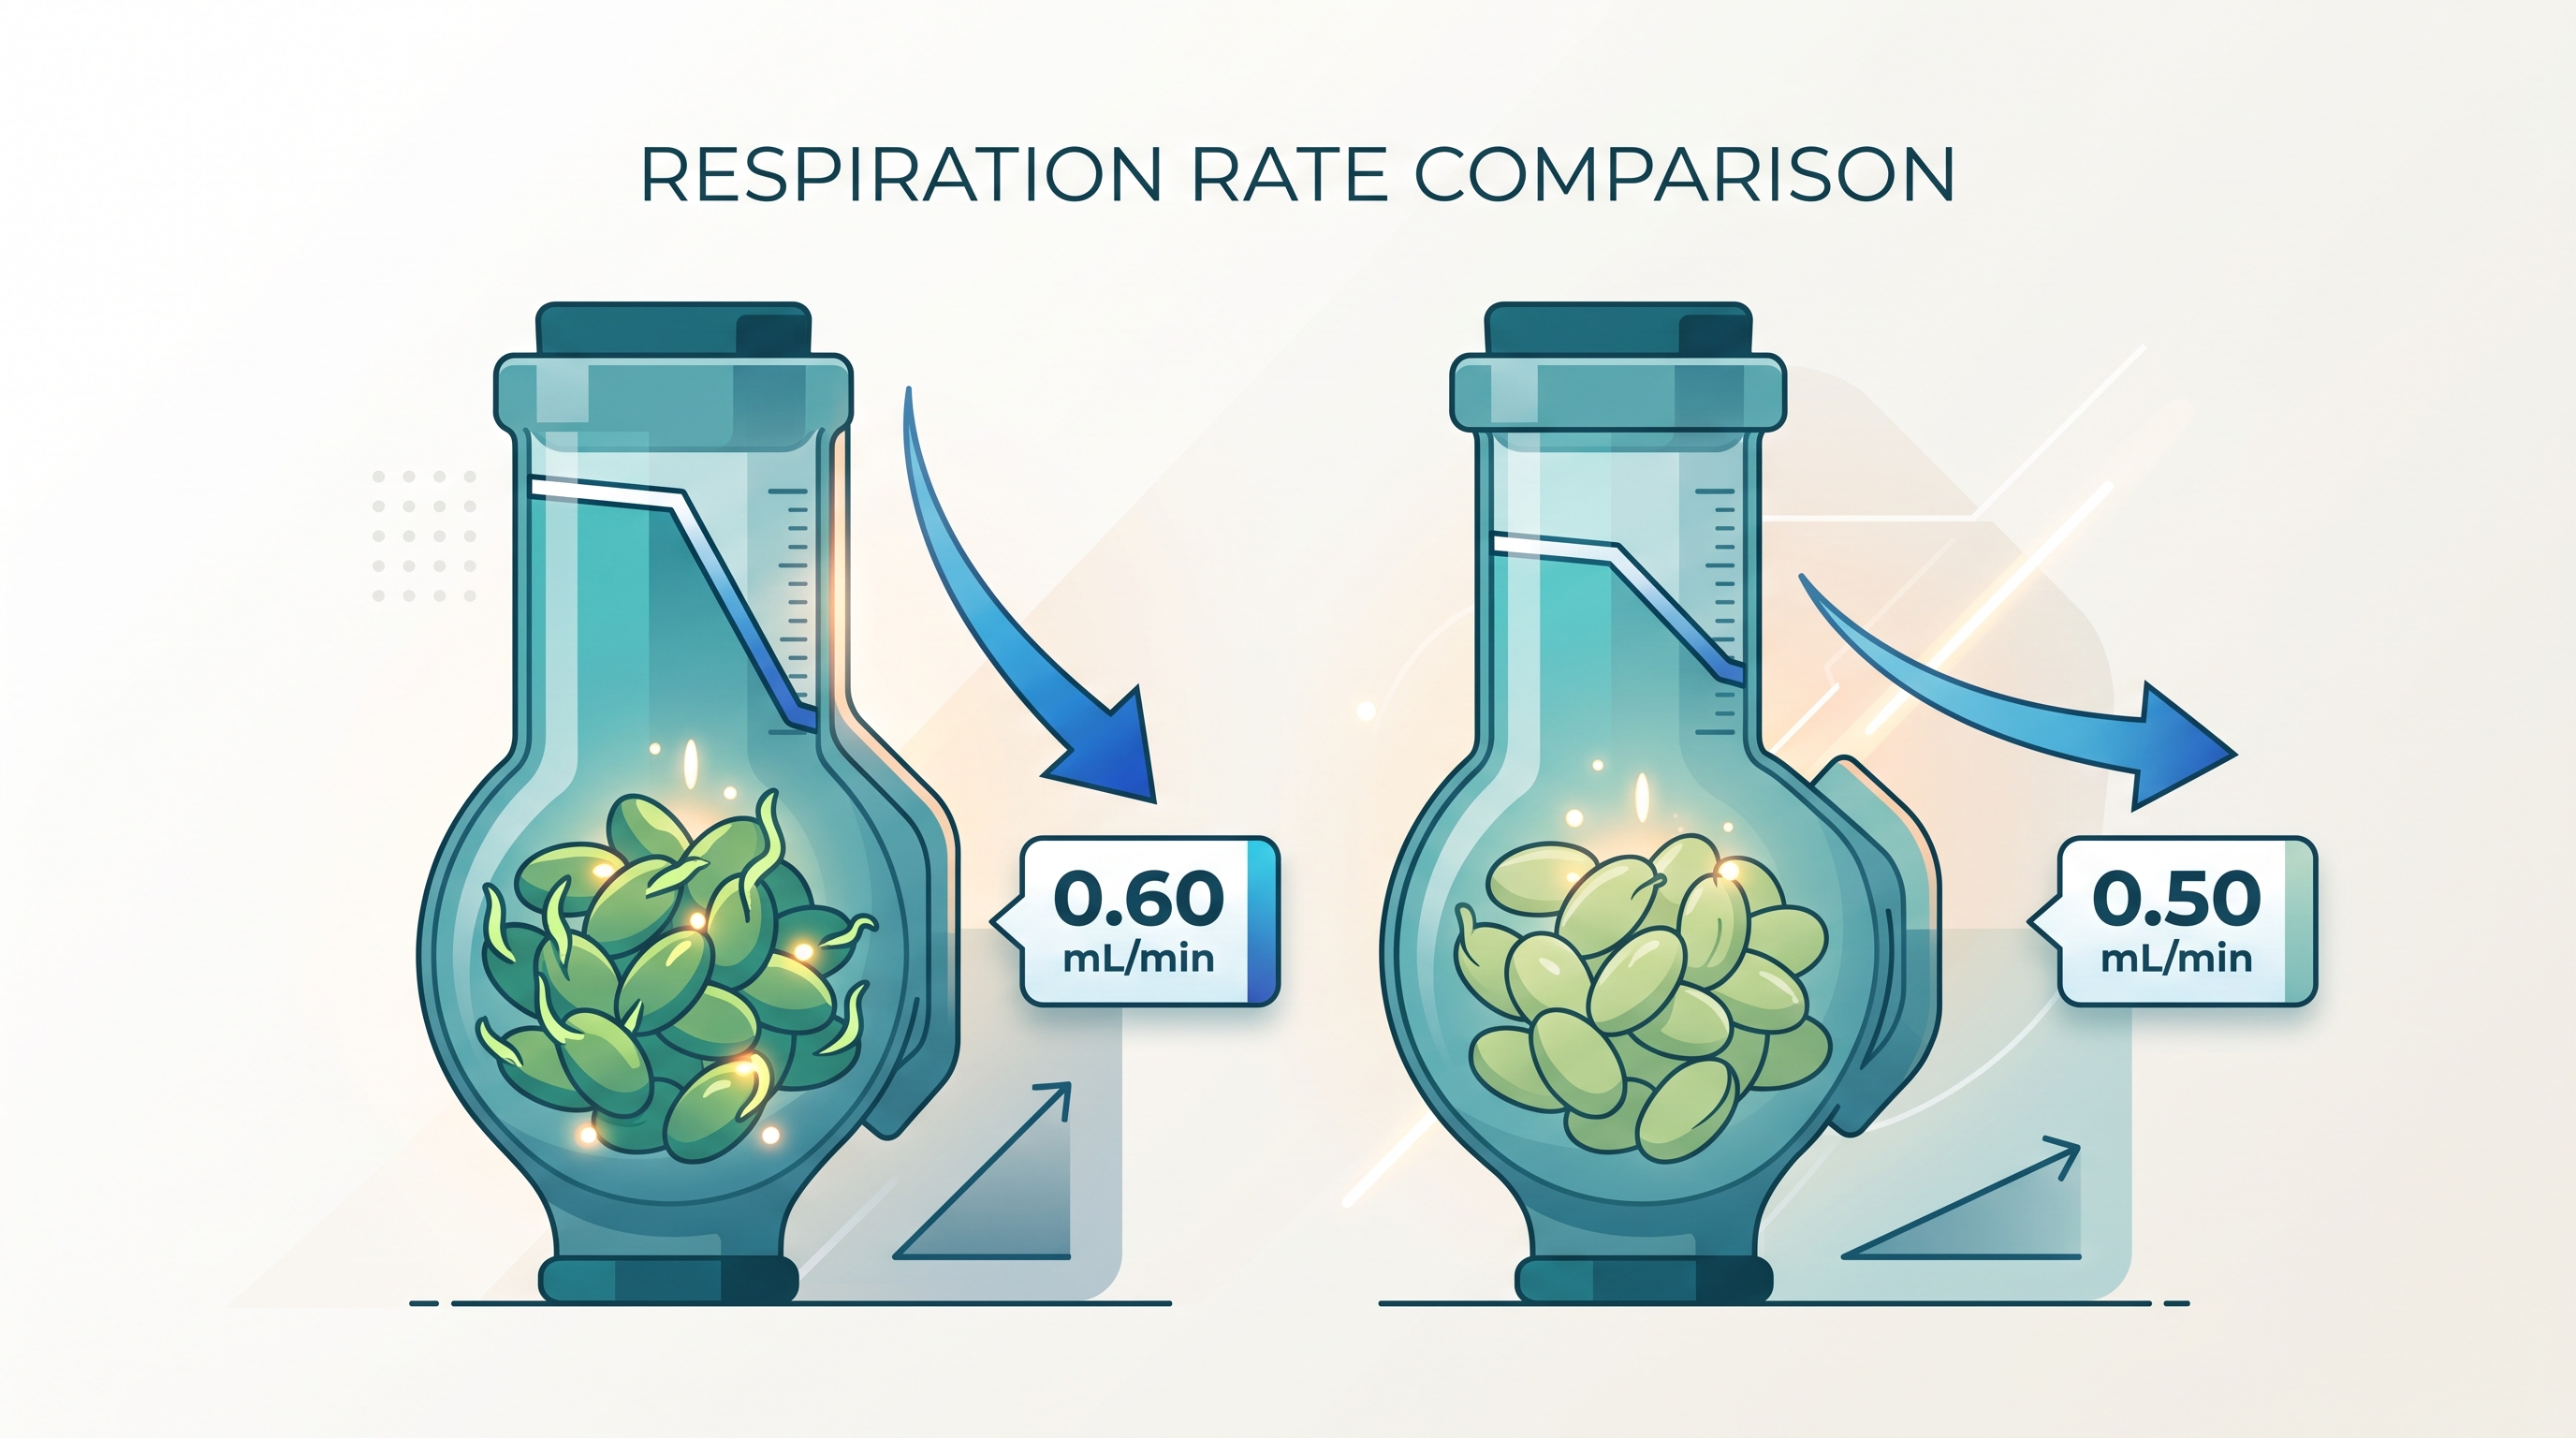
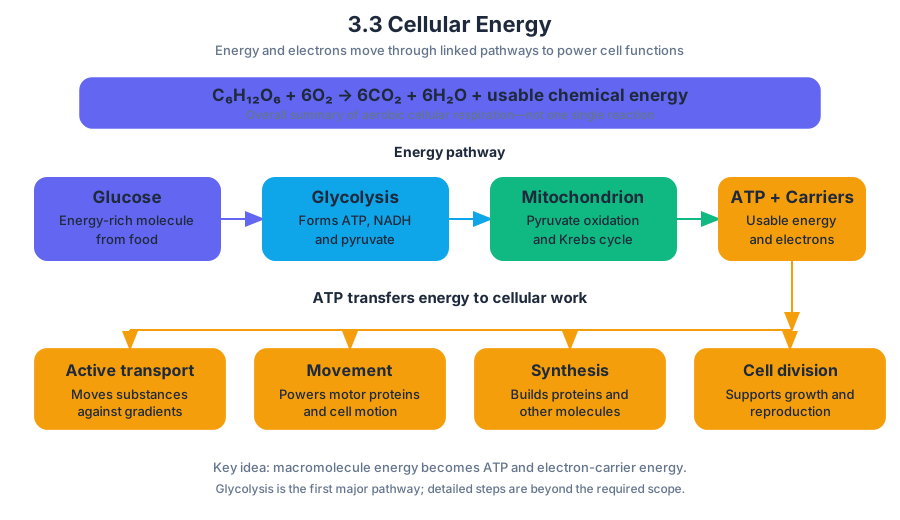
3.4 Photosynthesis
Key concepts: Photosynthesis rate measurement using the floating leaf-disk technique · Experimental design for investigating factors that affect photosynthesis · Light-intensity response curves · Comparing sun-grown and shade-grown leaves · Photosynthetically active radiation (PAR) as a light measurement · ET50 as a photosynthesis-response metric · Using inverse ET50 (1/ET50) to represent photosynthesis rate · Calculating photosynthesis rates and ratios · Calculating water potential · Graphing data and interpreting error bars
A leaf can reveal its photosynthetic rate without producing a visible bubble: remove air from a leaf disk, place it in an illuminated bicarbonate solution, and watch oxygen gradually make the disk rise.
3.4 Photosynthesis
A leaf can reveal its photosynthetic rate without producing a visible bubble: remove air from a leaf disk, place it in an illuminated bicarbonate solution, and watch oxygen gradually make the disk rise. The floating leaf-disk technique converts an invisible molecular process into a measurable time course.
Investigative question: What factors affect the rate of photosynthesis in living plants?
Measuring photosynthetic activity with floating disks
The net rate of photosynthesis can be estimated from either oxygen production or carbon dioxide consumption. In the disk procedure, a vacuum removes air from the spaces inside leaf tissue, causing the disks to sink. As photosynthesis produces oxygen, oxygen accumulates in those spaces; the disks become buoyant and rise.
A bicarbonate solution supplies dissolved carbon dioxide while the light provides the energy source. Because respiration continues during the experiment, the observed change represents net photosynthetic activity: oxygen produced by photosynthesis minus oxygen consumed by cellular respiration.
One common metric is $ET_{50}$, the time required for $50%$ of the disks to float. A lower $ET_{50}$ means that the disks reached the halfway point sooner, so the photosynthetic rate was higher. Because time and rate have an inverse relationship, plotting raw $ET_{50}$ values can produce a visually misleading negative slope.
Rate transformation: Use $\frac{1}{ET_{50}}$ when you want the vertical axis to increase as photosynthetic rate increases.
Designing the investigation
After mastering the technique, investigators select a factor that may affect photosynthesis. Light intensity is a natural independent variable: keep leaf type, disk size, bicarbonate concentration, temperature, solution volume, and exposure time constant while changing the light reaching the disks. The dependent variable may be $ET_{50}$, $\frac{1}{ET_{50}}$, the fraction of disks floating at each time, or a calculated rate.
A strong design includes repeated disks for each treatment, randomization when practical, and a control condition. “Light intensity” must also be operationally defined: it may be measured as photosynthetically active radiation (PAR) in micromoles per square meter per second, written $\mu\text{mol m}^{-2}\text{s}^{-1}$, or as light intensity in foot-candles. A PAR meter measures photons in the wavelengths used by photosynthesis, making it more biologically meaningful than simply recording the distance from a lamp.
Temperature can become an unintended confounding variable because a lamp may heat samples as its distance changes. If temperature is the factor being tested, light intensity must be controlled; if light intensity is being tested, temperature should be monitored and held as constant as possible.
Light-response curves
A light-response curve displays how photosynthetic activity changes as PAR increases. At low light levels, increasing PAR generally increases photosynthetic rate because more photons are available. At higher levels, the curve may approach a plateau when another factor—such as carbon dioxide availability, enzyme capacity, or temperature—limits the process.
For a graph, place PAR or another light-intensity measurement on the horizontal axis and photosynthetic rate on the vertical axis. Label every axis with the variable and unit, plot means rather than unexplained individual values when appropriate, and include error bars such as $\pm 2$ standard errors when the design supports them.
Suppose disks exposed to $100$, $200$, and $400\ \mu\text{mol m}^{-2}\text{s}^{-1}$ produce mean values of $\frac{1}{ET_{50}$} equal to $0.010$, $0.018$, and $0.021\ \text{s}^{-1}$. The increase from $100$ to $200$ is substantial, but the small increase from $200$ to $400$ suggests that the response is nearing a plateau. The correct conclusion is not that light “stops working,” but that another constraint has become important.
Sun-grown versus shade-grown leaves
A second variable can be leaf history. Compare light-response curves for sun-grown and shade-grown leaves while testing the same PAR levels. The curves may differ in their low-light performance, the light level at which they begin to saturate, or their maximum measured rate because the leaves developed under different light environments.
The comparison is meaningful only if leaf disks are similar in species, developmental condition, area, and treatment history. A sun-versus-shade claim requires evidence from the curves, not merely the observation that one group floated first at a single light level.
Quantitative reasoning and misconceptions
The investigation requires calculating rates and ratios from collected data. For example, a treatment ratio can be written as $\frac{\text{rate}{\text{sun}}}{\text{rate}{\text{shade}}}$. If water movement is also examined, calculate water potential using $\Psi=\Psi_s+\Psi_p$, where $\Psi$ is water potential, $\Psi_s$ is solute potential, and $\Psi_p$ is pressure potential. For a solution, solute potential may be calculated with $\Psi_s=-iCRT$.
Misconception check: A disk that rises fastest does not necessarily have the greatest gross photosynthesis. The measurement reflects net oxygen accumulation, which is affected by both photosynthesis and respiration.
Another misconception is that a steeper line at every light level must continue indefinitely. Biological response curves often flatten because limiting factors change. Error bars also matter: differences between means should be interpreted cautiously when variation is large or treatment intervals overlap substantially.
AP skills and reasoning processes
This investigation directly develops the six AP Biology science practices:
- Science Practice 1: Concept Explanation — connect oxygen accumulation and disk buoyancy to photosynthetic activity.
- Science Practice 2: Visual Representations — construct and interpret light-response curves.
- Science Practice 3: Questions and Methods — identify variables, controls, replication, and operational definitions.
- Science Practice 4: Representing and Describing Data — calculate rates and ratios and label graphs correctly.
- Science Practice 5: Statistical Tests and Data Analysis — use means, standard error, and error bars to evaluate variation.
- Science Practice 6: Argumentation — support a conclusion about limiting factors with data from the experiment.
Retrieval check: If treatment A has $ET_{50}=240\ \text{s}$ and treatment B has $ET_{50}=120\ \text{s}$, which treatment has the greater estimated photosynthetic rate, and what happens to the comparison when you graph $\frac{1}{ET_{50}}$ instead of $ET_{50}$? Explain using the inverse relationship between time and rate.
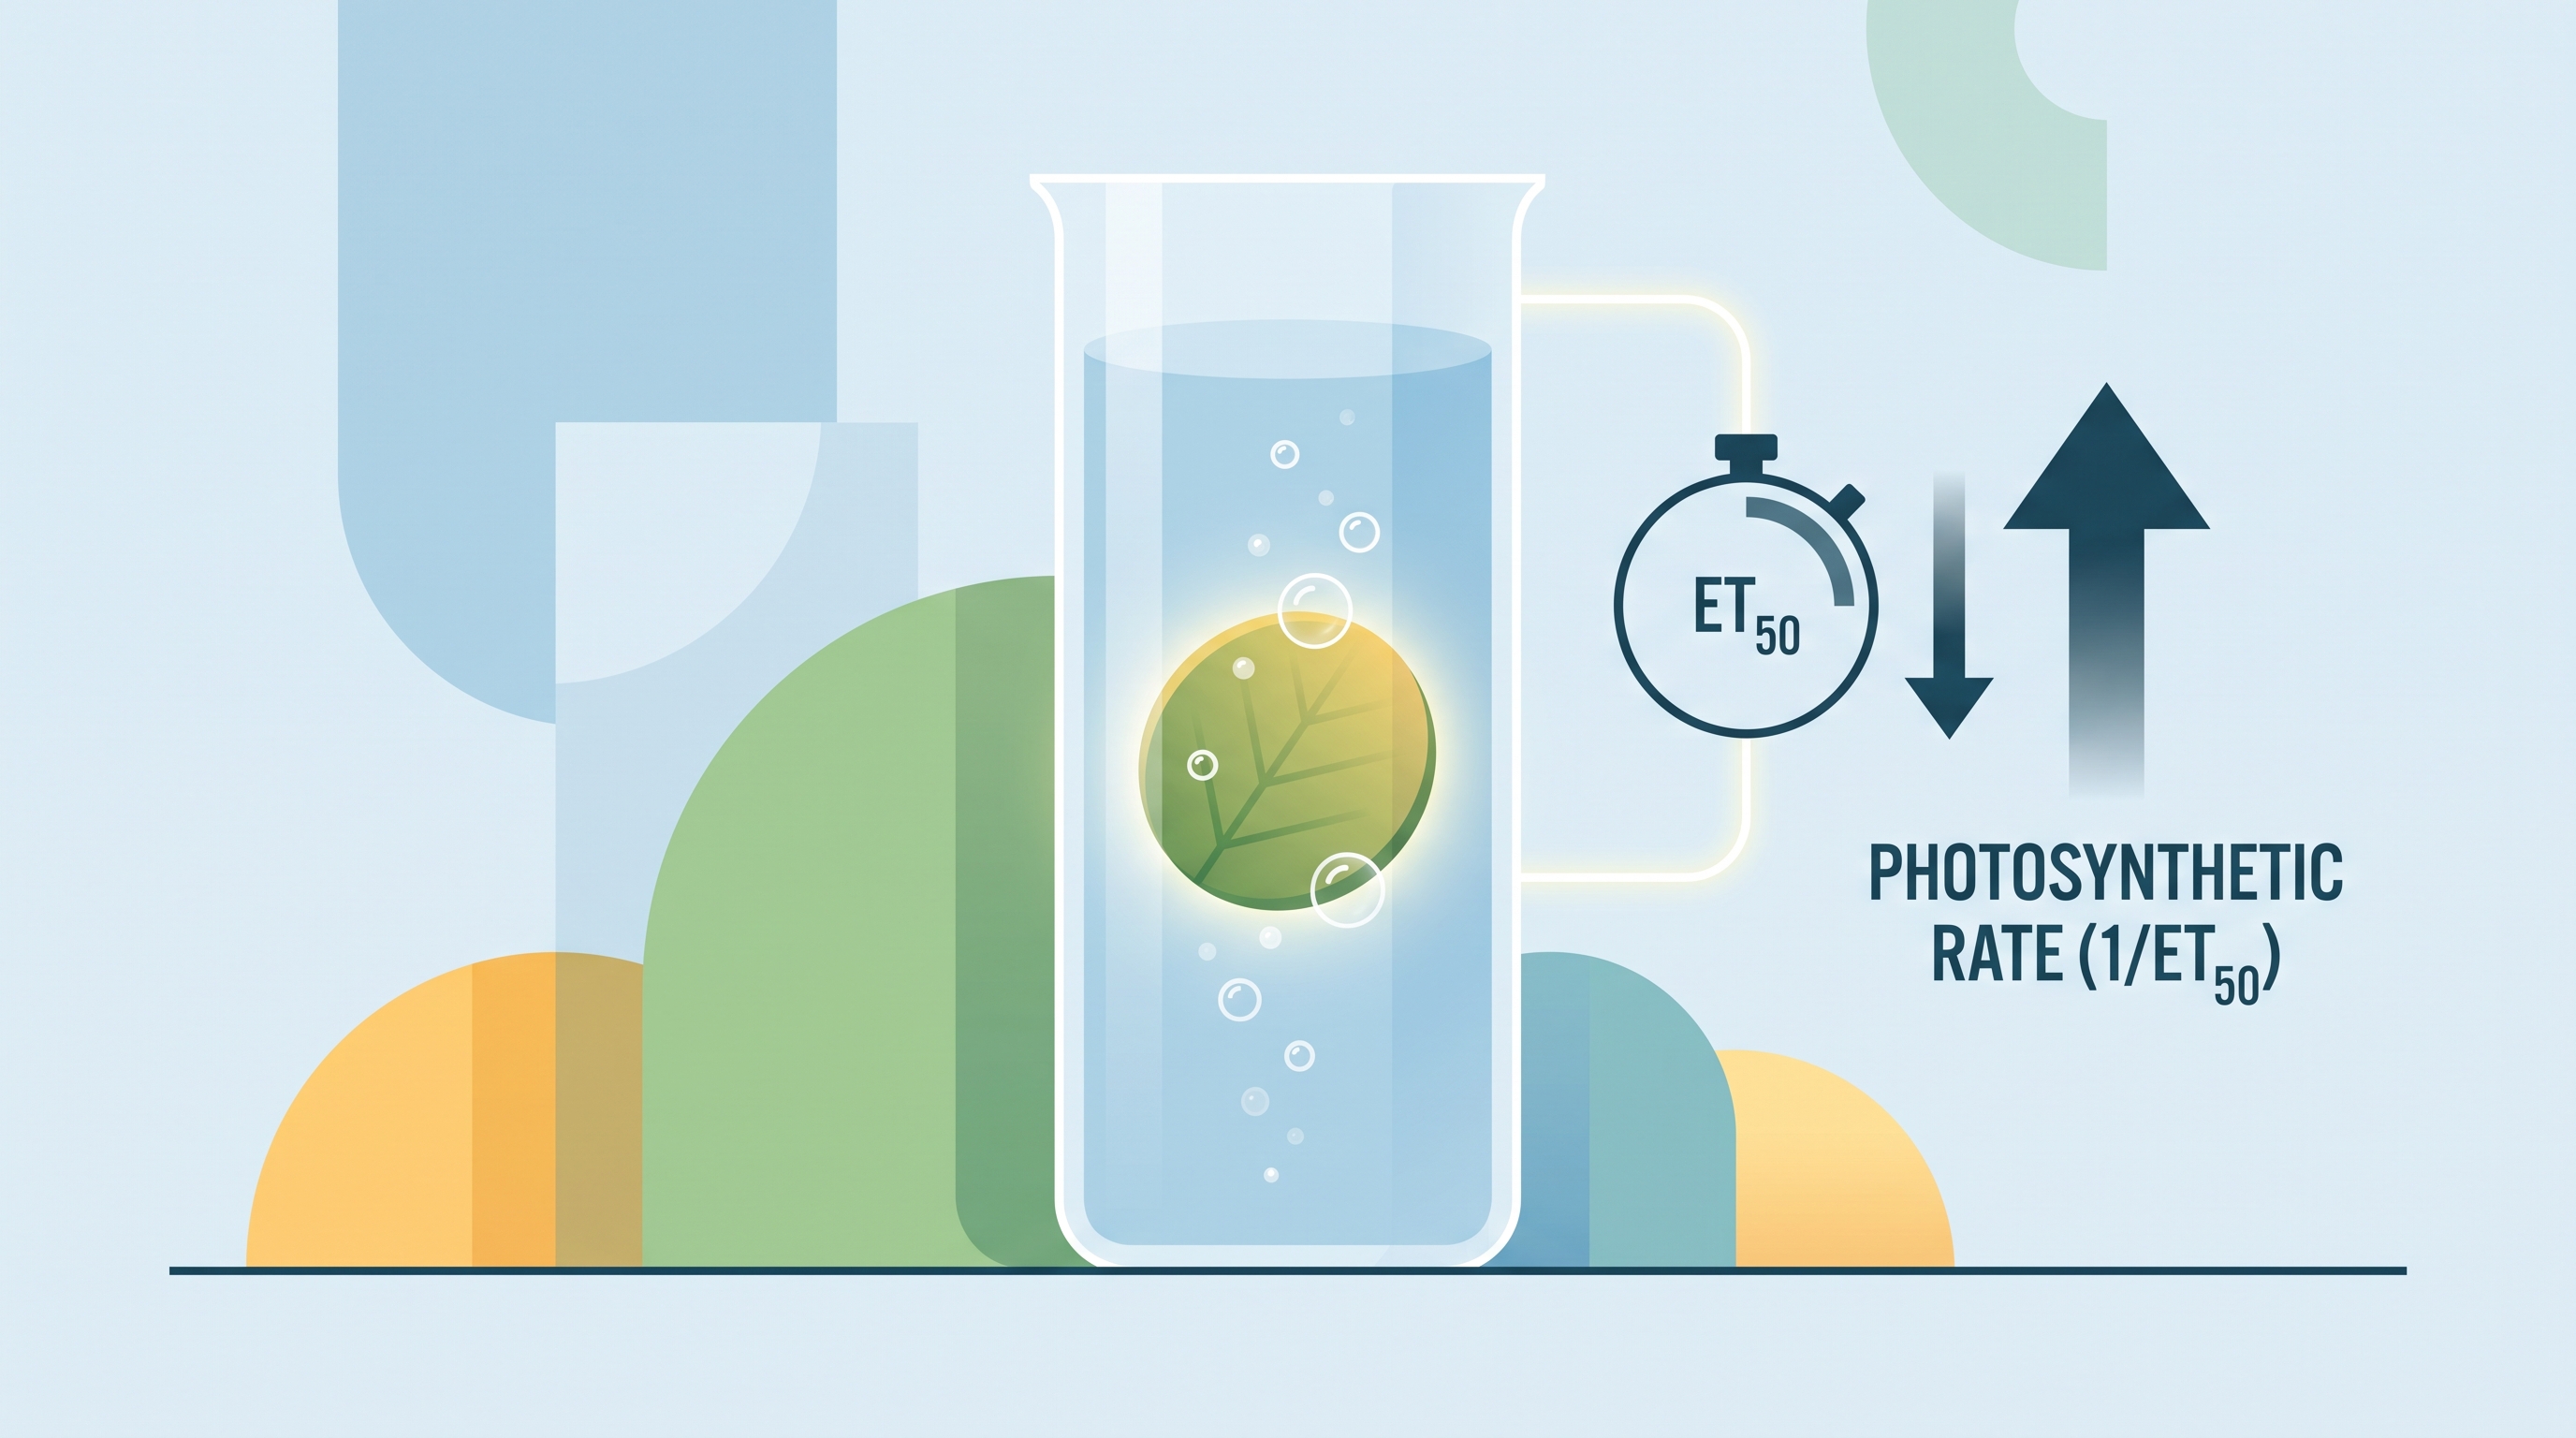
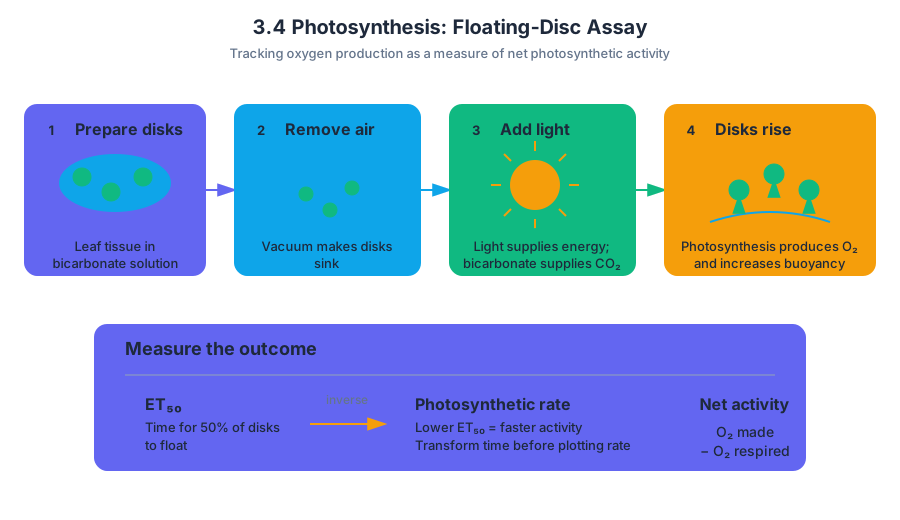
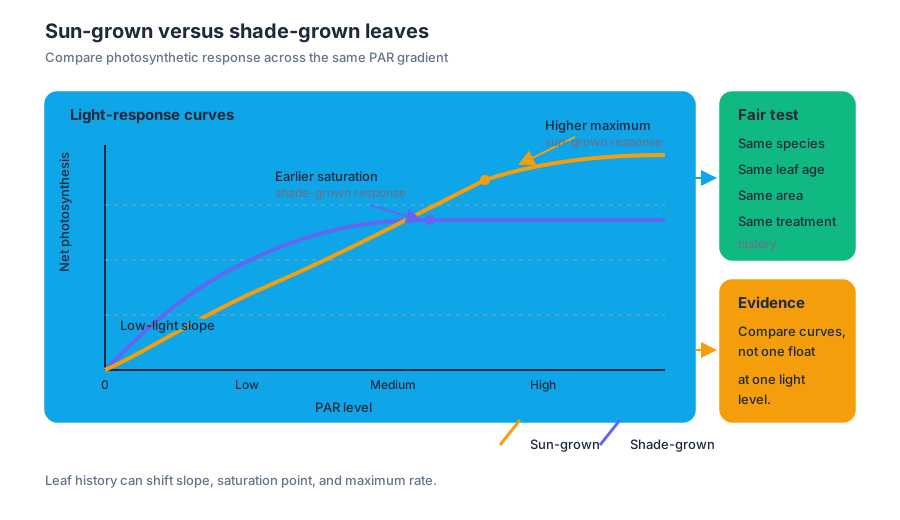
3.5 Cellular Respiration
Key concepts: Cellular respiration as the oxidation of glucose to release energy · Consumption of oxygen and production of carbon dioxide during respiration · Measuring the rate of cellular respiration · Respirometers and changes in gas volume · Use of potassium hydroxide to remove carbon dioxide · Factors affecting respiration rates in multicellular organisms · Respiration in plant cells and mitochondria · Relationship between cellular respiration and photosynthesis · Effects of seed type and stored energy source on respiration · Constructing data tables, graphs, and communicating results
Cellular respiration is the controlled oxidation of glucose that transfers chemical energy into forms cells can use. Its overall reaction is:
3.5 Cellular Respiration
Cellular respiration is the controlled oxidation of glucose that transfers chemical energy into forms cells can use. Its overall reaction is:
$$ C_6H_{12}O_6 + 6O_2(g) \rightarrow 6CO_2(g) + 6H_2O + \text{energy} $$
The equation gives two powerful measurement clues: oxygen is consumed, and carbon dioxide is produced. For each molecule of glucose oxidized, $6$ molecules of $O_2$ are consumed and $6$ molecules of $CO_2$ are produced—so, for glucose oxidation, one molecule of oxygen is consumed for every molecule of carbon dioxide produced.
Measuring respiration as a gas exchange
A respiration rate is the amount of cellular respiration occurring per unit time. Investigators can estimate it by measuring the consumption of $O_2$, the production of $CO_2$, or the release of heat. In practice, measuring gas exchange is often more direct than measuring heat.
A respirometer is a device that detects changes in gas volume or pressure. Germinating seeds are especially useful experimental organisms because they are alive, actively growing, and require substantial energy for development.
In a closed respirometer, seeds consume $O_2$. If the produced $CO_2$ remains in the chamber, the total number of gas molecules may not change enough to reveal oxygen consumption. The investigator therefore adds potassium hydroxide, $KOH$, which removes carbon dioxide from the gas space:
$$ CO_2 + 2KOH \rightarrow K_2CO_3 + H_2O $$
Once $CO_2$ is chemically removed, oxygen consumption causes the overall gas volume to decrease. A drop in gas volume or pressure over time therefore indicates respiration. The rate can be represented conceptually as:
$$\text{respiration rate} \propto \frac{\text{decrease in }O_2\text{ volume}}{\text{time}}$$
Because temperature and atmospheric pressure also affect gas volume, a strong investigation includes a control respirometer—often containing glass beads or another nonliving material of equal volume. The control reveals gas changes caused by the environment rather than by seed respiration.
Worked example: interpreting a respirometer
A student places germinating seeds in one respirometer and equal-volume glass beads in a second. Both are kept at the same temperature; $KOH$ is present in both chambers. After the same time interval, the seed respirometer shows a greater decrease in gas volume.
The reasoning is:
- $KOH$ removes $CO_2$ in both chambers.
- The glass beads do not respire, so their chamber provides a baseline.
- The additional volume decrease in the seed chamber is attributable to biological $O_2$ consumption.
- A larger decrease per unit time means a higher cellular respiration rate.
If the experiment compares temperatures, seed types, or oxygen availability, only the selected independent variable should change. Replicate respirometers, identical seed masses, equal chamber volumes, and repeated measurements make the conclusion more reliable.
Respiration in plants and stored fuels
Most plant cells contain mitochondria and carry out cellular respiration. Plants do not perform photosynthesis instead of respiration; they use photosynthesis to build carbon compounds and use cellular respiration to release energy from those compounds.
Germinating seeds make this relationship visible. Before a seed develops leaves, it relies on stored molecules for energy. Fast Plant seeds store energy primarily as oil, whereas small grass seeds store energy as starch. During germination, enzymes break these reserves into molecules that can enter respiratory pathways.
A student investigation might compare respiration rates in germinating Fast Plant seeds and grass seeds by measuring the change in respirometer volume over equal time intervals. The key comparison is not simply which seed is larger; it is the rate normalized to a consistent quantity, such as seed mass or number of seeds.
Variables that affect respiration
Students can investigate how temperature, seed maturity, seed type, quantity of stored fuel, or another justified variable affects respiration in multicellular organisms. A prediction must connect the variable to a mechanism—for example, a temperature change may alter enzyme activity, while a different seed type may provide a different accessible energy reserve.
The investigation also connects respiration with photosynthesis. Photosynthesis stores energy in carbon compounds; cellular respiration releases usable energy from those compounds. In a plant, the two processes together help explain how carbon is both built into organic molecules and later transferred into cellular work.
Misconception check: “Plants only photosynthesize, while animals respire.”
Correction: Plant cells with mitochondria carry out cellular respiration, including cells that also photosynthesize. Photosynthesis and respiration have linked reactants and products, but they are not the same process.
AP Biology reasoning in this investigation
This topic most directly develops Science Practice 1: Concept Explanation, by explaining how glucose oxidation, oxygen consumption, and carbon dioxide production are connected; Science Practice 2: Visual Representations, by interpreting the reaction and respirometer diagram; Science Practice 3: Questions and Methods, by identifying variables, controls, and replication; Science Practice 4: Representing and Describing Data, by graphing gas-volume change over time; Science Practice 5: Statistical Tests and Data Analysis, by comparing replicated rates and variation; and Science Practice 6: Argumentation, by using respirometer evidence to support a claim about respiration.
Retrieval check: If $KOH$ were omitted from a respirometer containing germinating seeds, why might the measured decrease in gas volume be smaller or less clear? Identify the gas that would accumulate and explain how removing it improves the measurement.
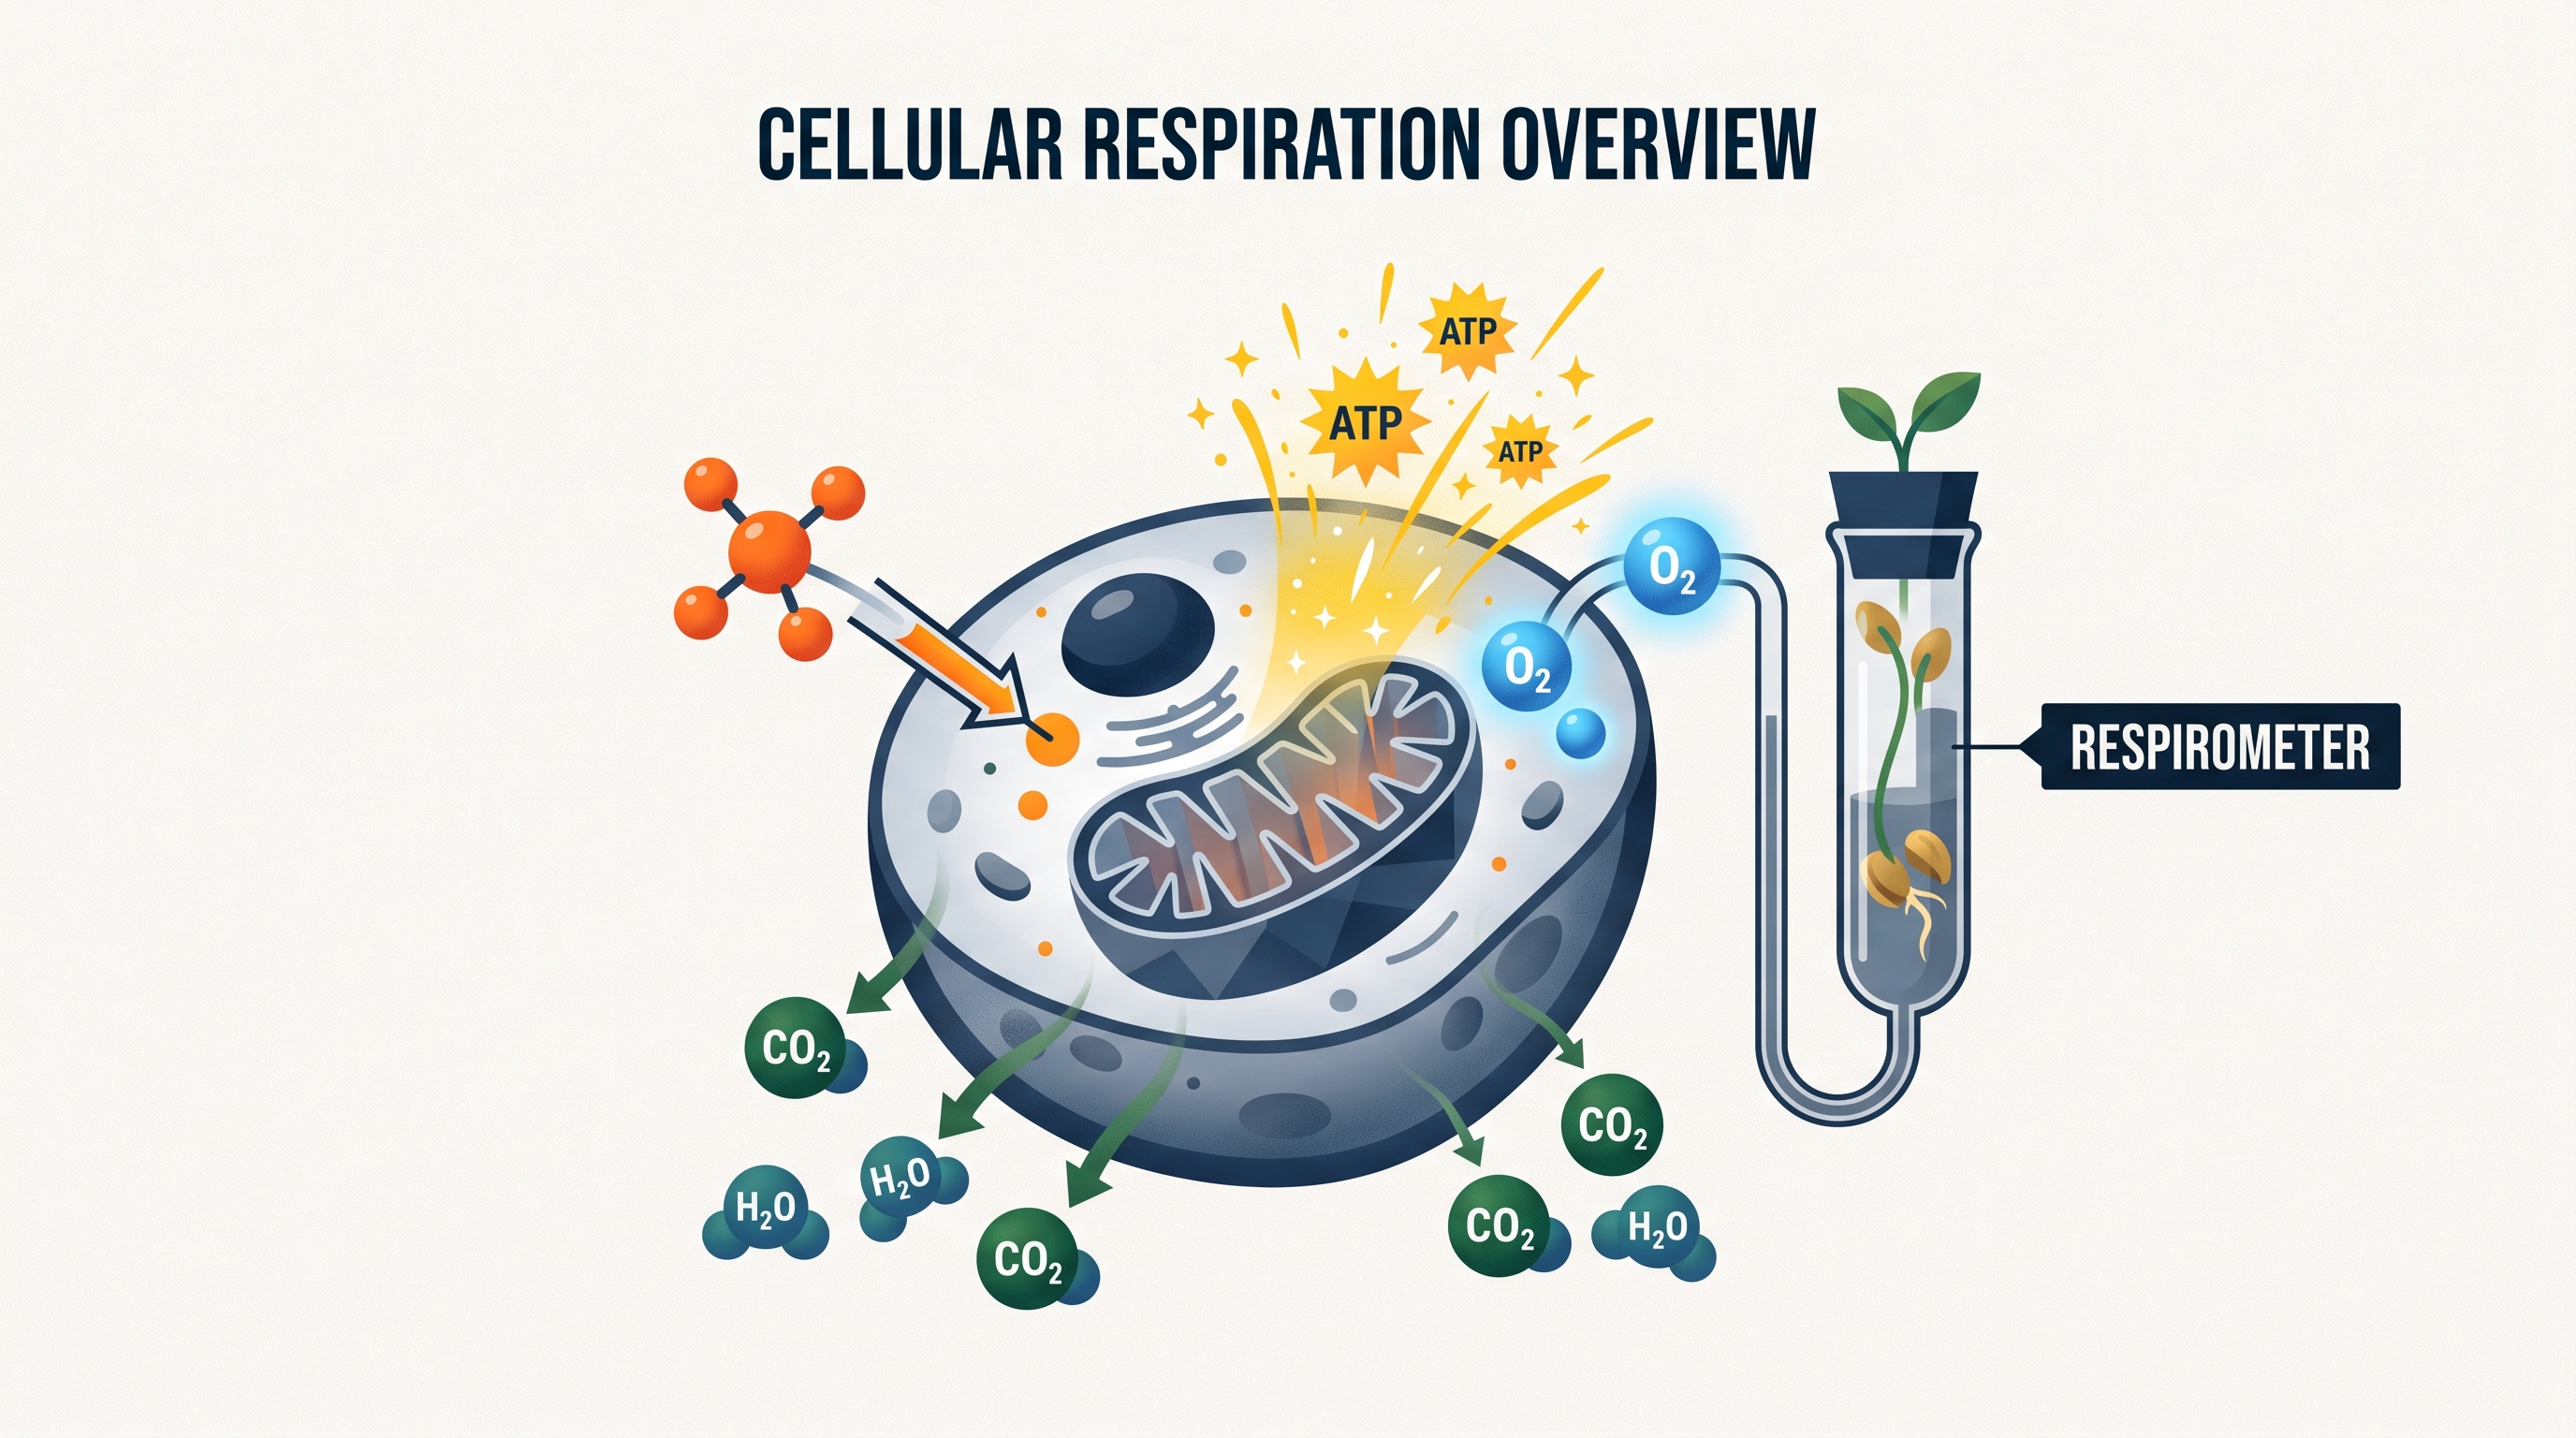
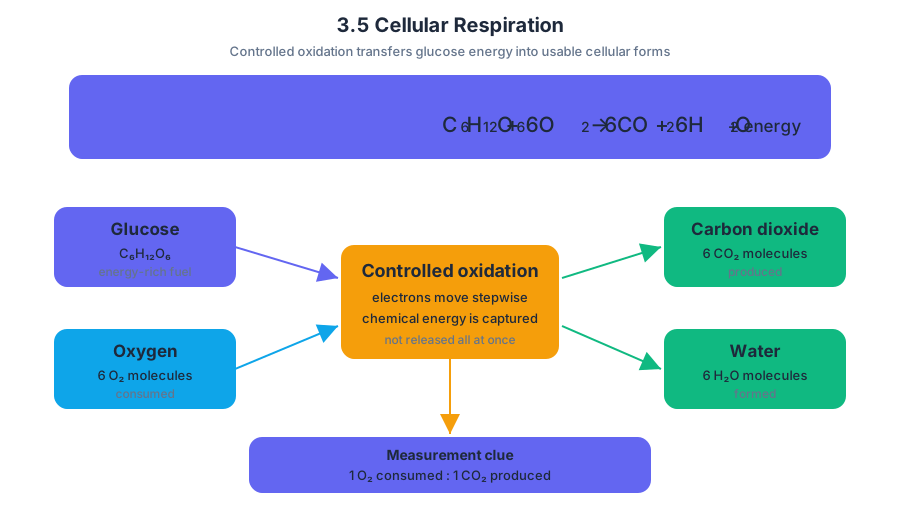
4.1 Cell Communication
Key concepts: Cell communication · Signal transduction · Gene expression · Scientific inquiry · Communicating experimental results · Written, verbal, and graphic communication · Relationship among hypotheses, procedures, and results · Laboratory investigations · Scientific practices · AP Biology curriculum connections
A cell communicates by detecting information and converting it into a response; in one important case, signal transduction—the conversion of an external signal into an intracellular chain of events—can stimulate gene expression, changing which proteins the cell produces.
4.1 Cell Communication
A cell communicates by detecting information and converting it into a response; in one important case, signal transduction—the conversion of an external signal into an intracellular chain of events—can stimulate gene expression, changing which proteins the cell produces.
A useful analogy is a building’s emergency alarm. The alarm signal is detected by a receiver, the receiver activates an internal relay system, and the relay produces an appropriate response. In a cell, the signal may begin outside the cell, but the response can occur inside the nucleus when signal transduction activates or represses genes.
From signal to cellular response
The central relationship is:
$$ \text{signal} \rightarrow \text{cellular detection} \rightarrow \text{signal transduction} \rightarrow \text{cellular response} $$
The response may be rapid, such as changing the activity of a protein that already exists, or slower but longer-lasting, such as stimulating gene expression. When gene expression changes, the cell may produce a new protein, alter its behavior, divide, move, or modify its metabolism.
For example, suppose a chemical signal causes a cell to produce an enzyme that was previously absent or present only in small amounts. The signal does not become the enzyme. Instead, the signal initiates a transduction pathway that ultimately affects gene expression; the resulting protein then carries out the response.
Worked interpretation
A researcher observes that cells exposed to a signal contain more of a particular messenger RNA than untreated cells. A careful explanation connects the observations in sequence:
- The treated cells received the signal.
- The signal activated a signal-transduction pathway.
- The pathway increased expression of the relevant gene.
- Increased transcription produced more messenger RNA.
- The increase in messenger RNA supports, but does not by itself prove, an increase in the final protein or cellular function.
The last distinction matters. Gene expression is not identical to protein production or biological effect. A change in messenger RNA can be evidence of altered transcription, while additional measurements would be needed to determine whether translation and protein activity also changed.
Key insight: A signal can change cell behavior without entering the cell, because information can be transmitted through a molecular pathway.
Scientific inquiry is a communication process
Scientific inquiry begins with a question and develops through a hypothesis, a testable explanation or prediction. The hypothesis determines what procedures are appropriate, while the procedures determine what results can legitimately support the conclusion.
Students should repeatedly examine the relationship among their hypothesis, procedures, and results. If a hypothesis predicts that a signal will increase gene expression, the investigation must include a measurable indicator of gene expression, an untreated comparison, and procedures that distinguish the signal’s effect from unrelated variables.
During an informal small-group or class discussion, investigators can identify possible errors, propose changes in methodology, and consider alternative explanations. For instance, if treated cells show greater gene expression, the result might reflect the signal itself—or a difference in cell number, exposure time, temperature, or measurement technique.
Communicating experimental results
Experimental results must be communicated to peers to have value. Communication allows other scientists to inspect the evidence, evaluate the reasoning, identify limitations, and decide whether further investigation is justified. A private result cannot effectively contribute to shared scientific knowledge.
Scientific communication may be written, verbal, or graphic:
| Form | Best use |
|---|---|
| Written report | Explain the question, hypothesis, procedures, results, errors, and conclusion in a permanent record |
| Verbal presentation | Describe findings and respond to questions from peers |
| Graphic communication | Reveal patterns through tables, diagrams, or graphs |
A graph is not decoration. Its axes, units, labels, scale, and caption should make the evidence understandable without guessing. If signal concentration is the independent variable, it belongs on the horizontal axis; if messenger RNA abundance is the dependent variable, it belongs on the vertical axis.
Investigation as a connecting activity
An investigation of cell communication can be conducted while studying many topics throughout the year. It can also serve as a final laboratory activity that connects concepts, Big Ideas, and science practices, including genetics, development, organismal behavior, cell communication, and evolution.
The investigation is therefore more than a single experiment. It is a chance to ask a question, design a procedure, collect and graph data, interpret uncertainty, construct an explanation, and communicate the result to others.
Common misconception check
Misconception: “If a signal stimulates gene expression, the signal directly creates the protein.” The correction is that signal transduction links detection of the signal to regulation of gene expression; the cell’s own transcription and translation machinery produces the protein.
Misconception: “A result is scientifically useful as soon as it is measured.” A measurement becomes useful evidence only when its relationship to the hypothesis and procedures is explained and when the result is communicated clearly enough for peers to evaluate.
Retrieval check
A treatment causes cells to contain more messenger RNA for a gene. Identify the proposed mechanism and one additional measurement needed before concluding that the cells produce more functional protein.
Answer: The treatment may activate signal transduction that stimulates expression of the gene. Measuring the corresponding protein, or measuring its biological activity, would test whether increased messenger RNA produces more functional protein.
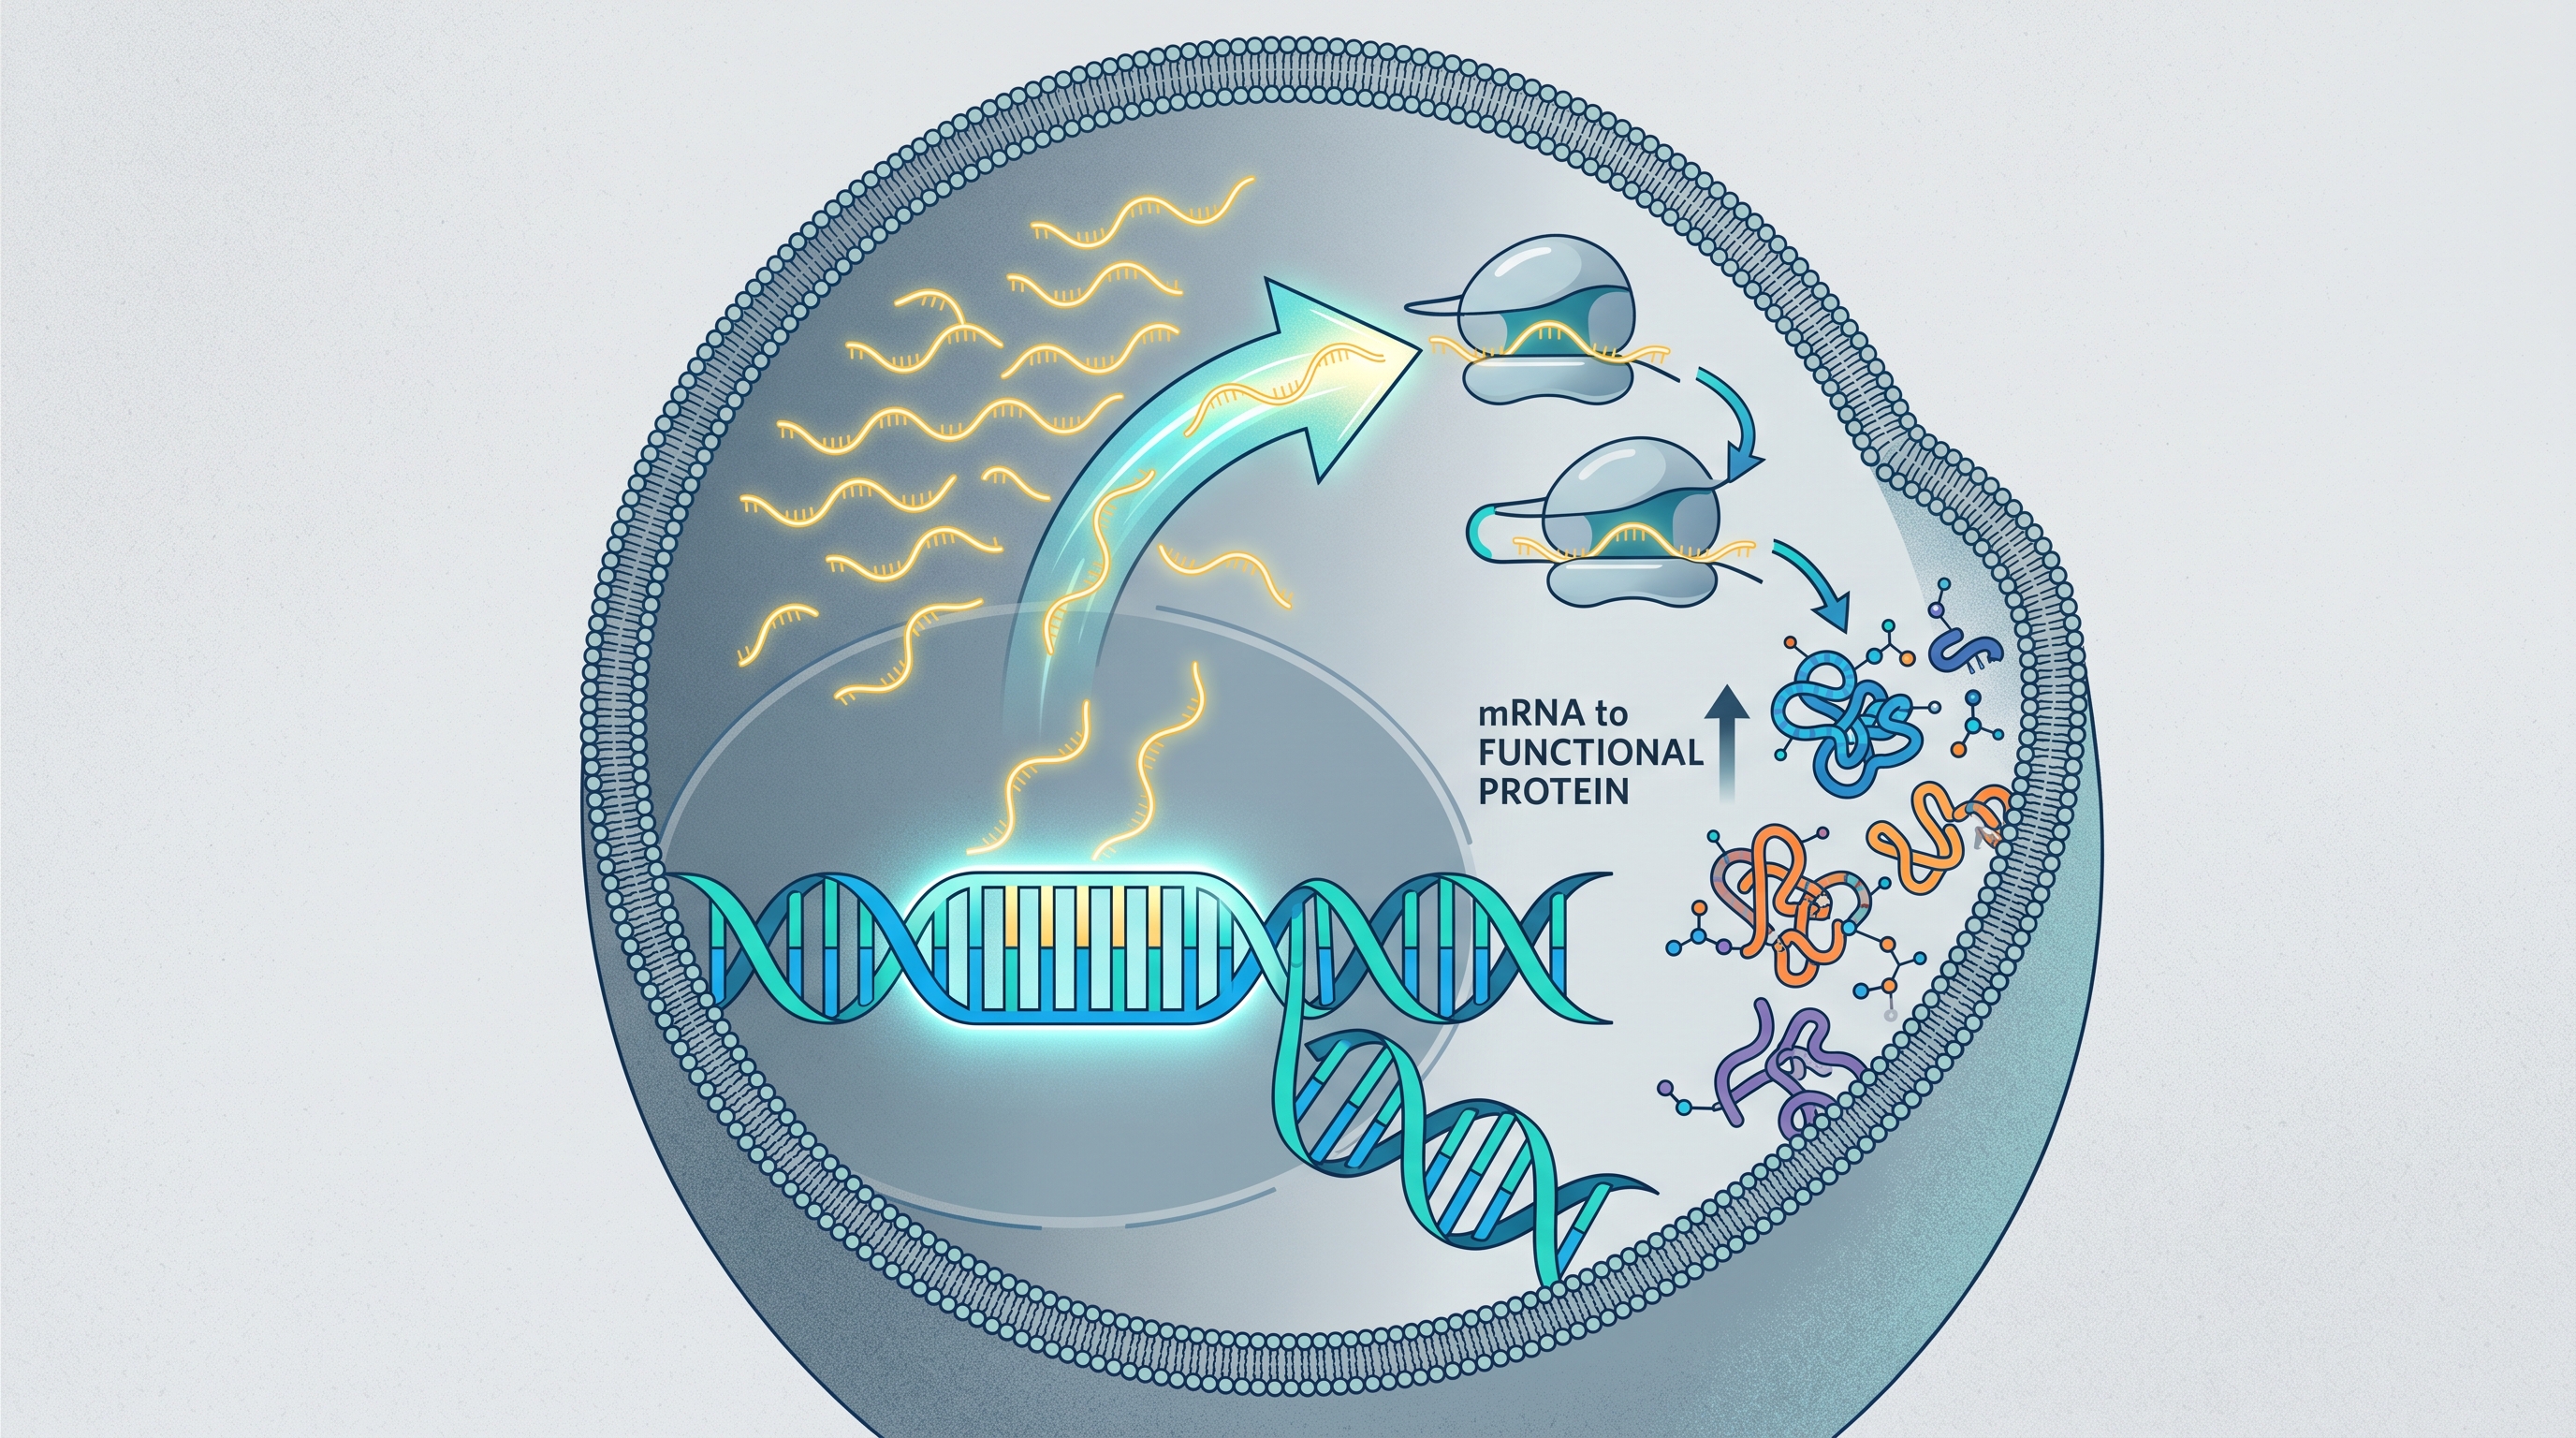
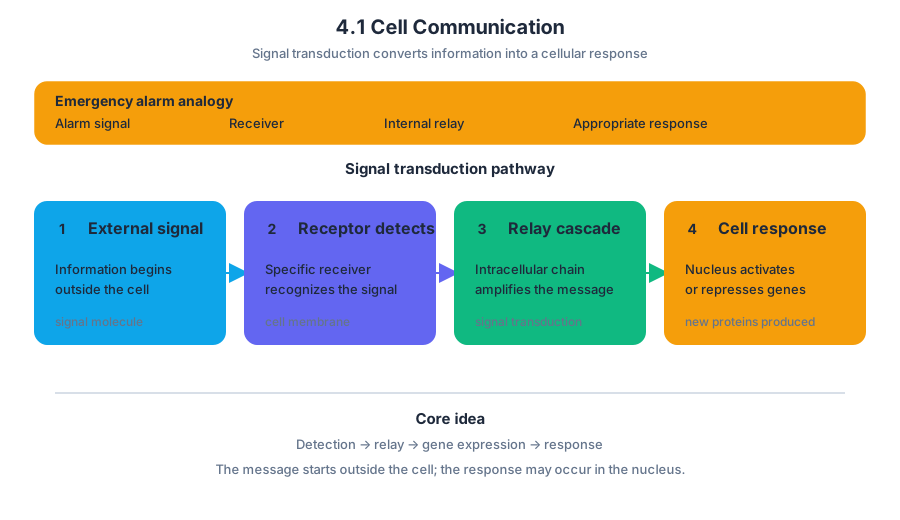
4.2 Introduction to Signal Transduction
Key concepts: Unit 4: Cell Communication and Cell Cycle · Unit 4 is allocated approximately 12–14 class periods · Unit 4 has an AP Exam weighting of approximately 10–15% · The Unit at a Glance organizes topics and associated skills · Interpreting and Evaluating Experimental Results with Graphing is an assessed FRQ type · Scientific Investigation is an assessed FRQ type · Inquiry-based laboratory work may involve troubleshooting experimental designs · Students may work in small groups and share resources · Repeating procedures can help students obtain results · An inquiry-based laboratory program provides benefits despite implementation challenges
Signal transduction is the process by which a cell converts an outside signal into an internal change. A message may begin at the cell surface, but its consequence can occur deep inside the cell: an enzyme becomes active, a gene is expressed, or the cell begins dividing.
4.2 Introduction to Signal Transduction
Signal transduction is the process by which a cell converts an outside signal into an internal change. A message may begin at the cell surface, but its consequence can occur deep inside the cell: an enzyme becomes active, a gene is expressed, or the cell begins dividing. The introductory idea is simple: a signal is received, relayed, and converted into a response.
A useful analogy is a doorbell. Pressing the button is not the same event as hearing the sound: the button detects the action, wiring carries the information, and the chime produces the response. In a cell, a signaling molecule provides the initial input, a receptor detects it, and intracellular components transmit or amplify the information. The detailed pathway mechanisms belong to the next topic; here, the essential task is recognizing the overall information flow.
A map of Unit 4
Unit 4 is Cell Communication and Cell Cycle. The Unit at a Glance organizes the unit by pairing each numbered topic with associated AP skills and suggested pacing. Unit 4 is allocated approximately $12$–$14$ class periods and represents approximately $10$–$15%$ of the AP Exam weighting.
| Topic | Associated skill emphasis |
|---|---|
| 4.1 Cell Communication | Skill 1 |
| 4.2 Introduction to Signal Transduction | [1.A] Describe biological concepts and processes |
| 4.3 Signal Transduction Pathways | Skill 6 |
| 4.4 Feedback | Skill 6 |
| 4.5 Cell Cycle | Skills 4 and 5 |
| 4.6 Regulation of Cell Cycle | Skill 6 |
For Topic 4.2, [1.A] Describe biological concepts and processes means that a response must accurately state what signal transduction is and identify its general sequence. A strong description distinguishes the initial signal from the cellular response rather than listing disconnected vocabulary.
Signal transduction: the conversion of information from an external or internal signal into a specific cellular response.
The Unit at a Glance is therefore more than a topic list. It shows that Unit 4 content is practiced through different kinds of reasoning: describing biological processes, interpreting visual and experimental evidence, analyzing data, and evaluating investigations. The associated skill changes as the biology becomes more mechanistic and evidence-based.
From a signal to a testable response
Consider a hypothetical cell exposed to a chemical messenger. The messenger is the stimulus, the receptor is the component that detects it, and the resulting change—such as increased enzyme activity—is the response. If the messenger is removed and the response decreases, that observation supports a connection between the signal and the response, although it does not by itself prove every step in the pathway.
A compact reasoning chain is:
$$ \text{signal} \longrightarrow \text{reception} \longrightarrow \text{intracellular relay} \longrightarrow \text{cellular response} $$
Worked example. Suppose cultured cells are exposed to three concentrations of a messenger. Their measured enzyme activity is $4$, $9$, and $15$ arbitrary units at low, medium, and high concentrations, respectively. The data show a positive association between messenger concentration and enzyme activity. An appropriate description is: As messenger concentration increases, enzyme activity increases under these experimental conditions. That statement describes the observed relationship without claiming that the messenger directly contacts the enzyme or that concentration is the only possible cause.
Inquiry is part of the biology
Signal transduction is especially suited to inquiry-based investigation because the pathway can be treated as an input-output system. Students can vary an experimental condition, measure a response, graph the results, and use the pattern to evaluate a biological explanation.
The laboratory process may not work on the first attempt. Students can work in small groups, share resources, troubleshoot an experimental design, and repeat a procedure several times before obtaining meaningful data. An unsuccessful result is not automatically useless: students should be able to identify nonmeaningful data, explain likely errors, and propose how a repeated experiment would differ.
Inquiry-based laboratory programs involve genuine challenges—limited time, unexpected variation, and procedures that require revision—but they also offer substantial benefits. They let students practice the work of scientists: connecting observations to biological principles, judging evidence, and improving an investigation rather than treating a single unexpected result as a final answer.
How this appears in assessment
Unit 4 assessment includes approximately $24$ multiple-choice questions and two free-response questions in its Progress Check structure. Relevant partial FRQ types include Interpreting and Evaluating Experimental Results with Graphing (partial) and Scientific Investigation (partial); the Unit 4 assessment summary also identifies Analyze Data as an associated demand.
For graphing, students must represent the independent variable and dependent variable appropriately, identify a trend, and connect that trend to the biological question. For scientific investigation, students may need to identify a testable question, describe a controlled procedure, explain why replication matters, or diagnose why an initial design produced nonmeaningful data.
Misconception check — “A failed experiment proves the hypothesis is wrong.” Not necessarily. A failed result may reflect an uncontrolled variable, an unsuitable measurement, insufficient replication, or a procedural error. The scientifically defensible response is to evaluate the design and evidence before deciding whether the biological explanation should be rejected.
Retrieval check: A cell receives a signal, but no measurable response occurs. Name two broad possibilities: one involving the signaling system and one involving the investigation. A complete answer could identify a defective or absent receptor and, separately, an experimental problem such as an incorrect concentration, poor measurement, or inadequate procedure.
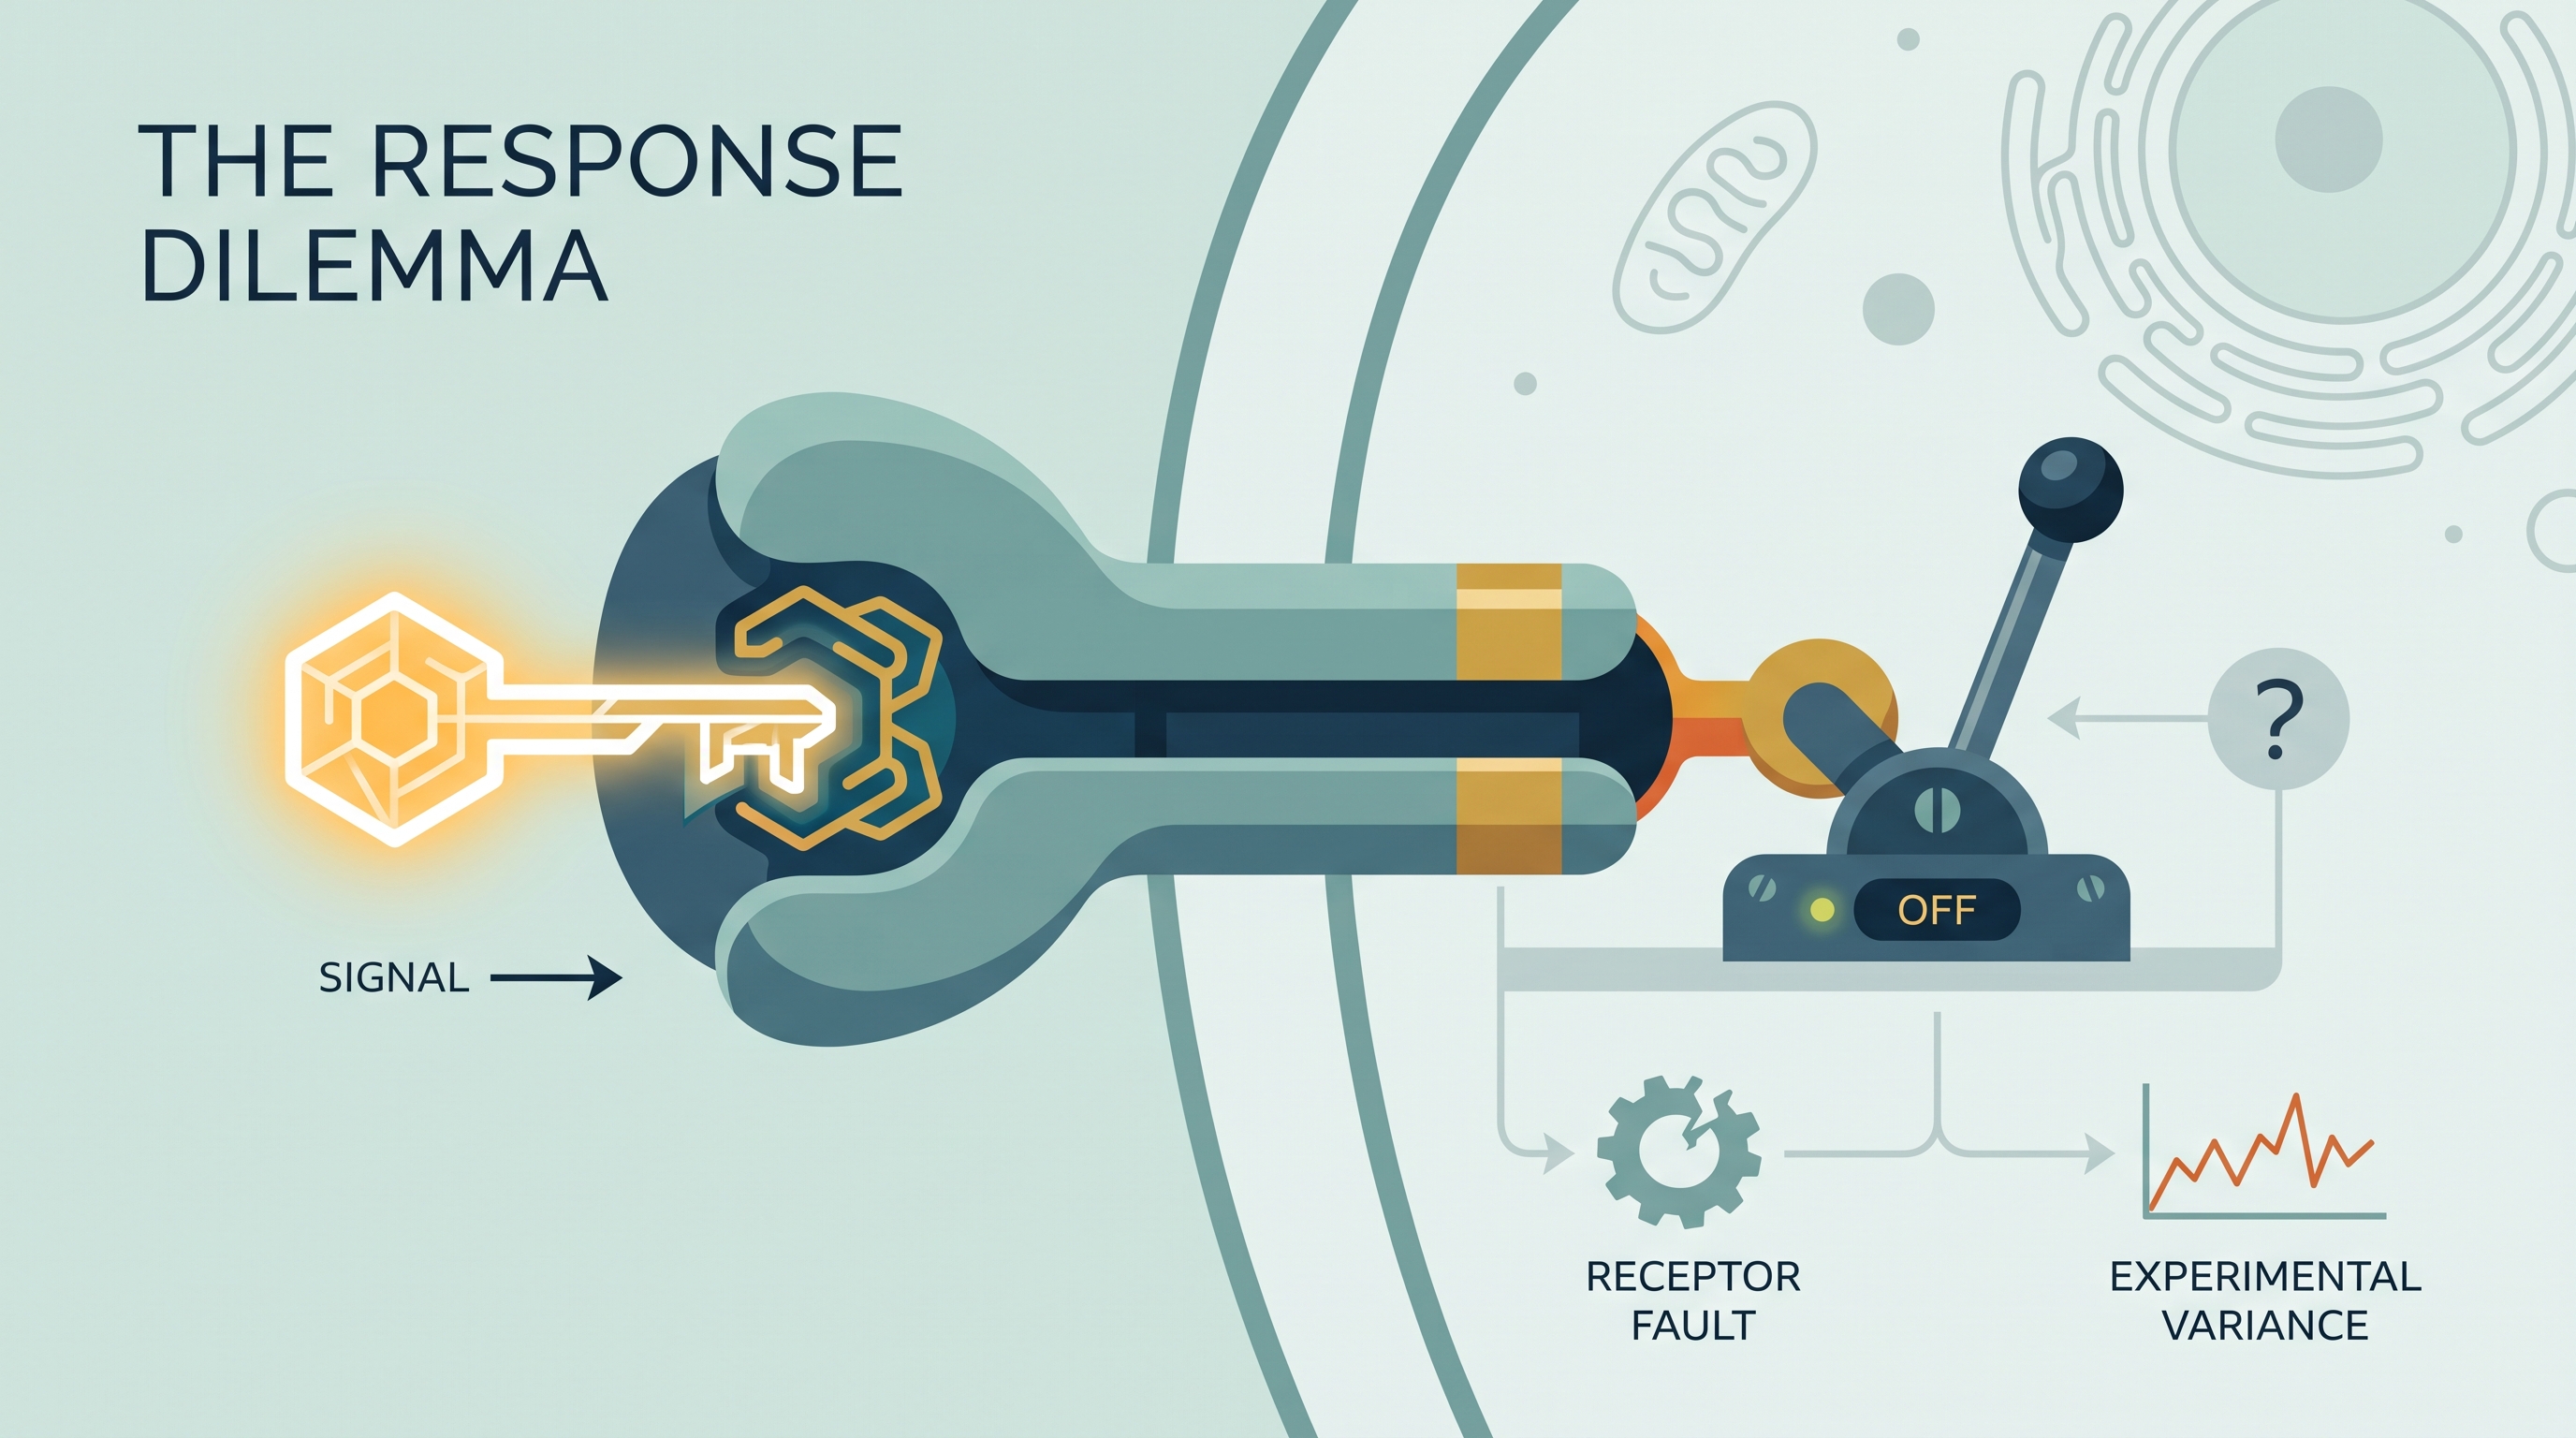
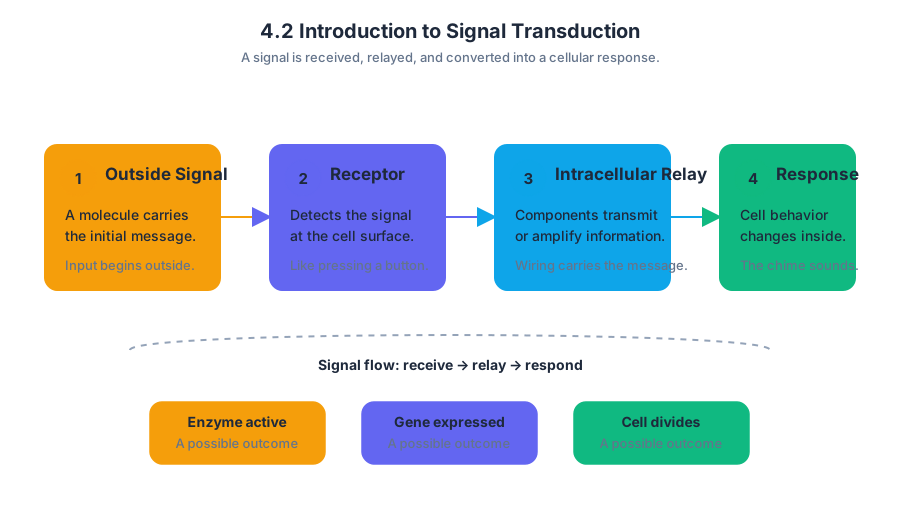
4.3 Signal Transduction Pathways
Key concepts: Signal transduction pathways · Signal reception and cellular responses · Protein modifications · Receptor proteins · G protein-coupled receptors (GPCRs) · Eukaryotic cells · Cell-surface receptors · Chemical messengers · Quorum sensing · Epinephrine stimulation
Receptor activation initiates a sequence of protein interactions and modifications that converts a chemical message into a specific cellular response. The receptor is not merely an antenna: its structure determines which intracellular pathway can begin and, therefore, which response the cell produces.
4.3 Signal Transduction Pathways
Receptor activation initiates a sequence of protein interactions and modifications that converts a chemical message into a specific cellular response. The receptor is not merely an antenna: its structure determines which intracellular pathway can begin and, therefore, which response the cell produces.
From chemical message to cellular response
A signal transduction pathway is the linked series of molecular events that carries information from signal reception to a response inside a target cell. Signaling begins when a ligand, a chemical messenger, binds a receptor protein. A ligand may be a peptide or protein, such as a cytokine, or a small molecule, such as epinephrine.
4.3.A — Describe the different types of cellular responses elicited by a signal transduction pathway.
The ligand-binding domain of a receptor recognizes a particular chemical messenger. This specificity is comparable to a lock accepting only certain keys, but the analogy has a crucial limitation: binding does not simply “open” the receptor. It changes the receptor’s shape or activity, allowing the next component of the pathway to interact with it.
Receptors can occupy different locations in a eukaryotic cell. Receptors for water-soluble signals are often located on the cell surface because those signals cannot readily cross the hydrophobic interior of the plasma membrane. Other signaling molecules can cross the membrane and bind receptors in the cytoplasm or nucleus.
Protein modifications amplify and redirect signals
Many signal transduction pathways include protein modifications, chemical changes that alter a protein’s activity, location, stability, or interactions. One important modification is phosphorylation, the addition of a phosphate group to a protein. A kinase adds the phosphate; a phosphatase removes it. These changes can act like molecular switches, although their effects depend on the particular protein being modified.
In a phosphorylation cascade, one activated protein modifies another, which modifies another, and so on. This arrangement can amplify a small signal: one activated receptor may help activate many downstream molecules. The final response may include activating an enzyme, changing the cell’s shape, altering transport across the membrane, changing gene expression, or initiating programmed cell death called apoptosis.
Worked example — epinephrine and glycogen breakdown: Epinephrine binds a receptor on the surface of a mammalian liver cell. The activated receptor begins an intracellular pathway involving protein interactions and phosphorylation. The pathway activates proteins that promote glycogen breakdown, releasing glucose-related molecules that help the animal respond rapidly to an energy demand.
The important reasoning is causal: changing the receptor or any downstream component can change the final response. A mutation in a receptor’s ligand-binding domain may prevent epinephrine from binding. A mutation in a later protein may allow binding but block the phosphorylation cascade. The same external signal can therefore produce no response, a reduced response, or an abnormally persistent response.
Receptor proteins and pathway-specific outcomes
G protein-coupled receptors, or GPCRs, are a major example of receptor proteins in eukaryotes. When a ligand binds a GPCR, the receptor changes conformation and activates an associated G protein. The G protein then influences downstream proteins, which can modify additional targets and produce a cellular response.
A pathway’s outcome depends on the components present in the target cell. Two cell types may encounter the same chemical messenger but respond differently because they contain different receptors, G proteins, enzymes, transcription factors, or target genes. Signal transduction can therefore alter cell function and gene expression, potentially changing phenotype.
Population-level signaling
Signal transduction is not limited to animals. Microbes can release chemical messengers that nearby cells detect. In quorum sensing, the concentration of a messenger reflects population density: as more microbial cells release the signal, its concentration rises until it triggers a coordinated response, such as activating a group of genes.
EK 4.3.A.1: Signal transduction may result in changes in gene expression and cell function, which may alter phenotype or result in programmed cell death (apoptosis).
A common misconception is that a ligand directly performs the response—for example, that epinephrine itself “breaks down glycogen.” The ligand starts the pathway; receptor activation and downstream protein modifications carry out and regulate the response.
AP skill lens
This topic most directly uses Science Practice 1: Concept Explanation, when explaining how receptor activation produces a response; Science Practice 2: Visual Representations, when tracing a pathway diagram; Science Practice 3: Questions and Methods, when predicting the effect of blocking a receptor or kinase; and Science Practice 6: Argumentation, when using pathway evidence to justify how a mutation changes cellular behavior. 4.3.B — Explain how a change in the structure of any signaling molecule affects the activity of the signaling pathway. EK 4.3.B.1 emphasizes that mutations in any receptor domain or pathway component can alter downstream responses.
Retrieval check: A cell still contains its downstream enzymes, but a mutation changes the ligand-binding domain of its surface receptor. Predict the immediate effect on the pathway and explain why the final cellular response changes. A strong answer states that ligand binding is reduced or prevented, receptor activation falls, downstream protein modifications do not occur normally, and the response is reduced or absent.
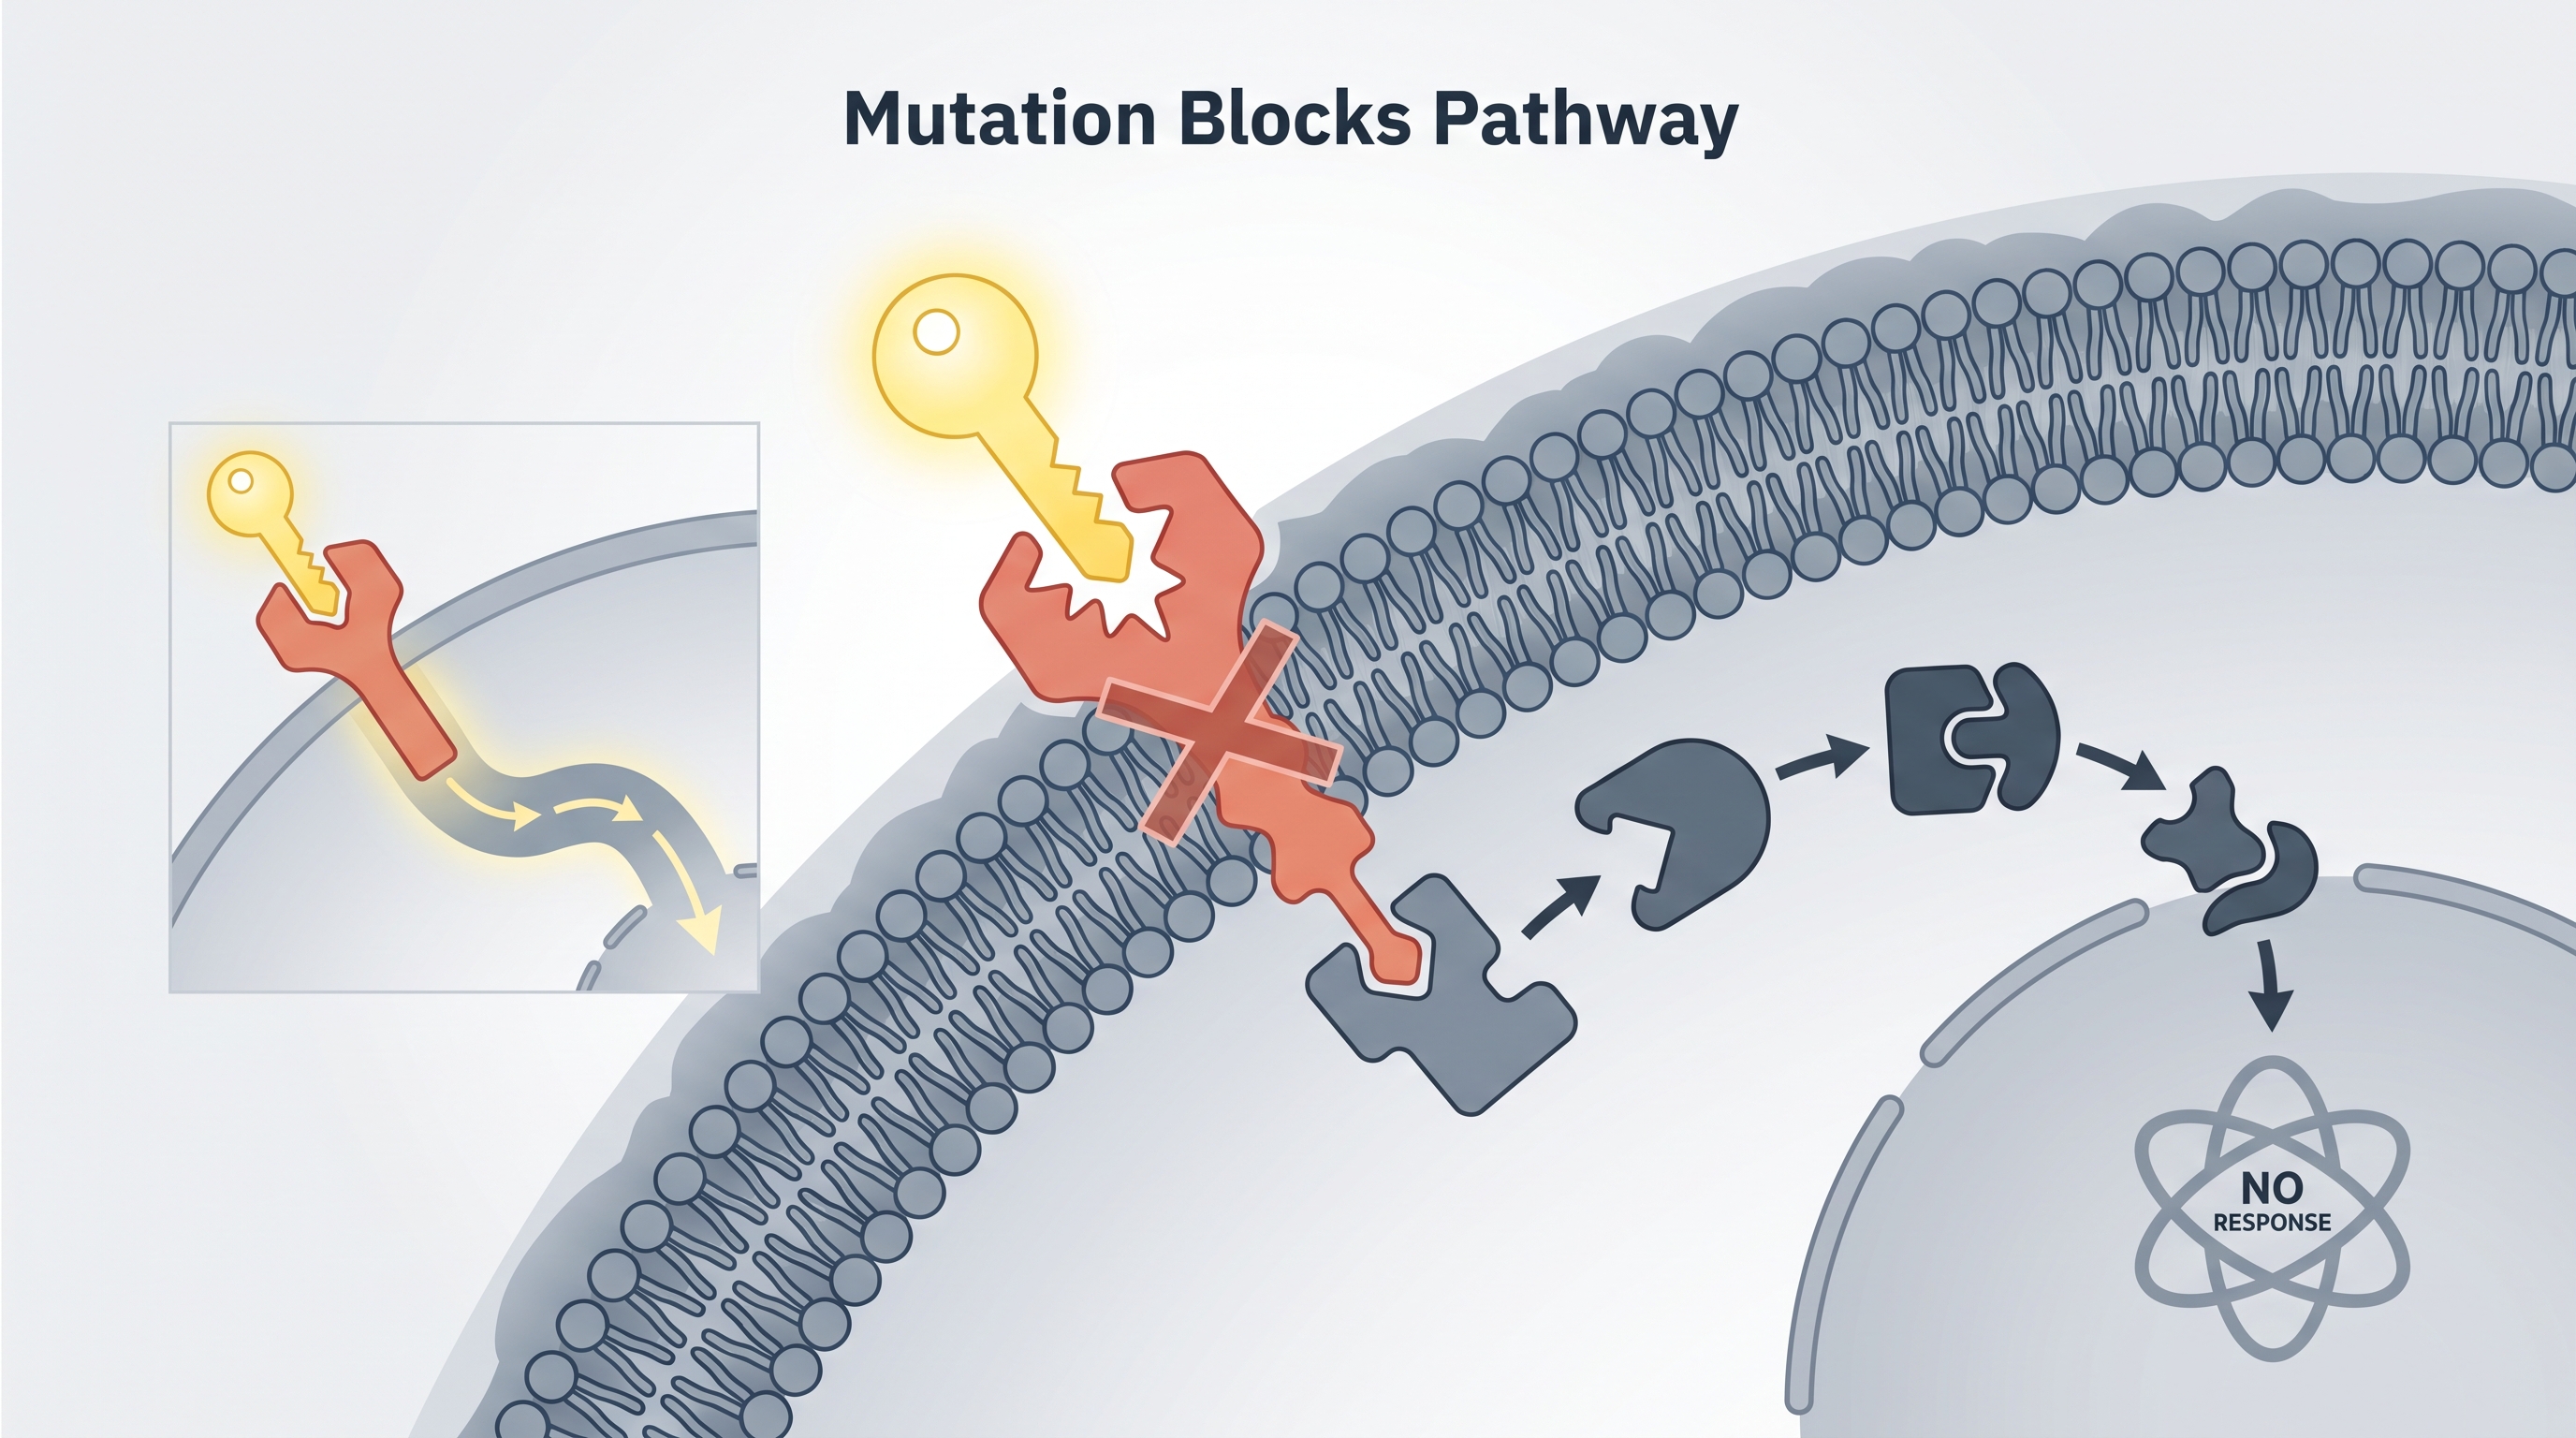
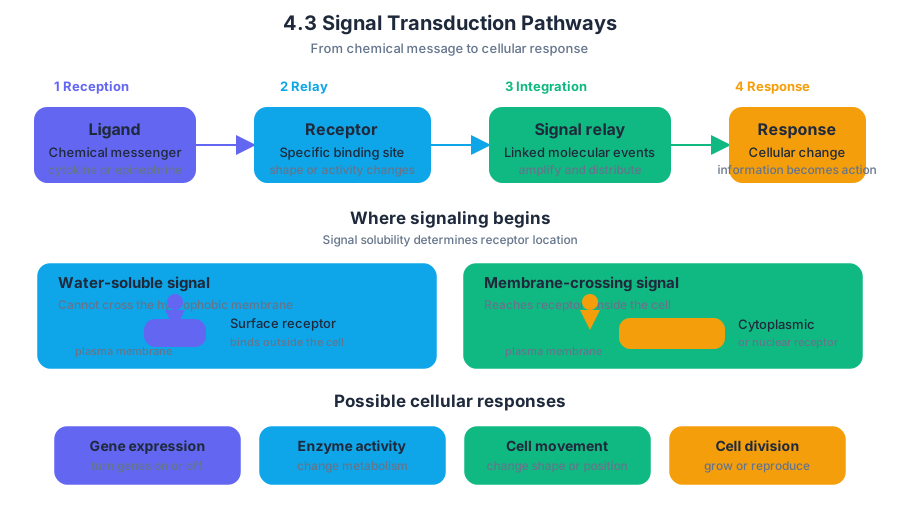
4.4 Feedback
A biological system stays within workable limits because its outputs can alter the process that produced them. This self-regulation is feedback: information about a system’s condition is used to adjust the system’s activity.
4.4 Feedback
A biological system stays within workable limits because its outputs can alter the process that produced them. This self-regulation is feedback: information about a system’s condition is used to adjust the system’s activity.
Learning Objective 4.4.A: Explain how feedback mechanisms regulate biological processes.
Essential Knowledge 4.A.2: Biological systems interact with one another and with their environments, producing regulation and emergent properties.
Negative feedback: correcting a deviation
Negative feedback reduces the original stimulus. It does not mean “bad” feedback; it means that the response opposes a change and moves a variable back toward a target range. A useful analogy is a household thermostat: when room temperature falls below the set point, heating increases; as the room warms, heating decreases.
A negative-feedback loop usually contains four functional parts:
- Stimulus: a regulated variable changes.
- Sensor: a receptor detects the change.
- Control center: information is evaluated against a target or acceptable range.
- Effector: a response changes the variable, reducing the original deviation.
The regulated variable is not necessarily held at one perfectly fixed value. Body temperature, blood glucose concentration, and blood water potential fluctuate within ranges. Feedback therefore supports dynamic equilibrium—continuous adjustment rather than complete stillness.
Worked example: blood glucose after a meal
After a carbohydrate-rich meal, digestion increases the concentration of glucose in the blood. The pancreas detects this change and releases insulin, a hormone that acts as a chemical signal. Insulin promotes glucose uptake by many cells and encourages liver and muscle cells to store glucose as glycogen.
The reasoning chain is:
$$ \text{Meal} \rightarrow \text{blood glucose rises} \rightarrow \text{insulin secretion increases} $$
$$ \text{insulin} \rightarrow \text{cellular glucose uptake and storage} \rightarrow \text{blood glucose falls toward its normal range} $$
Because the response decreases the initiating change, this is negative feedback. If blood glucose falls too low, the pancreas releases glucagon, which promotes the breakdown of stored glycogen and the release of glucose into the blood. Insulin and glucagon therefore act in opposing pathways that help regulate the same variable.
Positive feedback: amplifying a process
Positive feedback strengthens the original stimulus. The response produces more of the signal or activity, pushing the process farther in the same direction. Positive feedback is useful when a biological event must proceed rapidly to completion, but it usually requires a stopping event or endpoint.
During childbirth, stretching of the cervix stimulates nerve signals to the hypothalamus, which promotes release of oxytocin from the posterior pituitary. Oxytocin increases uterine contractions; stronger contractions cause more cervical stretching, which promotes additional oxytocin release.
$$ \text{cervical stretching} \rightarrow \text{oxytocin} \rightarrow \text{stronger contractions} \rightarrow \text{more stretching} $$
The loop ends when childbirth is complete and cervical stretching is removed. Blood clotting provides another example: activated platelets release signals that recruit and activate additional platelets until the damaged area is sealed.
Do not confuse feedback with a simple cause-and-effect chain
A pathway is feedback only when a later outcome influences the activity of an earlier part of the process. A signal causing a response is not automatically feedback. For example, a hormone binding to a receptor is signal transduction; feedback occurs when the resulting response changes the stimulus, signal production, or pathway activity.
Misconception check: “Negative feedback stops a process completely.”
Correction: Negative feedback usually decreases the process enough to restore a regulated range. It is an adjustment, not necessarily an off switch.
Another common error is labeling every increase as positive feedback. An increase is positive feedback only when it amplifies the initiating change. If blood glucose rises and insulin increases but glucose then falls, the overall loop is negative feedback.
AP science practices in feedback problems
Feedback is commonly assessed through all six official science practices:
- Science Practice 1: Concept Explanation — explain how a stimulus, sensor, control center, and effector interact.
- Science Practice 2: Visual Representations — construct or interpret arrows showing whether a response opposes or amplifies a change.
- Science Practice 3: Questions and Methods — identify variables and design a test of whether disrupting a sensor or hormone alters regulation.
- Science Practice 4: Representing and Describing Data — graph a regulated variable over time and identify recovery, overshoot, or amplification.
- Science Practice 5: Statistical Tests and Data Analysis — determine whether treatment and control responses differ enough to support a feedback claim.
- Science Practice 6: Argumentation — use evidence from a graph or experiment to justify that a mechanism is negative or positive feedback.
Retrieval check: Blood calcium falls, causing increased secretion of a hormone that raises blood calcium back toward its normal range. Is this positive or negative feedback, and what feature of the loop proves your answer?
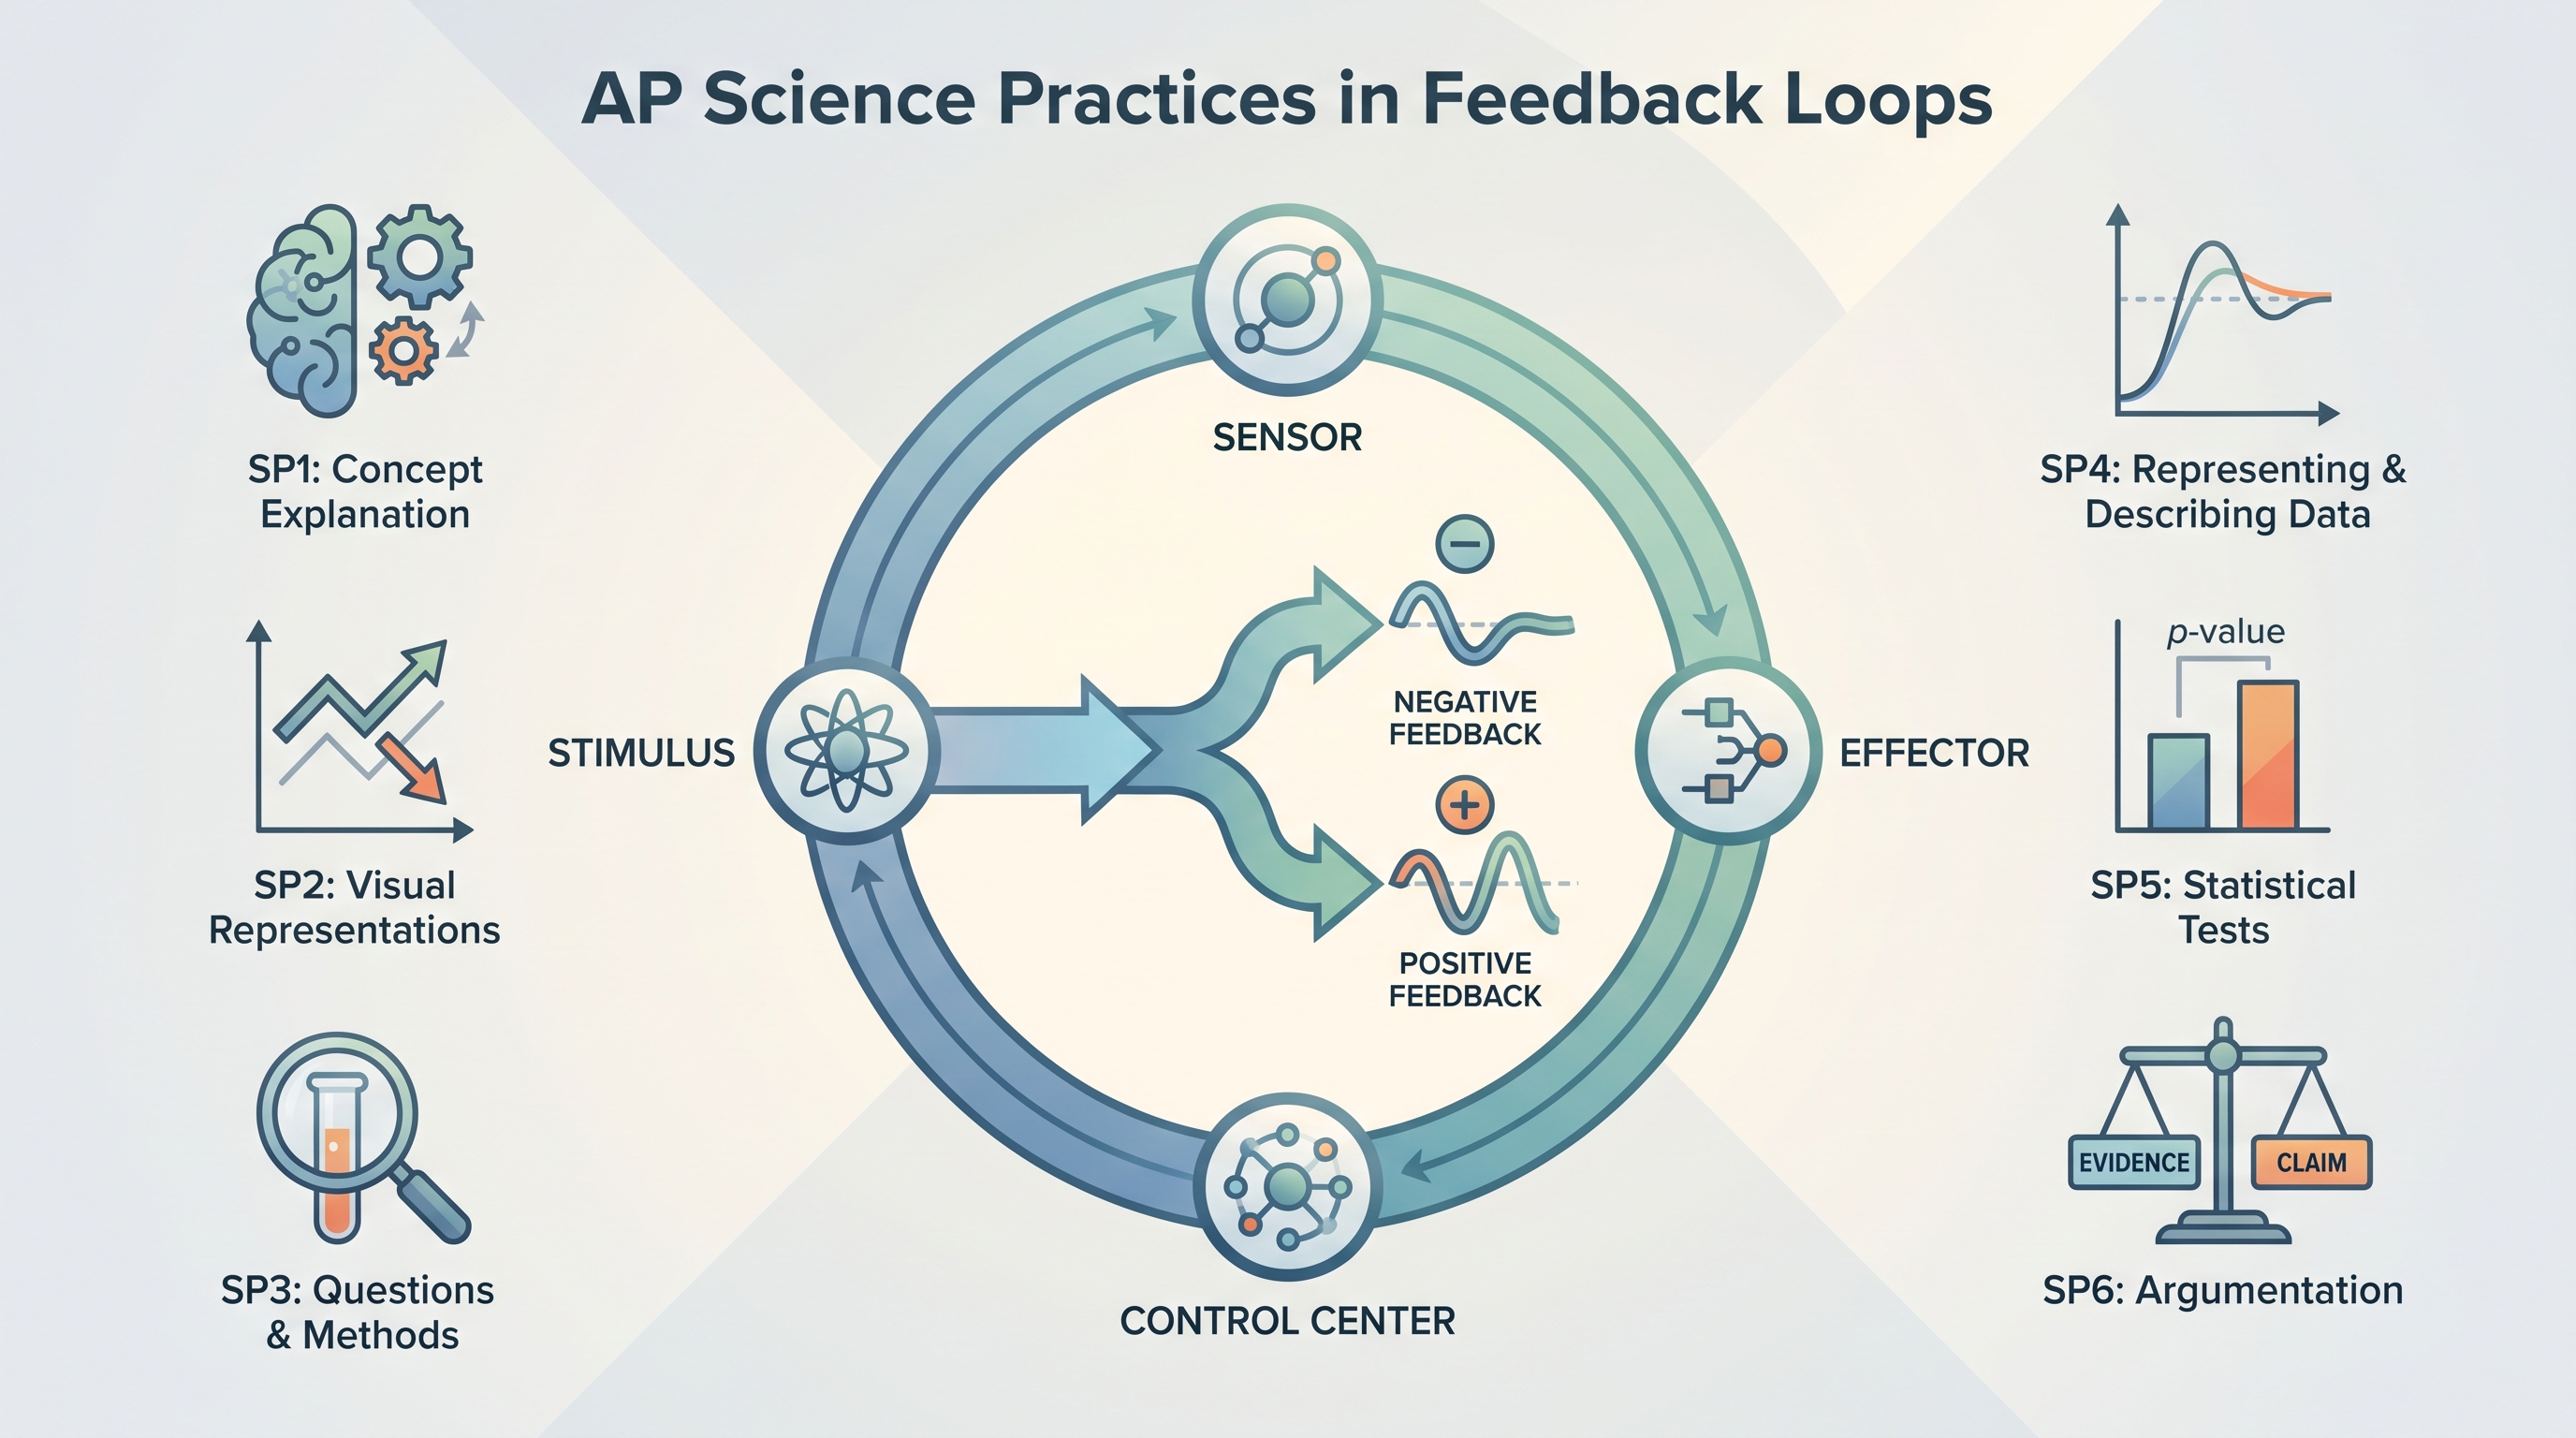
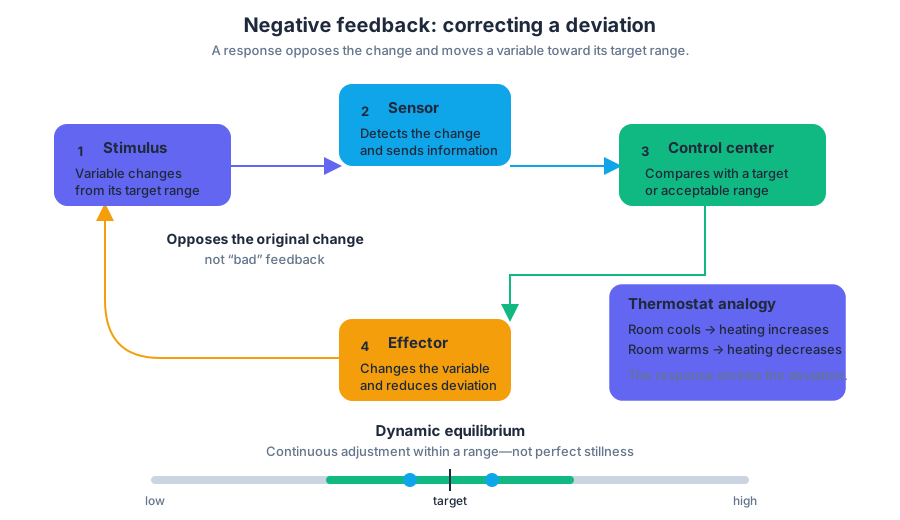
4.5 Cell Cycle
Key concepts: Cell cycle in eukaryotes · Binary fission in prokaryotes · Binary fission of mitochondria and chloroplasts · DNA replication and sister chromatids · Mitosis · Cell-cycle checkpoints · G1 checkpoint · G2 checkpoint · M-spindle checkpoint · Cell-cycle regulation and cancer
A cell cannot divide safely by simply splitting in half: it must first copy its DNA, check the copy, and distribute one complete genetic set to each daughter cell.
4.5 Cell Cycle
A cell cannot divide safely by simply splitting in half: it must first copy its DNA, check the copy, and distribute one complete genetic set to each daughter cell. The cell cycle is this controlled sequence of growth, DNA replication, preparation, nuclear division, and cytoplasmic division.
CED traceability: Topic 4.5 Cell Cycle; Learning Objective 4.5.A; Essential Knowledge 4.A.2. This topic is especially assessed through Science Practice 1: Concept Explanation, Science Practice 2: Visual Representations, and Science Practice 6: Argumentation.
Two solutions to the same biological problem
A bacterium often solves cell division with binary fission, a process in which one prokaryotic cell copies its chromosome and divides into two cells. Mitochondria and chloroplasts also replicate by binary fission. Their division method is evidence supporting the evolutionary relationship between these organelles and prokaryotes, consistent with the endosymbiotic origin of mitochondria and chloroplasts.
Eukaryotic division is more elaborate because a eukaryotic cell must coordinate duplication of its nucleus, multiple chromosomes, and other organelles. Its repeating sequence is the cell cycle, which includes interphase, mitosis, and cytokinesis.
The eukaryotic cell cycle
The four named phases are $G_1$, $S$, $G_2$, and $M$. The first three phases make up interphase; the $M$ phase includes mitosis and cytokinesis.
| Phase | Main event | Key question before moving on |
|---|---|---|
| $G_1$ | Cell grows and prepares to copy DNA | Is the cell large and healthy enough to begin? |
| $S$ | Chromosomal DNA is replicated | Was the genetic material copied? |
| $G_2$ | Cell grows and prepares for division | Is the copied DNA intact? |
| $M$ | Mitosis distributes chromosomes; cytokinesis divides the cell | Are chromosomes attached correctly for separation? |
During the $S$ phase, each chromosome is copied. After replication, one chromosome consists of two genetically matching DNA copies called sister chromatids. The sister chromatids remain joined at a region containing the kinetochore, an attachment site for spindle microtubules.
Key distinction: DNA replication doubles the DNA content, but it does not immediately double the chromosome number. The two copies remain joined as sister chromatids until they separate during mitosis.
Mitosis as an orderly distribution system
Mitosis is the division of the nucleus. Its purpose is to distribute duplicated chromosomes so that each new nucleus receives an equivalent genetic set. Cytokinesis then divides the cytoplasm, producing two daughter cells.
A useful mental model is a library making two identical branches: the books are duplicated first, then carefully sorted so each branch receives one complete copy. If a chromosome is missing or sent to both daughter cells, the resulting cells may malfunction.
Checkpoints: the cycle does not run blindly
A cell-cycle checkpoint is a control point at which the cell verifies that essential tasks are complete and that conditions are suitable before continuing. Cells may pause in a nondividing state, often called $G_0$, rather than proceed.
The three major checkpoints are:
- $G_1$ checkpoint: The cell evaluates DNA damage, cell size, growth factors, and environmental conditions. Appropriate external growth factors can stimulate division; for example, platelet-derived growth factor can encourage cells near a wound to divide during repair.
- $G_2$ checkpoint: After DNA replication, the cell checks whether replication is complete and whether the DNA contains damage or mutations. A damaged cell is prevented from entering mitosis.
- M-spindle checkpoint: During metaphase, the cell verifies that spindle fibers are properly attached to chromosome kinetochores. Incorrect attachment blocks progression toward chromosome separation.
Worked example: a damaged cell after replication
Suppose a cell completes $G_1$ and copies its DNA during $S$, but a mutation is detected before mitosis. The correct response is not to “repair the problem during mitosis.” The $G_2$ checkpoint pauses the cycle, allowing repair or preventing division if the damage cannot be safely resolved.
If the same cell passes $G_2$ but one chromosome lacks a properly attached spindle fiber, the M-spindle checkpoint stops the cell during metaphase. This prevents unequal chromosome distribution.
Misconception check
Misconception: “A chromosome is one DNA molecule only before replication and two chromosomes after replication.” Correction: before replication, a chromosome has one chromatid; after replication, it has two sister chromatids joined together, but it is still counted as one chromosome until the sister chromatids separate.
Misconception: “Cancer is caused only by cells dividing quickly.” Correction: cancer frequently involves mutations in genes controlling cell-cycle regulation. The deeper problem is failed control: cells may ignore checkpoint signals, continue dividing despite damage, or proceed with improperly organized chromosomes.
Retrieval check
A cell has completed DNA replication, but its DNA contains damage. Which checkpoint should prevent entry into mitosis, and why? A correct answer identifies the $G_2$ checkpoint and explains that it checks replicated DNA for damage or mutations before mitosis begins.
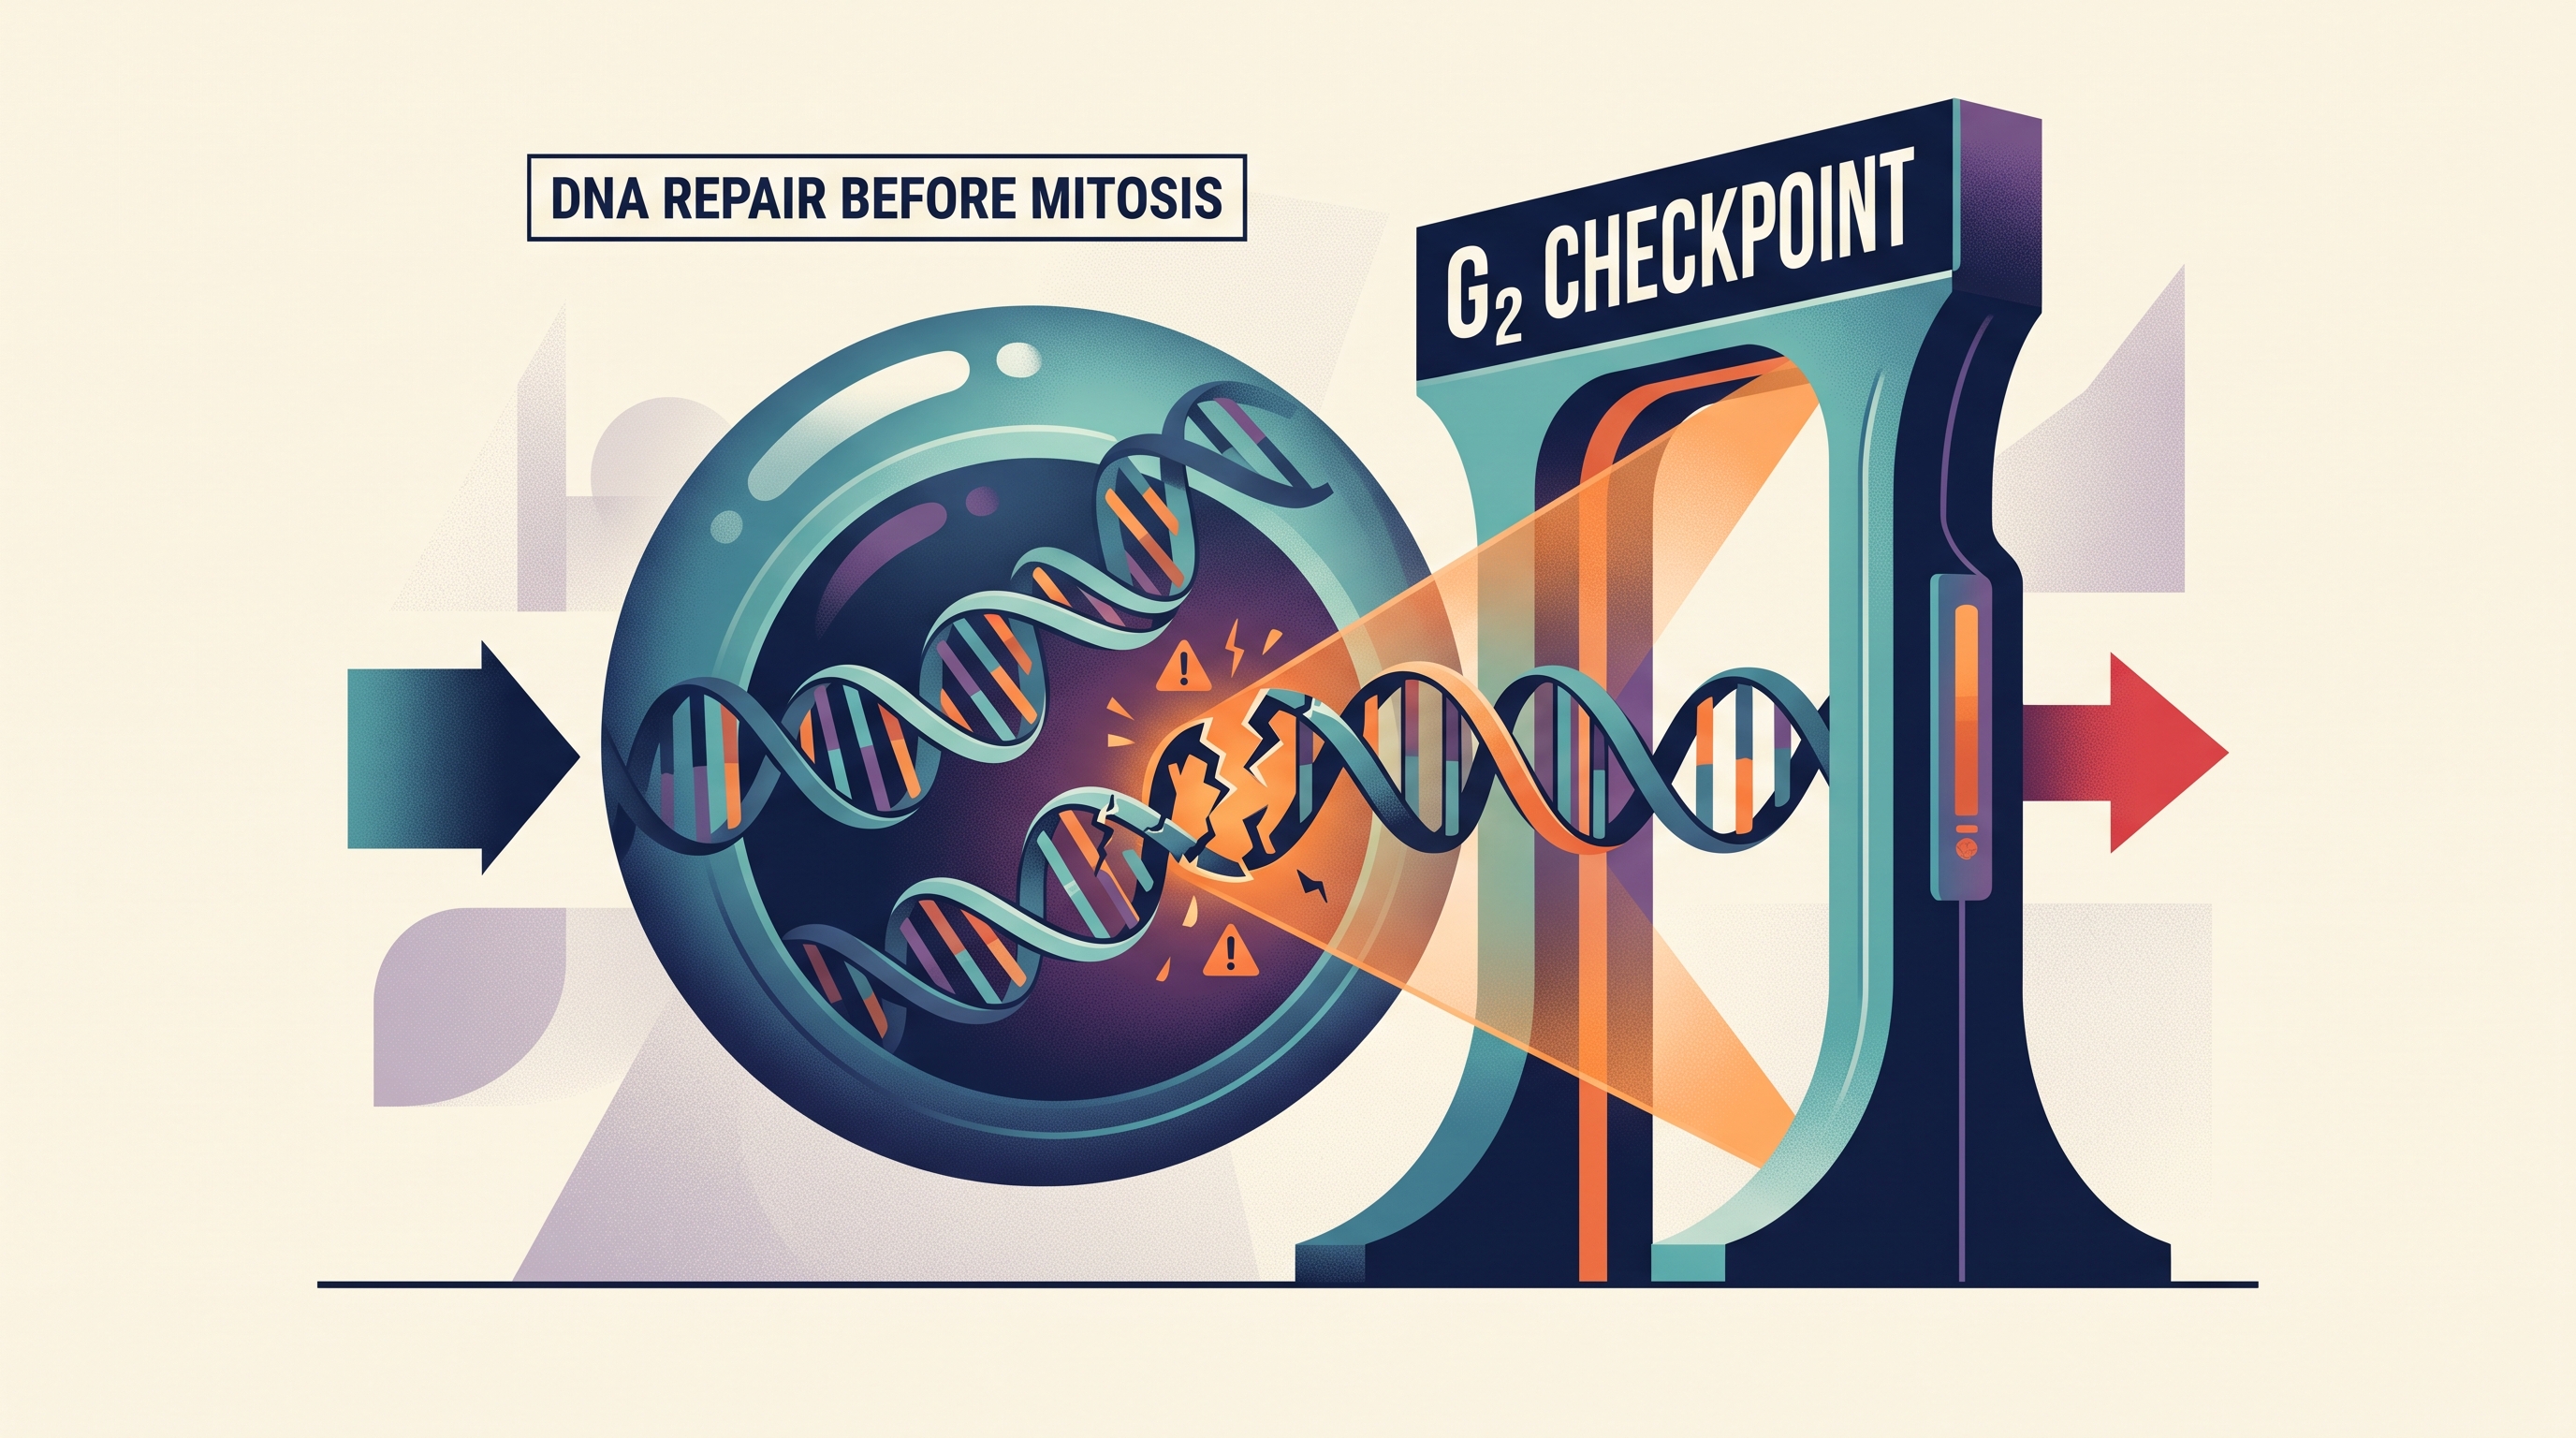
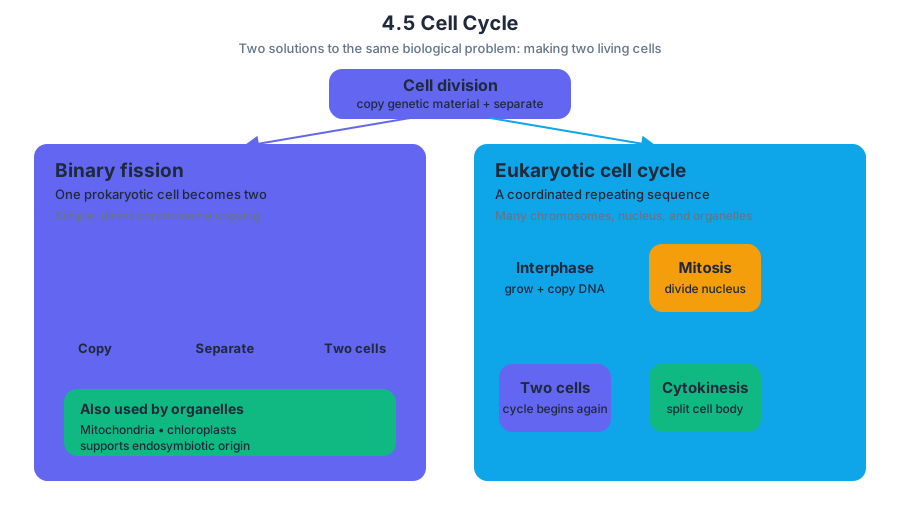
4.6 Regulation of Cell Cycle
Key concepts: Cell cycle regulation · Cyclins and cyclin-dependent kinases (CDKs) · Cell-cycle checkpoints · G1/S transition checkpoint · G2/M transition checkpoint · Metaphase/anaphase spindle checkpoint · Cell-cycle arrest and the G0 phase · Growth factors and cell-cycle progression · Disruptions of cell-cycle regulation · Cancer cells and abnormal cell division
A cell does not divide merely because it has reached the end of its growth phase: it divides only when internal checkpoints and regulatory proteins indicate that division is safe and useful.
4.6 Regulation of Cell Cycle
A cell does not divide merely because it has reached the end of its growth phase: it divides only when internal checkpoints and regulatory proteins indicate that division is safe and useful. Cell-cycle regulation is the control system that coordinates growth, DNA replication, chromosome distribution, and cell division.
Learning Objective 4.6.A: Describe the role of checkpoints in regulating the cell cycle.
Essential Knowledge 4.6.A.1: A number of internal controls or checkpoints regulate progression through the cell cycle.
Essential Knowledge 4.6.A.2: Interactions between cyclins and cyclin-dependent kinases control the cell cycle.
A useful mental model is an airport: a plane cannot proceed to takeoff simply because it has reached the runway. It must pass inspections for fuel, damage, weather, and equipment. Likewise, a cell pauses at several checkpoints until it receives the molecular equivalent of “all clear.”
Cyclins and CDKs: the molecular timing system
Cyclins are regulatory proteins whose concentrations rise and fall during the cell cycle. Cyclin-dependent kinases, or CDKs, are enzymes that become active when associated with cyclins. Together, cyclins and CDKs activate or modify other proteins involved in moving the cell from one phase to the next.
The changing amount of cyclin provides timing. A cyclin may accumulate until enough is present to activate its associated CDK; after the transition occurs, the cyclin is broken down, reducing that signal. The cell therefore does not use one permanent “division switch.” It uses changing combinations of regulatory proteins to make progression conditional and ordered.
The transition from $G_2$ into mitosis is regulated by cyclin-dependent activity, including MPF, commonly described as a maturation-promoting or M-phase-promoting factor. MPF activity helps initiate the events of mitosis, but the important AP Biology idea is the general mechanism: cyclin-dependent activity promotes a cell-cycle transition only when the regulatory conditions are satisfied.
Scope boundary: Knowledge of specific cyclin-CDK pairs or growth factors is beyond the scope of the AP Exam. Focus on the interaction between cyclins, CDKs, and checkpoint control rather than memorizing pair names.
Misconception check — “Cyclins make the cell divide by themselves.” Cyclins are not independent on/off switches. Their interaction with CDKs produces regulatory activity, and that activity affects other proteins. A change in cyclin concentration can alter the timing of a transition, but the cell’s decision also depends on checkpoint signals and the condition of the cell.
Three checkpoints, three questions
Each major checkpoint asks a different biological question. A failure at one checkpoint can delay the cycle, stop it temporarily, send the cell into a nondividing state called $G_0$, or contribute to abnormal division if the control system is damaged.
| Checkpoint | Main question | If conditions fail |
|---|---|---|
| $G_1/S$ transition | Is the cell large enough, undamaged, and in a suitable environment to replicate DNA? | Arrest, repair, or entry into $G_0$ |
| $G_2/M$ transition | Has DNA replication finished accurately, and is the cell ready for mitosis? | Arrest and repair |
| Metaphase/anaphase spindle checkpoint | Are chromosomes correctly attached to spindle fibers before sister chromatids separate? | Delay in chromosome separation |
$G_1/S$ transition checkpoint
The $G_1/S$ checkpoint evaluates cell size, DNA damage or mutations, and whether environmental conditions support DNA replication. Entering $S$ phase commits the cell to copying its DNA, so beginning replication when the cell is too small, damaged, or poorly supplied could produce defective daughter cells.
For example, if DNA damage is detected before $S$ phase, checkpoint signaling can pause progression. The cell may repair the DNA; if the damage cannot be managed, the cell may remain arrested or undergo apoptosis, a form of programmed cell death.
$G_2/M$ transition checkpoint
The $G_2/M$ checkpoint evaluates whether DNA replication is complete, whether the DNA contains damage or mutations, and whether the cell is large enough to divide. Only after these conditions are acceptable should cyclin-dependent activity, including MPF activity, promote entry into mitosis.
This checkpoint prevents a cell from distributing incomplete or damaged chromosomes to daughter cells. A cell with duplicated DNA is not automatically ready for mitosis; replication must be complete and the genetic material must be sufficiently intact.
Metaphase/anaphase spindle checkpoint
The metaphase/anaphase spindle checkpoint verifies that chromosomes are properly attached to spindle fibers, which are microtubule structures that move chromosomes during mitosis. If a chromosome is not correctly attached, sister chromatids should not separate.
This control reduces the risk that one daughter cell receives too many chromosomes while the other receives too few. Such unequal chromosome distribution can impair cell function and is especially dangerous when checkpoint failure occurs repeatedly.
When regulation fails
Learning Objective 4.6.B: Describe the effects of disruptions to the cell cycle on the cell or organism.
Essential Knowledge 4.6.B.1: Disruptions to the cell cycle may result in cancer or apoptosis (programmed cell death).
Normal cells generally require appropriate internal conditions and external signals before progressing. Cancer cells may lose these restraints: mutations in tumor-suppressor genes such as $p53$ or Rb can impair checkpoint responses, allowing cells with damaged DNA or abnormal chromosome behavior to continue dividing.
The result is not simply “more growth.” Uncontrolled division can produce a tumor, disrupt tissue organization, and increase the chance of additional mutations. By contrast, a functioning checkpoint may stop a damaged cell or direct it toward apoptosis, protecting the organism by removing a potentially harmful cell.
Environmental and biological factors can also change the rate of mitosis without necessarily destroying the entire regulatory system. In plant roots, for instance, soil salinity, soil pH, or interactions with organisms such as roundworms may increase or decrease root growth by altering the rate of cell division.
Worked example: predicting a checkpoint disruption
Suppose a mutation prevents a cell from responding to DNA damage at the $G_2/M$ checkpoint. The correct prediction is not merely “the cell divides faster.” The immediate consequence is that the cell may enter mitosis even though its DNA is damaged or incompletely replicated; the later consequence may be abnormal daughter cells, further mutations, cell death, or uncontrolled proliferation.
This is Skill 6.E — Predict the causes or effects of a change in, or a disruption to, one or more components in a biological system based on a biological concept or model. The reasoning chain is:
- Identify the disrupted component: the $G_2/M$ checkpoint response.
- State the normal function: block mitotic entry until DNA replication and integrity are acceptable.
- Remove that function: damaged or incomplete DNA can proceed into mitosis.
- Predict the biological outcome: abnormal chromosome transmission, apoptosis, or increased risk of cancer.
Retrieval check: A cell has completed DNA replication, but one chromosome is not attached to spindle fibers. Which checkpoint should delay progression, and why? The metaphase/anaphase spindle checkpoint should delay sister-chromatid separation because chromosome attachment has not been verified. A response that instead cites the $G_1/S$ checkpoint has confused the timing and purpose of the checkpoints.
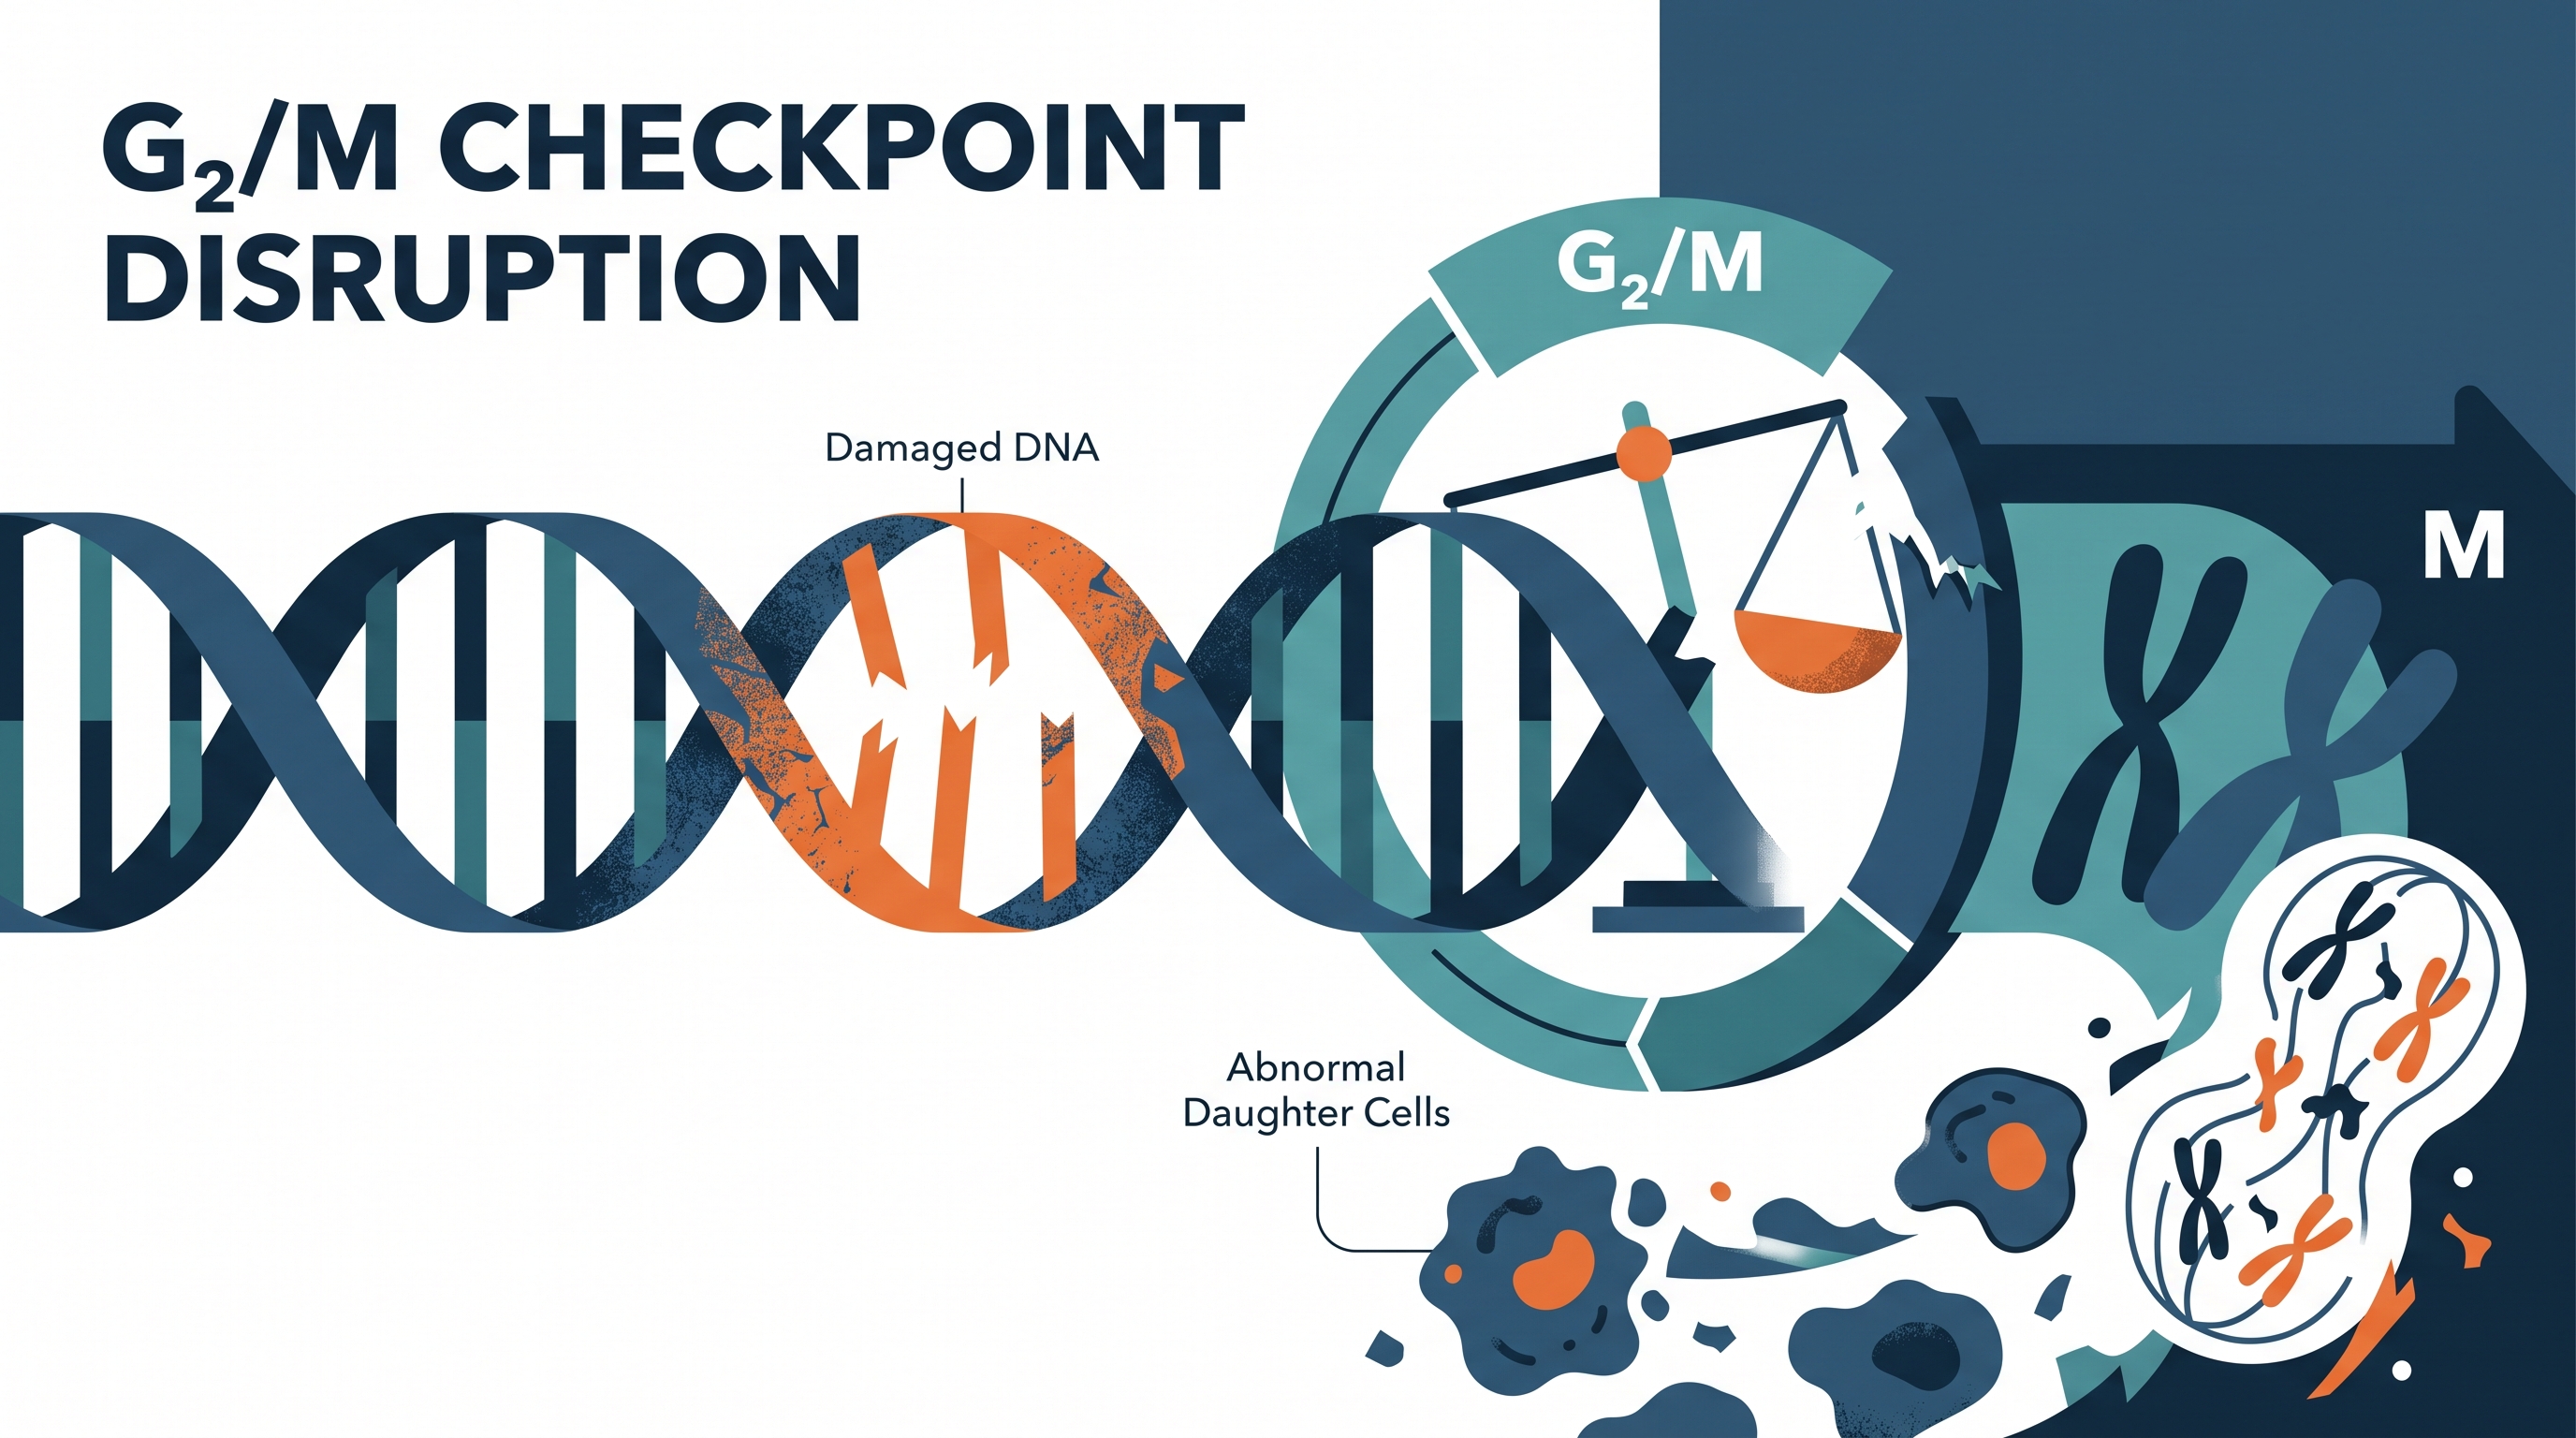
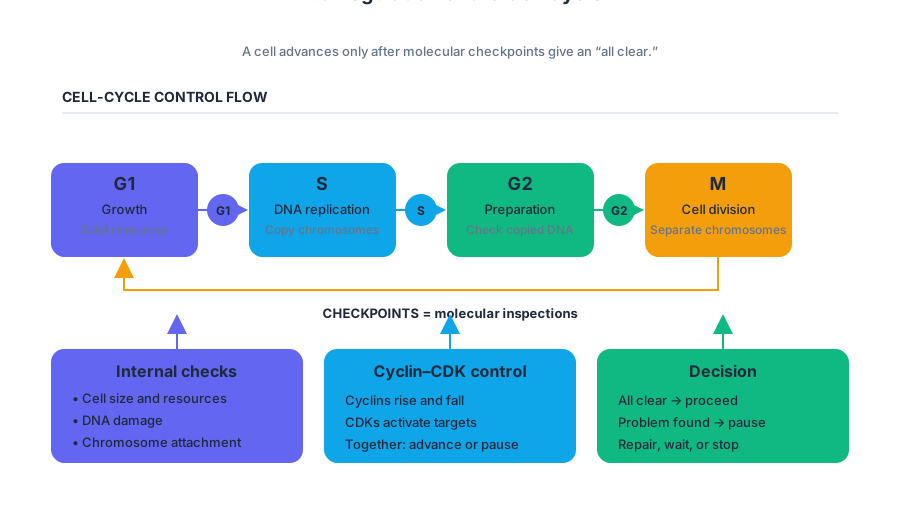
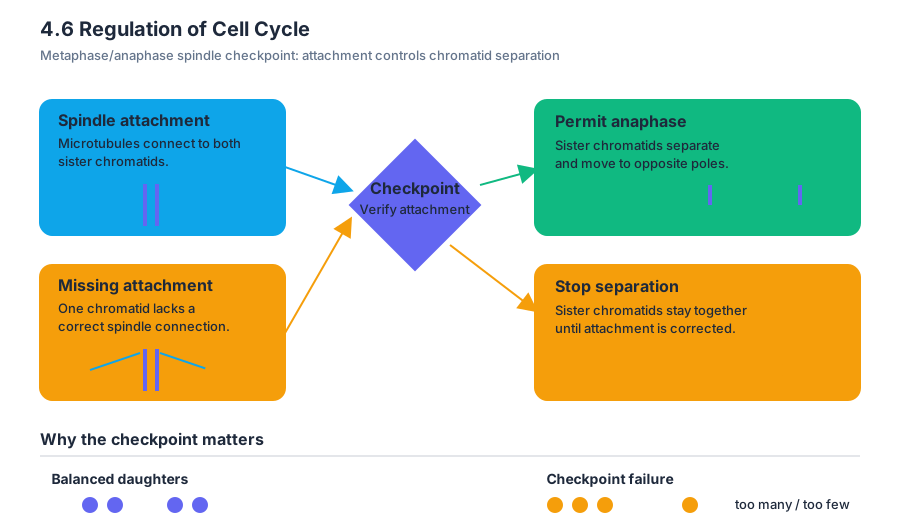
5.1 Meiosis
Key concepts: Meiosis I · Replication of chromosomes · Homologous chromosomes · Crossing over · Independent assortment of chromosomes · Maternal and paternal chromosome assortment · Deviations from Mendel’s model of inheritance · Non-Mendelian inheritance patterns · Sex determination systems not based on X and Y chromosomes · ZW sex determination
A single diploid cell can produce gametes with half as many chromosomes because meiosis separates homologous chromosome pairs through two successive divisions. The process begins with chromosome replication, includes Meiosis I, and ends with haploid cells whose maternal and paternal chromosomes have been reshuffled.
5.1 Meiosis
A single diploid cell can produce gametes with half as many chromosomes because meiosis separates homologous chromosome pairs through two successive divisions. The process begins with chromosome replication, includes Meiosis I, and ends with haploid cells whose maternal and paternal chromosomes have been reshuffled.
Learning Objective 5.1.A: Explain how meiosis results in the formation of haploid gametes.
Chromosome replication prepares the cell for two divisions
Before meiosis begins, each chromosome is copied during the cell cycle’s synthesis phase. The result is not two separate chromosomes yet, but one replicated chromosome consisting of two identical sister chromatids joined at a centromere.
A diploid cell has homologous pairs: one chromosome of each pair came from the mother and the other from the father. These are homologous chromosomes—chromosomes carrying the same types of genes in corresponding locations, although their alleles may differ. Replication creates sister chromatids, but it does not create new homologous pairs.
Meiosis I separates homologous chromosomes
During Meiosis I, homologous chromosomes pair and are then separated into different daughter cells. Sister chromatids remain attached during this first division. Because each daughter cell receives one chromosome from every homologous pair, Meiosis I reduces the chromosome number from diploid to haploid.
During prophase I, homologous chromosomes align closely in a process called synapsis. Non-sister chromatids—one chromatid from the maternal homolog and one from the paternal homolog—can exchange corresponding DNA segments. This exchange is crossing over, and the physical exchange points are called chiasmata.
The key separation rule is therefore:
| Stage | What separates? | Chromosome number |
|---|---|---|
| Before meiosis | Chromosomes replicate; sister chromatids form | Still diploid |
| Meiosis I | Homologous chromosomes separate | Reduced to haploid |
| Meiosis II | Sister chromatids separate | Haploid products remain |
In normal meiosis, homologous chromosomes separate correctly. If both homologs move into the same daughter cell, nondisjunction has occurred. The resulting gametes may contain an extra chromosome or lack one, so they are not correctly haploid.
Maternal and paternal chromosomes assort into different gametes
Each homologous pair aligns independently of the other pairs. This is independent assortment of chromosomes: the maternal or paternal member placed into one daughter cell for one chromosome pair does not determine which member is placed there for another pair.
For example, consider a cell with two homologous pairs, labeled chromosome pair $1$ and chromosome pair $2$. One gamete might receive the maternal copy of pair $1$ and the paternal copy of pair $2$; another might receive the paternal copy of pair $1$ and the maternal copy of pair $2$. This maternal-and-paternal chromosome assortment helps explain why siblings produced by the same parents are genetically different.
Worked example: Suppose a diploid organism has three homologous chromosome pairs. For independent assortment alone, the possible maternal-paternal combinations are $2^3 = 8$. Crossing over creates still more combinations by placing mixtures of maternal and paternal DNA on individual chromosomes.
Why inheritance often departs from simple Mendelian ratios
Mendel’s predicted ratios work best when genes assort independently and each trait is controlled by a simple allele relationship. Many traits do not meet those conditions. Genes located on the same chromosome are genetically linked, so they tend to travel together during meiosis rather than assort independently; crossing over can separate them, and the frequency of separation can be used to estimate map distance.
Other traits are influenced by several genes or by environmental conditions. Quantitative inheritance produces continuously varying phenotypes—such as height or pigment intensity—instead of a few discrete categories. When observed phenotypic ratios differ statistically from predicted ratios, the result may indicate linkage, multiple genes, environmental effects, or another deviation from Mendel’s model.
Misconception check: A trait that does not show a $3:1$ ratio is not automatically “non-genetic.” The ratio may fail because several genes, linked genes, allele interactions, or environmental influences affect the phenotype.
Sex determination is not always based on X and Y chromosomes
Sex-determination systems also demonstrate that inheritance does not follow one universal chromosome pattern. In birds, for example, the ZW system is used: females are typically $ZW$, while males are $ZZ$. The female produces eggs carrying either $Z$ or $W$, whereas the male produces sperm carrying $Z$.
Thus, sex determination need not be based on X and Y chromosomes. Other organisms use different systems, including haplodiploidy in bees, in which chromosome number rather than an X-Y pair helps determine sex.
In-flow retrieval check
A replicated chromosome contains two sister chromatids, but homologous chromosomes are maternal-paternal partners. Which event reduces chromosome number: crossing over, separation of sister chromatids, or separation of homologous chromosomes? Answer: separation of homologous chromosomes during Meiosis I. If both homologs move together, nondisjunction can produce a gamete with an abnormal chromosome number.
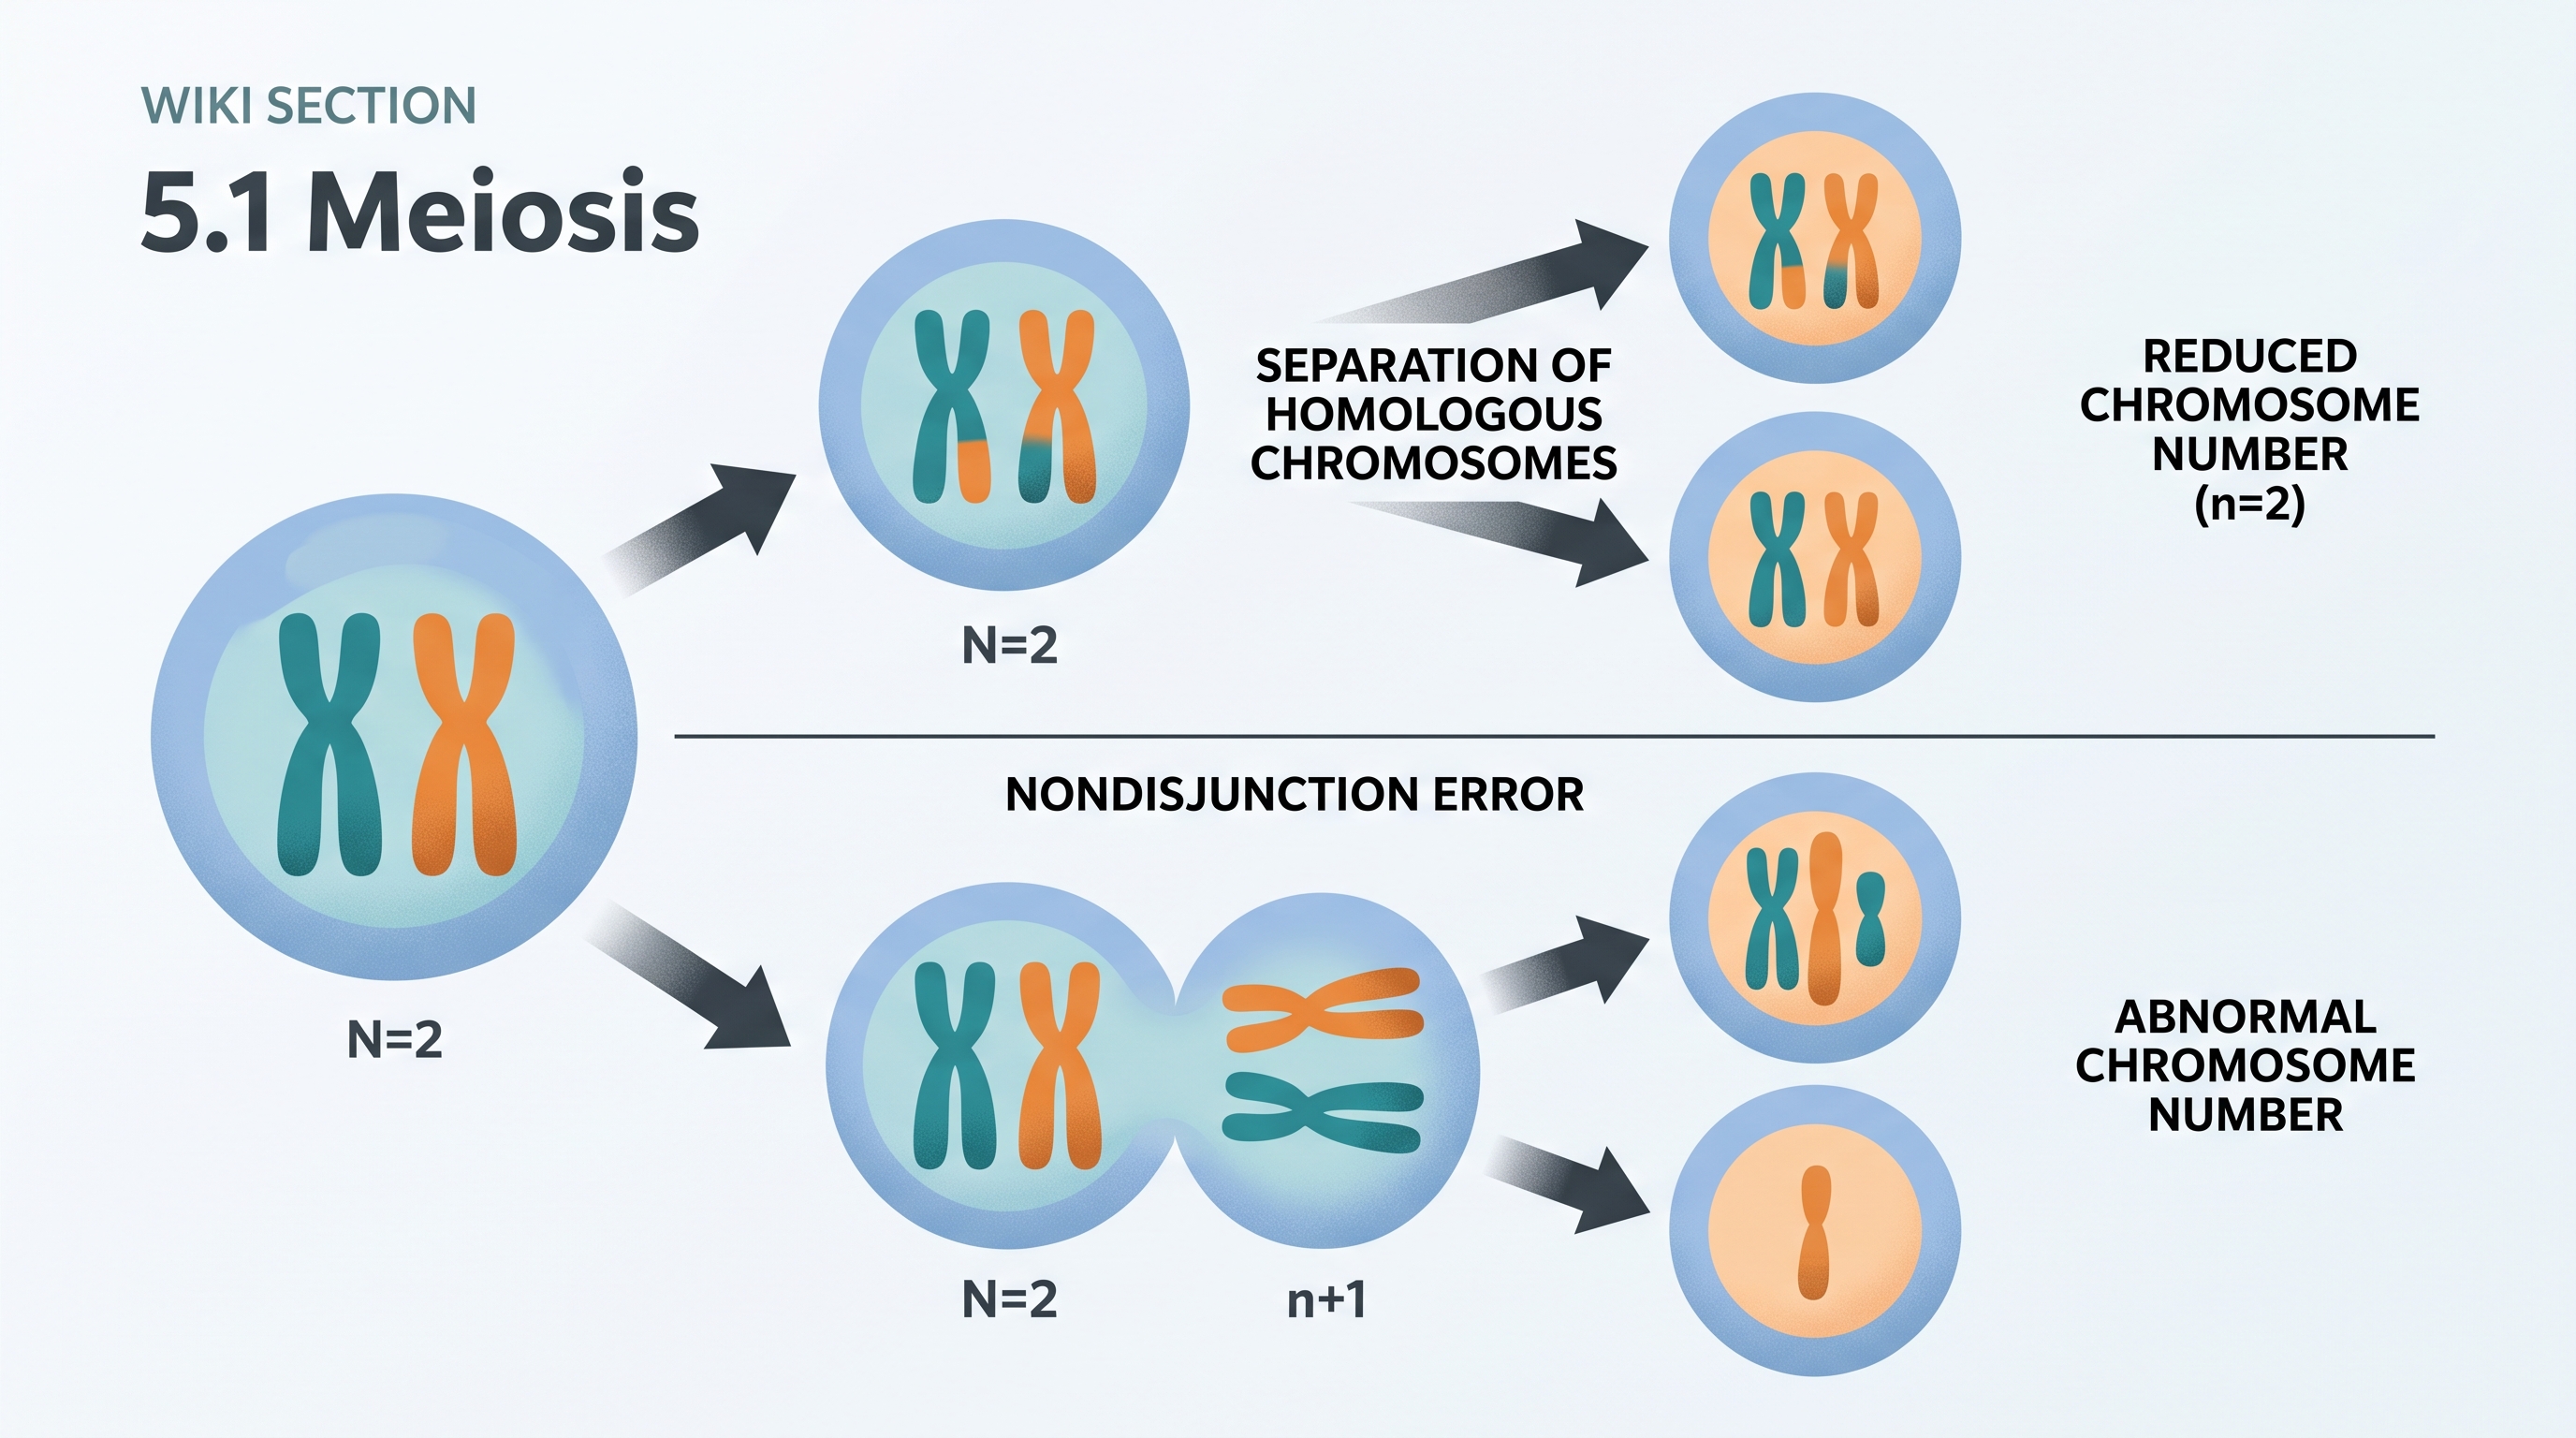
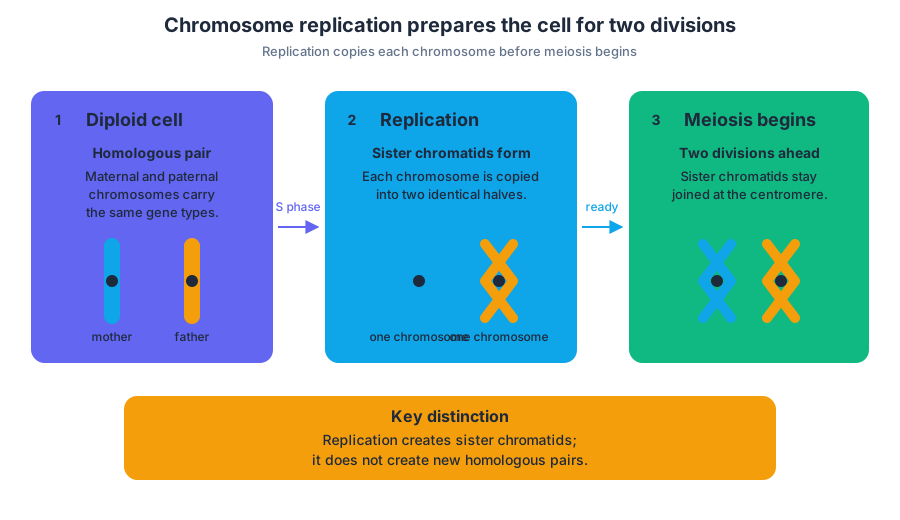
5.2 Meiosis and Genetic Diversity
Key concepts: Meiosis as a source of genetic diversity · Crossing over (recombination) between nonsister chromatids of homologous chromosomes · Random assortment of chromosomes during meiosis · Genetic variation produced by meiosis · The role of genetic diversity in population responses to environmental change
A single offspring can receive a chromosome combination that neither parent has ever carried because meiosis reshuffles genetic information before fertilization. This reshuffling is not random damage: it follows recognizable mechanisms that produce genetically varied gametes.
5.2 Meiosis and Genetic Diversity
A single offspring can receive a chromosome combination that neither parent has ever carried because meiosis reshuffles genetic information before fertilization. This reshuffling is not random damage: it follows recognizable mechanisms that produce genetically varied gametes.
Big Idea 3: Information Storage and Transmission applies here because chromosomes store genetic information, and meiosis transmits that information into gametes while generating new combinations. The central learning objective is 5.2.A: Explain how the process of meiosis generates genetic diversity.
5.2.A.1: Correct separation of homologous chromosomes in meiosis I and sister chromatids in meiosis II gives each gamete a haploid set, $1n$, containing an assortment of maternal and paternal chromosomes.
Three sources of variation
Meiosis creates genetic diversity through three connected mechanisms: crossing over, random assortment of chromosomes, and the later random fertilization of gametes. The first two occur during meiosis; fertilization adds another layer when one sperm and one egg combine.
Crossing over: exchanging segments
During prophase I, homologous chromosomes pair. A homologous pair contains one chromosome inherited through the maternal lineage and one through the paternal lineage; they carry the same kinds of genes, although their versions of those genes may differ.
Crossing over, also called recombination, occurs when DNA segments are exchanged between nonsister chromatids of homologous chromosomes. Nonsister chromatids belong to different homologs, not to the identical-copy chromatids of the same duplicated chromosome. The exchange creates chromatids with new combinations of genetic information.
Worked example: Suppose one homolog carries alleles $A$ and $B$ on the same chromatid, while the other carries $a$ and $b$. Before crossing over, the parental combinations are $AB$ and $ab$. If nonsister chromatids exchange a segment between the two genes, recombinant combinations such as $Ab$ and $aB$ can result. The alleles themselves were not necessarily newly created; their arrangement is new.
Misconception check — “Crossing over occurs between sister chromatids.”
Sister chromatids are near-identical copies produced before meiosis. The diversity-producing exchange emphasized in 5.2.A.2 occurs between nonsister chromatids of homologous chromosomes during prophase I.
Random assortment: distributing homologs
At metaphase I, each homologous pair lines up independently of the other pairs. Which homolog faces one pole is not determined by whether it came from the mother or father. As a result, the gamete receives a mixture of maternal- and paternal-origin chromosomes.
For two homologous chromosome pairs, independent orientation can produce four chromosome-origin combinations: maternal–maternal, maternal–paternal, paternal–maternal, and paternal–paternal. With more chromosome pairs, the number of possible combinations increases rapidly. Crossing over makes the chromosomes themselves more varied, while random assortment varies which chromosomes travel together.
5.2.A.3: Sexual reproduction in eukaryotes increases genetic variation through crossing over, random assortment of chromosomes during meiosis, and subsequent fertilization of gametes.
Accurate separation matters
Genetic diversity depends on ordinary chromosome separation working correctly. Homologous chromosomes must separate in meiosis I, and sister chromatids must separate in meiosis II. Nondisjunction—incorrect separation—can produce gametes that are not haploid, so it changes chromosome number rather than serving as the normal mechanism of genetic variety described by crossing over and assortment.
A useful distinction is:
| Mechanism | What changes? | Result |
|---|---|---|
| Crossing over | DNA segments between nonsister chromatids | New combinations within chromosomes |
| Random assortment | Which maternal or paternal homolog enters a gamete | Different chromosome combinations |
| Fertilization | Which gametes unite | A unique offspring combination |
| Nondisjunction | Accuracy of chromosome separation | Gametes with abnormal chromosome number |
Why diversity helps populations
Genetic diversity gives a population a broader set of inherited characteristics. If an environmental pressure changes—such as drought, a new pathogen, or altered temperature—individuals may differ in how well they survive and reproduce. A population containing more variation has a greater chance that some individuals possess combinations suited to the new conditions.
This does not mean that meiosis deliberately produces the trait a population needs. Meiosis generates combinations before the environmental pressure acts; the environment influences which existing variants leave more offspring. In this way, meiotic diversity supplies variation that can affect a population’s response to environmental change.
AP skill connections:
- Science Practice 1: Concept Explanation, especially 1.A, is used to explain how each meiotic mechanism produces variation.
- Science Practice 2: Visual Representations, especially 2.A, is used to interpret chromosome diagrams showing homologs, nonsister chromatids, and recombinant products.
- Science Practice 4: Representing and Describing Data, especially 4.A, is used when comparing the frequency or variety of meiotic outcomes.
- Science Practice 6: Argumentation, especially 6.A, is used to support a claim that genetic diversity can influence population responses to environmental pressures with evidence and biological reasoning.
The AP Biology Lab Manual includes a related Meiosis Lab resource. Models using chromosomes or Sordaria asci can make crossing over visible: track chromosome segments before and after exchange, then ask how many distinct gamete types could result.
Retrieval check
A homologous pair contains one maternal-origin chromosome and one paternal-origin chromosome. If a diagram shows DNA exchanged between two chromatids belonging to different homologs, identify the mechanism and explain in one sentence how it increases diversity. Then distinguish that mechanism from random assortment: does it change DNA combinations within a chromosome, or which chromosomes enter the same gamete?
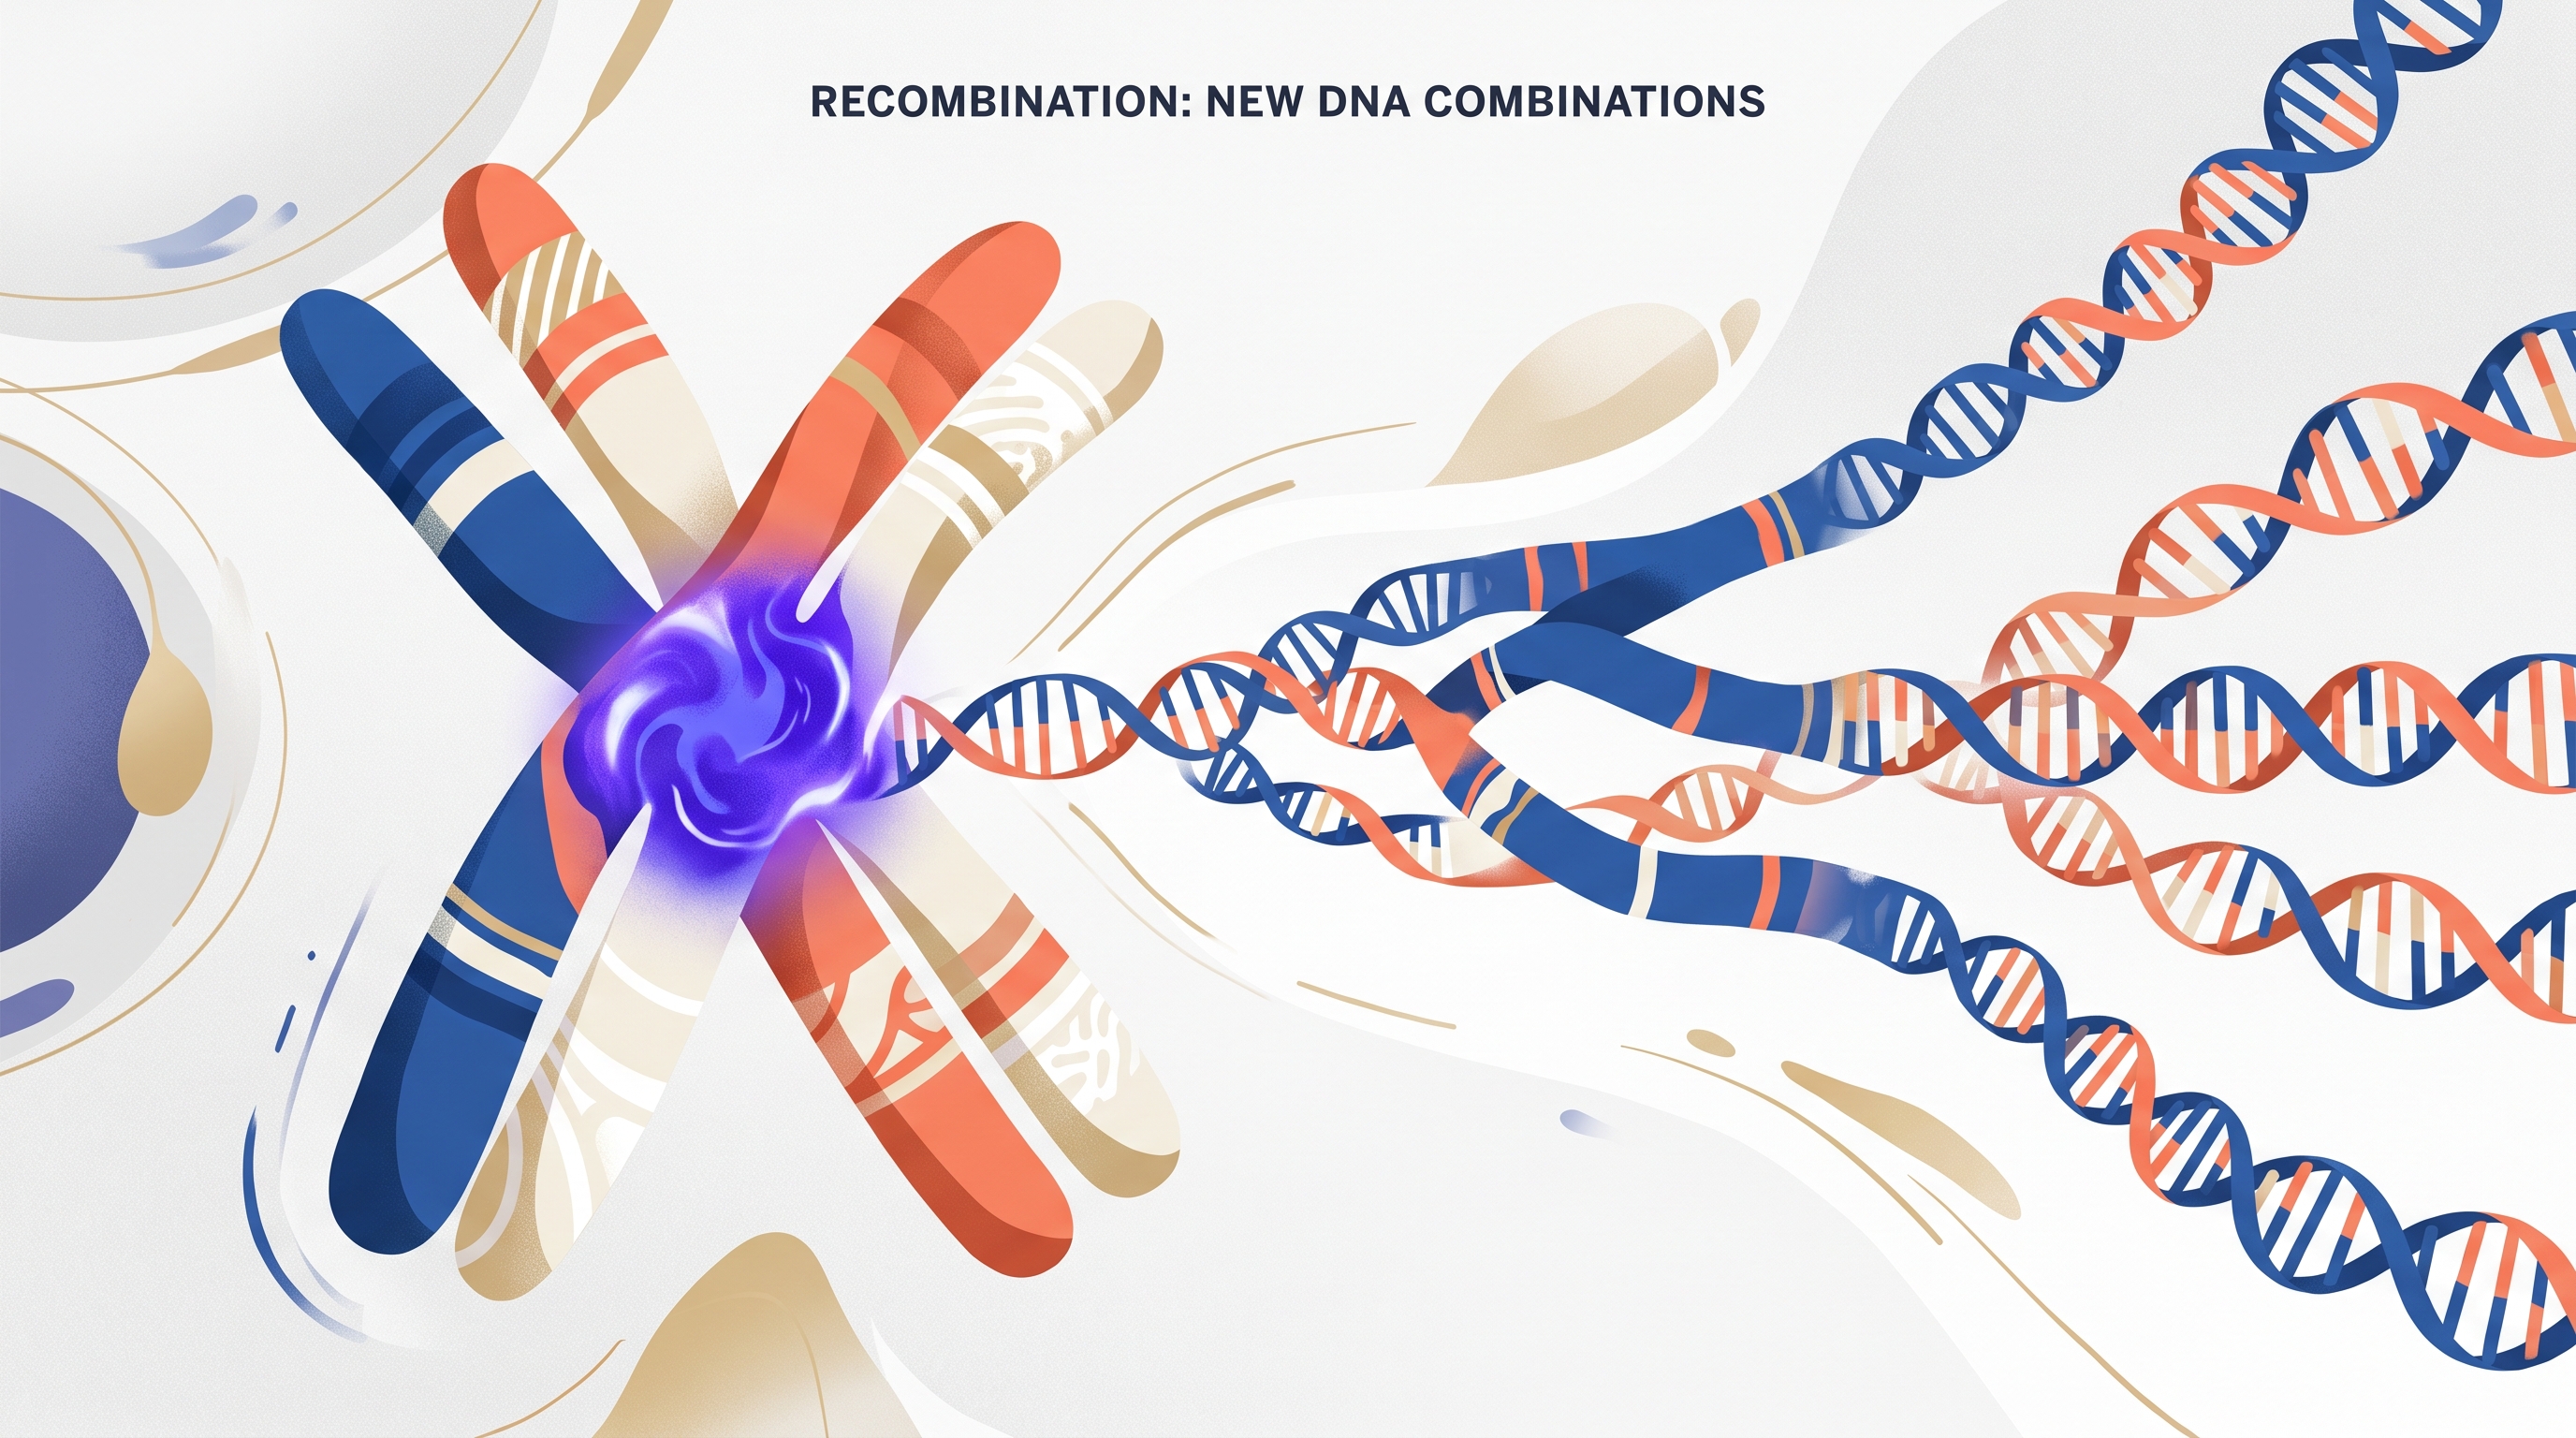
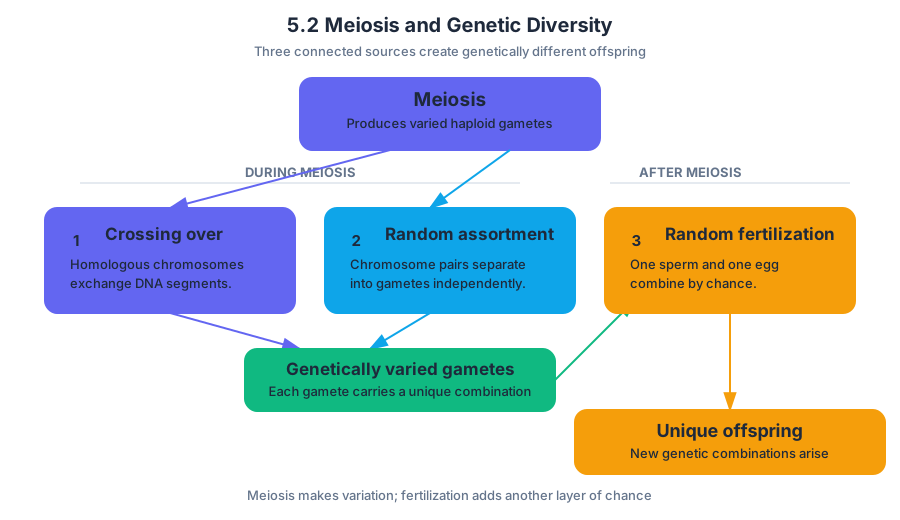
5.3 Mendelian Genetics
Key concepts: Mendelian genetics · Alleles and genes · Dihybrid crosses · Heterozygosity · Phenotypes and contrasting traits · Artificial selection · Quantitative traits · F2 generation · Allele frequencies · Population genetics and evolution
A single Fast Plant can carry two different alleles for each of two traits while displaying only one phenotype, making heredity visible in a classroom-sized population.
5.3 Mendelian Genetics
A single Fast Plant can carry two different alleles for each of two traits while displaying only one phenotype, making heredity visible in a classroom-sized population.
Mendelian genetics explains how discrete heritable traits are transmitted through alternative forms of genes called alleles. A gene is a stretch of DNA associated with a biological characteristic; alleles are different versions of that gene. An organism with two different alleles is heterozygous, whereas an organism with two identical alleles is homozygous.
Fast Plant seed stock C1-122 is heterozygous for two Mendelian traits:
- leaf color: green versus light green;
- stem color: purple, produced by the pigment anthocyanin, versus green, lacking anthocyanin.
The plant’s observable characteristics are its phenotype. Its allele combination is its genotype. A heterozygous plant may possess one allele associated with green leaves and one associated with light-green leaves, yet show only one leaf-color phenotype if one allele is dominant. Dominance describes the phenotype of a heterozygote; it does not mean that the dominant allele is stronger, more common, or more beneficial.
The dihybrid cross
A dihybrid cross follows the inheritance of two genes at the same time. Represent the two genes with allele pairs such as $G/g$ for leaf color and $P/p$ for stem color. If a C1-122 plant is heterozygous for both genes, its genotype can be written $GgPp$.
Because the two allele pairs separate during gamete formation, the possible gametes are $GP$, $Gp$, $gP$, and $gp$. If two $GgPp$ plants are crossed, each parent can produce all four gamete types. Assuming the genes assort independently and the traits show complete dominance, the expected F$_2$ phenotype ratio is:
$$9\text{ dominant for both}:3\text{ dominant leaf, recessive stem}:3\text{ recessive leaf, dominant stem}:1\text{ recessive for both}$$
For example, if purple stems and green leaves are dominant, the $9$ category would contain plants with green leaves and purple stems, while the $1$ category would contain plants with light-green leaves and green stems. The ratio is a probability prediction for a large offspring group, not a guarantee for every family. Small samples can depart substantially from $9:3:3:1$ by chance.
Worked example: predicting one F$_2$ outcome
Suppose the cross is $GgPp \times GgPp$. The probability that an offspring has light-green leaves is $1/4$, and the probability that it has green stems without anthocyanin is $1/4$. Under independent assortment, the probability of both recessive phenotypes is:
$$\frac{1}{4}\times\frac{1}{4}=\frac{1}{16}$$
In a group of $160$ F$_2$ plants, the expected number with both recessive phenotypes is therefore:
$$160\times\frac{1}{16}=10$$
An observed count of $8$ or $12$ would not automatically disprove the model. The appropriate question is whether the difference between observed and expected counts is larger than random sampling variation, often tested with a chi-square analysis.
Mendelian genetics versus artificial selection
The C1-122 investigation combines two studies that must not be confused. The leaf-color and stem-color traits form a Mendelian dihybrid cross, involving distinct phenotype categories. Hairiness is a quantitative trait, meaning that individuals vary along a measurable scale rather than fitting neatly into a few contrasting classes.
To study artificial selection, students can select the top $10%$ of plants for hairiness as parents of the next generation. The remaining plants can continue growing; in fact, the approximately $90%$ not selected for hairiness can be used to produce an F$_2$ generation. Comparing the hairiness distributions with histograms reveals whether the selected group differs from the original population.
Artificial selection occurs when humans choose which organisms reproduce. It can change allele frequencies if the selected phenotype is heritable. This differs from the Mendelian cross: the cross tests predicted inheritance patterns, whereas selection changes which alleles become more represented in later generations.
From inheritance to changing allele frequencies
Mendelian genetics predicts how parental genotypes produce offspring genotypes and phenotypes. Population genetics asks a broader question: how do allele frequencies change across generations? Natural selection is a major mechanism of evolution, but mutation can introduce new alleles and migration can move alleles between populations.
Let $p$ represent the frequency of one allele and $q$ the frequency of the alternative allele:
$$p+q=1$$
Under random mating, the expected genotype frequencies are:
$$p^2+2pq+q^2=1$$
Here, $p^2$ represents one homozygous genotype, $2pq$ the heterozygous genotype, and $q^2$ the other homozygous genotype. These values describe population-level expectations, not the genotype of one particular plant.
A useful visual model is a square whose side length is divided into segments of magnitude $p$ and $q$. The four areas are $p^2$, $pq$, $qp$, and $q^2$; combining the two mixed rectangles gives $2pq$. If artificial selection favors hairier plants, the next generation may no longer match these starting frequencies because reproduction is not random with respect to the trait.
Misconception check — “Dominant means common.” A dominant allele can be rare, and a recessive allele can be common. Dominance concerns the phenotype of a heterozygote; allele frequency concerns how often an allele occurs in the population.
Retrieval check: A $GgPp$ plant is crossed with another $GgPp$ plant. What fraction of offspring is expected to show both recessive phenotypes under independent assortment, and why can the observed fraction differ in a small sample?
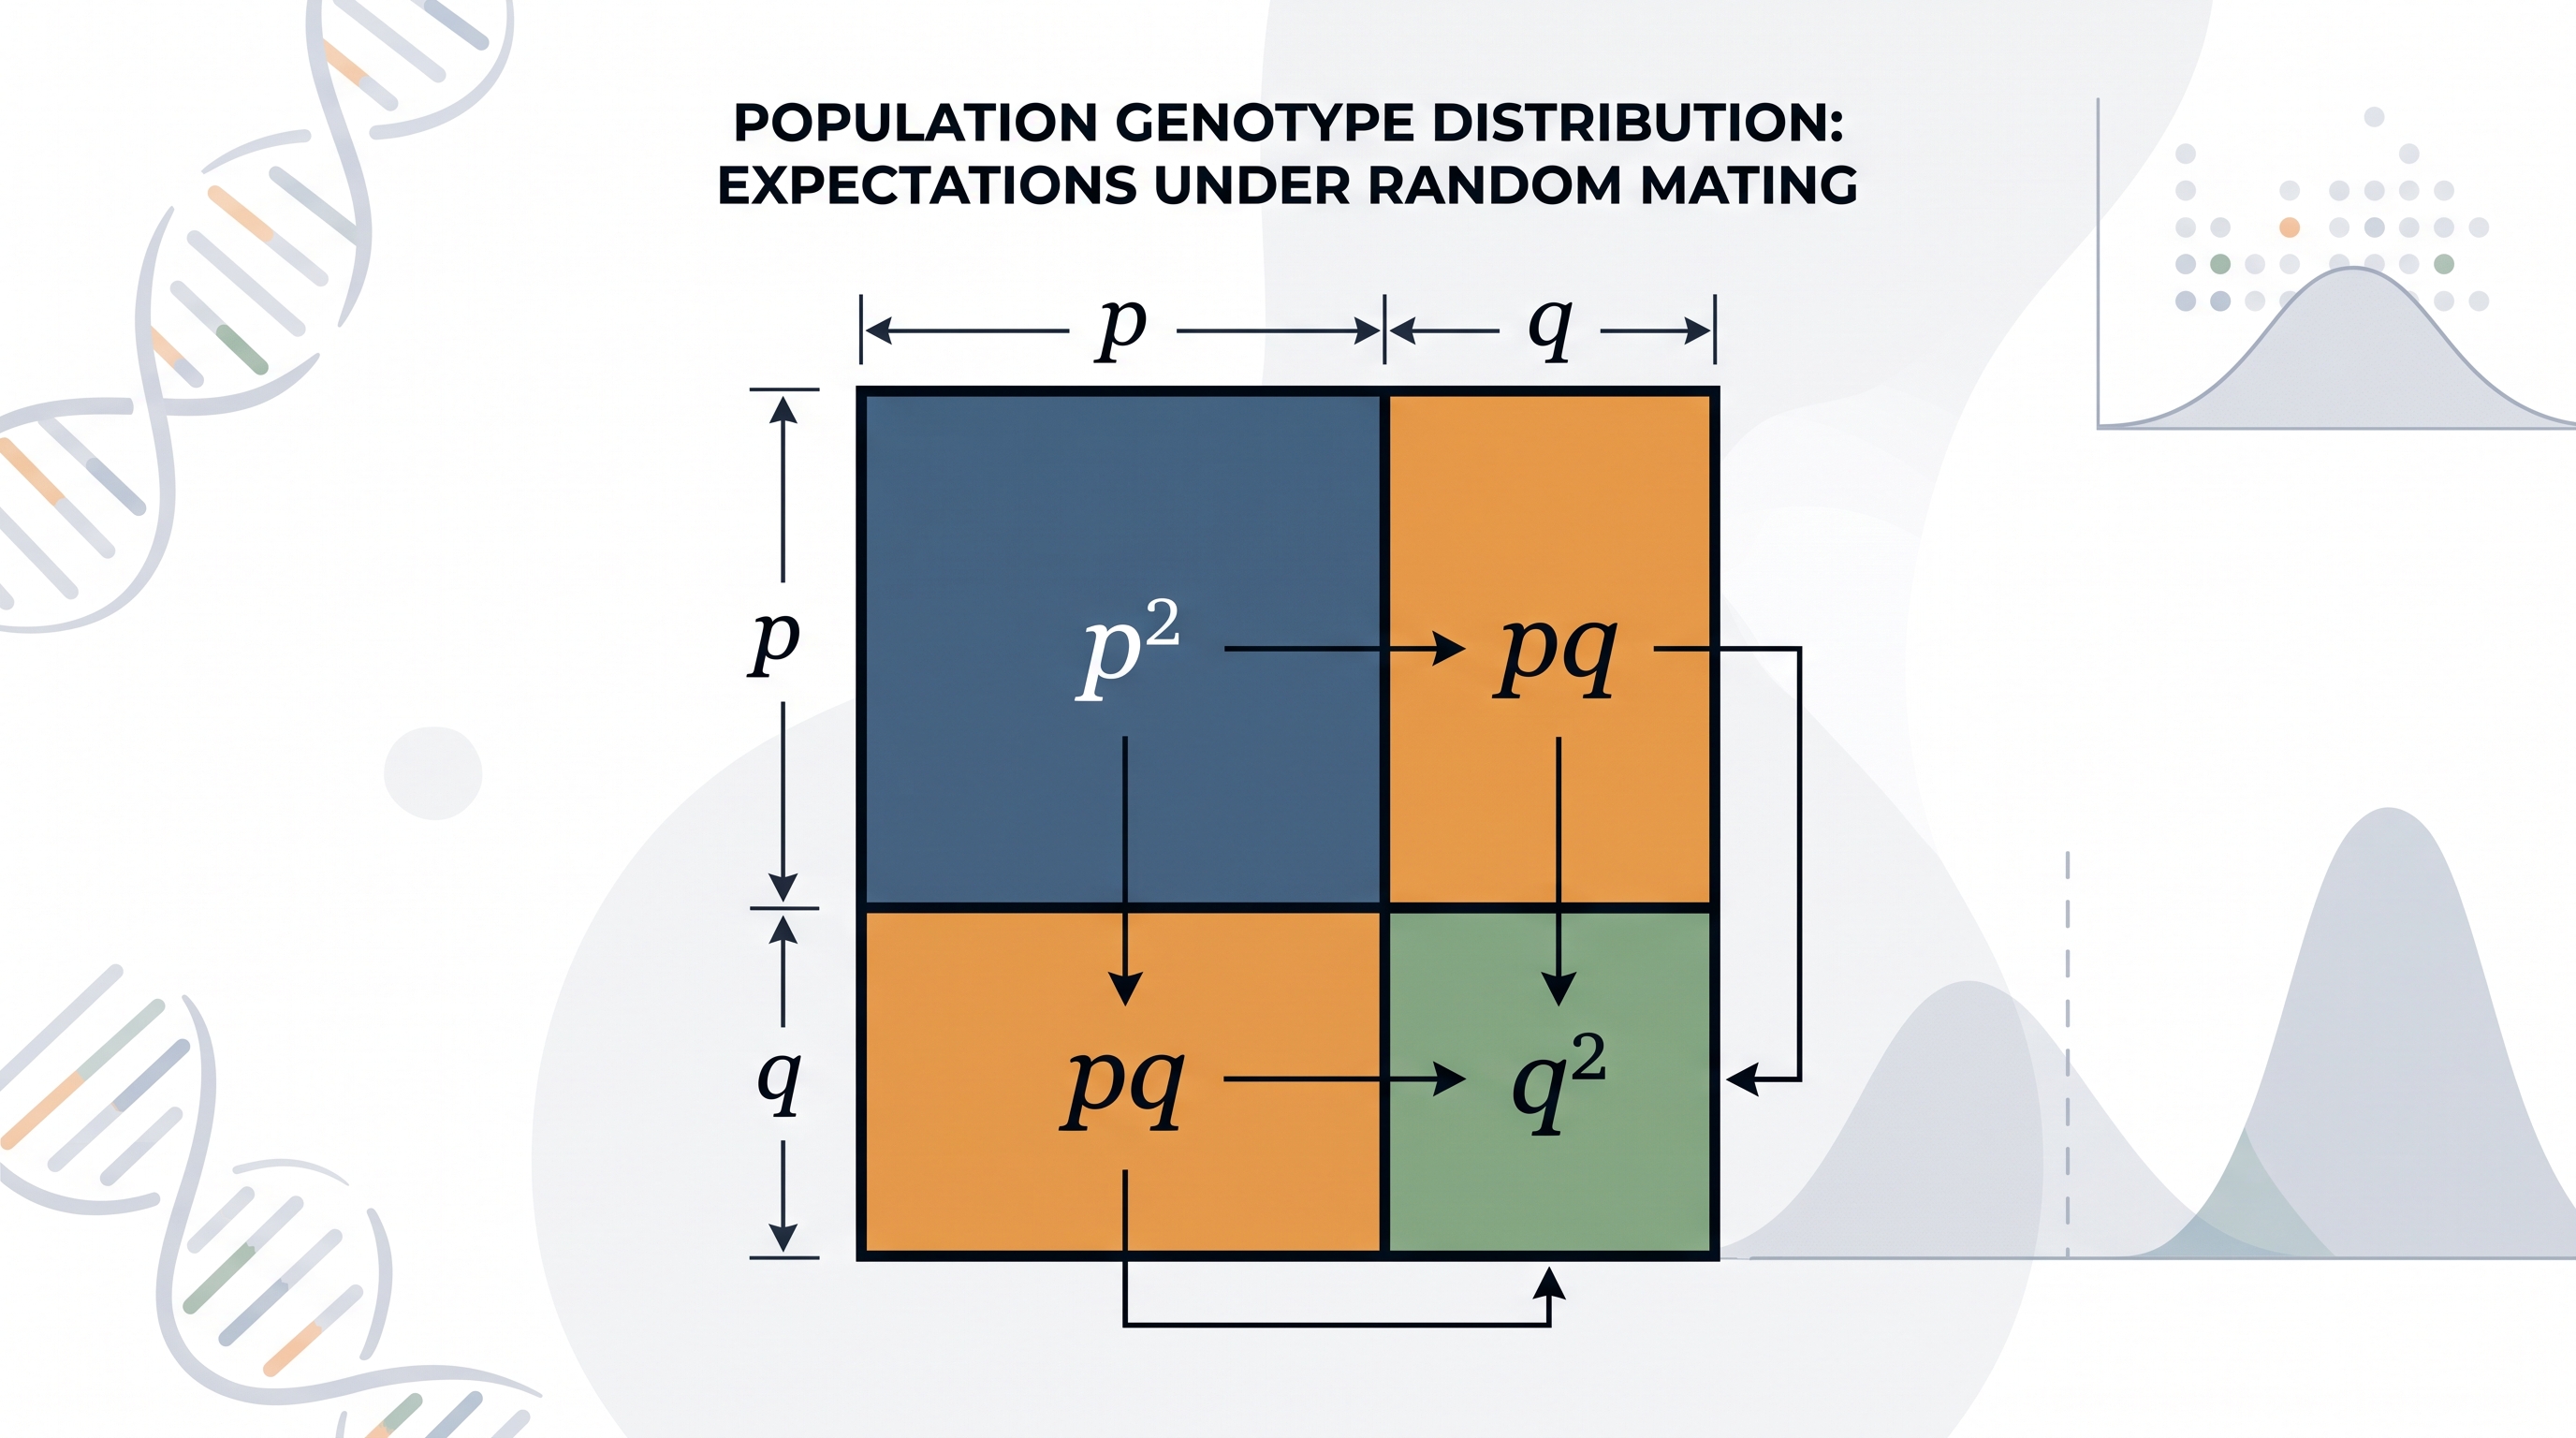
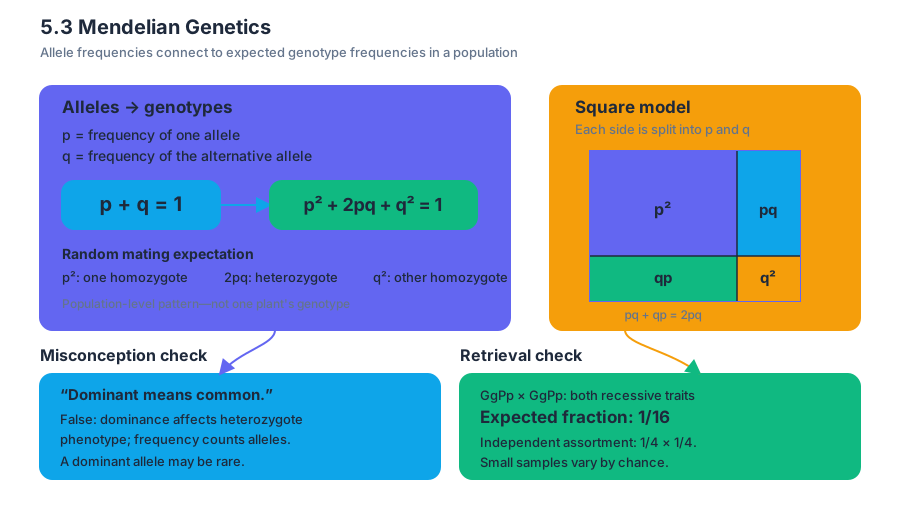
5.4 Non-Mendelian Genetics
Key concepts: Non-Mendelian genetics · Traits that do not segregate independently
A trait can fail to follow Mendel’s expected ratios even when the DNA is inherited normally, because genes may interact, travel together, or reside outside the nucleus.
5.4 Non-Mendelian Genetics
A trait can fail to follow Mendel’s expected ratios even when the DNA is inherited normally, because genes may interact, travel together, or reside outside the nucleus. Non-Mendelian genetics describes inheritance patterns that cannot be explained by treating one gene as an independently assorting unit with two alleles and a simple dominant–recessive relationship.
Learning Objective 5.4.A: Explain deviations from Mendel’s model of the inheritance of traits.
Essential Knowledge 5.4.A: Some traits do not segregate independently.
Why traits depart from simple Mendelian patterns
Mendel’s model works best when genes are on different chromosomes, alleles show a clear dominance relationship, and nuclear chromosomes are distributed predictably during meiosis. Several biological conditions violate one or more of these assumptions.
The most important distinction is between gene interaction and gene transmission:
- Gene interaction: the products of genes influence several traits or combine to produce one phenotype.
- Linked inheritance: genes located near one another on the same chromosome tend to travel together.
- Sex-linked inheritance: a gene lies on a sex chromosome, so its transmission differs between sexes.
- Non-nuclear inheritance: DNA in mitochondria or chloroplasts contributes to the phenotype.
Pleiotropy: one gene, several effects
Pleiotropy occurs when one gene affects multiple phenotypic traits. The traits are connected because they depend on the same gene product or on different effects of the same biological pathway; they are not independent outcomes controlled by unrelated genes.
For example, a mutation in a gene required for producing or transporting a structural protein could affect connective tissue strength, blood-vessel integrity, and skeletal development at the same time. A single inherited allele therefore produces a cluster of phenotypic effects.
Misconception check: Pleiotropy does not mean that one gene has several alleles. It means that one gene influences several traits.
Interpretation check: If one mutation causes both abnormal pigmentation and reduced vision, is this automatically evidence for two genes? No. It could be pleiotropy if one gene or its product affects both biological processes.
Linked genes do not assort independently
Genes positioned on the same chromosome are called linked genes. Because a chromosome is passed as a physical unit during meiosis, linked genes tend to be inherited together rather than assorting independently. Crossing over can separate them, but genes that are closer together are less likely to be separated than genes farther apart.
A useful prediction follows: linked genes produce more parental combinations of alleles and fewer recombinant combinations than independent assortment would predict. Thus, an unexpected excess of parental phenotypes can reveal linkage.
Worked example: Suppose a heterozygous organism carries chromosome arrangements $AB/ab$. If the genes assort independently, gametes $AB$, $ab$, $Ab$, and $aB$ are expected in roughly equal proportions. If the genes are linked, $AB$ and $ab$ gametes will be more common because the original allele combinations usually remain together. A smaller number of $Ab$ and $aB$ gametes results from crossing over.
Sex-linked inheritance
Sex-linked genes are located on sex chromosomes. Their inheritance patterns differ between sexes because the sexes may carry different numbers or combinations of those chromosomes. For an X-linked gene, an individual with only one X chromosome has no second X-linked allele that could mask a recessive allele; this affects expected phenotype frequencies.
Do not confuse sex-linked with sex-influenced. A sex-linked gene is located on a sex chromosome. A sex-influenced trait is controlled by genes that may be on autosomes but expressed differently in different physiological environments.
Non-nuclear inheritance
Non-nuclear inheritance occurs when traits are determined partly or entirely by DNA outside the nucleus. Mitochondria and chloroplasts contain their own genomes. These organelles are distributed to daughter cells and gametes in ways that do not follow the chromosome-by-chromosome pattern of nuclear inheritance.
In animals, mitochondria are usually transmitted through the egg rather than the sperm. Mitochondrial traits are therefore typically maternally inherited: affected mothers may transmit the trait to their offspring, whereas affected fathers generally do not transmit mitochondrial DNA.
In plants, mitochondria and chloroplasts are transmitted through the ovule rather than pollen. Consequently, traits determined by mitochondrial or chloroplast DNA are also typically maternally inherited.
Essential Knowledge 5.4.A.4: Some traits result from non-nuclear inheritance.
Misconception check: “Maternally inherited” does not mean that the trait is caused by a gene on the mother’s nuclear chromosomes. It means the relevant organelle DNA usually comes from the maternal gamete.
AP Biology reasoning tools
This topic most directly uses Science Practice 1: Concept Explanation, especially 1.A Describe biological concepts and processes and 1.B Explain biological concepts and processes; Science Practice 2: Visual Representations, especially 2.A Describe characteristics of a representation and 2.B Explain relationships among different characteristics of a representation; and Science Practice 6: Argumentation, especially 6.A Make a scientific claim, 6.B Support a claim with evidence, and 6.C Provide reasoning to justify a claim. On an exam, these skills appear when you identify an inheritance pattern from a pedigree or cross, interpret a chromosome diagram, or justify why observed offspring proportions depart from Mendelian expectations.
Retrieval check: A trait appears in offspring of affected mothers but not affected fathers, and the pattern follows the maternal line across generations. Which explanation is strongest: linked nuclear inheritance, mitochondrial inheritance, or independent assortment? Mitochondrial inheritance, because organelle DNA is typically transmitted through the egg.
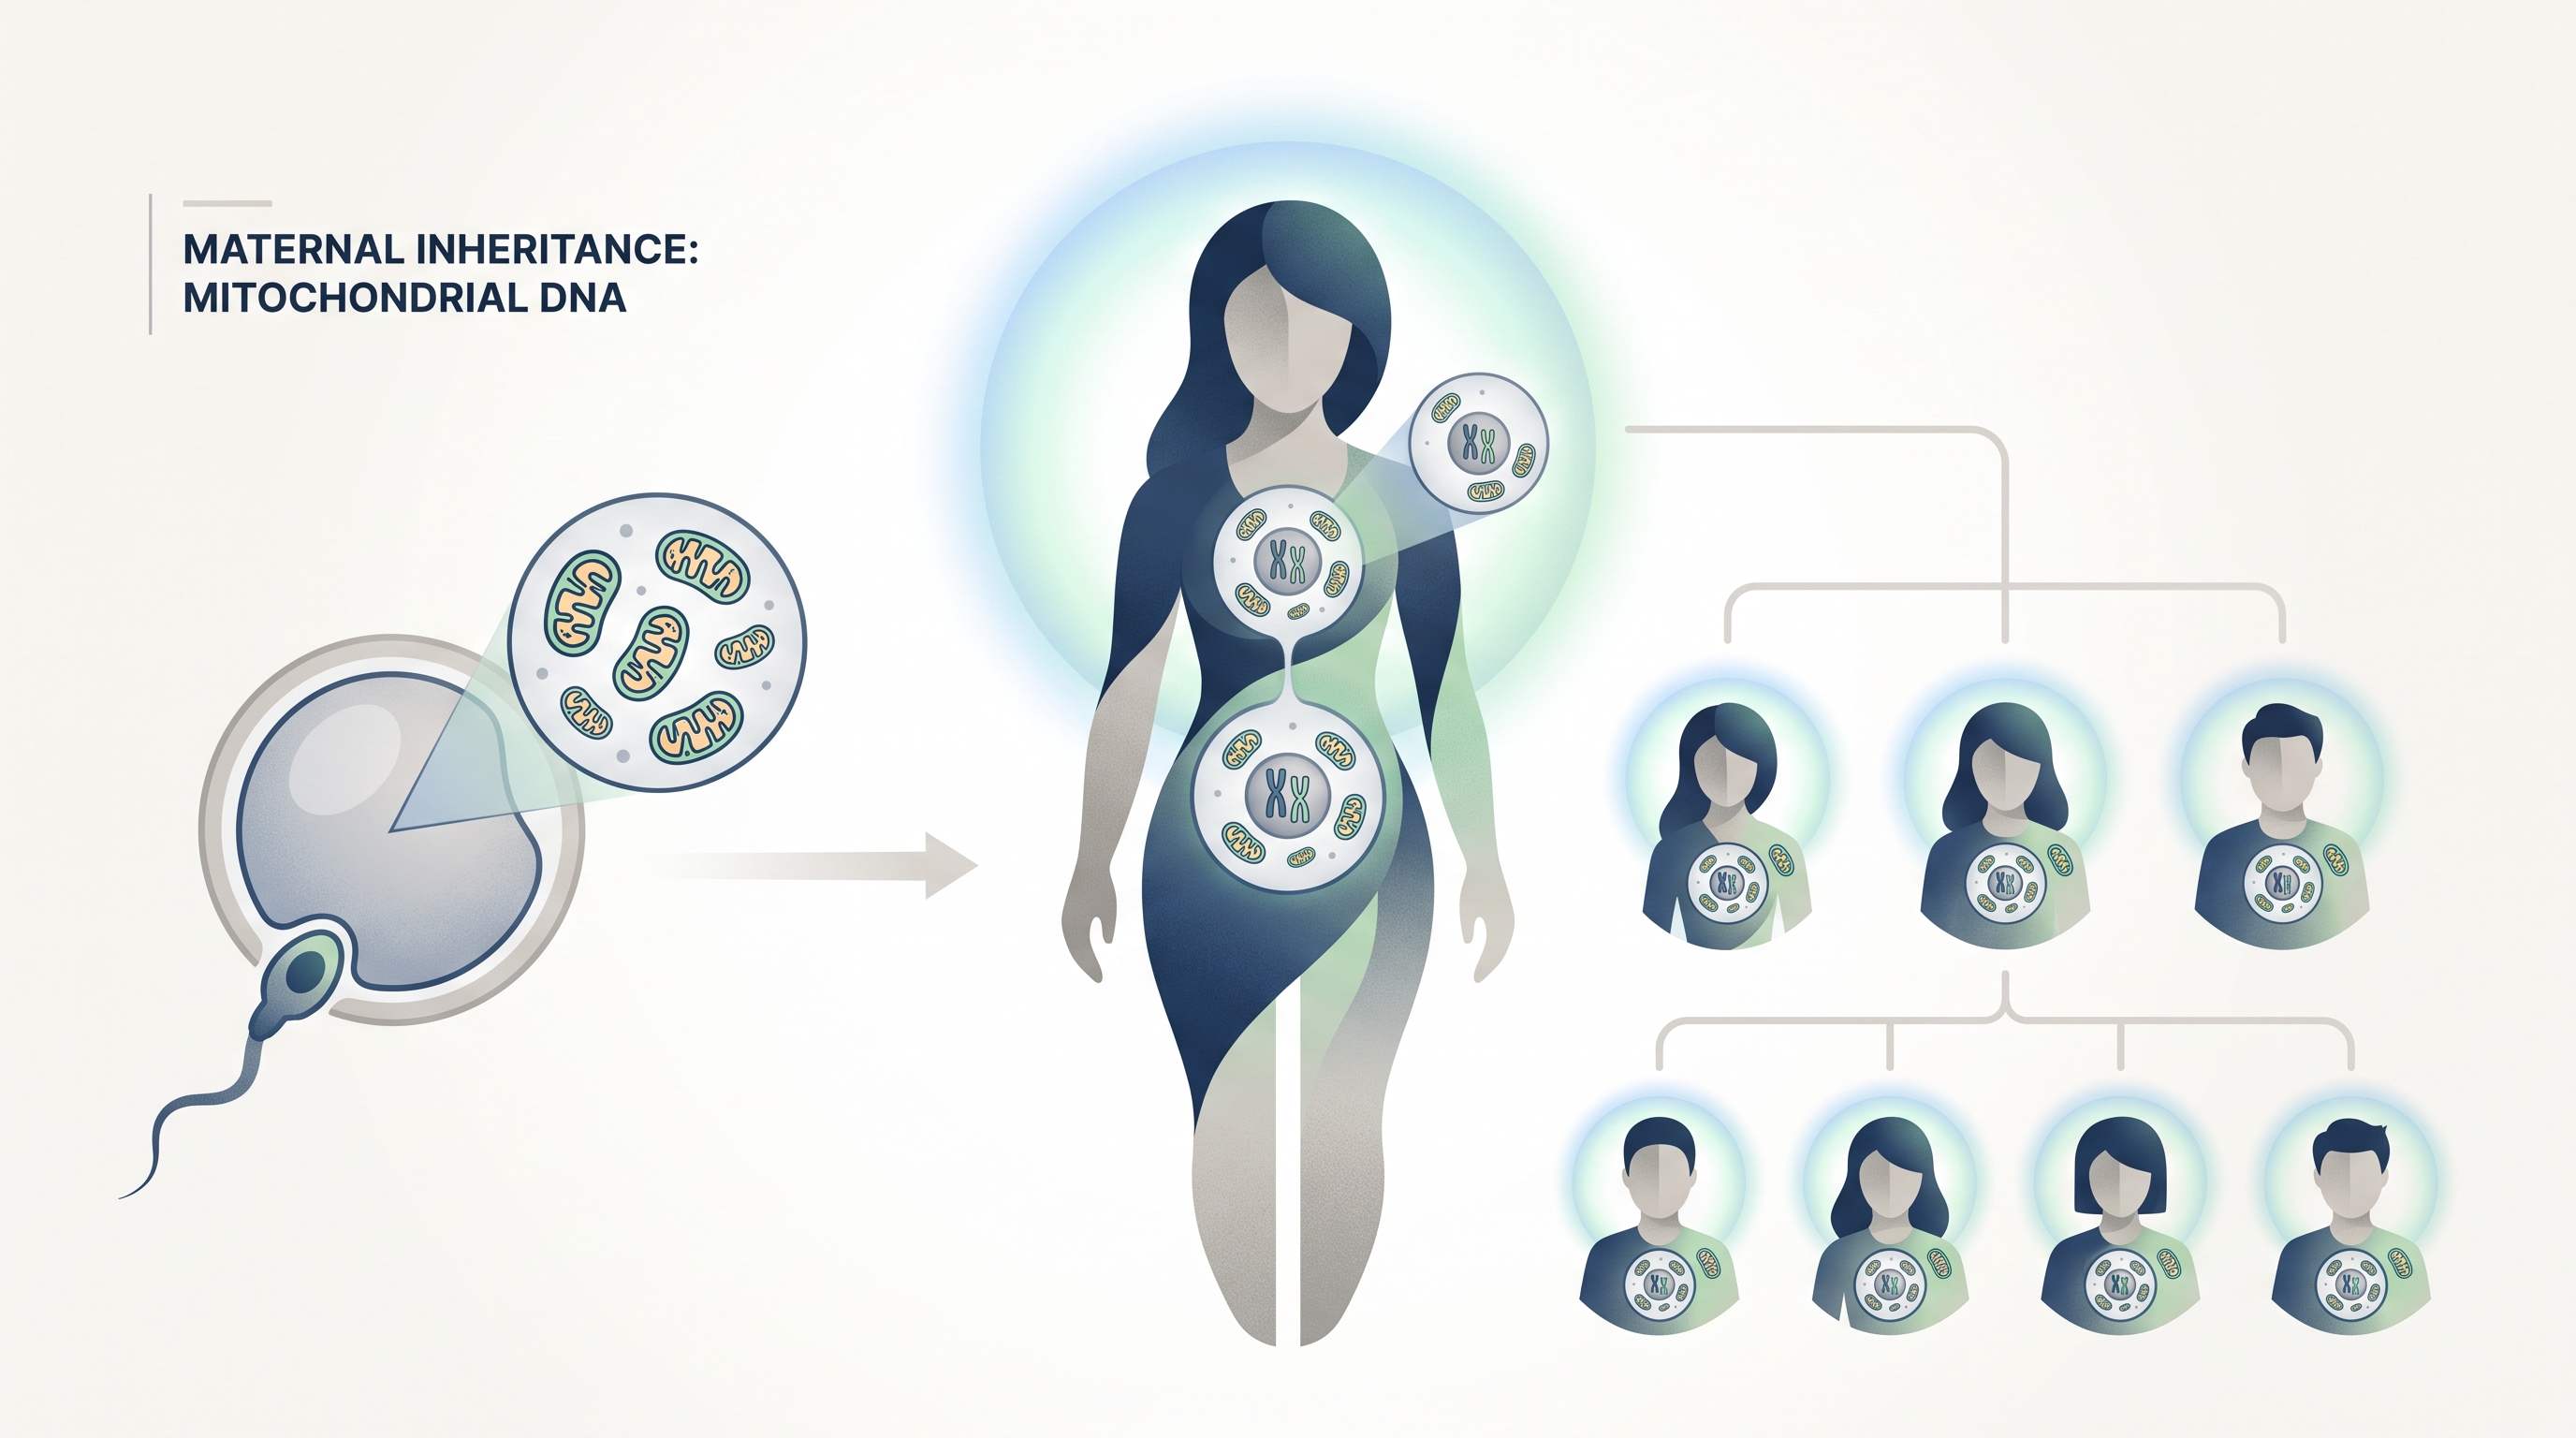
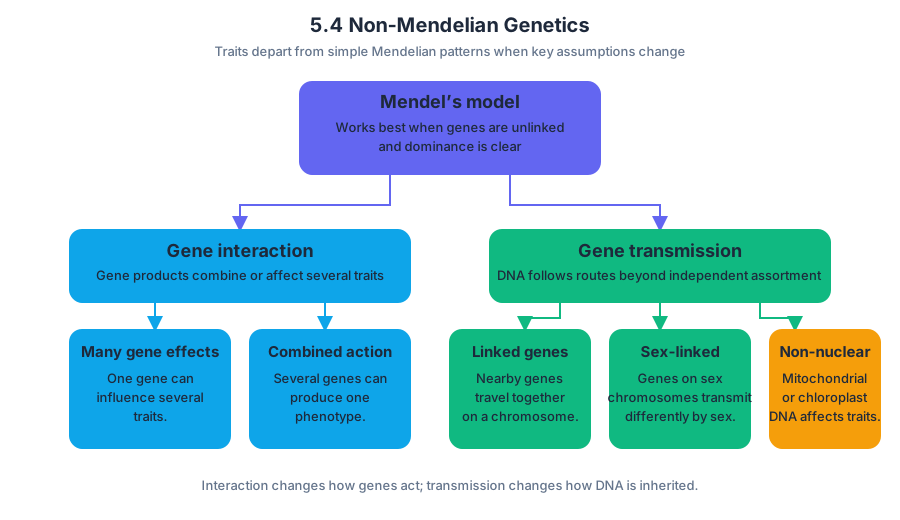
5.5 Environmental Effects on Phenotype
Key concepts: Environmental factors influence phenotype and biological processes · Soil pH can affect flower color · Herbivory can elicit a plant response · Phototactic and chemotactic responses may interact · Environmental factors affect plant growth and productivity · Environmental variables influence transpiration rates · Experimental controls are used to isolate environmental effects · Fruit flies respond behaviorally to environmental repellents · pH affects enzymatic activity · Biotic and abiotic factors influence the rate of enzymatic reactions
An organism’s phenotype—its observable traits and biological responses—depends not only on its genes but also on the environment in which those genes are expressed. The same plant genotype may produce different flower colors, growth rates, or defense structures under different environmental conditions.
5.5 Environmental Effects on Phenotype
An organism’s phenotype—its observable traits and biological responses—depends not only on its genes but also on the environment in which those genes are expressed. The same plant genotype may produce different flower colors, growth rates, or defense structures under different environmental conditions.
CED alignment: Learning Objective 5.5.A; Essential Knowledge 5.5.A.1; Suggested Skill 1.C Explanation of Concepts.
Environment can change phenotype
Environmental factors include abiotic influences, such as soil pH, temperature, light, water availability, and humidity, and biotic influences, such as herbivory, competition, pathogens, and chemical signals from other organisms. These factors can alter biochemical pathways, developmental patterns, behavior, and reproductive success without changing the organism’s DNA sequence.
A familiar example is flower color. In some plants, soil pH changes the chemical form of pigments in developing flowers. A plant growing in acidic soil may produce flowers with a different color from a genetically similar plant growing in more basic soil. The environmental variable—soil pH—has changed the phenotype by influencing pigment chemistry.
The same logic applies to enzymes. If changing pH changes the rate of an enzyme-catalyzed reaction, pH is affecting biological activity through the enzyme’s chemical environment. A useful investigation could place equal amounts of enzyme and substrate into buffers with different pH values, measure product formation per unit time, and compare the reaction rates. Because pH is nonliving, it is an abiotic influence; herbivory, by contrast, is a biotic influence.
Herbivory can trigger a measurable response
Herbivory is feeding by an animal on a plant. It can produce an observable plant response rather than merely removing tissue. For example, feeding may stimulate increased trichome production, activate chemical defenses, change the timing of defense responses, or alter the plant’s ability to tolerate later damage. These responses are examples of phenotype plasticity: environmentally induced changes in phenotype.
A researcher could compare undamaged plants with plants exposed to a controlled amount of leaf damage. After a defined time, the researcher might count trichomes per unit leaf area, measure defense-compound concentration, or compare subsequent growth. The response becomes scientifically useful only when it is converted into a measurable dependent variable.
Misconception check: “If the environment affects a trait, the organism evolved during the experiment.”
Not necessarily. A short-term response to herbivory or pH is a change in phenotype. Evolution requires a change in heritable allele frequencies across generations.
Behavioral responses can interact
A phototactic response is movement in response to light; a chemotactic response is movement in response to a chemical. These cues may point in different directions, so one response does not automatically override the other. The outcome depends on factors such as cue intensity, receptor sensitivity, the organism’s physiological state, and whether one stimulus is attractive or aversive.
For example, fruit flies placed in a choice chamber might move toward a lighted region but away from an environmental repellent, such as an aversive odor. To test the response, place flies in a chamber divided into two connected zones. First measure their distribution under identical conditions; then introduce the repellent into one zone while keeping light conditions constant. A stronger response is supported if flies occupy the non-repellent zone more often than in the control condition.
The control chamber establishes baseline movement and detects side preference. Replication with many flies and repeated trials helps distinguish avoidance of the repellent from random movement, crowding, or attraction to the opposite side. If light and odor cues conflict, the data—not an assumption that phototaxis always dominates—must show which cue has the greater behavioral effect.
Environmental factors affect growth and productivity
Plant growth can be represented with a mathematical model. When resources are abundant, early growth may approximate exponential growth:
$$\frac{dN}{dt}=rN$$
Here, $N$ is plant biomass or population size, $t$ is time, and $r$ is the per-unit growth rate. As nutrients, water, space, or light become limiting, a logistic model is more realistic:
$$\frac{dN}{dt}=rN\left(1-\frac{N}{K}\right)$$
The carrying capacity $K$ represents the maximum biomass or population size that the environment can sustain. Environmental changes can alter $r$, $K$, or both. For example, increased carbon dioxide might raise photosynthetic productivity under some conditions, while drought may lower growth and reduce $K$.
Investigating transpiration
Transpiration is the loss of water vapor from plant surfaces, especially through stomata. A strong hypothesis identifies an environmental factor and predicts its effect: “Increasing air movement will increase transpiration rate because moving air removes the humid boundary layer near the leaf.” Other testable variables include light intensity, humidity, temperature, and wind.
In a potometer investigation, change one environmental variable while keeping plant species, leaf area, time interval, and apparatus constant. Record water movement per unit time as the transpiration rate. Pressure data may be recorded in kilopascals, written $\text{kPa}$; the kilopascal is a unit of pressure.
An appropriate control experiences the same setup without the experimental environmental change. If the experimental rate is $R_{\text{exp}}$ and the control rate is $R_{\text{control}}$, calculate:
$$R_{\text{adjusted}}=R_{\text{exp}}-R_{\text{control}}$$
For example, if a treated plant has a rate of $0.80\ \text{mL min}^{-1}$ and the control rate is $0.35\ \text{mL min}^{-1}$, then:
$$R_{\text{adjusted}}=0.80-0.35=0.45\ \text{mL min}^{-1}$$
A graph of adjusted rates allows groups to compare environmental effects more fairly.
Retrieval check: A plant exposed to low humidity loses water at $1.10\ \text{mL min}^{-1}$; its control loses water at $0.70\ \text{mL min}^{-1}$. What is the adjusted rate, and why is the control necessary?
AP skills in this topic: 1.C Explanation of Concepts explains the mechanism linking environment to phenotype; 2.A Visual Representations displays growth curves, choice-chamber distributions, and transpiration graphs; 3.A Questions and Methods develops hypotheses, controls, and experimental designs; 4.A Representing and Describing Data constructs labeled graphs and identifies patterns; 5.A Statistical Tests and Data Analysis compares variation among treatments and controls; and 6.A Argumentation uses evidence to support or revise a claim about environmental effects.
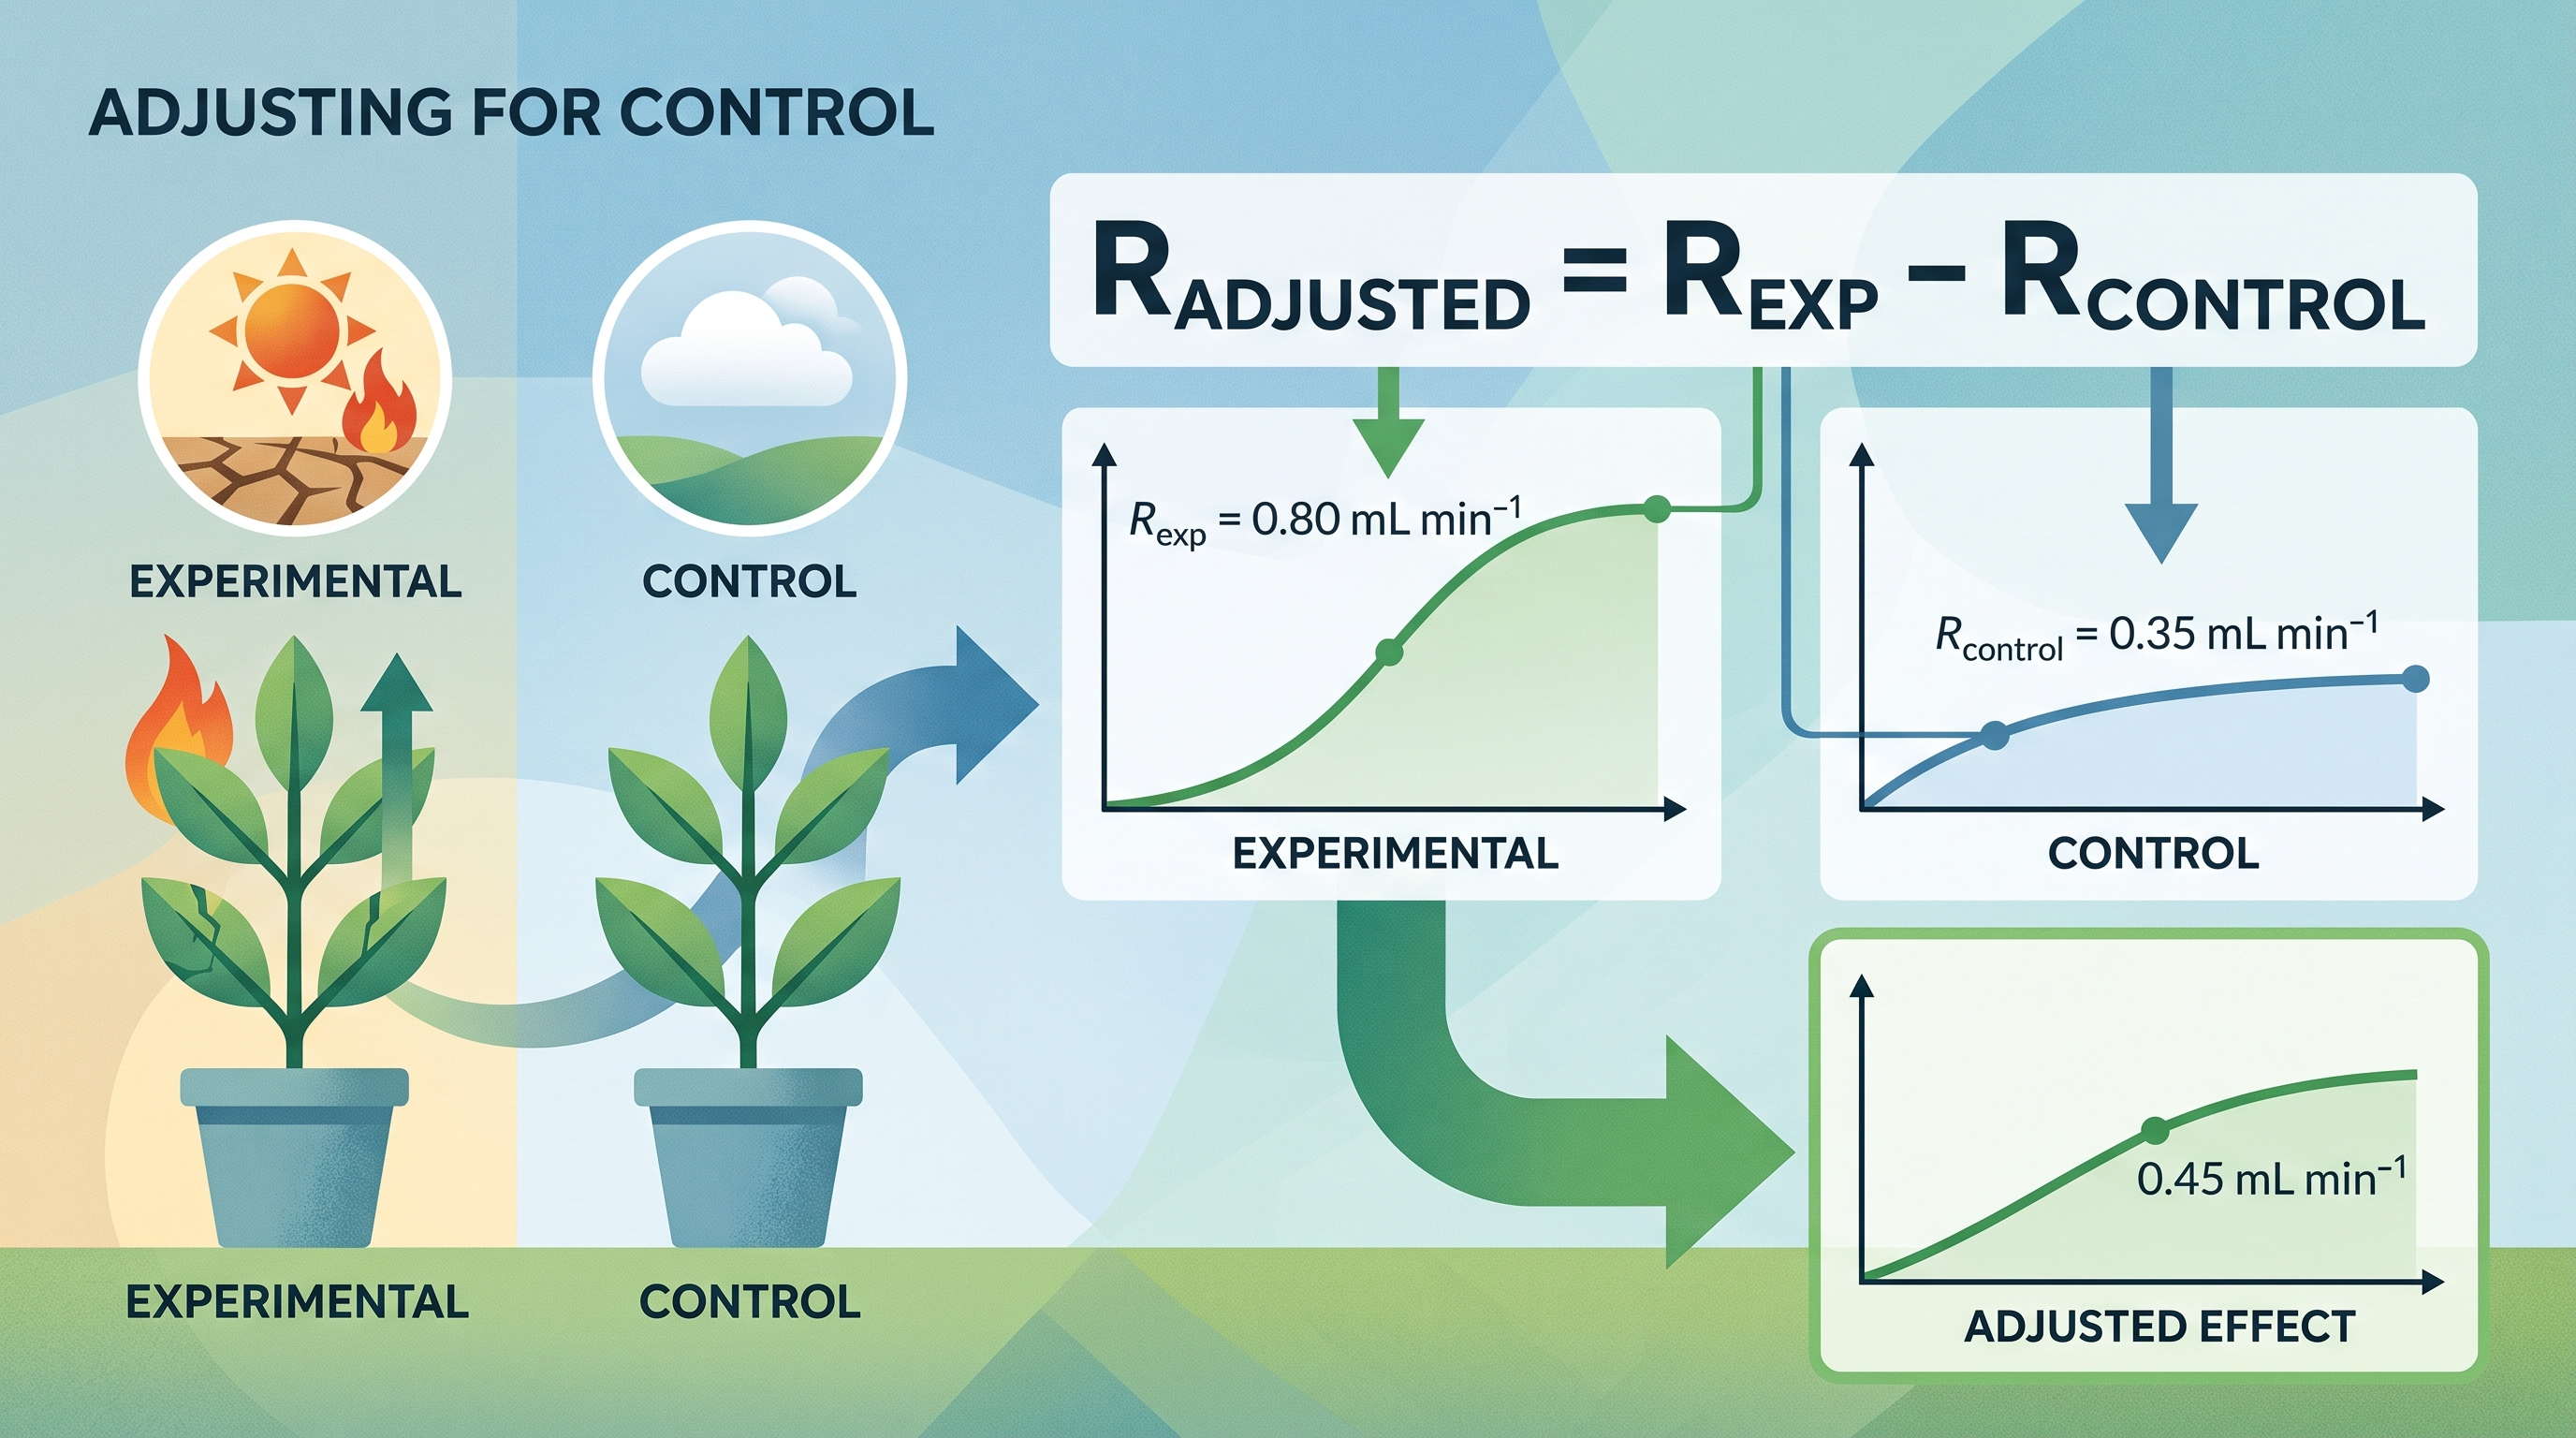
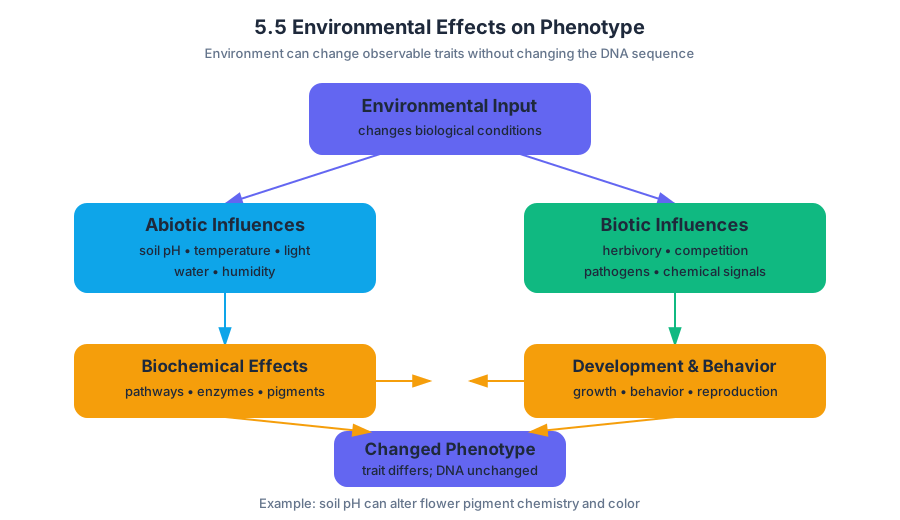
6.1 DNA and RNA Structure
Key concepts: DNA structure and function · RNA structure and function · Purine nitrogenous bases · Pyrimidine nitrogenous bases · Differences between DNA and RNA · Single-stranded and double-stranded nucleic acids
DNA and RNA are information-carrying polymers whose nucleotide sequences store biological instructions, but their structures suit different jobs: DNA is a stable, typically double-stranded archive, while RNA is usually a more flexible, single-stranded molecule whose folded shape helps determine its function.
6.1 DNA and RNA Structure
DNA and RNA are information-carrying polymers whose nucleotide sequences store biological instructions, but their structures suit different jobs: DNA is a stable, typically double-stranded archive, while RNA is usually a more flexible, single-stranded molecule whose folded shape helps determine its function.
Learning Objective 1.6.A: Describe the structure and function of DNA and RNA.
Nucleotides: the repeating units of nucleic acids
A nucleic acid is a polymer made from repeating nucleotides. Each nucleotide contains three structural components:
- a five-carbon sugar—deoxyribose in DNA or ribose in RNA;
- a phosphate group;
- a nitrogenous base.
The order of bases along a nucleic-acid strand encodes biological information. The sugar and phosphate form the strand’s repeating backbone, while the bases project from that backbone and provide the sequence that can be read, copied, or used to direct cellular activities.
Purines and pyrimidines: two base shapes
Nitrogenous bases fall into two structural families. Purines—adenine and guanine—have a larger double-ring structure. Pyrimidines—cytosine, thymine, and uracil—have a smaller single-ring structure.
A useful visual rule is:
- Purines: adenine, guanine — double ring
- Pyrimidines: cytosine, thymine, uracil — single ring
The pairing rules match one purine with one pyrimidine. This keeps the width of a double-stranded nucleic acid relatively uniform: two large purines would be too wide, while two small pyrimidines would leave too much space.
DNA: a stable, antiparallel information archive
DNA, or deoxyribonucleic acid, contains deoxyribose and the bases adenine, thymine, cytosine, and guanine. It is typically a double helix: two nucleotide strands coil around one another, with paired bases held together by hydrogen bonds.
Essential Knowledge 1.6.A.3: DNA is an antiparallel double helix. Its two strands run in opposite $5'$ to $3'$ orientations. Adenine pairs with thymine, written A–T, and cytosine pairs with guanine, written C–G.
Antiparallel means that the two strands point in opposite chemical directions. One strand runs $5'$ to $3'$, while its partner runs $3'$ to $5'$. The strands are complementary: knowing the sequence of one strand allows the matching sequence of the other to be predicted.
RNA: structure shaped for a specific job
RNA, or ribonucleic acid, contains ribose and the bases adenine, uracil, cytosine, and guanine. RNA is typically single stranded, although a single strand can bend and form internal base-paired regions.
Essential Knowledge 1.6.A.4: DNA contains deoxyribose, whereas RNA contains ribose; DNA contains thymine, whereas RNA contains uracil; DNA is typically double stranded, whereas RNA is typically single stranded.
RNA’s structure determines its function. Messenger RNA, or mRNA, carries information from DNA in the nucleus to a ribosome in the cytoplasm. Transfer RNA, or tRNA, folds into a distinctive shape, binds a specific amino acid, and uses an anticodon sequence to pair with an mRNA codon.
DNA and RNA compared
| Feature | DNA | RNA |
|---|---|---|
| Sugar | Deoxyribose | Ribose |
| Distinctive base | Thymine | Uracil |
| Typical structure | Double stranded | Single stranded |
| Base pairing | A–T and C–G | A–U in paired regions |
| Representative function | Long-term information storage | Information transfer and specialized cellular tasks |
Worked example: identifying an unknown nucleic acid
A molecule is found to contain ribose, uracil, and one strand that folds into a compact shape. Identify the molecule type and explain why its structure is biologically useful.
Step 1: Identify the sugar. Ribose indicates RNA rather than DNA.
Step 2: Identify the base. Uracil is found in RNA; DNA uses thymine.
Step 3: Identify the strand arrangement. A single strand is typical of RNA and can fold through internal base pairing.
Step 4: Connect structure to function. Folding can create a specific three-dimensional shape, allowing an RNA molecule such as tRNA to bind a particular amino acid or interact with other molecules.
Misconception check
Misconception: “RNA is always single stranded and never forms base pairs.” RNA is typically single stranded, but its strand can fold back on itself. In those folded regions, adenine can pair with uracil, and cytosine can pair with guanine. “Single stranded” describes the overall number of strands, not the absence of every hydrogen-bonded region.
Retrieval check
A nucleic acid contains deoxyribose and has two antiparallel strands. Which base pair belongs in it: A–U or A–T? Explain your answer in one sentence.
Answer: A–T, because DNA contains deoxyribose and thymine, whereas RNA contains ribose and uracil.
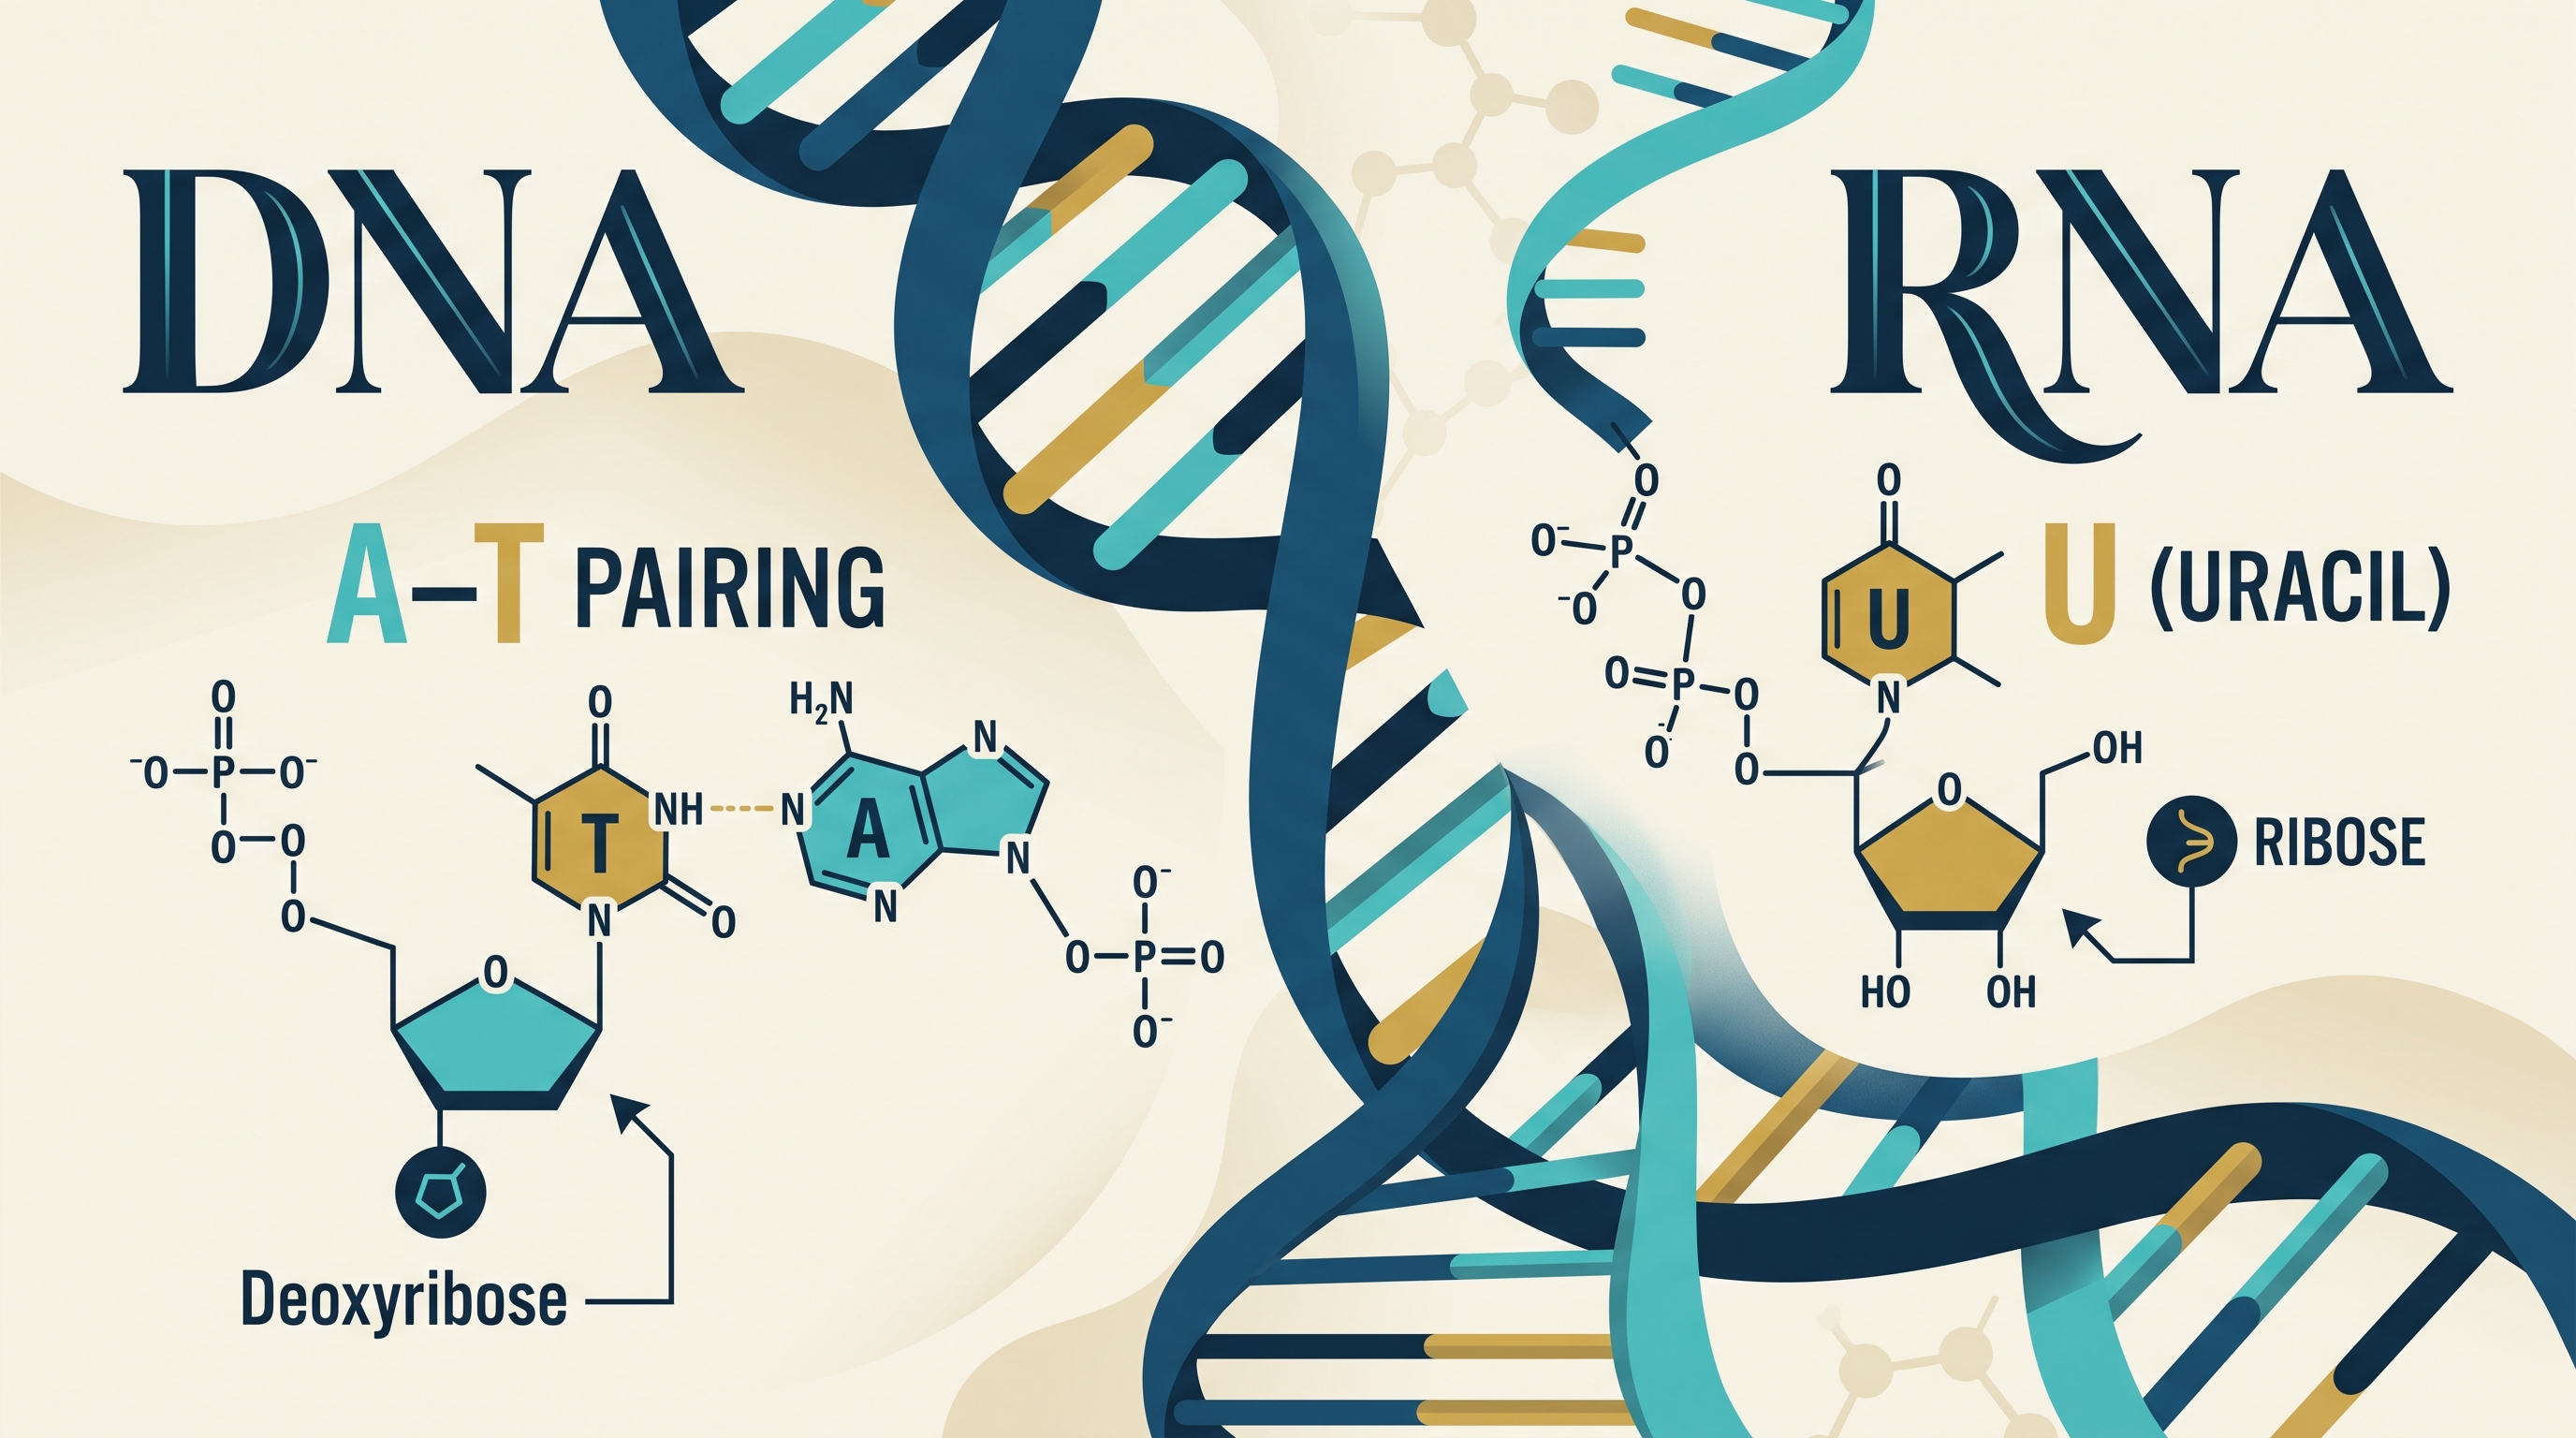
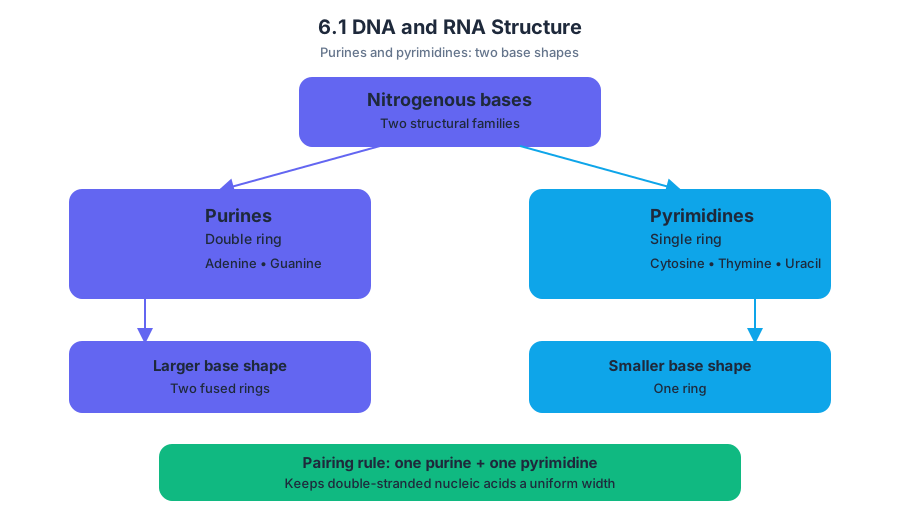
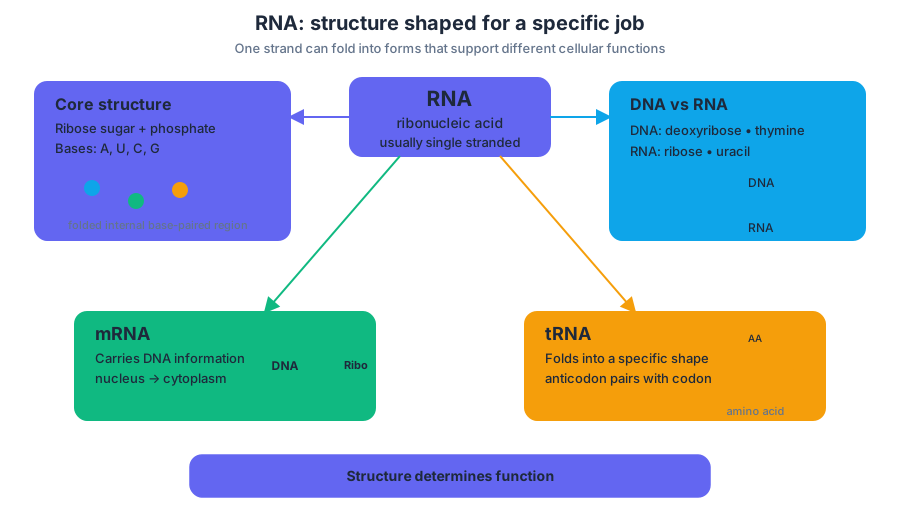
6.2 DNA Replication
Key concepts: DNA replication · Replication fork · Helicase-mediated DNA unwinding · Topoisomerase-mediated relaxation of supercoiling · RNA primers and DNA polymerase initiation · Continuous leading-strand synthesis · Discontinuous lagging-strand synthesis · DNA ligase and joining lagging-strand fragments
A dividing cell must copy its DNA before it can distribute genetic information to two daughter cells. DNA replication is the process of producing a complementary DNA molecule from an existing DNA molecule, and it begins when helicase separates the two strands at a moving replication fork.
6.2 DNA Replication
A dividing cell must copy its DNA before it can distribute genetic information to two daughter cells. DNA replication is the process of producing a complementary DNA molecule from an existing DNA molecule, and it begins when helicase separates the two strands at a moving replication fork.
The replication fork: a coordinated molecular machine
A replication fork is the Y-shaped region where the parental DNA strands have been unwound and copied. The two original strands do not serve as identical templates: because their strands run in opposite directions, the replication machinery must copy one new strand continuously and the other in short pieces.
The major events occur in a defined sequence:
- Helicase unwinds the DNA strands by breaking the hydrogen bonds between complementary bases.
- Unwinding creates twisting stress, or supercoiling, ahead of the fork.
- Topoisomerase relaxes supercoiling in front of the replication fork, preventing the DNA from becoming excessively twisted or damaged.
- Short RNA primers provide starting points.
- DNA polymerase extends the primers with new DNA nucleotides.
- The leading strand is copied continuously, while the lagging strand is copied discontinuously.
- DNA ligase joins the fragments on the lagging strand.
| Component | Immediate problem | Role in replication |
|---|---|---|
| Helicase | The template strands are still paired | Unwinds the DNA |
| Topoisomerase | Unwinding creates supercoiling ahead of the fork | Relaxes twisting |
| RNA primer | DNA polymerase cannot start from nothing | Provides a nucleic-acid starting point |
| DNA polymerase | The new strand must be built | Adds complementary DNA nucleotides |
| DNA ligase | The lagging strand contains separate pieces | Joins the pieces into one strand |
Why primers are necessary
DNA polymerase requires RNA primers to initiate DNA synthesis. A primer is a short RNA segment complementary to the template strand. It supplies an available chemical end from which DNA polymerase can add nucleotides; DNA polymerase extends an existing strand but does not independently create the first bond of a new strand.
This requirement explains why replication is not simply “DNA polymerase reads the old strand and makes a new one.” First, an RNA primer must mark a usable starting point. DNA polymerase then builds the DNA strand complementary to the template, preserving the base-pairing relationship established by the original molecule.
Leading and lagging strands
The leading strand is synthesized continuously as the replication fork opens. DNA polymerase can follow the helicase and add nucleotides in one uninterrupted stretch.
The lagging strand is synthesized discontinuously because its template orientation points away from the direction in which the fork opens. DNA polymerase therefore builds short DNA segments, each beginning from an RNA primer. These segments must later be connected by DNA ligase.
A useful mental model is road construction at a widening fork. One crew can pave a continuous lane in the direction the road is expanding: this represents the leading strand. The other crew must repeatedly build short sections in the opposite orientation, then seal the gaps between sections: this represents the lagging strand and ligase.
Worked example: predicting the effect of an enzyme defect
Suppose a mutation prevents topoisomerase from functioning during DNA replication. Helicase could still begin separating the DNA strands, but twisting stress would accumulate ahead of the replication fork. The fork would eventually stall or the DNA could become damaged because unwinding is occurring without relaxation of supercoiling.
Now suppose instead that DNA ligase is defective. DNA polymerase could still synthesize the leading strand and produce individual pieces on the lagging strand, but those pieces would remain disconnected. The daughter DNA molecule would contain an incomplete, discontinuous backbone rather than one intact strand.
Misconception check: “The lagging strand is copied backward”
Misconception: DNA polymerase reverses direction on the lagging strand. Correction: DNA polymerase does not reverse its synthesis direction. It always extends the new strand in the same chemical direction; the lagging strand appears discontinuous because its template orientation requires repeated synthesis from multiple RNA primers.
Another common error is to treat helicase and topoisomerase as interchangeable. Helicase separates the paired DNA strands at the fork; topoisomerase acts ahead of the fork to relieve the supercoiling produced by that separation.
AP alignment: representation and reasoning
The CED Suggested Skill: Representations, 2.B — Explain relationships between characteristics of biological models in both theoretical and applied contexts is central here. In a replication-fork diagram, the student should connect each visual feature to a mechanism: the Y-shape represents unwinding, the continuous line represents leading-strand synthesis, short segments represent lagging-strand synthesis, and small connecting sites represent ligase action.
The CED required-content sequence includes: iv. Topoisomerase relaxes supercoiling in front of the replication fork; v. DNA polymerase requires RNA primers to initiate DNA synthesis; vi. DNA polymerase synthesizes new strands of DNA continuously on the leading strand and discontinuously on the lagging strand; vii. Ligase joins the fragments on the lagging strand. The names of additional steps and enzymes beyond helicase, topoisomerase, DNA polymerase, RNA polymerase, and ligase are outside the stated AP scope.
Retrieval check
At a replication fork, helicase is active but topoisomerase is inhibited. What immediate physical problem develops, and why would DNA ligase not solve it? A strong answer identifies accumulating supercoiling ahead of the fork and explains that ligase joins lagging-strand fragments only after synthesis; it does not relax twisted parental DNA.
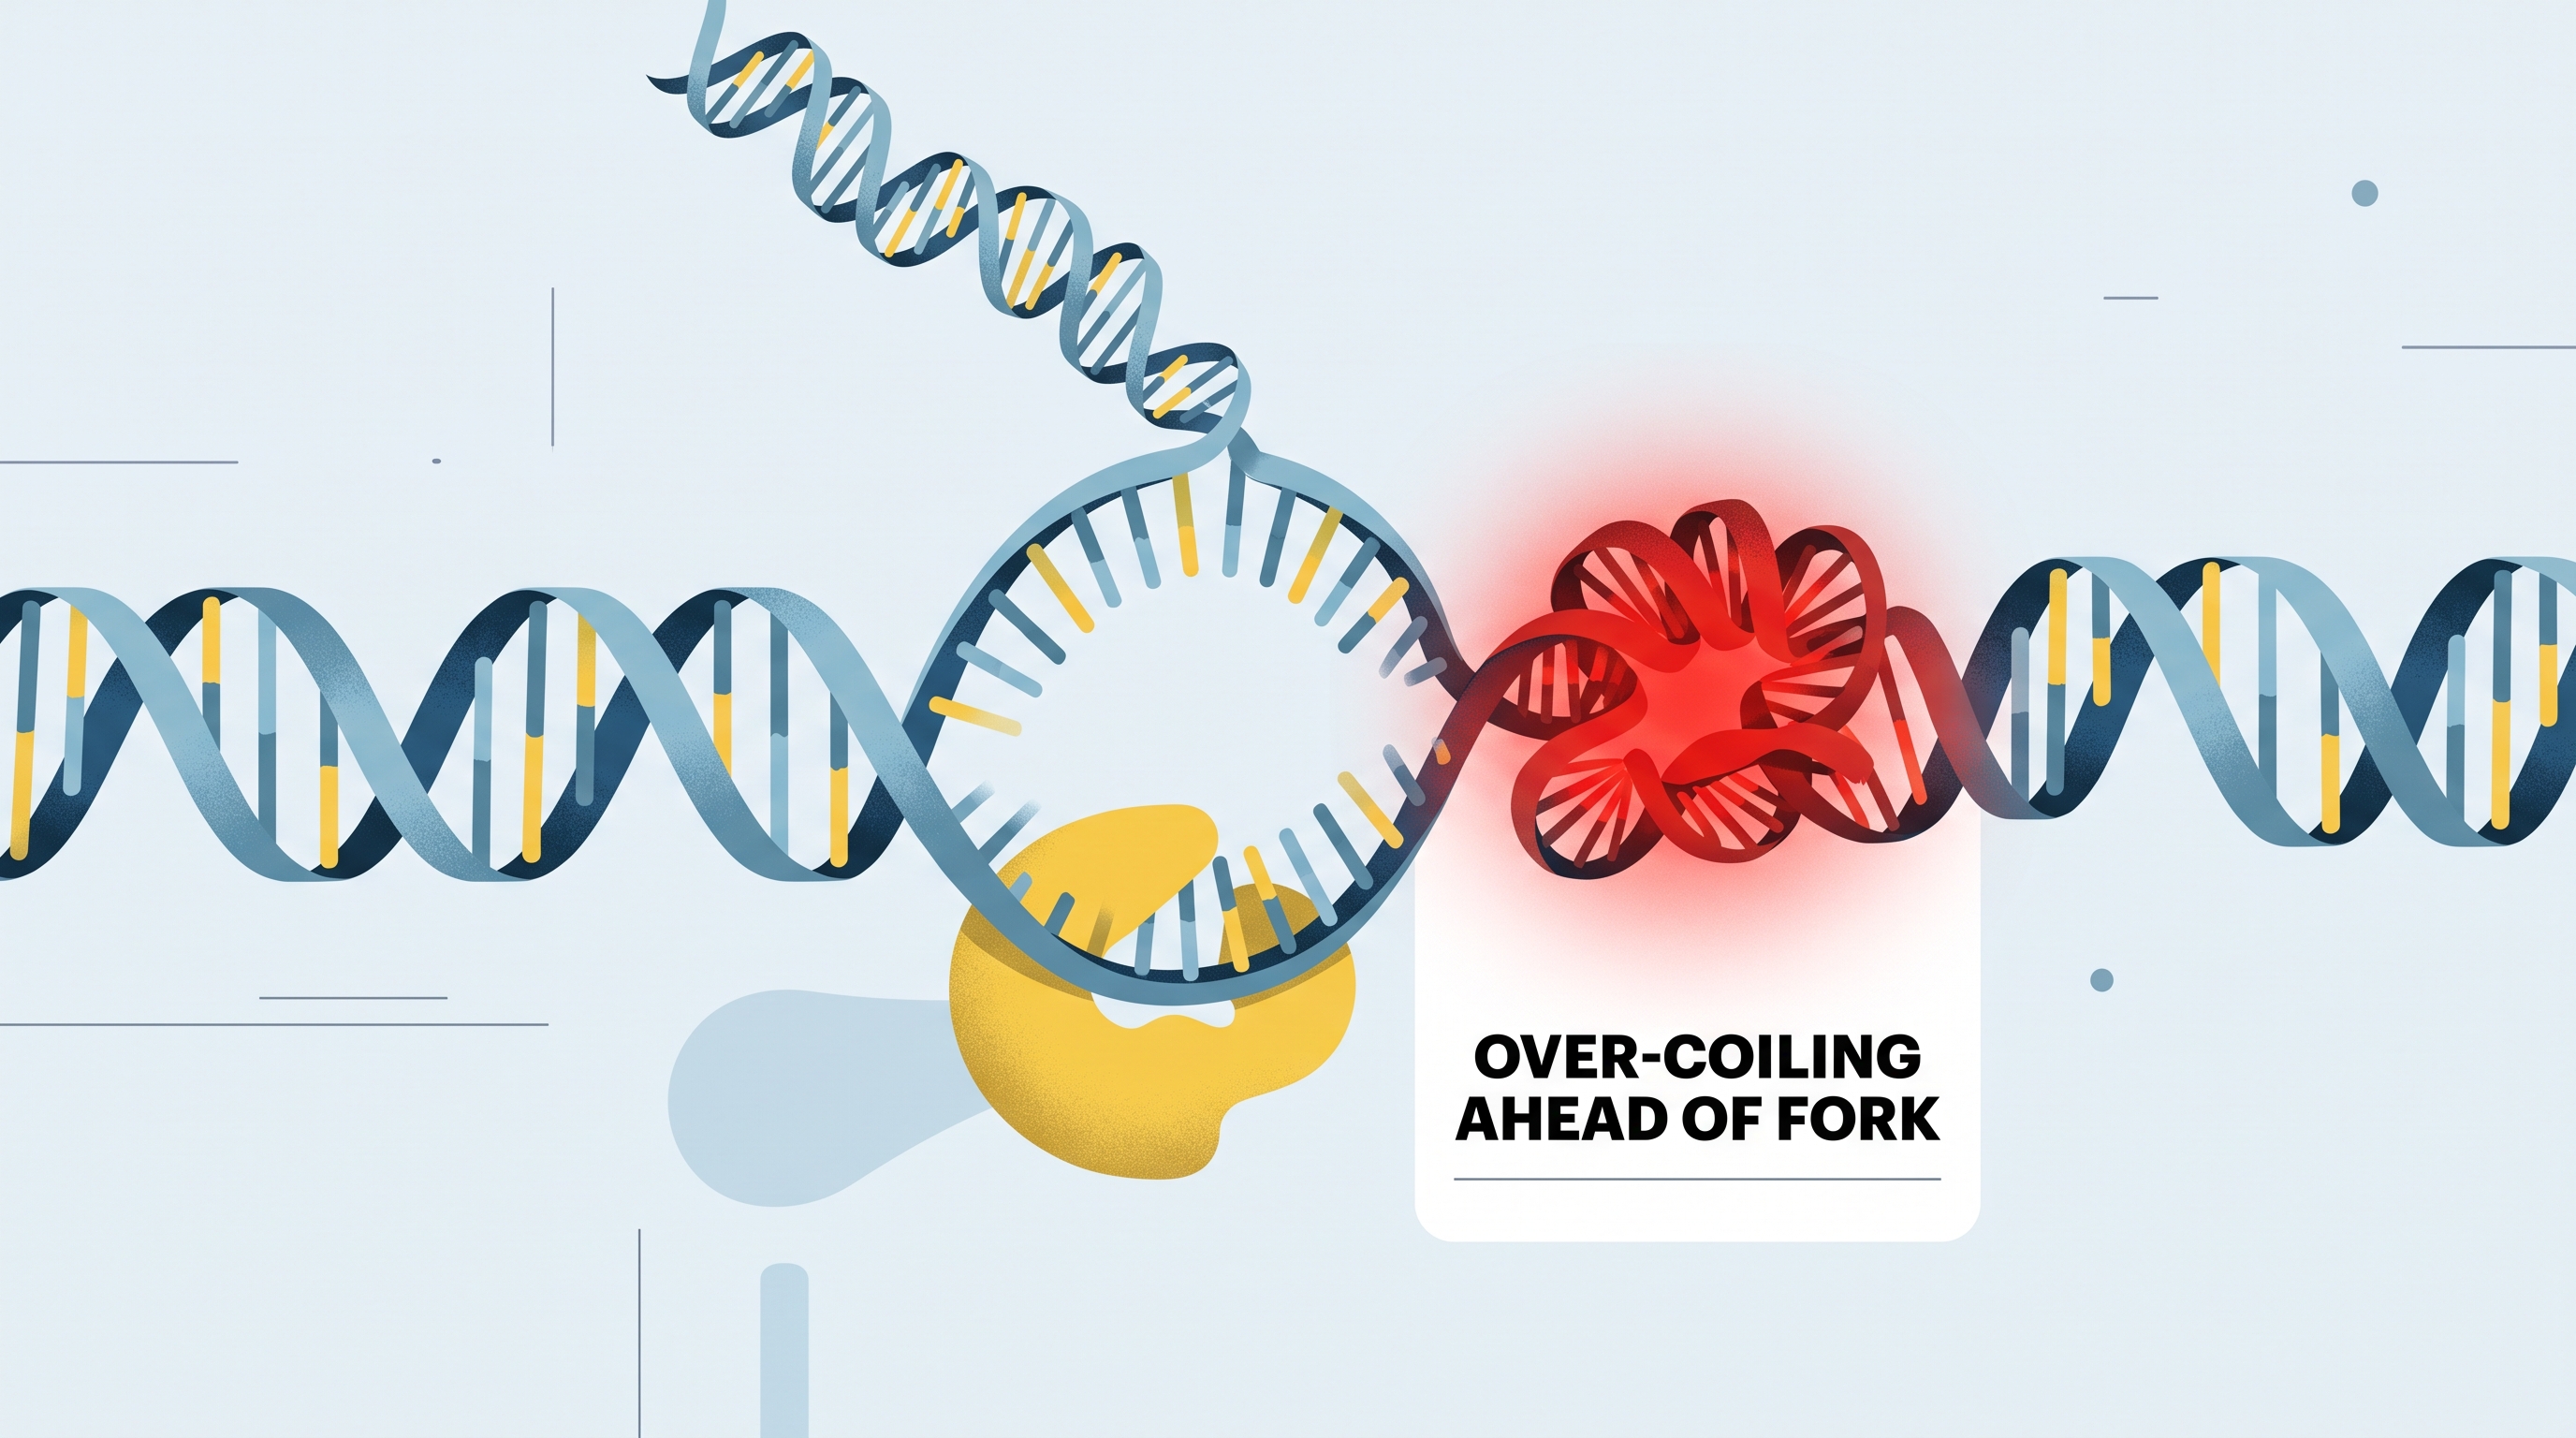
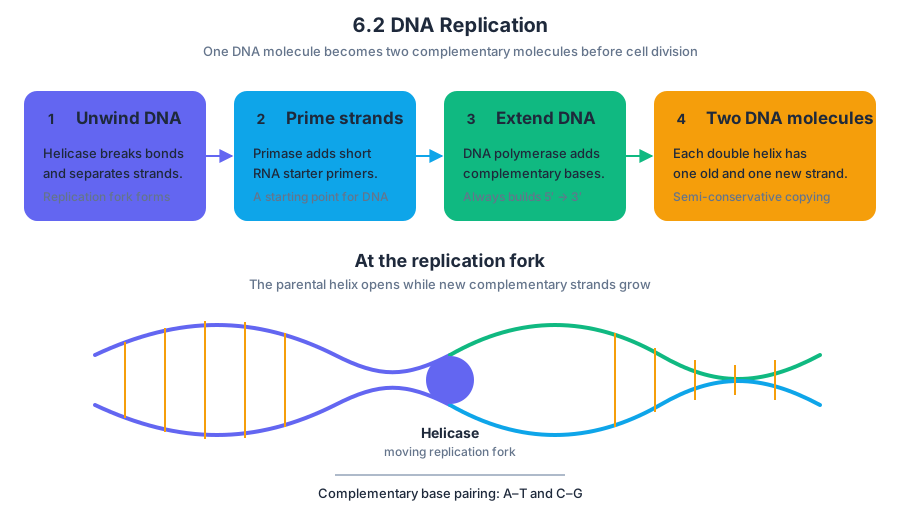
6.3 Transcription and RNA Processing
Key concepts: Transcription · RNA processing · mRNA stability · 5′ GTP capping · Ribosomal recognition · Introns · Exons · RNA splicing · Mature mRNA variants · Biological models in theoretical and applied contexts
Transcription is the process of copying information from a DNA sequence into a complementary RNA molecule, while RNA processing converts the initial RNA transcript into a mature messenger RNA, or mRNA, that can be used to direct protein production.
6.3 Transcription and RNA Processing
Transcription is the process of copying information from a DNA sequence into a complementary RNA molecule, while RNA processing converts the initial RNA transcript into a mature messenger RNA, or mRNA, that can be used to direct protein production.
Investigative question: How can one DNA gene produce several mature mRNA molecules, and why must those RNA molecules be chemically modified before they are useful?
CED alignment: 6.3.A and 6.3.A.1
Learning Objective 6.3.A: Describe the mechanisms by which genetic information flows from DNA to RNA to protein.
Essential Knowledge 6.3.A.1: The sequence of the RNA bases, together with the structure of the RNA molecule, determines RNA function.
The RNA base sequence is not merely a temporary copy of DNA. Its sequence determines which codons appear in the mRNA, while its structure and processing determine whether the transcript is stable, recognized by a ribosome, transported, or selectively translated.
Transcription: building the RNA transcript
During transcription, the enzyme RNA polymerase separates a short region of DNA and uses one DNA strand as the template. RNA polymerase reads the DNA template in the $3'$ to $5'$ direction and synthesizes the RNA strand in the $5'$ to $3'$ direction by adding complementary RNA nucleotides.
The resulting RNA is initially called a primary transcript, or pre-mRNA in a eukaryotic cell. It contains a sequence complementary to the DNA template strand and, therefore, nearly matches the coding strand of DNA except that RNA uses uracil, $U$, in place of thymine, $T$.
Model-reading check: In a diagram of transcription, locate the growing end of the RNA strand. If RNA polymerase is moving along the DNA template from $3'$ to $5'$, the RNA must grow from $5'$ to $3'$. Reversing either direction changes the predicted RNA sequence.
RNA processing: turning a transcript into usable mRNA
In eukaryotes, the primary transcript is modified before it becomes mature mRNA. Three linked changes are especially important:
| Processing event | What happens | Why it matters |
|---|---|---|
| 5′ GTP capping | A guanosine triphosphate, or GTP, cap is added to the $5'$ end | Helps with ribosomal recognition |
| Poly-A tail addition | A stretch of adenine nucleotides is added to the $3'$ end | Makes the mRNA more stable |
| Splicing | Introns are removed and exons are joined | Produces a mature RNA sequence that can be expressed |
The 5′ GTP cap acts like an identification tag at the front of the mRNA. It helps the ribosome recognize the transcript as an RNA molecule ready to participate in protein production. The cap is not a protein-coding region; its key role here is recognition.
The poly-A tail is added to the opposite, $3'$ end. It increases mRNA stability, helping protect the transcript from degradation and allowing it to remain available longer for gene expression. A longer-lived transcript can potentially be used repeatedly before it is broken down.
Introns, exons, and alternative splicing
A primary transcript may contain introns, intervening sequences that are excised during processing, and exons, expressed sequences that are retained and spliced together in the mature mRNA.
The important twist is that cells do not always retain exactly the same combination of exons. Alternative splicing produces different versions of a mature mRNA molecule by joining selected exons in different arrangements. Consequently, one gene can contribute to multiple RNA products and, after translation, potentially multiple related proteins.
Primary transcript:
5′ cap — exon 1 — intron A — exon 2 — intron B — exon 3 — poly-A tail

Mature mRNA version 1:
5′ cap — exon 1 — exon 2 — exon 3 — poly-A tail

Mature mRNA version 2:
5′ cap — exon 1 — exon 3 — poly-A tail
In this model, both mature molecules come from the same initial transcript, but they retain different exon combinations. Their different RNA base sequences can produce different protein products or alter how strongly the mRNA is used.
Worked example: predicting the effect of a processing defect
Suppose a mutation prevents a cell from adding the poly-A tail to a newly transcribed mRNA. The transcript may still contain the correct exon sequence, but it is less stable and is more likely to be degraded quickly. The predicted result is reduced mRNA availability and therefore reduced protein production.
Now consider a defect in GTP capping. Even if the transcript is stable, impaired capping can reduce ribosomal recognition. The two defects affect different steps: the poly-A tail primarily supports stability, whereas the GTP cap primarily supports recognition.
Misconception check: “Introns are useless DNA”
Correction: Introns are removed from the primary RNA transcript, but calling them “useless” is inaccurate. For this topic, the essential point is that introns are excised while exons are retained and spliced together; alternative splicing can then generate different mature mRNAs from the same transcript.
AP skill: Science Practice 2, Visual Representations
This topic is especially assessed through Science Practice 2: Visual Representations, including 2.B: Explain relationships between characteristics of biological models in both theoretical and applied contexts. When interpreting a gene-expression diagram, do more than identify labels: explain how the direction of transcription, exon removal, cap addition, and poly-A tail addition changes the final RNA molecule.
Retrieval check
A pre-mRNA contains exons $1$, $2$, and $3$, separated by introns. A mature transcript retains exons $1$ and $3$ but not exon $2$. What process produced this result, and which modification helps stabilize the finished mRNA?
Answer: This is alternative splicing, in which introns are removed and different exon combinations are retained. The poly-A tail helps stabilize the mature mRNA; the 5′ GTP cap helps with ribosomal recognition.
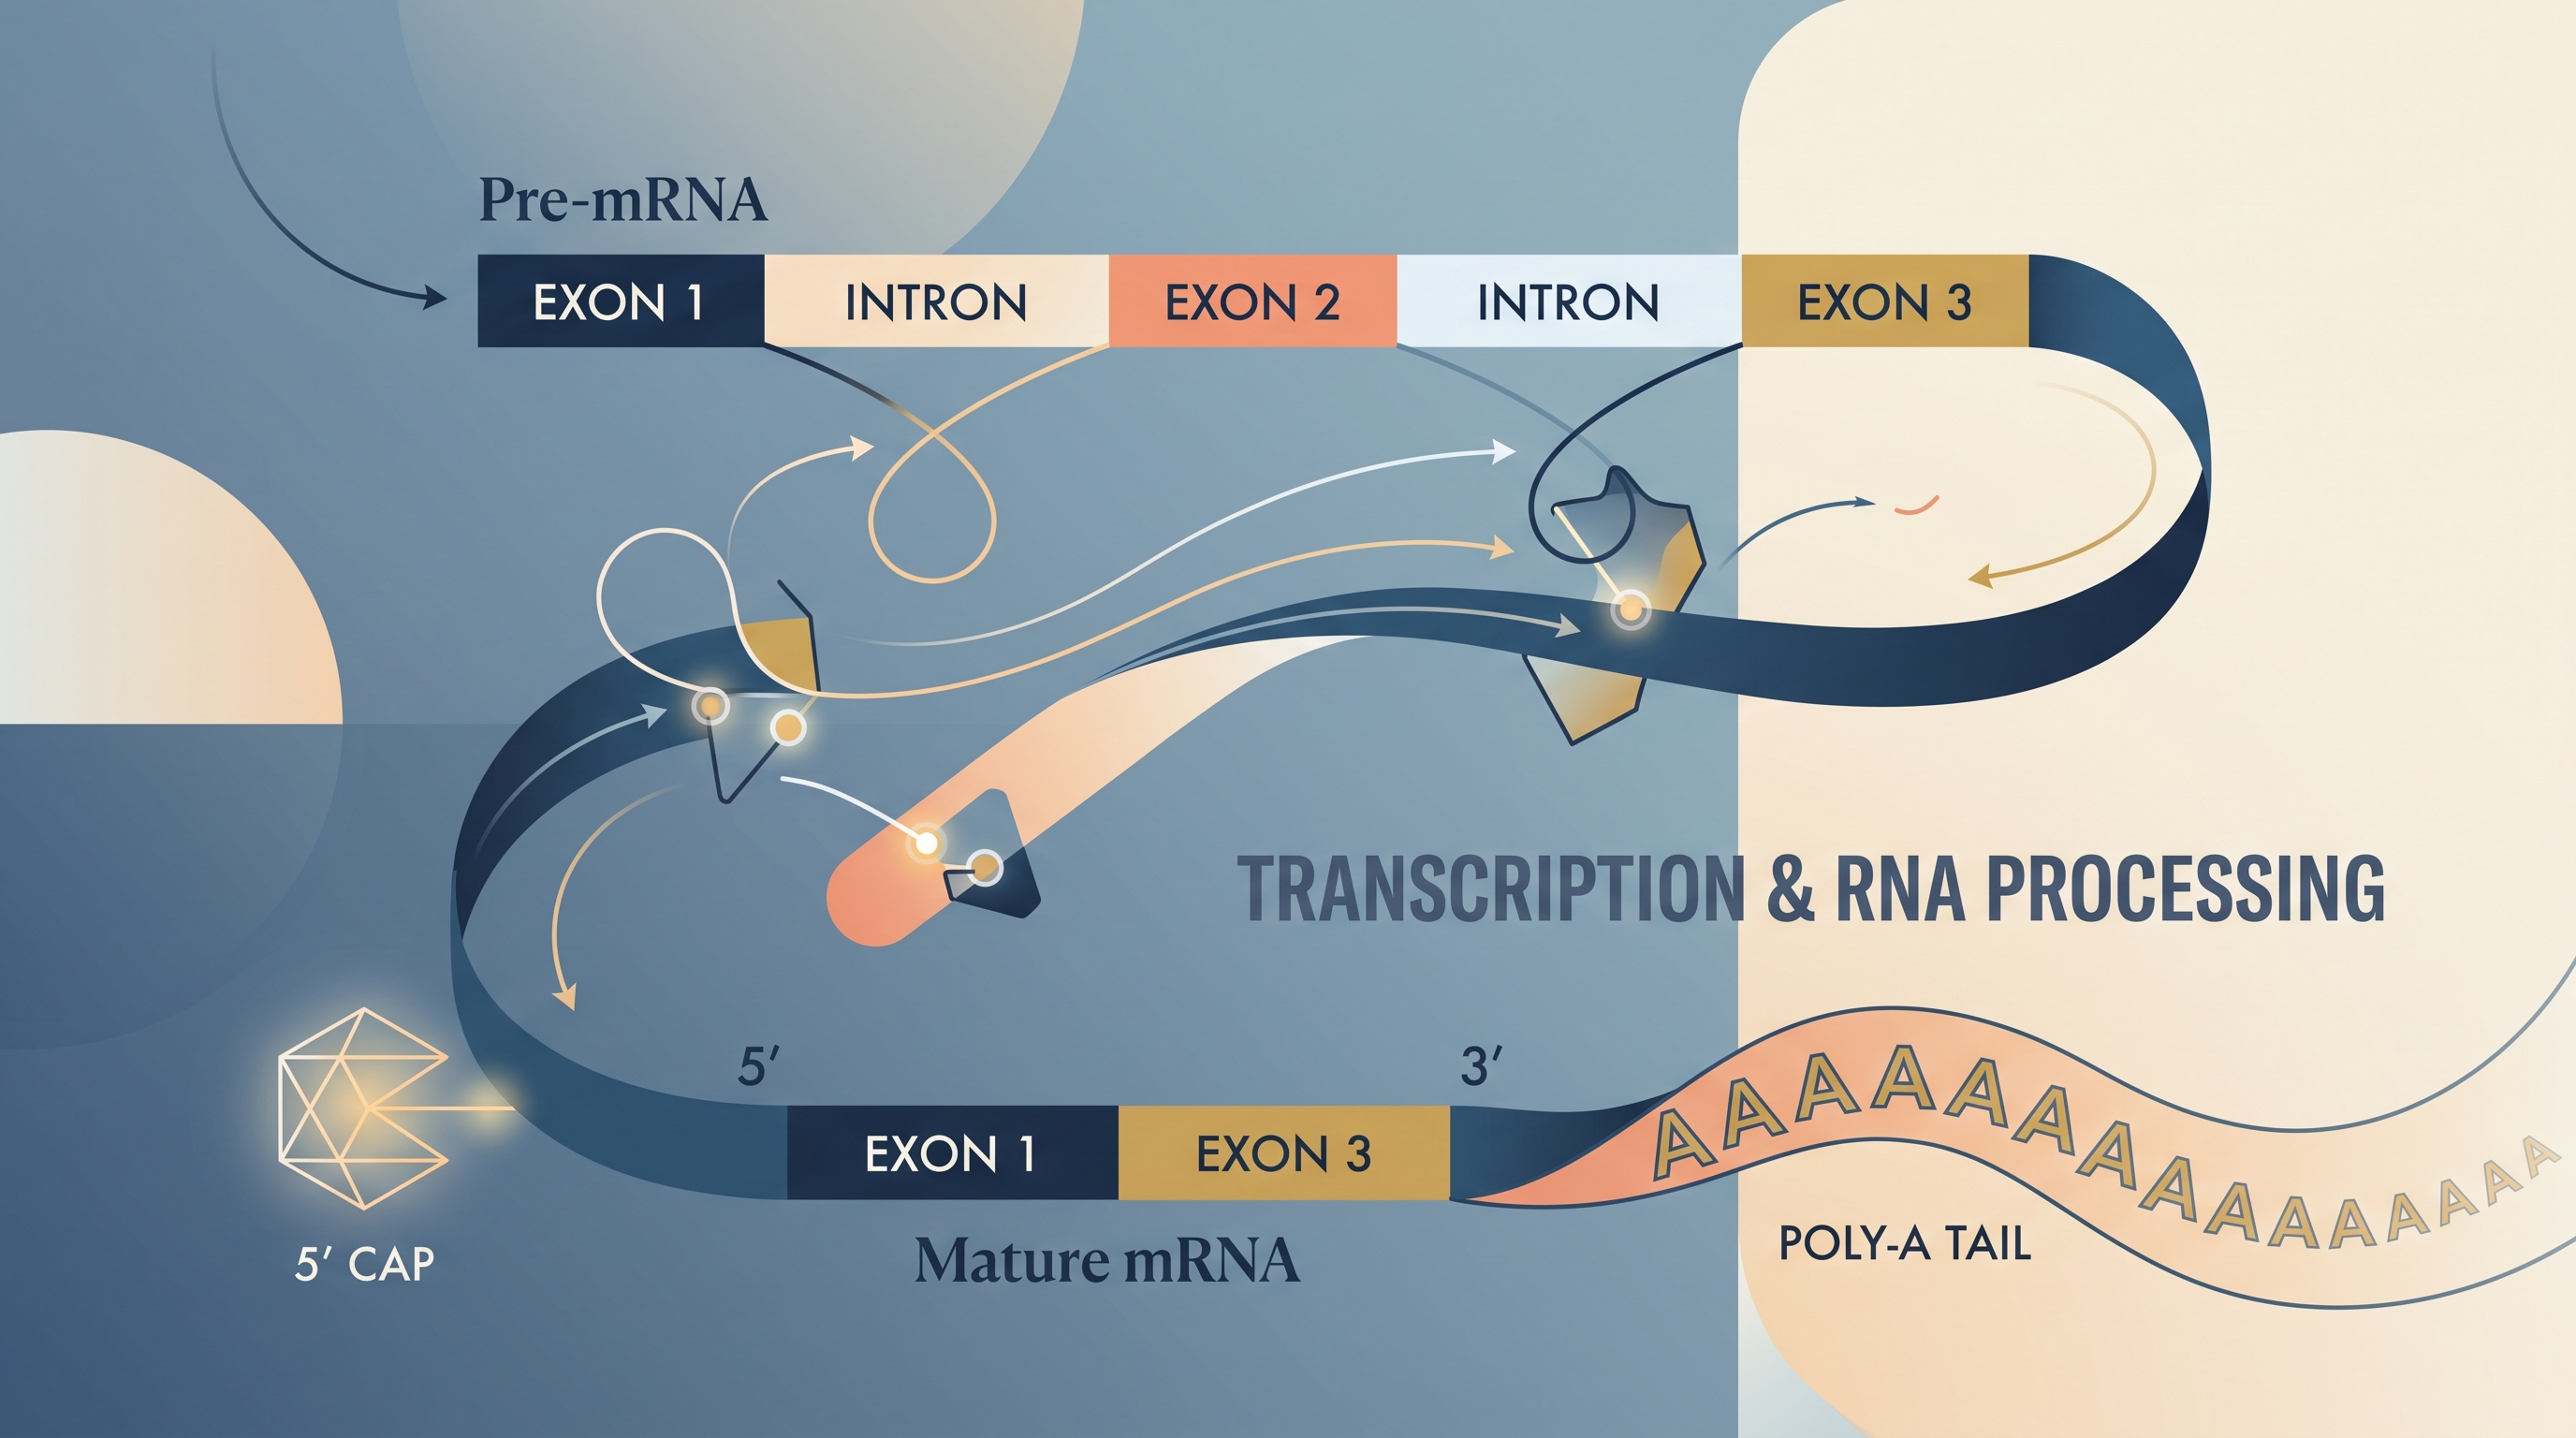
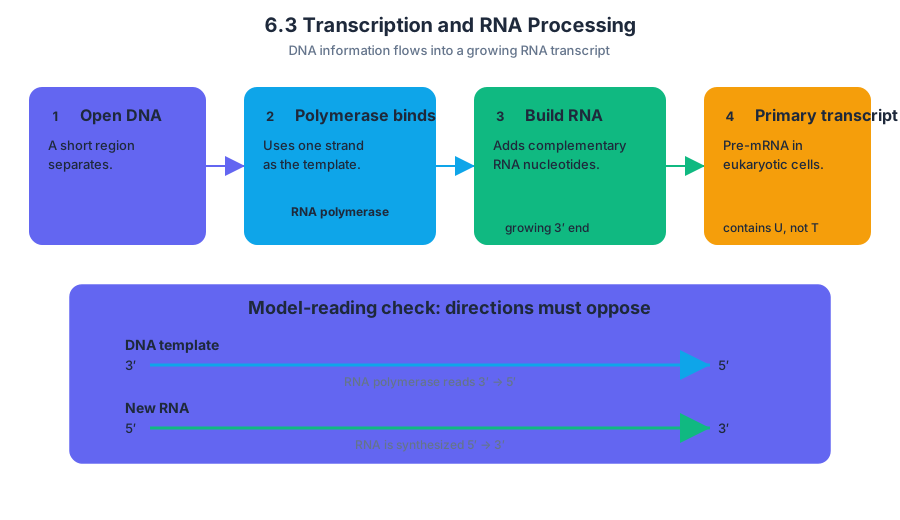
6.4 Translation
A ribosome can turn a sequence of nucleotide “letters” into a specific amino-acid chain because each three-base unit in messenger RNA, called a codon, corresponds to an amino acid or a stop signal.
6.4 Translation
A ribosome can turn a sequence of nucleotide “letters” into a specific amino-acid chain because each three-base unit in messenger RNA, called a codon, corresponds to an amino acid or a stop signal. Translation is therefore the physical step that connects genetic information to a polypeptide’s primary structure.
LO 6.4-1 — Explain how the sequence of nucleotides in a gene is used to produce a polypeptide.
From mRNA message to polypeptide
Translation is the process in which information in mRNA directs the assembly of amino acids into a polypeptide. The mRNA molecule carries the message to a ribosome, which reads the message in the $5'$ to $3'$ direction. The ribosome does not read individual bases one at a time; it reads groups of three bases.
Each codon is recognized by a complementary three-base anticodon on a transfer RNA molecule, or tRNA. The tRNA also carries the amino acid specified by that codon. Ribosomal RNA, or rRNA, forms essential structural and functional parts of the ribosome, including regions that help position tRNAs and join amino acids.
The process has three major stages:
- Initiation: The ribosome assembles on the mRNA at the start codon, usually $AUG$. A tRNA with the complementary anticodon $UAC$ brings methionine.
- Elongation: New tRNAs enter the ribosome. Their anticodons pair with successive mRNA codons, and the ribosome forms peptide bonds between adjacent amino acids.
- Termination: When the ribosome reaches a stop codon—$UAA$, $UAG$, or $UGA$—no tRNA matches it. Release factors help release the completed polypeptide.
Worked example: reading a codon sequence
Suppose an mRNA segment is:
$$5' - AUG\ GGC\ UAC\ UGA - 3'$$
Read it in groups of three, beginning at $AUG$:
| mRNA codon | Function or encoded amino acid |
|---|---|
| $AUG$ | Start; methionine |
| $GGC$ | Glycine |
| $UAC$ | Tyrosine |
| $UGA$ | Stop |
The resulting primary sequence is:
$$\text{methionine} - \text{glycine} - \text{tyrosine}$$
The stop codon does not add an amino acid. It signals that the polypeptide should be released. The chain may then fold or interact with other molecules, but those later events do not change the nucleotide-to-codon decoding shown here.
Why the reading frame matters
The ribosome must begin at the correct position because shifting the starting point changes every codon afterward. For example:
$$AUG\ GGC\ UAC\ UGA$$
If one nucleotide is inserted near the beginning, the grouping can become:
$$AUG\ CGG\ CUA\ CUG\ \ldots$$
This frameshift mutation changes the downstream amino-acid sequence and may eliminate the original stop signal. By contrast, a base substitution can affect only one codon, although it may still produce a different amino acid or a premature stop codon.
Misconception check: “The anticodon is the amino-acid code”
The anticodon does not independently determine which amino acid is attached. A specific enzyme attaches the appropriate amino acid to each tRNA. The anticodon allows the loaded tRNA to pair with the correct mRNA codon at the ribosome.
A second common error is treating the DNA template strand as if it were the mRNA sequence. If the template DNA is:
$$3' - TAC\ CCG\ ATG\ ACT - 5'$$
the mRNA is complementary:
$$5' - AUG\ GGC\ UAC\ UGA - 3'$$
The mRNA—not the DNA template—is read directly by the ribosome.
AP Biology science practices
Science Practice 1.C — Explain biological concepts and processes in applied contexts: Use a sequence, mutation, or missing translation component to predict the resulting polypeptide and explain the mechanism.
Science Practice 6.A — Make a scientific claim: State how a changed nucleotide sequence affects translation.
Science Practice 6.B — Support a claim with evidence: Cite the altered codon, changed amino acid, or new stop signal as evidence.
Science Practice 6.E — Predict the causes or effects of a change in, or perturbation to, a biological system: Predict what happens if a ribosome, tRNA, mRNA, or aminoacyl-tRNA synthetase is unavailable.
Retrieval check: An mRNA codon changes from $UAU$ to $UAA$. What kind of translation consequence is most likely, and why? The correct interpretation is a premature stop: $UAU$ encodes tyrosine, whereas $UAA$ terminates translation, producing a shortened polypeptide.

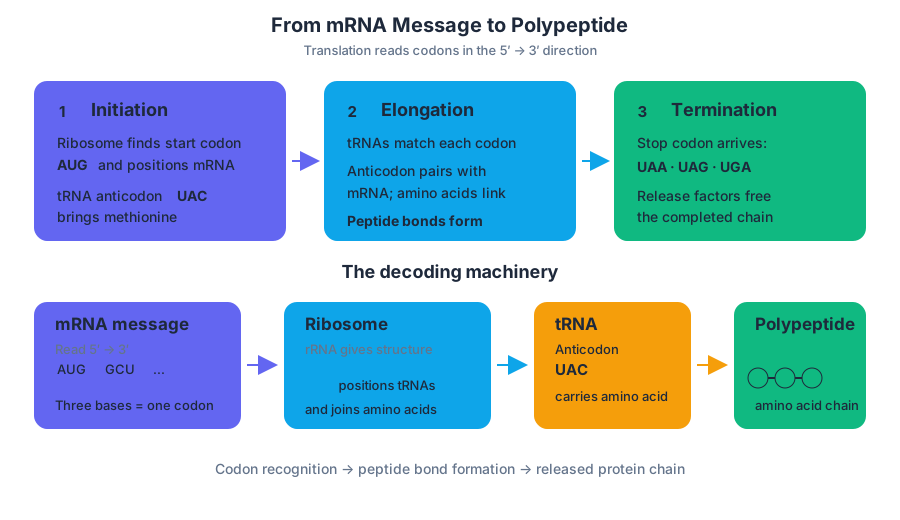
6.5 Regulation of Gene Expression
Key concepts: Gene expression and its regulation · Transcription · RNA processing and formation of mature mRNA · 5′ GTP cap and 3′ poly-A tail of mRNA · Alternative RNA splicing · Translation and protein assembly · Regulatory proteins binding DNA to block transcription · Differential gene expression · Viral gene expression and production of viral progeny · Changes in chromosome structure and genetic disorders
A cell can contain the same DNA as every other cell in an organism yet produce a completely different set of proteins. Gene regulation is the control of gene expression—the process by which information in DNA is used to produce RNA and, for protein-coding genes, proteins.
6.5 Regulation of Gene Expression
A cell can contain the same DNA as every other cell in an organism yet produce a completely different set of proteins. Gene regulation is the control of gene expression—the process by which information in DNA is used to produce RNA and, for protein-coding genes, proteins.
Key idea: Gene regulation results in differential gene expression, meaning that different cells or organisms express different genes, or express the same genes at different levels. These differences influence cell products, cell functions, and phenotype.
From DNA to a usable protein
For a protein-coding gene, gene expression proceeds through two linked stages. Transcription produces a newly formed RNA molecule from DNA. Translation then uses the mature messenger RNA, or mRNA, to assemble a protein. Regulation can occur before transcription, during RNA processing, or by controlling whether the resulting mRNA is translated.
In eukaryotic cells, RNA polymerase synthesizes mRNA in the $5'$ to $3'$ direction while reading the template DNA strand in the $3'$ to $5'$ direction. The first RNA product is not yet fully mature: it undergoes enzyme-mediated modifications before it can function efficiently as an mRNA.
Maturation of eukaryotic mRNA
Two important modifications stabilize and prepare the transcript:
- A $5'$ GTP cap is added to the beginning of the RNA. It helps protect the RNA and supports recognition by the ribosome.
- A $3'$ poly-A tail is added to the opposite end. It increases mRNA stability, helping the transcript persist long enough to be used.
Alternative RNA splicing provides another layer of regulation. During processing, different combinations of RNA segments can be joined to form different mature mRNA molecules from the same initial RNA transcript. Those mRNAs can direct the assembly of different protein products.
CED traceability: 6.3.A.3 requires the directionality of RNA synthesis: RNA polymerase reads template DNA $3'$ to $5'$ and synthesizes mRNA $5'$ to $3'$. 6.3.A.4 identifies eukaryotic mRNA modifications, including the stabilizing poly-A tail and the GTP cap involved in ribosomal recognition.
Regulation at the DNA level
A gene is not automatically transcribed simply because it is present. Promoter DNA is a region where RNA polymerase and transcription factors bind to initiate transcription. Enhancer DNA can also bind regulatory proteins and influence transcription; these sequences may lie upstream or downstream of the transcription start site.
Some transcription factors promote transcription, while negative regulatory molecules inhibit gene expression by binding to DNA and blocking transcription. If the blocking protein prevents RNA polymerase from initiating transcription, little or no RNA is produced, and the downstream protein product is reduced or absent.
This mechanism explains how environmental signals or cellular conditions can change phenotype without changing the DNA sequence itself. Small RNA molecules can also regulate gene expression by affecting the stability or use of RNA transcripts.
Worked example: one transcript, different products
Imagine a eukaryotic gene whose initial RNA transcript contains coding segments $A$, $B$, and $C$.
- RNA polymerase transcribes the gene into one initial RNA molecule.
- The transcript receives a $5'$ GTP cap and a $3'$ poly-A tail.
- One cell splices the RNA as $A$–$B$–$C$.
- Another cell splices it as $A$–$C$.
- The two mature mRNAs are translated into proteins with different amino acid sequences and potentially different functions.
The DNA has not changed. The difference arises because gene expression was regulated at the RNA-processing stage. This is why “same genome” does not mean “same proteome,” the complete collection of proteins produced by a cell.
Viral expression and chromosome changes
Viral genetic material can also be expressed and translated. Once inside a host cell, viral nucleic acid can direct production of proteins and other components needed to assemble new viral progeny. The host cell’s transcriptional and translational machinery may therefore become a factory for viral replication.
Changes in chromosome structure can alter gene expression by changing gene dosage, disrupting a gene, or moving a gene near different regulatory DNA. Such changes can lead to genetic disorders. The AP scope does not require knowledge of specific disorders caused by changes in chromosome number.
Scope boundary: Detailed mechanisms involving DNA polymerase, DNA ligase, helicase, and topoisomerase are beyond the AP Exam scope for this topic. Focus instead on the regulatory logic: DNA sequence and chromosome structure influence transcription, RNA processing determines which mature mRNA exists, and translation produces the protein.
Misconception check
Misconception: “Gene regulation means the DNA is permanently changed.”
Regulation commonly changes whether a gene is transcribed, how its RNA is processed, or whether its mRNA is used. These changes can alter phenotype without altering the gene’s nucleotide sequence.
AP Science Practices in action
- Science Practice 1: Concept Explanation — Explain how promoter binding, negative regulation, RNA processing, and translation produce differential gene expression.
- Science Practice 2: Visual Representations — Trace a diagram from DNA to initial RNA to mature mRNA to protein, identifying where regulation occurs.
- Science Practice 3: Questions and Methods — Predict how blocking a promoter, removing the GTP cap, or changing splicing would affect mRNA and protein production.
- Science Practice 4: Representing and Describing Data — Use mRNA or protein abundance data to identify whether a treatment increased or decreased gene expression.
- Science Practice 6: Argumentation — Support a claim about gene regulation with evidence, such as transcription levels, mature mRNA patterns, or protein concentration.
Retrieval check: A cell produces less of a protein after a regulatory protein binds near the gene’s promoter. What is the most direct explanation? The regulatory protein acts as a negative regulator, blocks transcription initiation, reduces the amount of newly formed RNA, and consequently reduces the amount of mature mRNA available for translation.
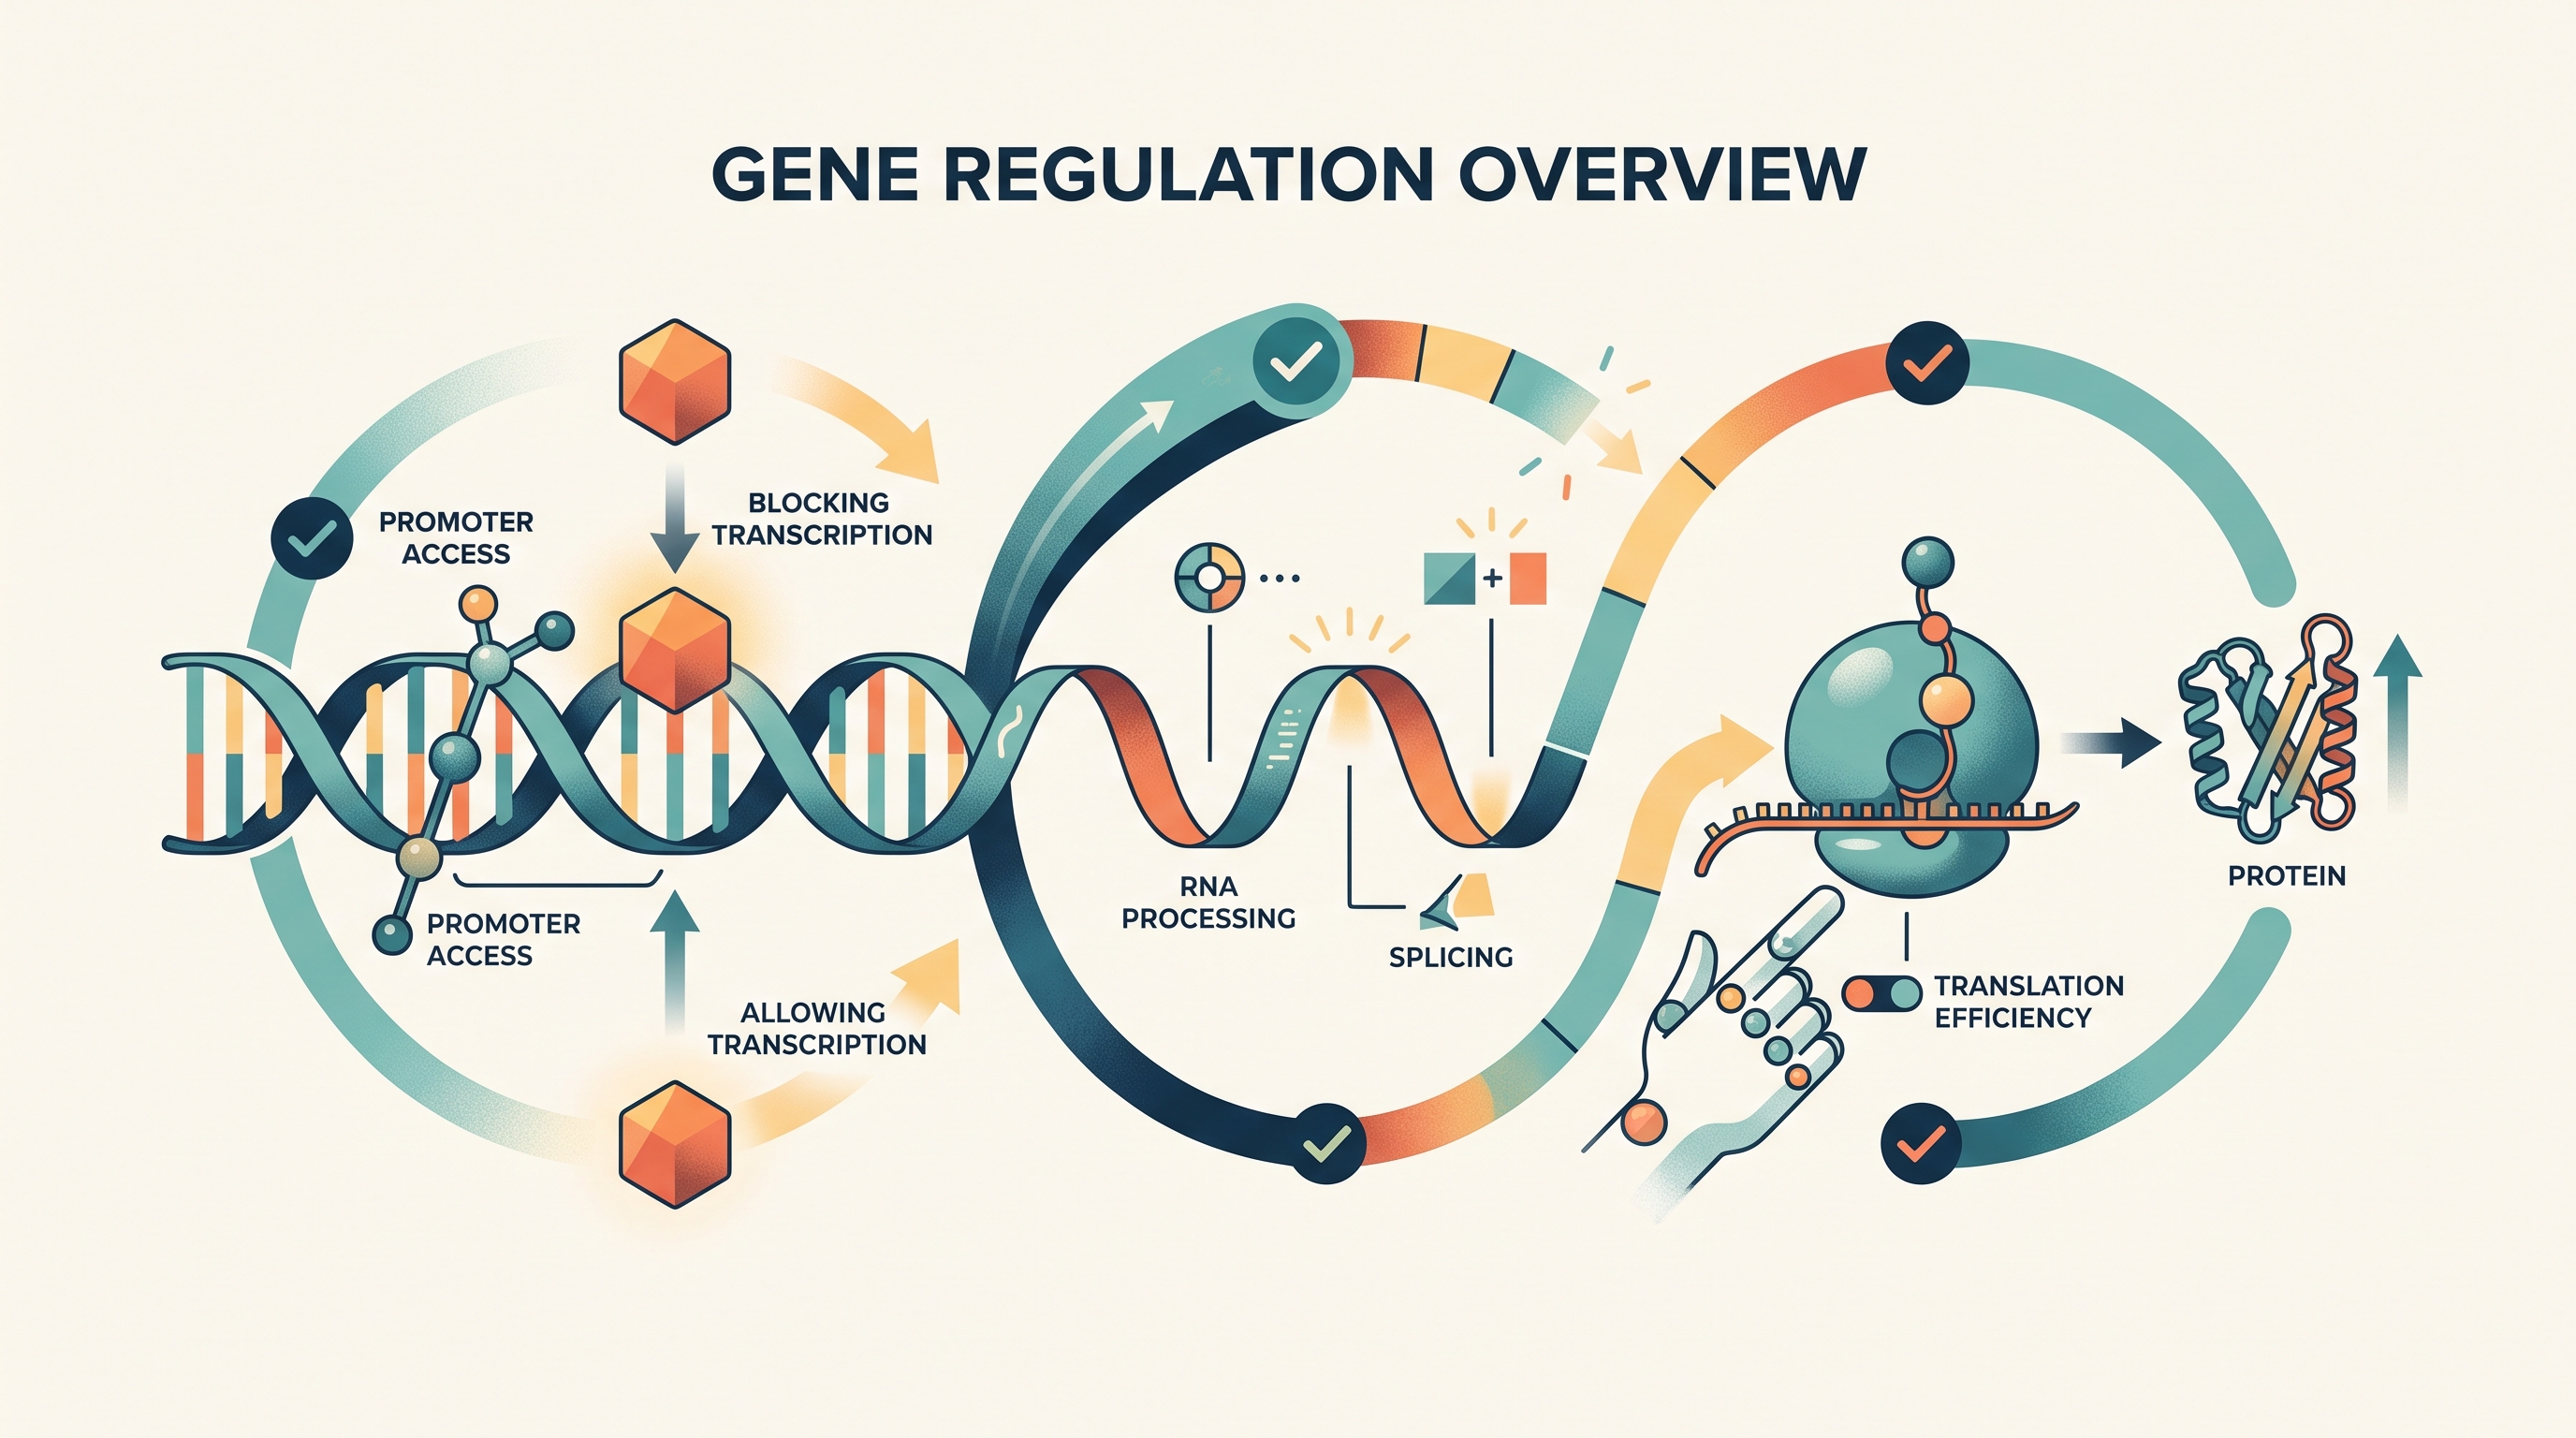
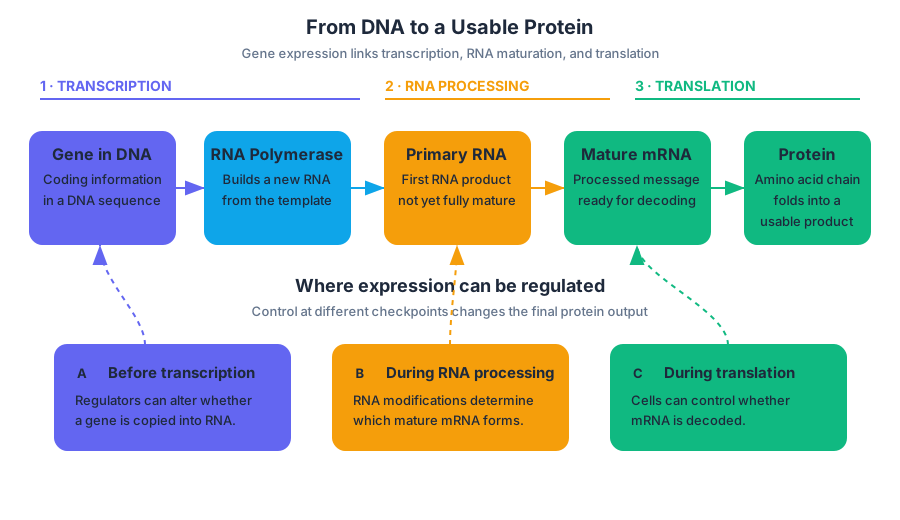
6.6 Gene Expression and Cell Specialization
Key concepts: Gene expression and its regulation · Cell specialization through differential gene expression · Gene regulation’s effects on cell products and functions · Epigenetic regulation by reversible DNA or histone modifications · Transcription factors and sequential gene expression during development · Small RNA molecules as regulators of gene expression · DNA and RNA structure and roles in gene expression · Using fluorescence markers such as GFP to measure gene expression
A neuron and a muscle cell can contain the same genome yet perform radically different jobs because they express different genes, make different products, and activate different cellular pathways.
6.6 Gene Expression and Cell Specialization
A neuron and a muscle cell can contain the same genome yet perform radically different jobs because they express different genes, make different products, and activate different cellular pathways. Differential gene expression means that cells use different subsets of the shared genetic information, or produce different amounts of particular gene products.
Learning Objective 6.6.B: Explain the connection between the regulation of gene expression and phenotypic differences in cells and organisms.
The central chain is:
$$ \text{same DNA} \rightarrow \text{different genes expressed} \rightarrow \text{different RNA and proteins} \rightarrow \text{different cell functions} \rightarrow \text{different phenotypes} $$
From one genome to many cell types
A cell’s phenotype is not determined simply by which genes it possesses. It depends on which genes are expressed and the levels at which they are expressed. For example, a muscle cell produces proteins that support contraction, whereas a neuron produces proteins that support electrical signaling and communication. Their differences arise because gene regulation directs each cell toward a particular set of products.
Gene regulation is the control of when, where, and how strongly genes are expressed. In this topic, the important consequence is not merely that a gene is “on” or “off”: changing expression can alter the amount of a cell product, the cell’s function, and the organism’s observable phenotype. This is 6.6.B.1: Gene regulation results in differential gene expression and influences cell products and functions.
Key distinction: Cell specialization does not usually require different DNA sequences in every cell. It requires different patterns of gene expression.
Development as a sequence of decisions
During development, one activated gene can produce a transcription factor—a protein that influences whether other genes are transcribed. That second wave of gene expression can activate additional transcription factors, producing a sequence of increasingly specialized cellular states.
$$ \text{transcription factor}_1 \rightarrow \text{gene set}_2 \rightarrow \text{transcription factor}_2 \rightarrow \text{gene set}_3 $$
This sequential process explains how a developing cell can acquire a stable function rather than switching randomly among cell types. The resulting products determine what the cell can do: a change in gene expression may alter receptors, enzymes, structural proteins, or signaling molecules. Because these products participate in pathways, an early expression change can also alter downstream signal transduction, changing how the cell responds to later signals.
Epigenetic control: adjustable access to genes
Epigenetic changes are reversible modifications of DNA or histones—the proteins associated with DNA—that influence whether genes are accessible for expression. These changes do not need to alter the DNA sequence itself. Instead, they can help maintain different expression patterns in specialized cells, allowing a liver cell and a neuron to preserve distinct identities while carrying the same genetic information.
The word reversible matters. If an epigenetic state changes, the expression of a gene may increase or decrease, which can change the cell products and functions produced from that gene. Epigenetic regulation therefore connects molecular control with phenotype without requiring a new DNA sequence.
RNA is both information and regulation
Gene expression involves both major nucleic acids. DNA is the relatively stable information-storage molecule, while RNA is produced from DNA and can carry or use that information during gene expression. Their different structures and roles make it possible for information to move from stored genetic instructions to functional products.
Not all RNA serves only as an intermediate. Certain small RNA molecules have roles in regulating gene expression, which is the required idea in 6.6.B.2. Small RNAs can influence whether particular RNA molecules remain available for producing protein, adding another layer of control over which products a cell makes.
Worked example: measuring specialization with GFP
Suppose researchers attach a gene-regulatory sequence to a gene encoding green fluorescent protein, or GFP. When the regulatory sequence is active, the cell produces GFP and glows; when it is inactive, the cell remains nonfluorescent.
Reasoning: Cells with fluorescence are expressing the linked gene-regulatory sequence. If fluorescence appears only in one developing cell population, that population is using a different gene-expression pattern from the others. If fluorescence becomes brighter over time, the data support increased expression rather than merely the presence of the gene. Researchers can therefore use GFP to measure gene expression directly and connect expression patterns to cell identity or behavior.
Common misconception check
Misconception: “A specialized cell has only the genes needed for its job.” Most specialized cells retain the organism’s genome; they differ because gene regulation determines which genes are expressed and at what levels. A second misconception is that every gene-expression change immediately changes an organism’s visible appearance. The effect depends on the product involved, its amount, and its position in downstream cellular pathways.
Retrieval check
A developing cell begins producing a new transcription factor, then later produces a tissue-specific protein and gains a new function. What best explains the sequence?
Answer: The transcription factor initiated sequential gene expression. The later tissue-specific protein changed the cell’s products and function, producing specialization through differential gene expression. This reasoning applies Science Practice 6.B, Argumentation, because the claim is supported by biological evidence linking transcription factors, gene expression, cell products, and phenotype.
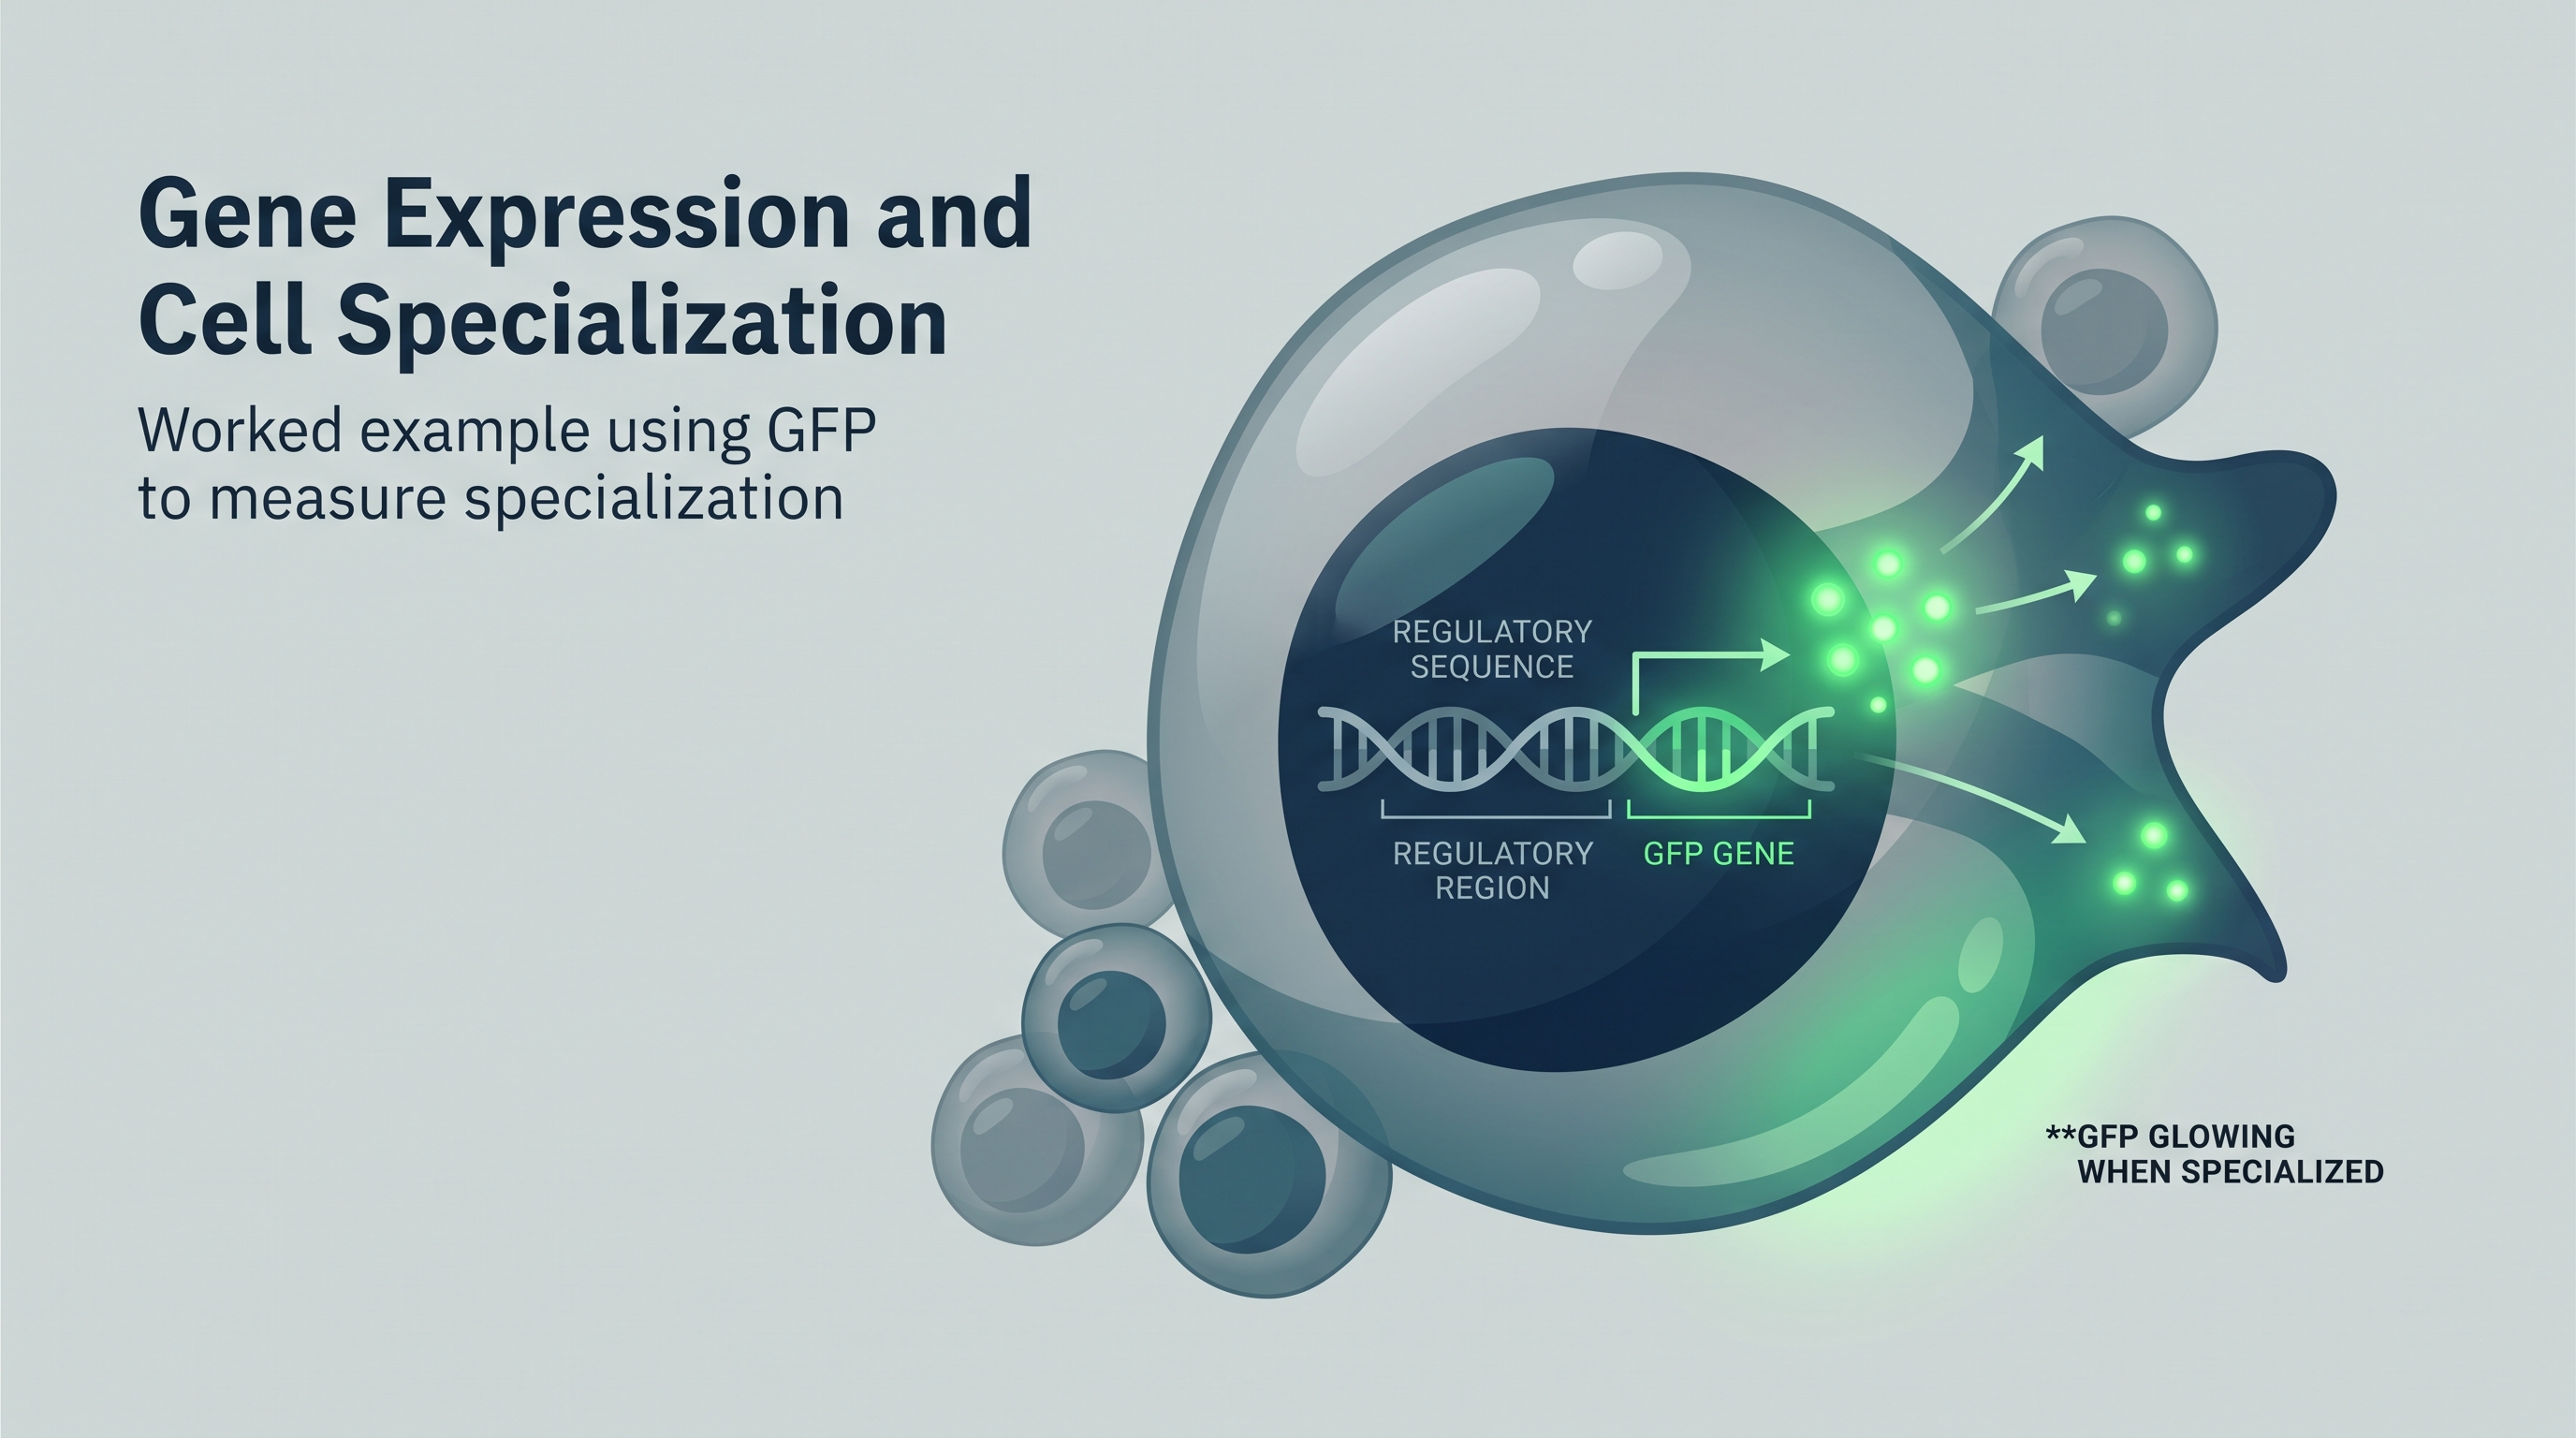
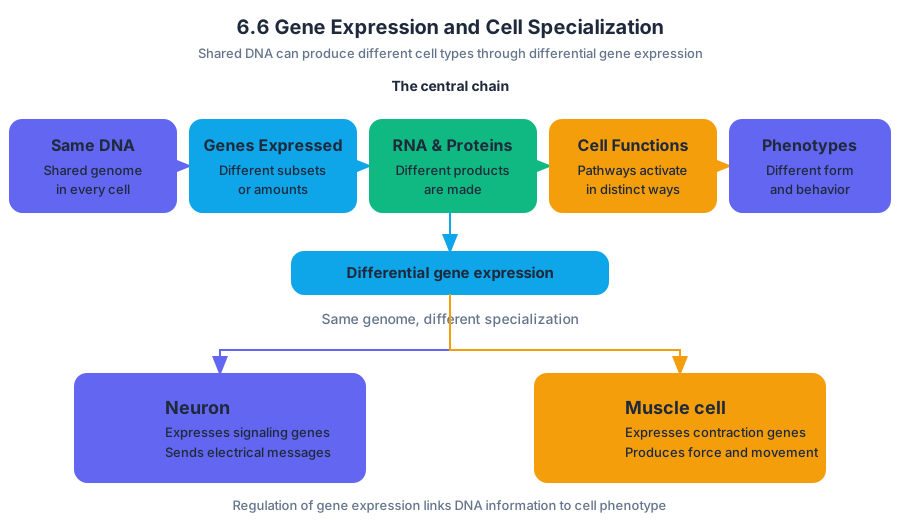
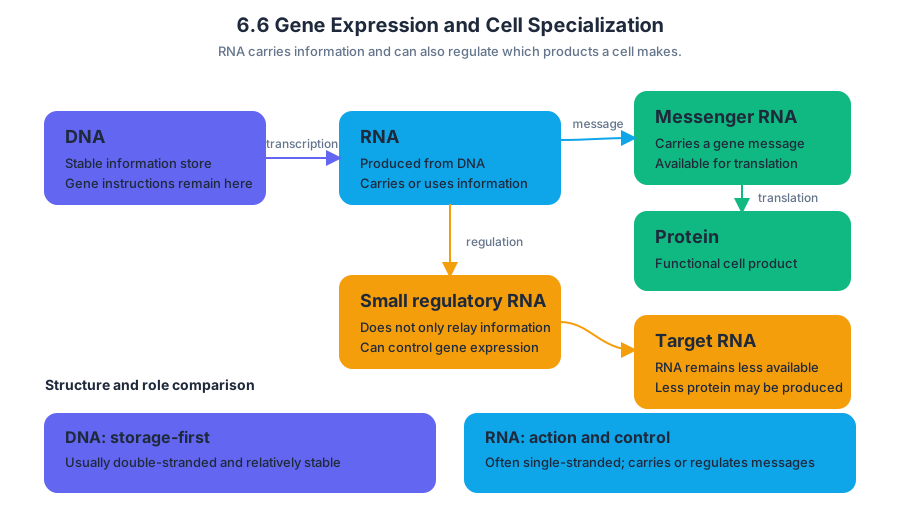
6.7 Mutations
A mutation is a change in the nucleotide sequence of a genome, and its biological effect can range from invisible to life-changing. The crucial question is not simply “Did the DNA change?” but rather: How could this change alter a gene product, a cellular pathway, and ultimately a phenotype?
6.7 Mutations
A mutation is a change in the nucleotide sequence of a genome, and its biological effect can range from invisible to life-changing. The crucial question is not simply “Did the DNA change?” but rather: How could this change alter a gene product, a cellular pathway, and ultimately a phenotype?
Learning Objective 6.7.A: Explain how mutations can result in changes to the structure and function of an organism.
Essential Knowledge 6.7.A.1: Mutations are changes in the nucleotide sequence of a genome.
From altered DNA to altered phenotype
DNA contains information used to produce functional RNA and proteins. A mutation can change the information in a gene, which may change the sequence or amount of a protein. Because proteins act as enzymes, receptors, transporters, structural fibers, and signals, a DNA change can propagate through several biological levels:
$$ \text{DNA mutation} \rightarrow \text{altered RNA or gene expression} \rightarrow \text{altered protein} \rightarrow \text{altered cell function} \rightarrow \text{altered phenotype} $$
However, this chain is possible, not automatic. A mutation may occur in a noncoding region, change a codon without changing the amino acid, or alter an amino acid that does not affect protein function.
Mutation types: where the change occurs matters
A point mutation changes one nucleotide. If the altered codon still specifies the same amino acid, the mutation is silent. If it specifies a different amino acid, it is missense. If it changes a codon into a stop codon, it is nonsense, producing a shortened polypeptide.
An insertion adds nucleotide(s), whereas a deletion removes nucleotide(s). If the number added or removed is not a multiple of three, the reading frame changes. This is a frameshift mutation: every codon after the mutation may be regrouped, often producing a dramatically altered or prematurely terminated protein.
| DNA change | Possible molecular result | Typical consequence |
|---|---|---|
| One nucleotide substituted | Silent, missense, or nonsense codon | No effect, altered amino acid, or shortened protein |
| One or more nucleotides inserted | Reading frame may shift | Altered downstream amino acids |
| One or more nucleotides deleted | Reading frame may shift | Altered downstream amino acids |
| Mutation in a regulatory sequence | Gene may be transcribed more or less often | Changed protein amount |
The location of a mutation is therefore essential. A substitution near an active site may disrupt an enzyme’s function, while the same substitution in a less important region may have little effect. A mutation affecting a regulatory sequence may leave the protein’s amino acid sequence unchanged but alter how much of that protein the cell produces.
Worked example: a CFTR mutation and transport
The CFTR gene provides instructions for a membrane protein involved in ion transport. Imagine a mutation that disrupts the CFTR protein’s structure. If the protein cannot fold correctly, reach the plasma membrane, or transport ions effectively, chloride movement across epithelial cells changes.
That molecular change affects water movement because dissolved ions influence the osmotic movement of water. Secretions may become unusually thick, impairing the function of tissues such as those lining the respiratory tract. The reasoning chain is:
$$ \text{CFTR nucleotide change} \rightarrow \text{altered CFTR protein} \rightarrow \text{impaired ion transport} \rightarrow \text{altered water movement} \rightarrow \text{changed tissue function and phenotype} $$
A strong biological explanation must connect each level with a mechanism. Saying only “the mutation causes disease” skips the evidence-based reasoning that explains why the phenotype appears.
Misconception check: mutations are not automatically harmful
Named misconception — “All mutations are harmful.” Mutations can be harmful, beneficial, or neutral. A mutation is neutral when it does not produce a detectable change in phenotype under the conditions being studied. A silent substitution is one possible example, but even a missense mutation may be neutral if the altered amino acid does not significantly affect folding or function.
Named misconception — “A mutation denatures a protein.” A mutation changes DNA; it does not directly denature a protein. Denaturation is the loss of a protein’s three-dimensional structure caused by factors such as extreme temperature or pH. A mutation may instead change the amino acid sequence, which can cause a protein to fold differently or become less stable.
Named misconception — “A point mutation causes a frameshift.” A point substitution changes one nucleotide but does not shift the reading frame. Frameshifts generally result from insertions or deletions that are not divisible by three.
AP skill focus: Visual Representations
Suggested Skill 2.C — Visual Representations: Explain how biological models relate to larger principles, concepts, processes, systems, or theories. For mutations, this means using a sequence, codon chart, pathway diagram, or phenotype model to connect a molecular alteration to organismal function. On an exam, do not merely identify the changed nucleotide: use the representation as evidence for the predicted protein or phenotype change.
Retrieval check: A three-nucleotide deletion removes one amino acid but does not shift the reading frame. A one-nucleotide deletion occurs near the beginning of the coding sequence. Which is more likely to alter many downstream amino acids, and why? The one-nucleotide deletion is more likely because it creates a frameshift, changing how subsequent nucleotides are grouped into codons.
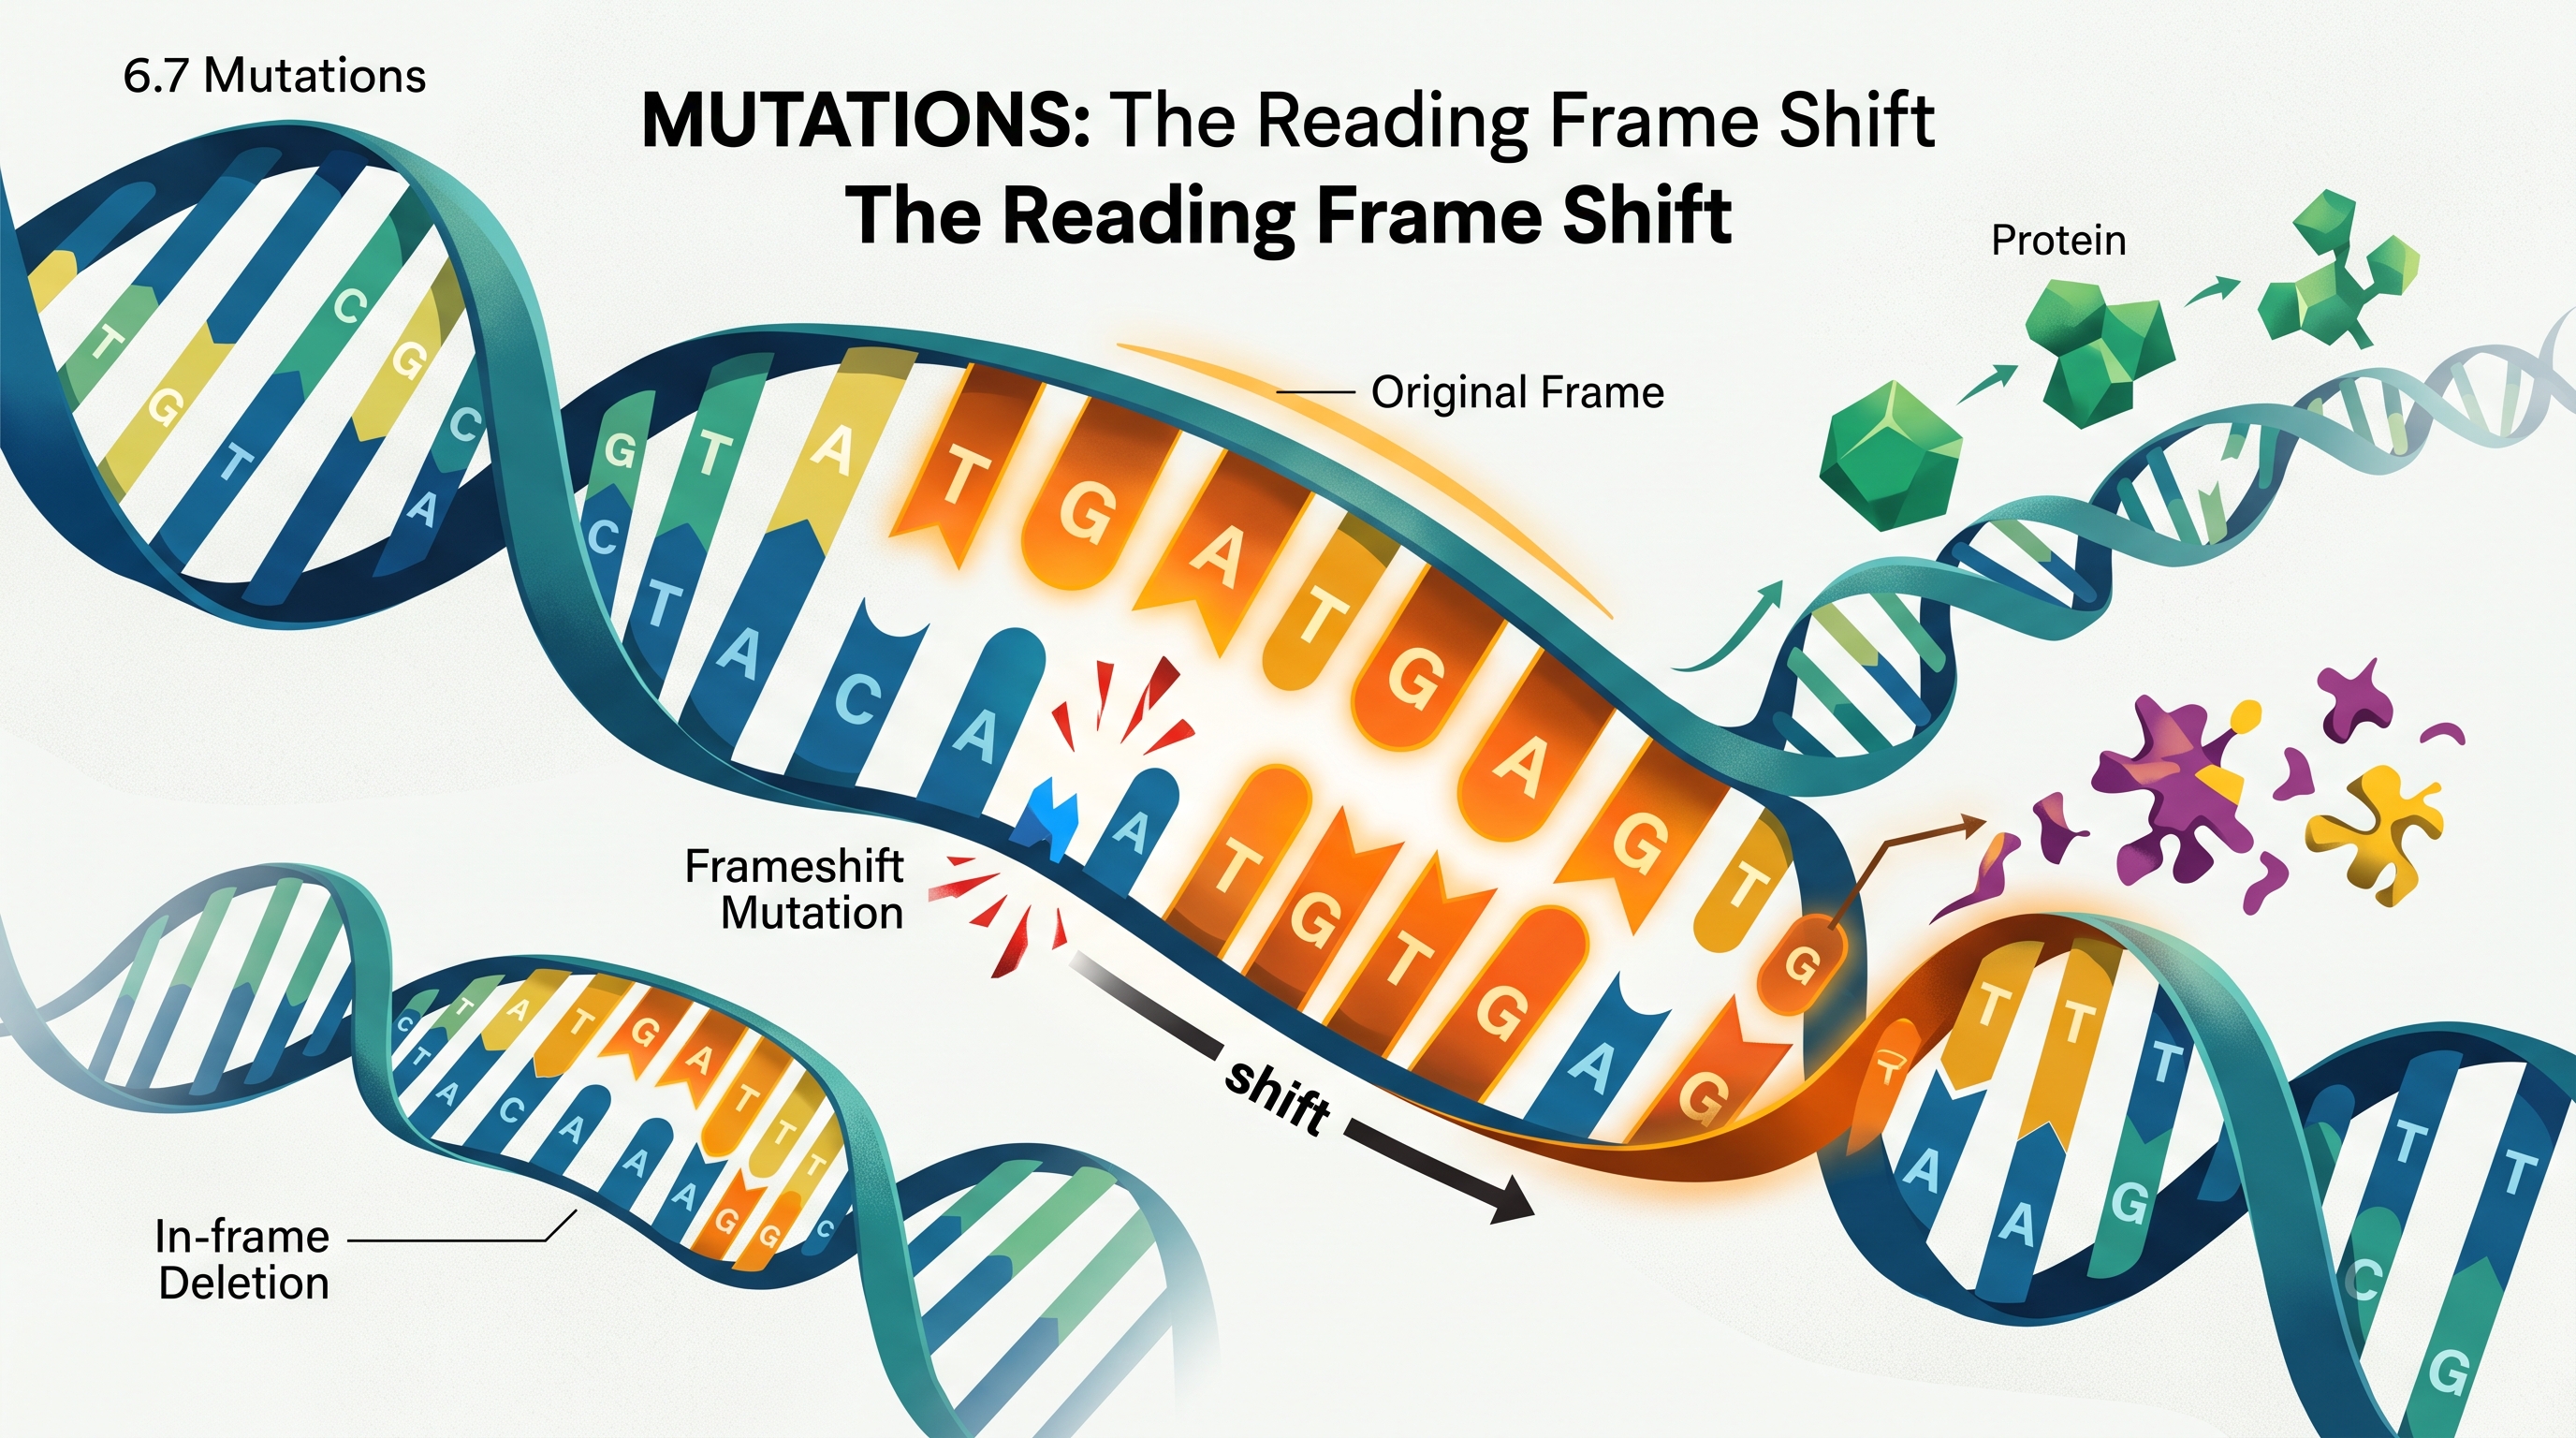
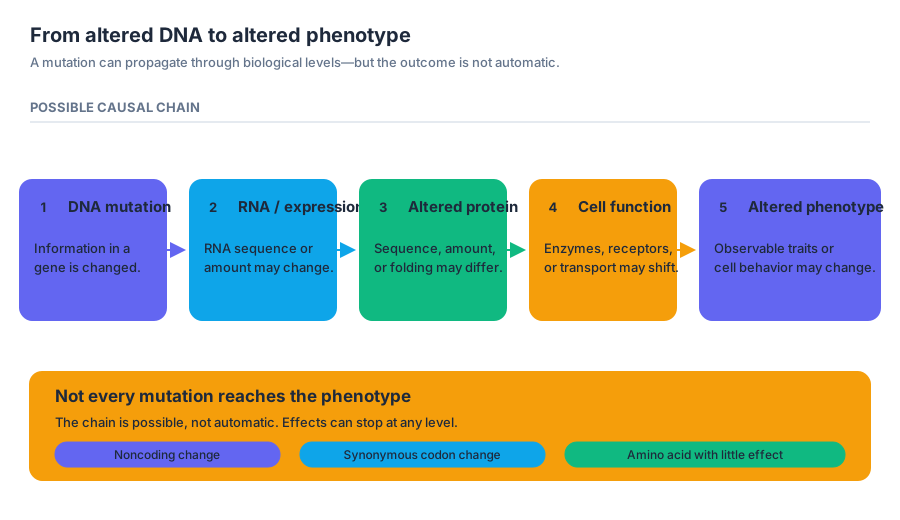
6.8 Biotechnology
A tiny biological sample can become a readable genetic result through biotechnology: the use of laboratory techniques to manipulate, copy, separate, or analyze DNA and RNA.
6.8 Biotechnology
A tiny biological sample can become a readable genetic result through biotechnology: the use of laboratory techniques to manipulate, copy, separate, or analyze DNA and RNA. The central question is practical and powerful: How can scientists turn an invisible nucleotide sequence into evidence about identity, disease, ancestry, or gene function?
From DNA molecule to biological conclusion
Biotechnology works like a molecular workflow. Scientists first obtain genetic material, selectively copy or cut it, separate the resulting molecules, and then interpret a pattern or sequence. Each step answers a different question: What DNA is present? How much is present? How is it organized? Which sequence differs?
CED alignment — Learning Objective 6.8: Explain the applications of biotechnology.
Essential Knowledge 6.8.A: Biotechnology is used to manipulate DNA and RNA.
Science Practice 6.D — Argumentation: Explain the relationship between experimental results and larger biological concepts, processes, or outcomes.
Core biotechnology tools
| Tool | What it does | What the result can show |
|---|---|---|
| DNA sequencing | Determines the order of nucleotides in a DNA molecule | Whether two sequences match or contain a difference |
| Polymerase chain reaction (PCR) | Produces many copies of a selected DNA region | Whether a target sequence is present and large enough to analyze |
| Gel electrophoresis | Separates DNA fragments primarily by length | Whether samples contain fragments of particular sizes |
| Recombinant DNA technology | Combines DNA sequences from different sources | How a gene or regulatory sequence can be introduced into a biological system |
DNA sequencing: reading the information
DNA sequencing determines the order of bases in a DNA molecule. Because biological information is encoded in nucleotide order, sequencing can reveal whether a gene contains a particular variant, whether two samples are closely related, or whether a microorganism carries a medically important gene.
A sequence comparison must distinguish difference from meaning. Finding one base that differs between two samples is an experimental result; concluding that the difference changes protein function or causes a phenotype requires additional evidence. This distinction is the heart of 6.D — Argumentation: connect a result to a biological claim without claiming more than the evidence supports.
PCR: copying a target sequence
Polymerase chain reaction (PCR) amplifies a selected region of DNA, meaning it makes very many copies of that region. PCR requires template DNA, short primers that define the boundaries of the target, free nucleotides, DNA polymerase, and repeated temperature changes that separate DNA strands, allow primers to bind, and extend new strands.
Worked example: detecting a pathogen sequence
A researcher tests three water samples for a DNA sequence associated with a pathogen.
- The researcher extracts DNA from each water sample.
- Primers are selected to bind only to the pathogen-associated region.
- PCR amplifies that region if it is present in the sample.
- The amplified products are examined using gel electrophoresis.
- A band at the expected fragment length supports the claim that the target sequence was present.
The conclusion must include the control results. A positive control should produce the expected band, showing that the PCR reagents and procedure worked. A negative control should lack a band, showing that contamination did not create a false positive. If the unknown sample has the expected band while the negative control does not, the evidence supports—not absolutely proves—the presence of the target sequence.
Gel electrophoresis: separating DNA fragments
Gel electrophoresis separates DNA fragments as they move through a porous gel in an electric field. DNA has an overall negative charge, so it migrates toward the positive electrode. Shorter fragments move through the gel more easily and therefore travel farther than longer fragments.
A visible band represents many DNA fragments of similar length. A DNA ladder contains fragments with known sizes and provides a comparison scale. To interpret an unknown sample, compare its band positions with the ladder and with appropriate controls; do not identify a fragment merely because it appears in the same lane or has a similar intensity.
Common misconception — “A darker band means a longer DNA fragment.” Band position primarily indicates fragment length, whereas band intensity is more related to the amount of DNA present. A darker band may contain more copies of a fragment, but it is not automatically a longer fragment.
Recombinant DNA and genetic engineering
Recombinant DNA contains DNA joined from two or more sources. In genetic engineering, a desired gene or regulatory sequence can be inserted into a carrier DNA molecule and introduced into a cell. If the inserted sequence is expressed, the cell may produce a new RNA or protein; if it is not expressed, the DNA’s presence alone does not demonstrate that it is functioning.
This is another evidence chain: the inserted sequence is the molecular intervention, RNA or protein production is an intermediate result, and a changed cellular or organismal phenotype is a larger biological outcome. Strong argumentation identifies which link the experiment actually measured.
Retrieval check
A gel contains a DNA ladder, a positive control band at the expected position, no band in the negative control, and an unknown sample band at the same position as the positive control. What is the strongest conclusion?
The unknown sample contains DNA fragments of the expected size, supporting the presence of the target sequence. The controls support the validity of the procedure, but the result does not by itself demonstrate that the sequence is expressed, produces a functional protein, or causes a phenotype.
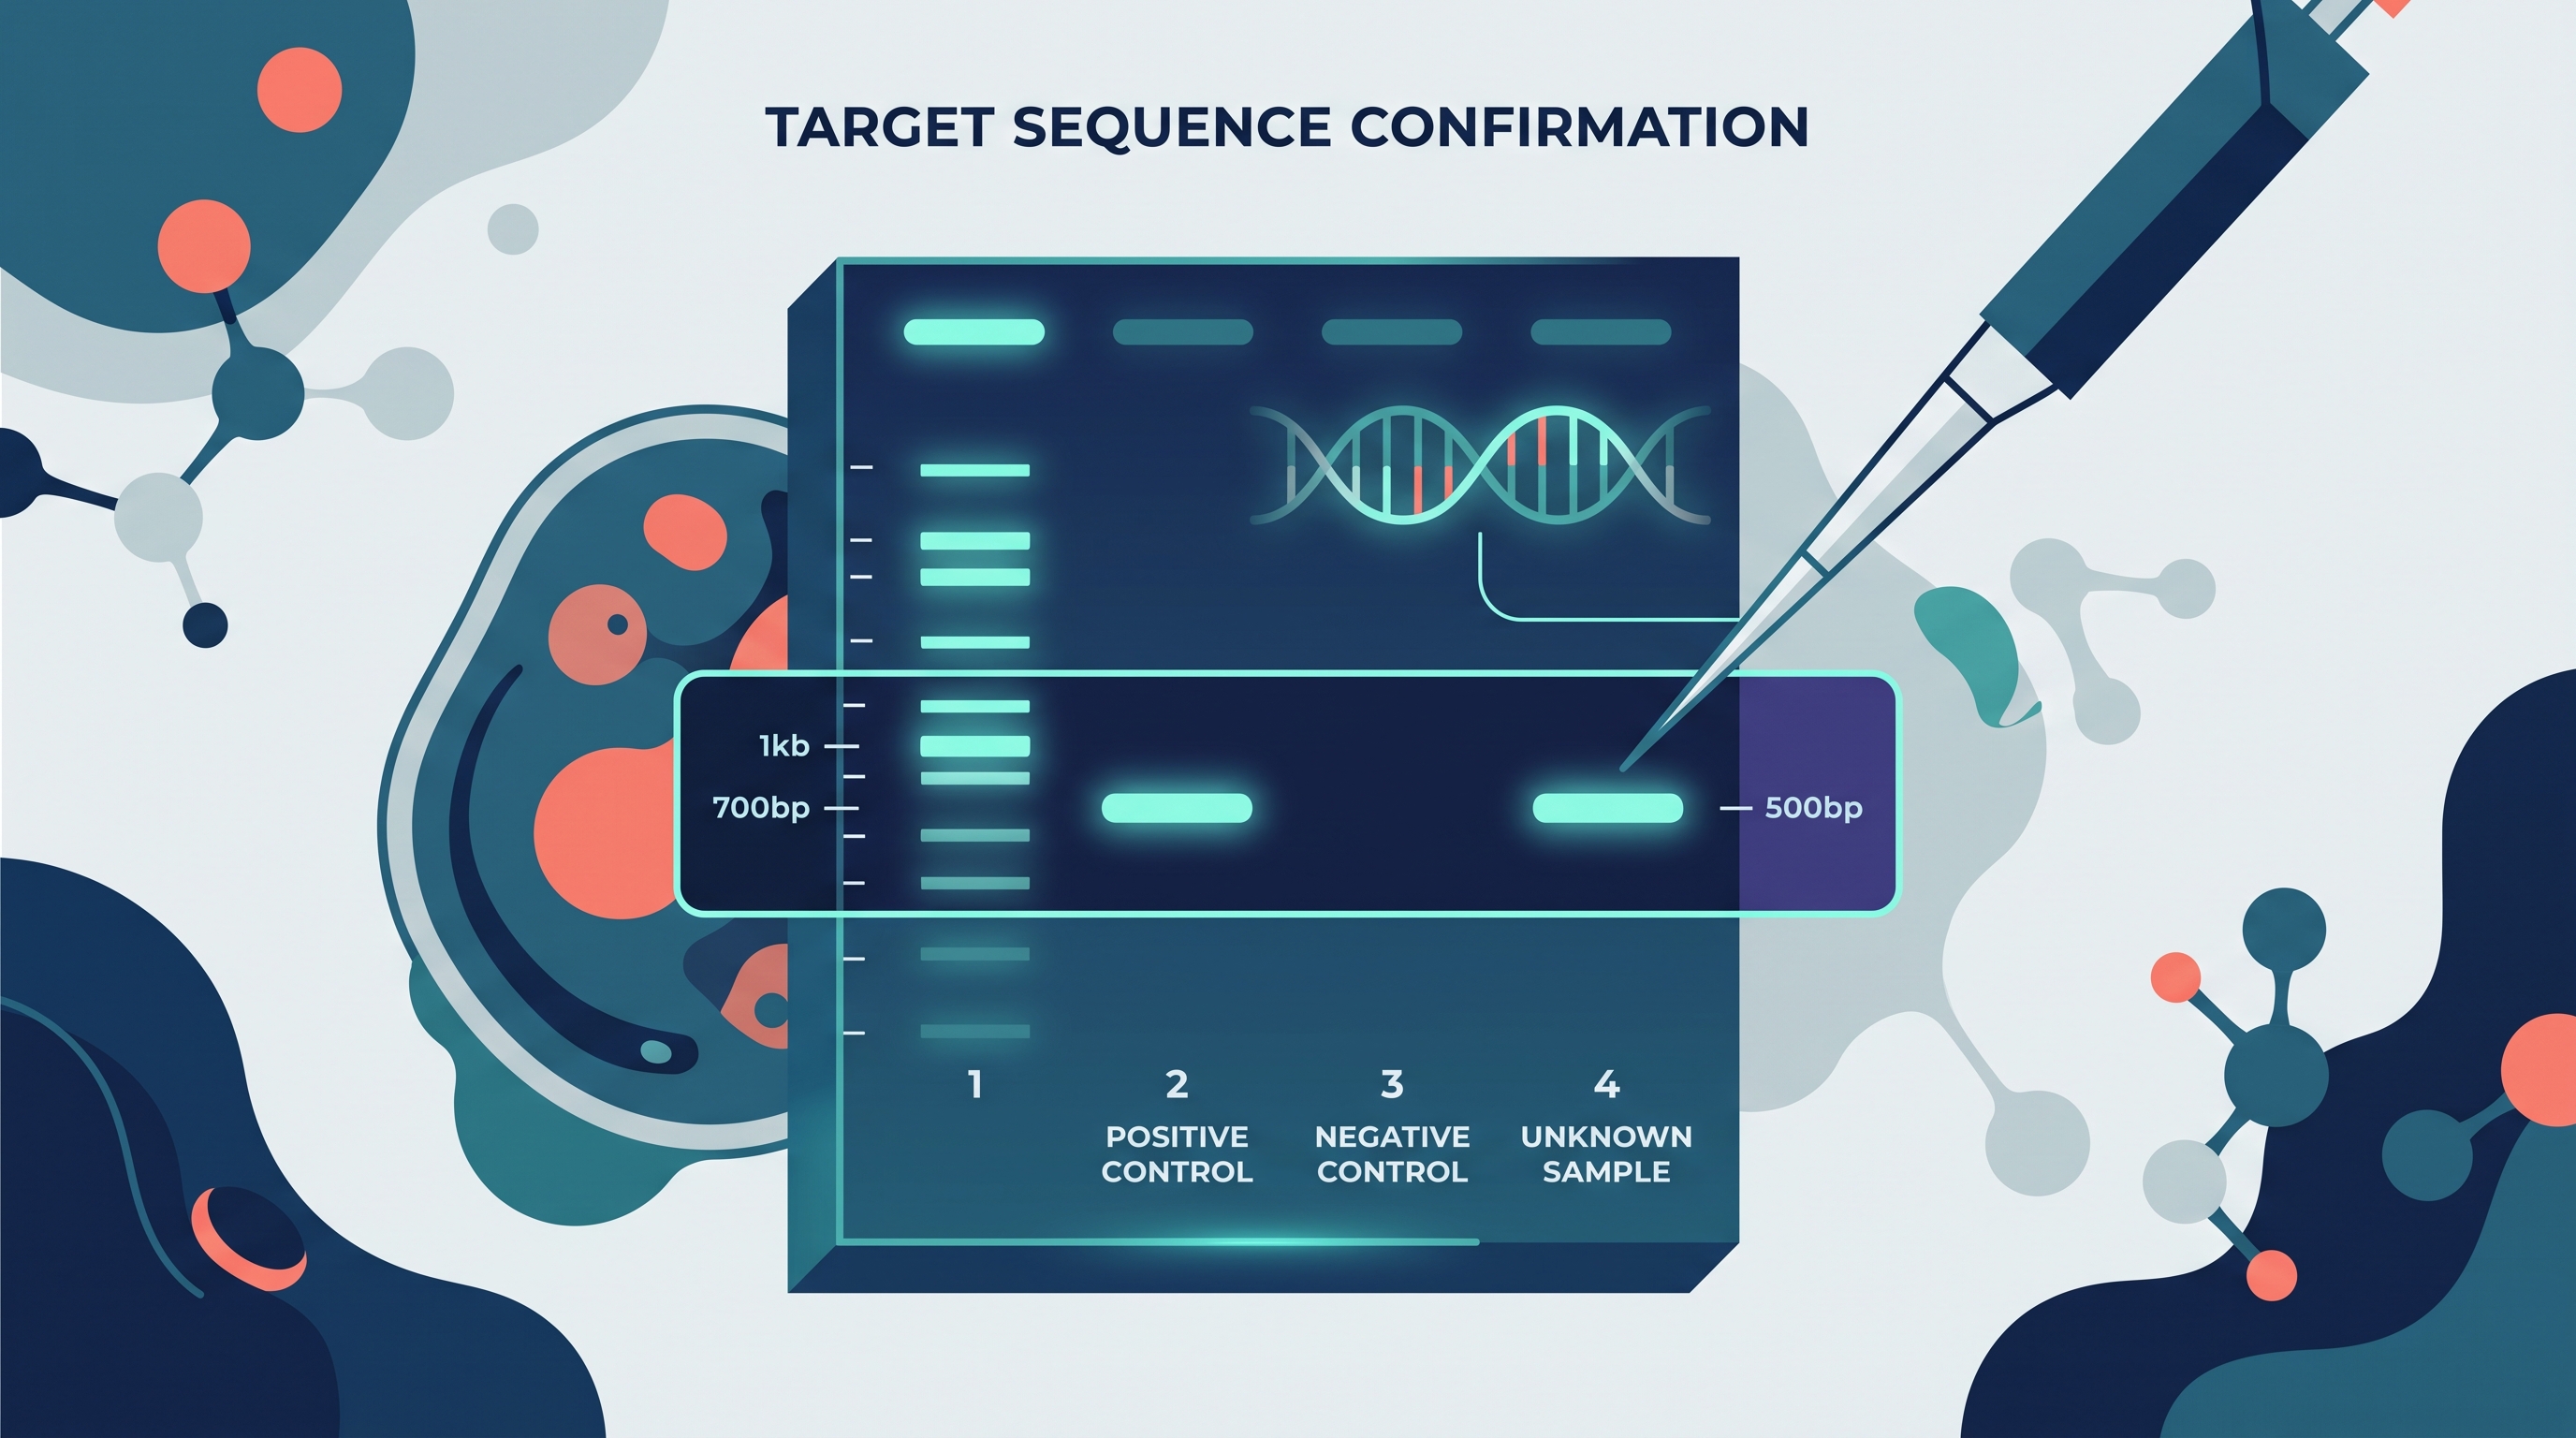
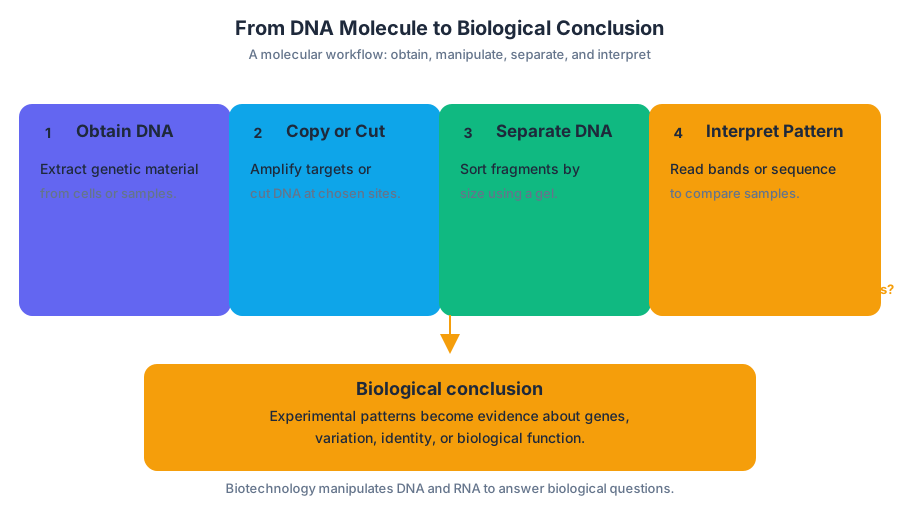
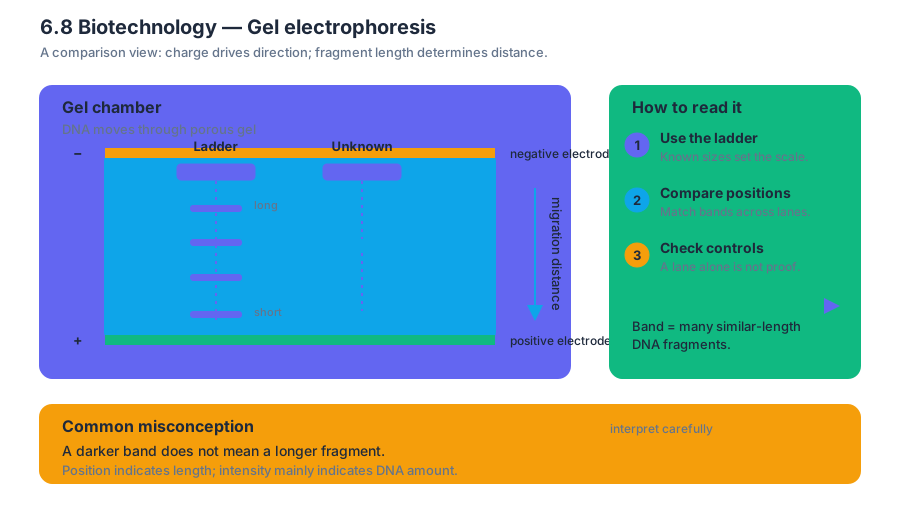
7.1 Introduction to Natural Selection
Key concepts: Natural selection · Phenotypic variation in populations · Fitness as an organism’s ability to survive and reproduce · Selective pressures · Adaptation · Similar adaptations arising in different populations or species · Evolution as a process driving the diversity and unity of life · Population change across generations · Using investigations and data to study natural selection
A population can change when individuals with different phenotypes—observable characteristics such as body color, height, or the number of leaf hairs—survive and reproduce at different rates.
7.1 Introduction to Natural Selection
A population can change when individuals with different phenotypes—observable characteristics such as body color, height, or the number of leaf hairs—survive and reproduce at different rates. The environment does not “choose” traits deliberately; instead, environmental conditions create selective pressures that make some heritable phenotypes more successful than others.
Natural selection acts on phenotypic variation within populations, and the population’s characteristics change across generations.
This distinction is essential: an individual organism does not evolve during its lifetime. Individuals may survive, reproduce, or fail to reproduce, but evolution is detected when the frequency or average expression of traits changes in the population over generations.
Phenotypic variation and fitness
Phenotypic variation is the difference in observable traits among individuals in the same population. Variation can arise from differences in inherited information, environmental effects, or an interaction between both. A phenotype matters to natural selection when it changes an organism’s ability to survive and produce offspring in a particular environment.
Fitness means an organism’s relative ability to survive and reproduce. It is not simply physical strength, size, speed, or health. A smaller organism may have greater fitness than a larger one if it survives long enough to leave more viable offspring.
For example, imagine a population of plants with variation in leaf-hair number. If herbivorous insects avoid plants with many leaf hairs, those plants may suffer less damage, produce more seeds, and contribute more offspring to the next generation. In that environment, the high-hair phenotype has greater fitness. If the environment changes so that leaf hairs reduce photosynthesis or attract another consumer, the relative fitness of the same phenotype could decrease.
Misconception check — “The organism develops the trait it needs.” A plant does not grow extra hairs because it anticipates herbivory. Natural selection requires preexisting variation; environmental conditions determine which existing phenotypes leave more descendants.
Selective pressures and adaptation
A selective pressure is an environmental condition that causes some phenotypes to have greater survival or reproductive success than others. Examples include temperature, predation, disease, competition, food availability, and access to mates. The pressure is not automatically beneficial or harmful: its effect depends on the environment and the phenotype.
An adaptation is a heritable population characteristic that becomes common over generations because it improves fitness in a particular environment. The sequence is:
- Individuals in a population vary in phenotype.
- The environment creates a selective pressure.
- Some phenotypes produce more surviving offspring.
- Heritable characteristics associated with those phenotypes become more common.
- The population’s average phenotype or trait distribution changes across generations.
The same logic applies to molecular variation. Differences in the number or types of molecules within cells can improve an organism’s ability to survive and reproduce under particular conditions. For example, variation in cellular proteins may affect resistance to a toxin, while variation in pigments may affect camouflage.
CED traceability: Learning Objective 7.2.A, Essential Knowledge 7.2.A.1, 7.2.A.2, and 7.2.A.3 address phenotypic variation, environmental selective pressures, and changes in fitness. Learning Objective 7.2.B and Essential Knowledge 7.2.B.1 connect molecular variation within cells to organismal fitness.
Investigating selection with population data
A natural-selection investigation compares populations or generations before and after selection. Suppose students select plants with the greatest number of leaf hairs from a first generation and use their seeds to produce a second generation. A useful first comparison is the sample mean:
$$\bar{x}=\frac{1}{n}\sum x_i$$
If the first generation has a mean of $18$ hairs per leaf and the second generation has a mean of $25$, the descriptive result suggests an increase. However, a difference between means does not automatically demonstrate selection. Sampling variation could produce different means even when the populations are not meaningfully different.
To judge the evidence, investigators examine variation using standard deviation or standard error, display means with appropriate error bars, and apply a statistical test when suitable. The standard error is:
$$SE_{\bar{x}}=\frac{s}{\sqrt{n}}$$
A statistical result helps determine whether the observed difference is statistically significant rather than likely to be random sampling variation. The conclusion should identify the evidence, explain the relationship between selection and phenotype, and avoid claiming more than the experiment tested.
AP Science Practices: This investigation uses Science Practice 1: Concept Explanation to connect phenotype, fitness, and adaptation; Science Practice 2: Visual Representations to interpret trait distributions and graphs; Science Practice 3: Questions and Methods to design comparisons between generations; Science Practice 4: Representing and Describing Data to calculate and graph population means; Science Practice 5: Statistical Tests and Data Analysis to evaluate whether differences are statistically significant; and Science Practice 6: Argumentation to support a claim about selection with evidence and reasoning.
Similar pressures, similar adaptations
Different populations or species can encounter similar selective pressures and independently evolve similar phenotypic adaptations. This pattern is convergent evolution. Streamlined bodies in sharks and dolphins, for instance, reflect similar selective pressures associated with efficient movement through water, even though these organisms do not share a recent common ancestor with a streamlined body.
Natural selection therefore helps explain both the diversity and unity of life. Populations become different as they respond to different environments, yet similar environmental challenges can produce similar solutions. The underlying mechanism remains the same: variation, differential fitness, inheritance, and change across generations.
Retrieval check: A drought causes plants with deeper roots to produce more seeds than plants with shallow roots. Identify the selective pressure, the phenotype associated with higher fitness, and the population-level change expected after several generations. Why would “the plants evolved deeper roots during the drought” be an imprecise statement?
Flashcard prompt: What does natural selection act on, and what changes as a result?
Answer: Natural selection acts on phenotypic variation among individuals; across generations, the characteristics and trait frequencies of the population change.
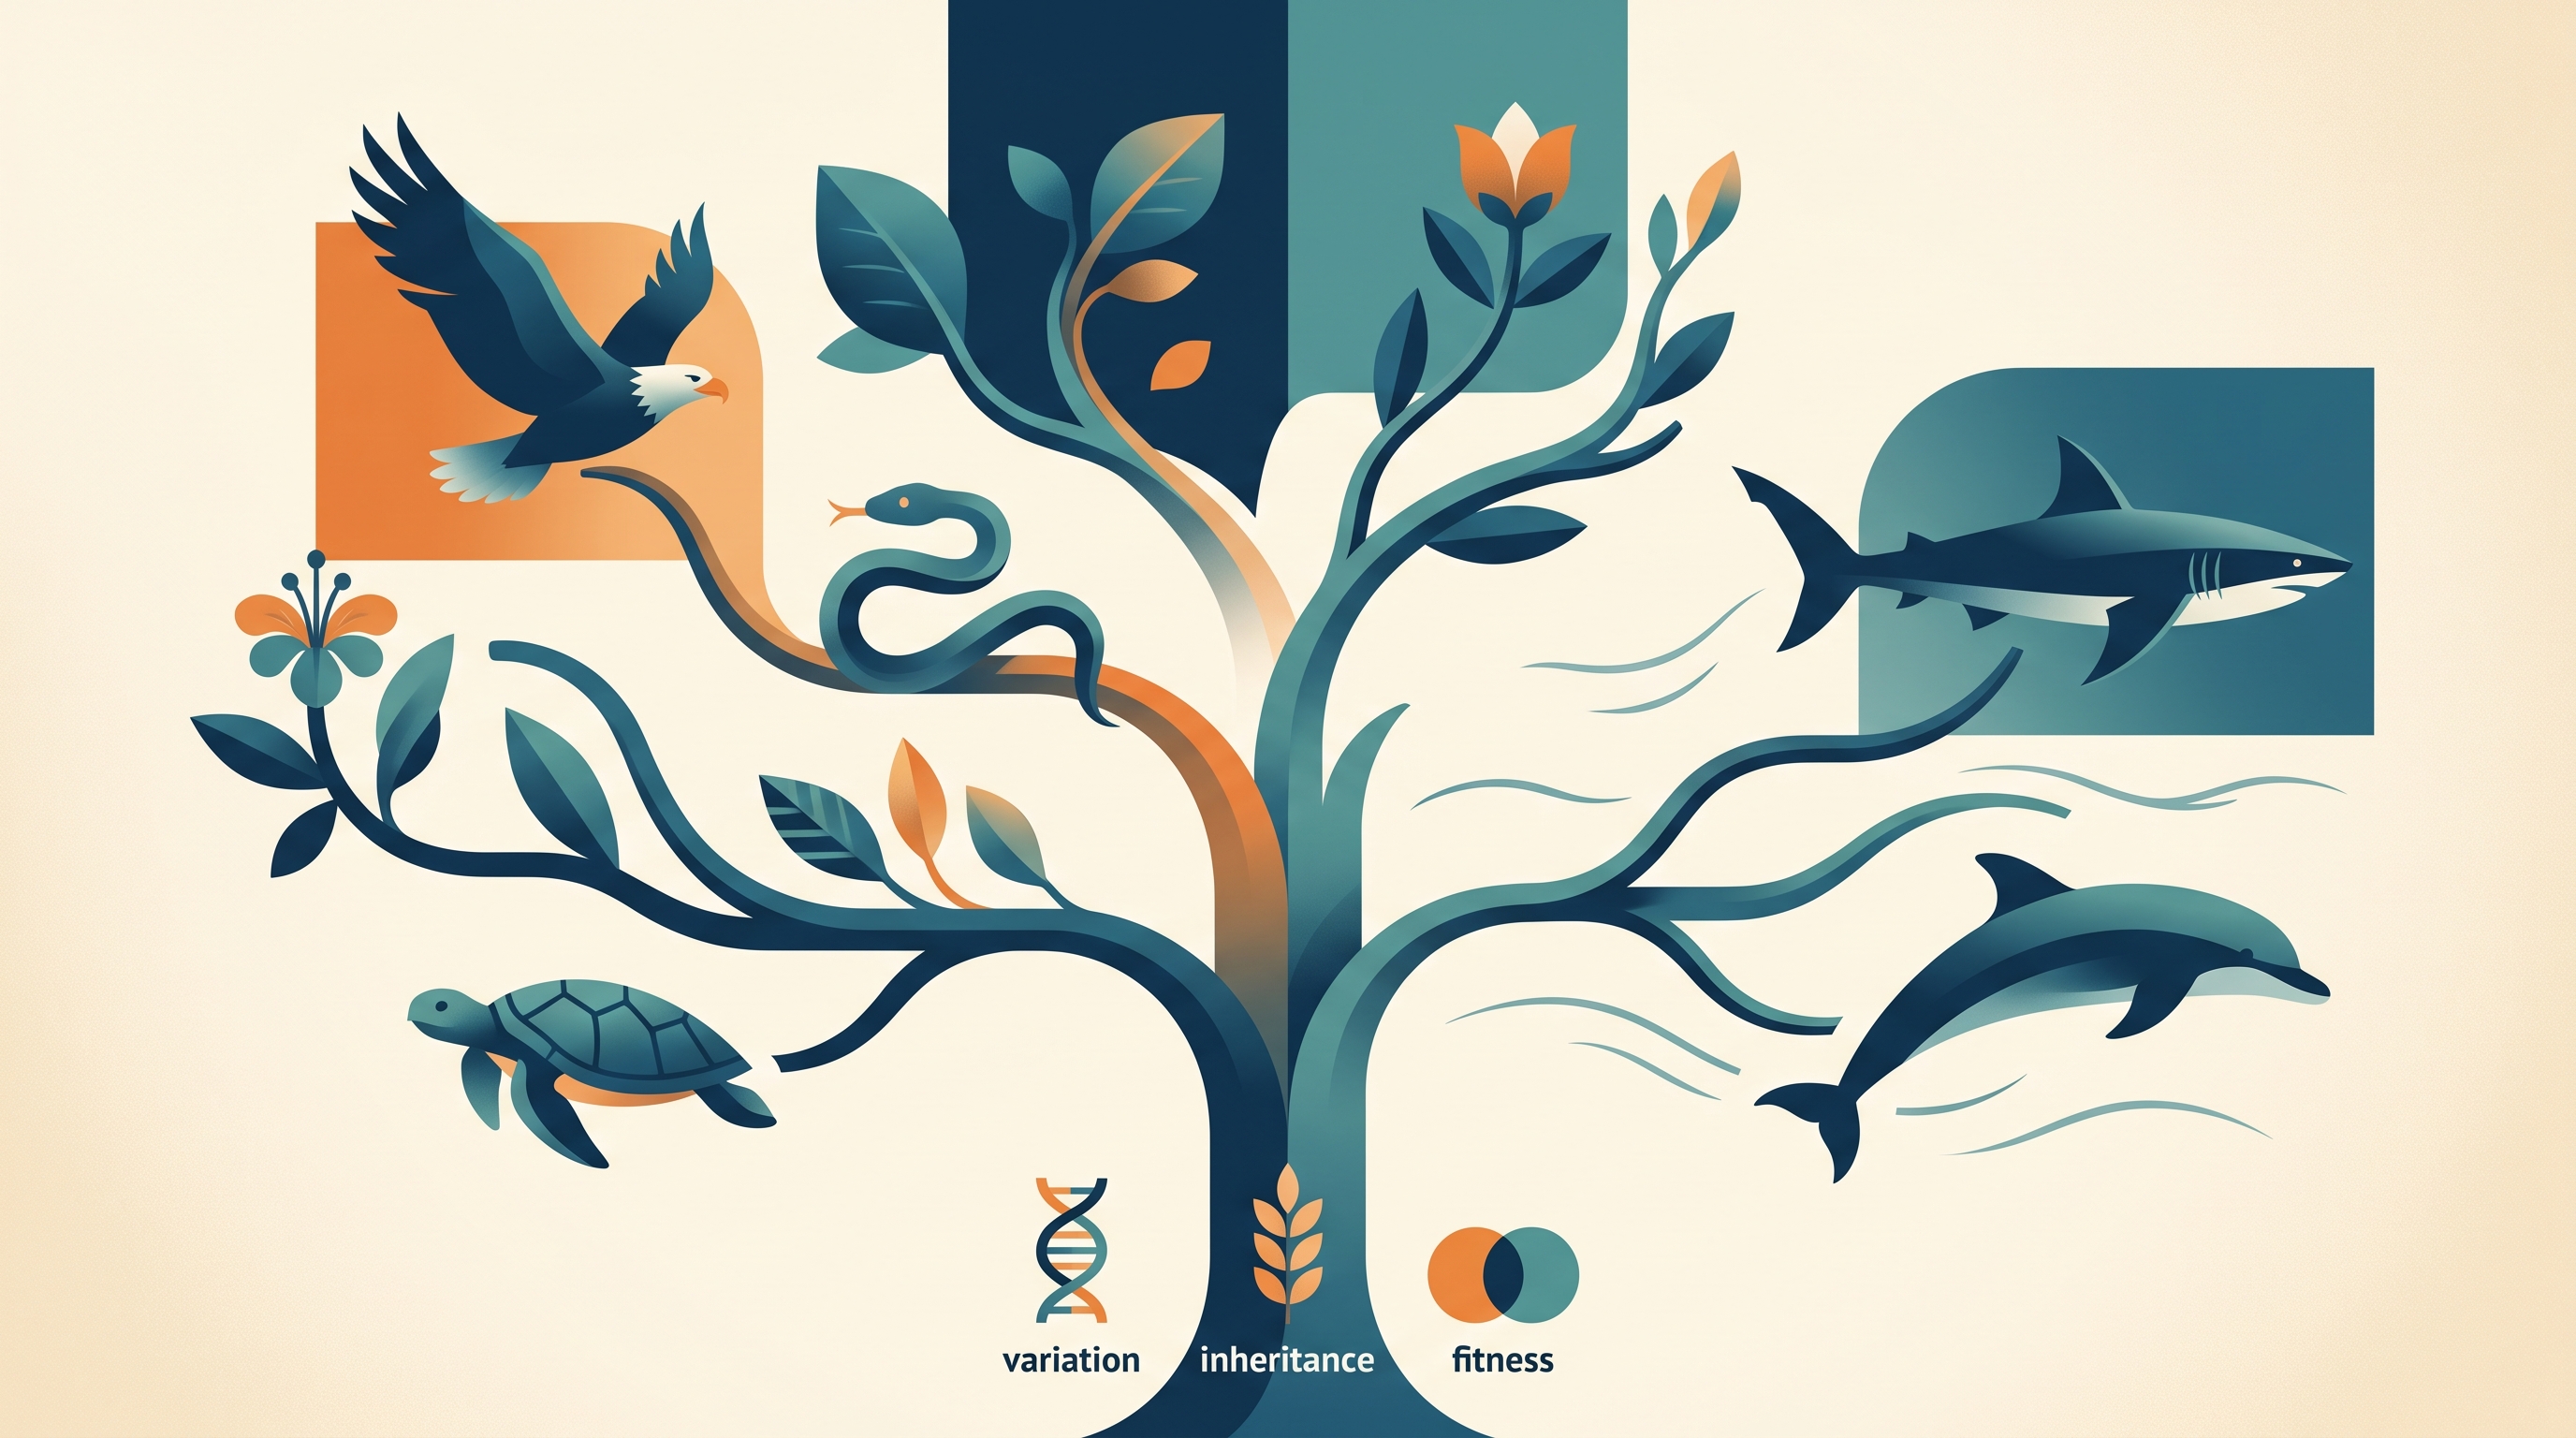
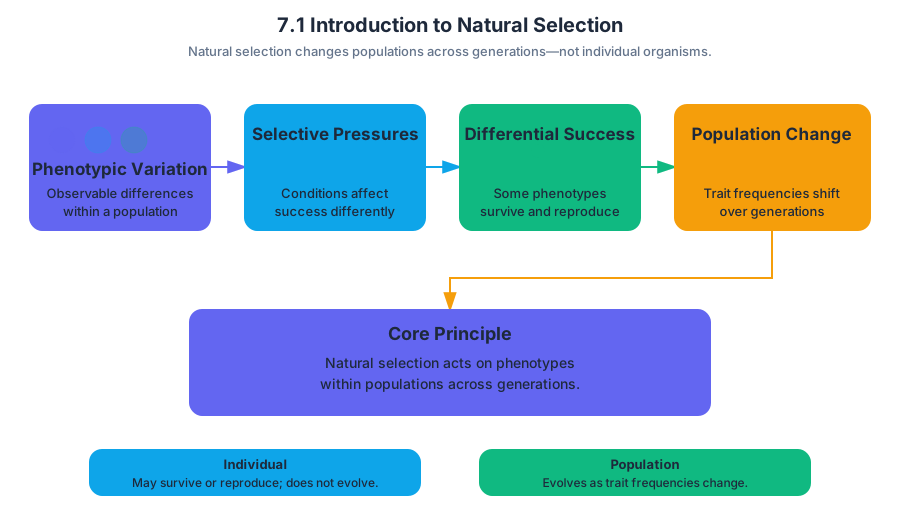
7.2 Natural Selection
Key concepts: Natural selection as a mechanism of evolution · Artificial selection in agricultural crops · Phenotypic variation in populations · Quantitative traits · Environmental factors and differential reproduction · Antibiotic resistance in bacteria as an example of natural selection · Population change over time as evolution · Computer and structured simulations of natural selection · Measuring natural selection experimentally · Variation and selection in natural populations of Arabidopsis thaliana
Natural selection occurs when environmental conditions cause some organisms to reproduce more successfully than others, changing the population’s genetic makeup across generations. The organisms do not change because they “need” to; instead, heritable phenotypic variation already present in the population affects…
7.2 Natural Selection
Natural selection occurs when environmental conditions cause some organisms to reproduce more successfully than others, changing the population’s genetic makeup across generations. The organisms do not change because they “need” to; instead, heritable phenotypic variation already present in the population affects survival and reproduction.
Learning Objective 7.2.A: Explain how natural selection affects populations.
Essential Knowledge 1.A.1: Natural selection is a major mechanism of evolution.
Essential Knowledge 1.A.2: Natural selection acts on phenotypic variations in populations.
From individual differences to population change
A population is a group of organisms of the same species living in the same area. Its members may differ in observable characteristics, or phenotypes, such as height, coloration, growth rate, resistance to disease, or the number of plant hairs called trichomes.
Natural selection follows a causal chain:
- A population contains phenotypic variation.
- Some variation is influenced by genetic differences and can be inherited.
- Environmental factors affect which individuals survive, find mates, or produce viable offspring.
- Individuals with traits that improve reproductive success leave more offspring.
- Alleles associated with those traits become more common in later generations.
- The population changes over time; that population-level change is evolution.
The environment does not select traits directly like a person choosing items from a menu. Temperature, predators, competitors, disease, food availability, and other conditions create differences in reproductive success. Selection therefore acts on phenotypes, while evolution is observed as a change in the genetic composition of the population.
Worked example: trichomes and insect herbivory
Natural populations of Arabidopsis thaliana can vary in trichome density, meaning the number of tiny hairs on a plant’s surface. Suppose a specialist insect herbivore feeds more effectively on plants with few trichomes.
In a population of $100$ plants, plants with many trichomes may experience less tissue damage and produce an average of $12$ viable seeds, while plants with few trichomes produce an average of $5$. If trichome density has a heritable component, the next generation will tend to contain a greater proportion of alleles associated with higher trichome density.
The reasoning is not that individual plants grow extra trichomes because insects attack them. Rather, the original population contained variation, the insect created different reproductive outcomes, and inherited differences were passed to offspring. If the environmental pressure continues, trichome density may increase over generations.
Quantitative traits and experimental selection
A quantitative trait is a measurable characteristic that varies along a continuous scale rather than appearing in only two or three categories. Plant height and trichome number are examples. Such traits are often influenced by multiple genes and by environmental conditions, so a population is best represented by a distribution of values rather than a single “typical” value.
A relatively large population with ample phenotypic variation is useful for investigating selection because it provides more individuals to compare and reduces the chance that unusual results come from random sampling alone. In a classroom investigation using Wisconsin Fast Plants, researchers can measure a trait, select individuals at one extreme, allow only those individuals to reproduce, and compare the next generation with the original population.
For example, if the tallest plants are selected as parents, the mean height of the next generation may increase after one generation. That result supports the claim that extreme selection can change the expression of a quantitative trait, but it does not by itself prove that every change is genetic: light, nutrients, water, and other environmental conditions must also be considered.
Natural selection versus artificial selection
In artificial selection, humans determine which organisms reproduce. In natural selection, environmental conditions determine which individuals tend to leave more offspring. Both processes can produce rapid population change when variation is present and heritable, but artificial selection uses a human choice as the selective pressure.
Agricultural crops provide an introductory example of artificial selection: people repeatedly reproduce plants with preferred characteristics. The detailed crop examples and procedures belong with artificial selection; here, the key connection is that human-directed reproduction can reveal the same population-level logic used to understand natural selection.
Antibiotic resistance: selection in real time
Antibiotic resistance in bacteria is a well-known example of natural selection and evolution. A bacterial population may contain genetic variation, including rare bacteria with mutations that reduce the effect of an antibiotic. When the antibiotic is applied, susceptible bacteria die or stop reproducing, while resistant bacteria survive and reproduce.
The antibiotic does not intentionally create resistance because bacteria need it. It changes the environment so that resistant bacteria have greater differential reproduction. After several generations, the frequency of resistance-associated alleles can rise, making the population harder to treat.
Misconception check
Misconception: “Individuals evolve.” Individual bacteria or plants can grow, acclimate, or survive, but evolution is a change in the genetic makeup of a population over generations. Also, natural selection is not the same as “survival of the strongest”: the relevant question is which phenotype produces the most viable offspring in a particular environment.
Retrieval check
A population of insects contains pesticide-resistant and pesticide-sensitive individuals. After pesticide exposure, resistant insects produce more offspring. Identify the variation, the environmental factor, the differential reproductive outcome, and the population-level evolutionary change. Why would measuring only the surviving adults be insufficient evidence that resistance is heritable?
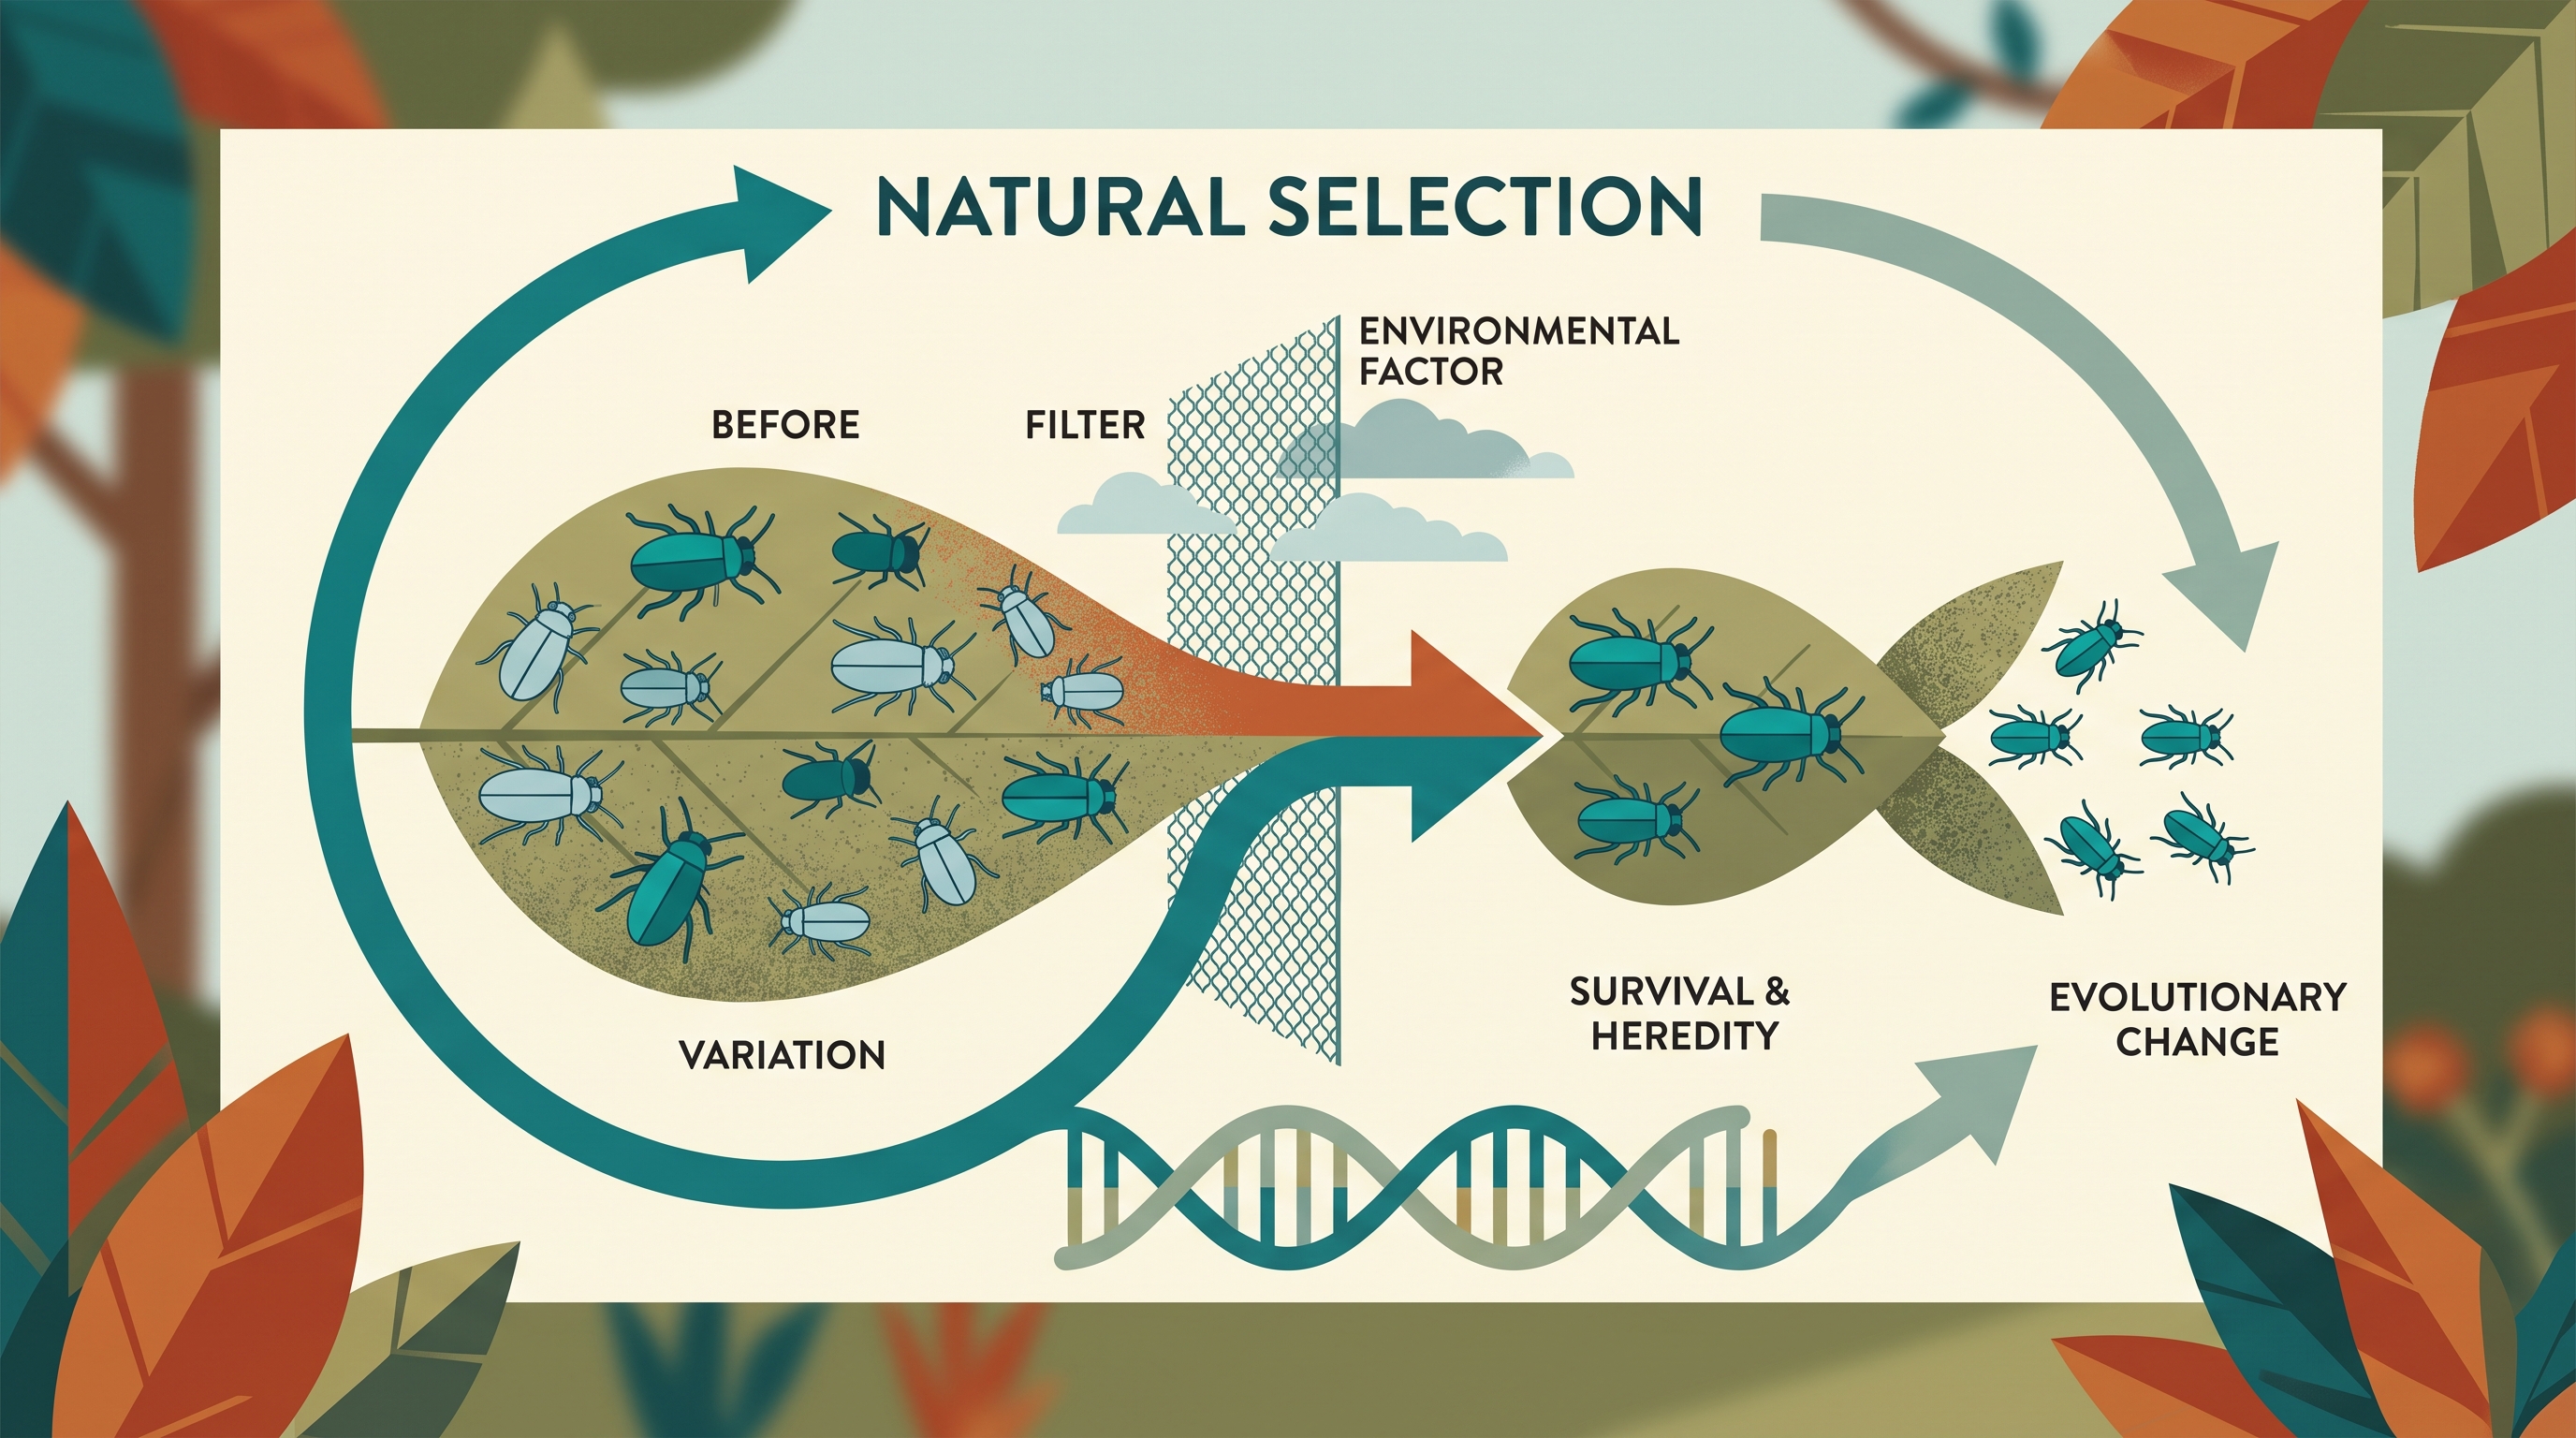
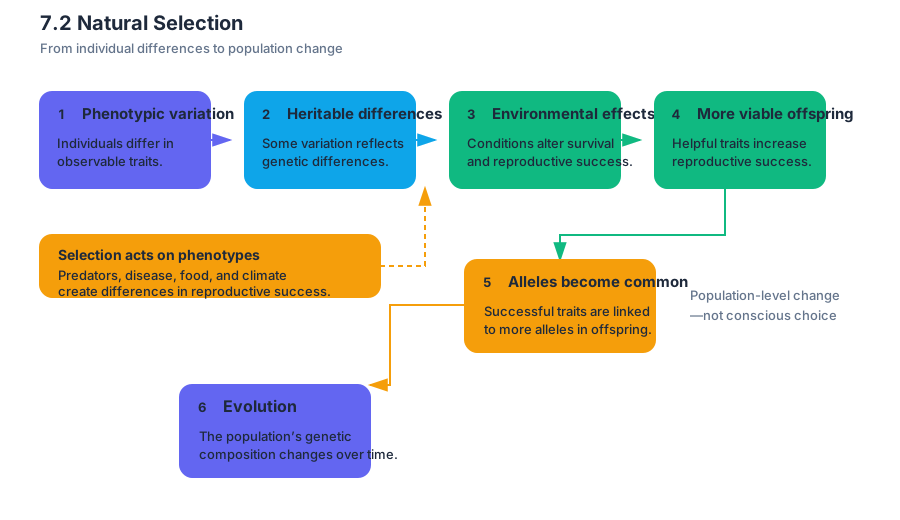
7.3 Artificial Selection
Key concepts: Artificial selection · Human-directed evolution · Quantitative traits · Polygenic inheritance · Phenotypic variation within a population · Directional selection across generations · Trichome production in Brassica rapa · Experimental investigation design · Data analysis and graphing · Mendelian and quantitative traits
Artificial selection occurs when humans choose individuals with a desired trait to reproduce, causing that trait to become more common in later generations. The key question is not whether an individual plant changes during its lifetime, but whether the population’s distribution of phenotypes changes after the…
7.3 Artificial Selection
Artificial selection occurs when humans choose individuals with a desired trait to reproduce, causing that trait to become more common in later generations. The key question is not whether an individual plant changes during its lifetime, but whether the population’s distribution of phenotypes changes after the selected plants produce offspring.
Investigative question: Can extreme selection change the expression of a quantitative trait in a population in one generation?
Human-directed evolution
In natural environments, differences in survival or reproduction determine which heritable traits become more common. In artificial selection, humans create the reproductive bias: they identify individuals at one extreme of a trait, use those individuals as parents, and allow their offspring to form the next generation. This is human-directed evolution because allele combinations associated with the selected phenotype are represented disproportionately among breeders.
Artificial selection requires three ingredients:
- Phenotypic variation within a population: individuals differ in the observable trait.
- A heritable component: some of the variation must be transmitted genetically.
- Differential reproduction: humans choose particular individuals to become parents.
If plants differ in hairiness but hairiness has no heritable component, selecting hairy plants will not reliably produce hairier offspring. If hairiness is heritable, repeated selection can shift the population toward greater hairiness.
Quantitative traits and polygenic inheritance
A quantitative trait varies along a continuum rather than appearing in only a few discrete categories. Plant height, trichome number, and the amount of purple anthocyanin are examples. Quantitative traits are typically influenced by polygenic inheritance, meaning that multiple genes contribute to the phenotype. Environmental conditions can also affect the phenotype, so the observed trait reflects both genetic and environmental influences.
For example, one plant might have $18$ trichomes in a measured area, another $24$, and another $31$. These values form a continuous distribution rather than a simple “hairy” versus “not hairy” classification. Because many genes may contribute small effects, offspring usually resemble—but do not exactly duplicate—the selected parents.
Misconception check — “Selection creates the desired trait.”
Selection does not manufacture a new phenotype because a human wants it. It changes which existing individuals reproduce. The response depends on variation already present in the population and on whether that variation is heritable.
Fast Plant investigation: selecting hairiness
Brassica rapa Fast Plants provide a practical model for investigating artificial selection. The number of trichomes, or hair-like structures on the plant surface, can be counted as a quantitative trait. A class can begin with a large population, because reliable selection requires ample variation and enough individuals for comparison; a recommended class-level starting population is approximately $120$–$180$ plants.
Fast Plant seed stock C1-122 is useful because it displays variation in hairiness. It also contains additional observable genetic variation: the plants are heterozygous for two Mendelian traits involving green versus light-green leaves and the presence versus absence of anthocyanin, which can produce purple stems. Thus, one starting population can support an artificial-selection investigation of hairiness or stem color while also providing material for a separate Mendelian investigation.
Designing and analyzing the experiment
Begin with an observation and a question: Do plants with more trichomes differ in a life-history trait such as growth or reproduction? Define the chosen trait operationally—for example, “trichome number counted in a specified leaf region”—so every group measures the same feature. Then repeatedly select individuals with extreme values, such as the hairiest plants, cross or pollinate those individuals, and grow their offspring as the next generation.
A useful design compares the trait distribution across generations:
| Generation | Action | Data to collect |
|---|---|---|
| Starting generation | Measure many plants before selection | Trichome count for every plant |
| Parent selection | Choose individuals with extreme values | Parent identities and trait values |
| Offspring generation | Grow and measure their progeny | Trichome counts and distribution |
| Repeated generation | Select new extremes and breed again | Change in mean, range, and frequency |
Compile class data for every generation, then graph the results using a frequency distribution or another appropriate display. For example, suppose the starting population has a mean trichome count of $22$, the selected parents average $34$, and their offspring average $27$. The offspring mean has shifted toward the selected extreme, but it has not reached the parental mean. That pattern is consistent with a heritable response to selection while also showing that environmental effects and many genes influence the trait.
AP skill in action
This investigation aligns with EVO-1.F: Explain how humans can affect diversity within a population and EVO-1.G: Explain the relationship between changes in the environment and evolutionary changes in the population. Artificial selection changes the reproductive environment: human choice determines which phenotypes contribute most strongly to the next generation.
It also explicitly develops Skill 4.B: Describe data from a table or graph, within Science Practice 4, Representing and Describing Data. A strong description identifies the direction and pattern of change without overclaiming causation: “The offspring frequency distribution shifted toward higher trichome counts after hairy parents were selected.” It should cite the measured pattern, not merely say that the graph “shows evolution.”
Retrieval check
A population’s average trichome count rises from $20$ in the starting generation to $26$ in the offspring generation after the hairiest plants were selected as parents. What evidence would most strongly support artificial selection rather than a measurement artifact?
Answer: Consistent measurement procedures, adequate sample size, and a repeated shift toward higher trichome counts across generations would support artificial selection. The critical evidence is a heritable change in the population distribution, not simply that the selected parents were hairy.
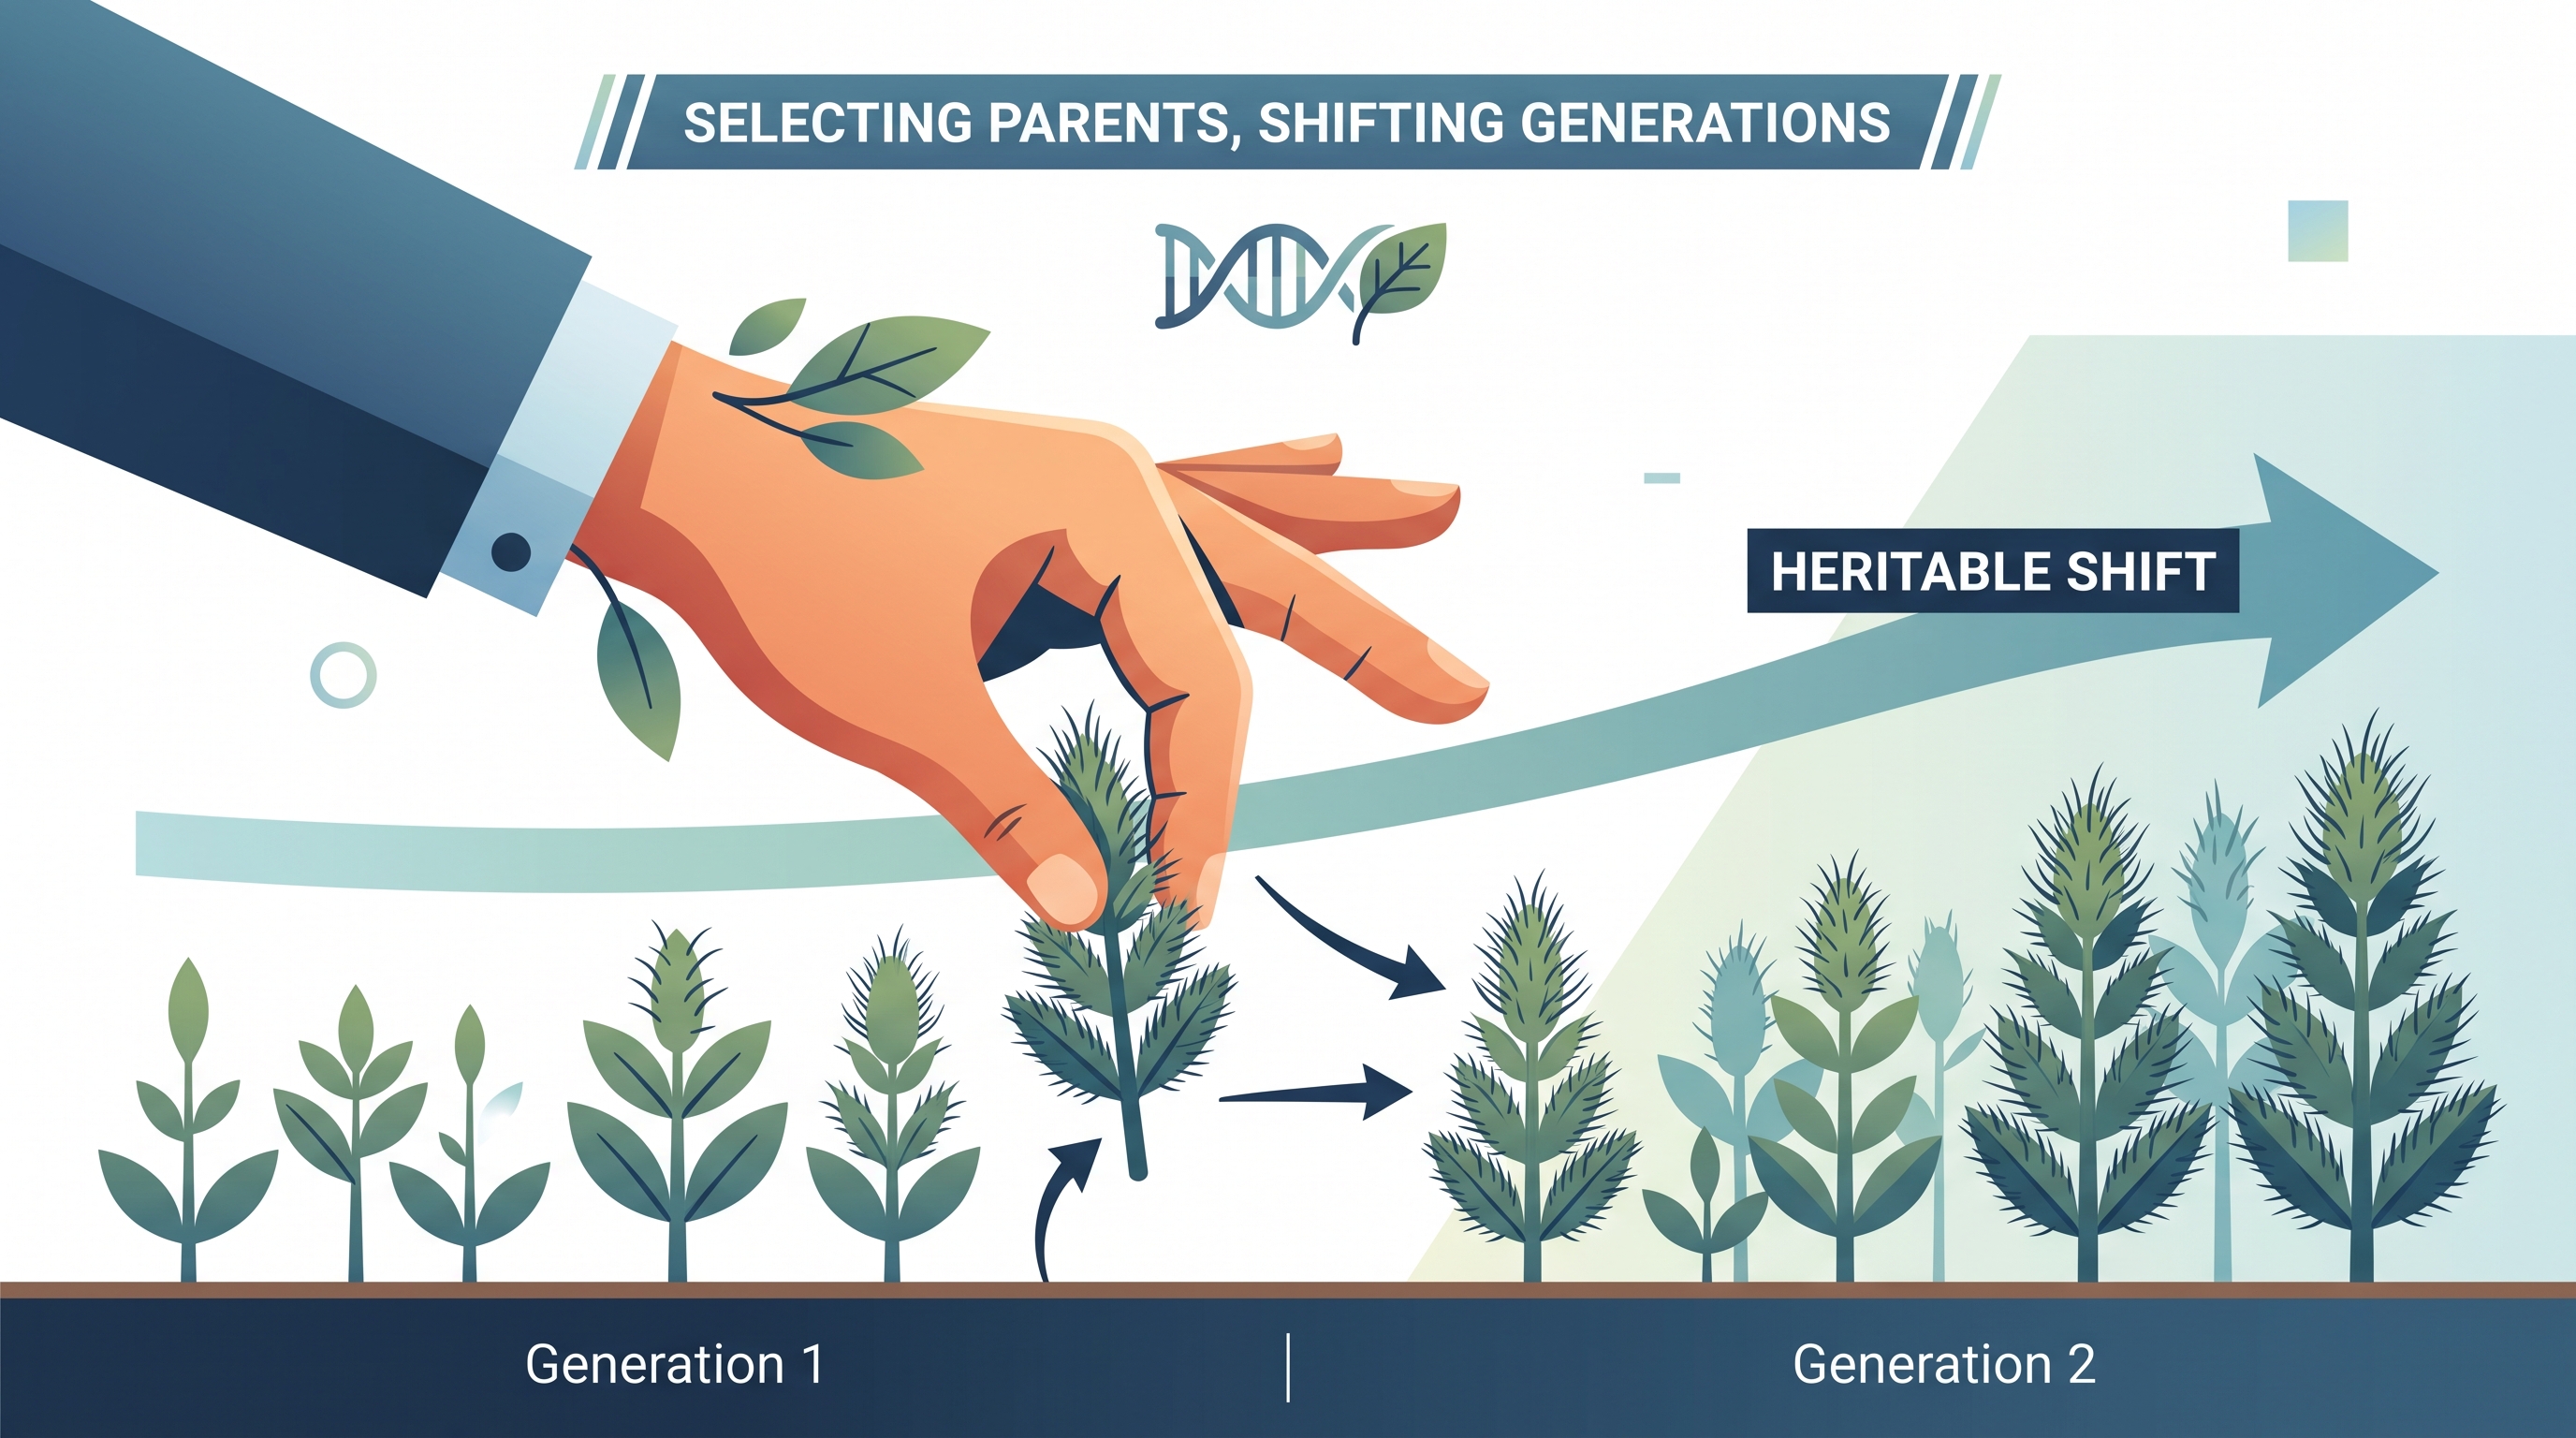
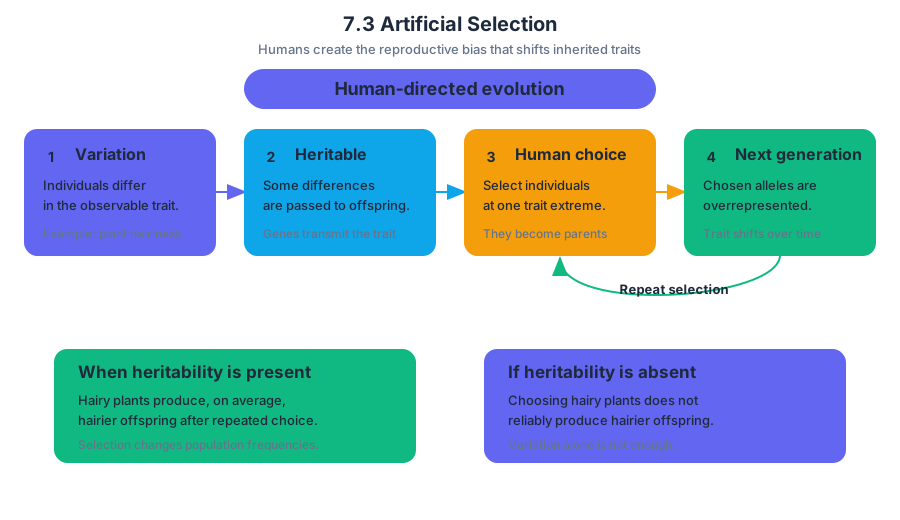
7.4 Population Genetics
Key concepts: Population genetics · Allele frequencies in populations · Inheritance patterns · Population-genetics modeling and simulations · Hypothesis development and testing · Statistical tests, including chi-square and t-tests · Standard deviation as a measure of variation · Fruit-fly behavior investigations · Negative geotaxis in fruit flies · Phototactic responses to different light wavelengths
A population evolves when the proportions of its heritable variants change across generations. Population genetics studies those changes by tracking alleles—the alternative forms of a gene—rather than focusing only on individual organisms.
7.4 Population Genetics
A population evolves when the proportions of its heritable variants change across generations. Population genetics studies those changes by tracking alleles—the alternative forms of a gene—rather than focusing only on individual organisms.
For a gene with two alleles, allele $1$ and allele $2$, let $p$ represent the frequency of allele $1$ and $q$ represent the frequency of allele $2$. Because every copy of the gene must be one allele or the other:
$$p+q=1$$
Key relationship: $q$ is the frequency of allele $2$ in the population, so $q=1-p$.
This relationship describes the allele pool at one point in time. It does not by itself explain why the frequencies change. Changes may result from natural selection, mutation, gene flow, genetic drift, or nonrandom mating; inheritance patterns determine how alleles are passed into the next generation, while evolutionary processes determine whether their population frequencies shift.
From individuals to populations
An individual has a genotype, such as $AA$, $Aa$, or $aa$. A population has allele frequencies: the fraction of all gene copies that are allele $A$ or allele $a$. This distinction matters because an individual does not “evolve” genetically during its lifetime; a population can evolve when its allele frequencies differ between generations.
Suppose $40$ fruit flies carry genotype $AA$, $40$ carry $Aa$, and $20$ carry $aa$. The population contains $100$ flies and therefore $200$ copies of the gene. The number of $A$ copies is:
$$2(40)+1(40)=120$$
Thus, the frequency of allele $A$ is:
$$p=\frac{120}{200}=0.60$$
The remaining allele frequency is:
$$q=1-0.60=0.40$$
If the next generation has $p=0.72$, the population has changed genetically even if the flies still look broadly similar. The evidence for evolutionary change is the shift in allele frequency, not simply a change in the number of organisms.
Modeling allele-frequency change
A population-genetics model is a simplified system that represents inheritance across generations. A physical model might use colored beads or coins; a spreadsheet might calculate allele transmission repeatedly; an interactive computer simulation might allow a researcher to vary parameters such as population size, selection strength, or migration.
The model becomes scientifically useful when variables are changed systematically rather than randomly. For example, begin with $p=0.50$ and $q=0.50$, hold population size constant, and run several generations. Then change only one parameter—such as reducing population size—and record how quickly allele frequencies diverge among repeated trials.
A strong investigation follows this pattern:
- Observe a pattern or biological behavior.
- Develop a question that could be answered with measurable data.
- State a hypothesis predicting how a changed variable will affect the outcome.
- Alter one model parameter or experimental variable at a time.
- Record the result across generations or trials.
- Compare observed results with a prediction or theoretical population.
For instance, a spreadsheet could test whether a small population shows larger generation-to-generation fluctuations than a large population. A reasonable hypothesis is: if population size decreases, random sampling will produce greater variation in allele frequencies among replicate populations. The hypothesis is testable because the model can vary population size and measure the resulting spread of allele frequencies.
From observation to biological experiment
Fruit flies provide a useful example of turning observation into investigation. Students might observe that flies climb upward when a container is tapped and ask, “Does age affect the speed of the negative geotactic response?” They could define response speed operationally as the time required for a fly to reach a marked height, then compare age groups using replicated trials.
Another question is, “Which wavelengths of light stimulate a phototactic response?” The investigator could expose flies to different colors of light, measure the number choosing each side of a chamber, and keep chamber size, exposure time, fly number, and temperature constant. These behavioral investigations do not automatically measure allele-frequency change, but they demonstrate the same population-genetics workflow: observation, hypothesis, controlled variable changes, quantitative measurement, and statistical evaluation.
Statistical evidence
Biologists use statistical tests to estimate how probable a result would be if a theoretical expectation were correct. A chi-square test is useful when comparing observed counts with expected counts across categories:
$$\chi^2=\sum\frac{(o-e)^2}{e}$$
Here, $o$ is an observed count and $e$ is an expected count. A large $\chi^2$ indicates a larger discrepancy, but the conclusion also depends on degrees of freedom and the appropriate critical value. A chi-square result does not prove that a hypothesis is true; it indicates whether the observed deviation is unlikely under the chosen expectation.
A t-test is used in appropriate situations to compare means, such as the average geotactic-response times of two fly-age groups. Before collecting data, investigators should select the statistical method that matches the question and data type.
To describe variation, calculate the sample mean:
$$\bar{x}=\frac{1}{n}\sum x_i$$
and the sample standard deviation:
$$s=\sqrt{\frac{\sum(x_i-\bar{x})^2}{n-1}}$$
The standard deviation estimates how widely individual measurements vary around the mean. A small standard deviation means measurements cluster closely; it does not mean that the experiment is automatically accurate.
Misconception check: A higher allele frequency is not necessarily “better,” and statistical significance does not prove biological importance. Both conclusions require context, an appropriate comparison, and a clearly stated hypothesis.
CED traceability: This topic develops EVO-1.L: Explain the impacts on the population if any of the conditions of Hardy-Weinberg are not met and 5A: Perform Mathematical Calculations. The mathematical model provides the baseline; deviations from its conditions are interpreted as evidence that evolutionary forces may be operating.
Retrieval check: A population has $p=0.35$ for allele $1$. What is $q$ for allele $2$? If observed genotype counts differ from theoretical expectations, which test compares categorical counts with expectations, and what does a large $\chi^2$ value suggest?
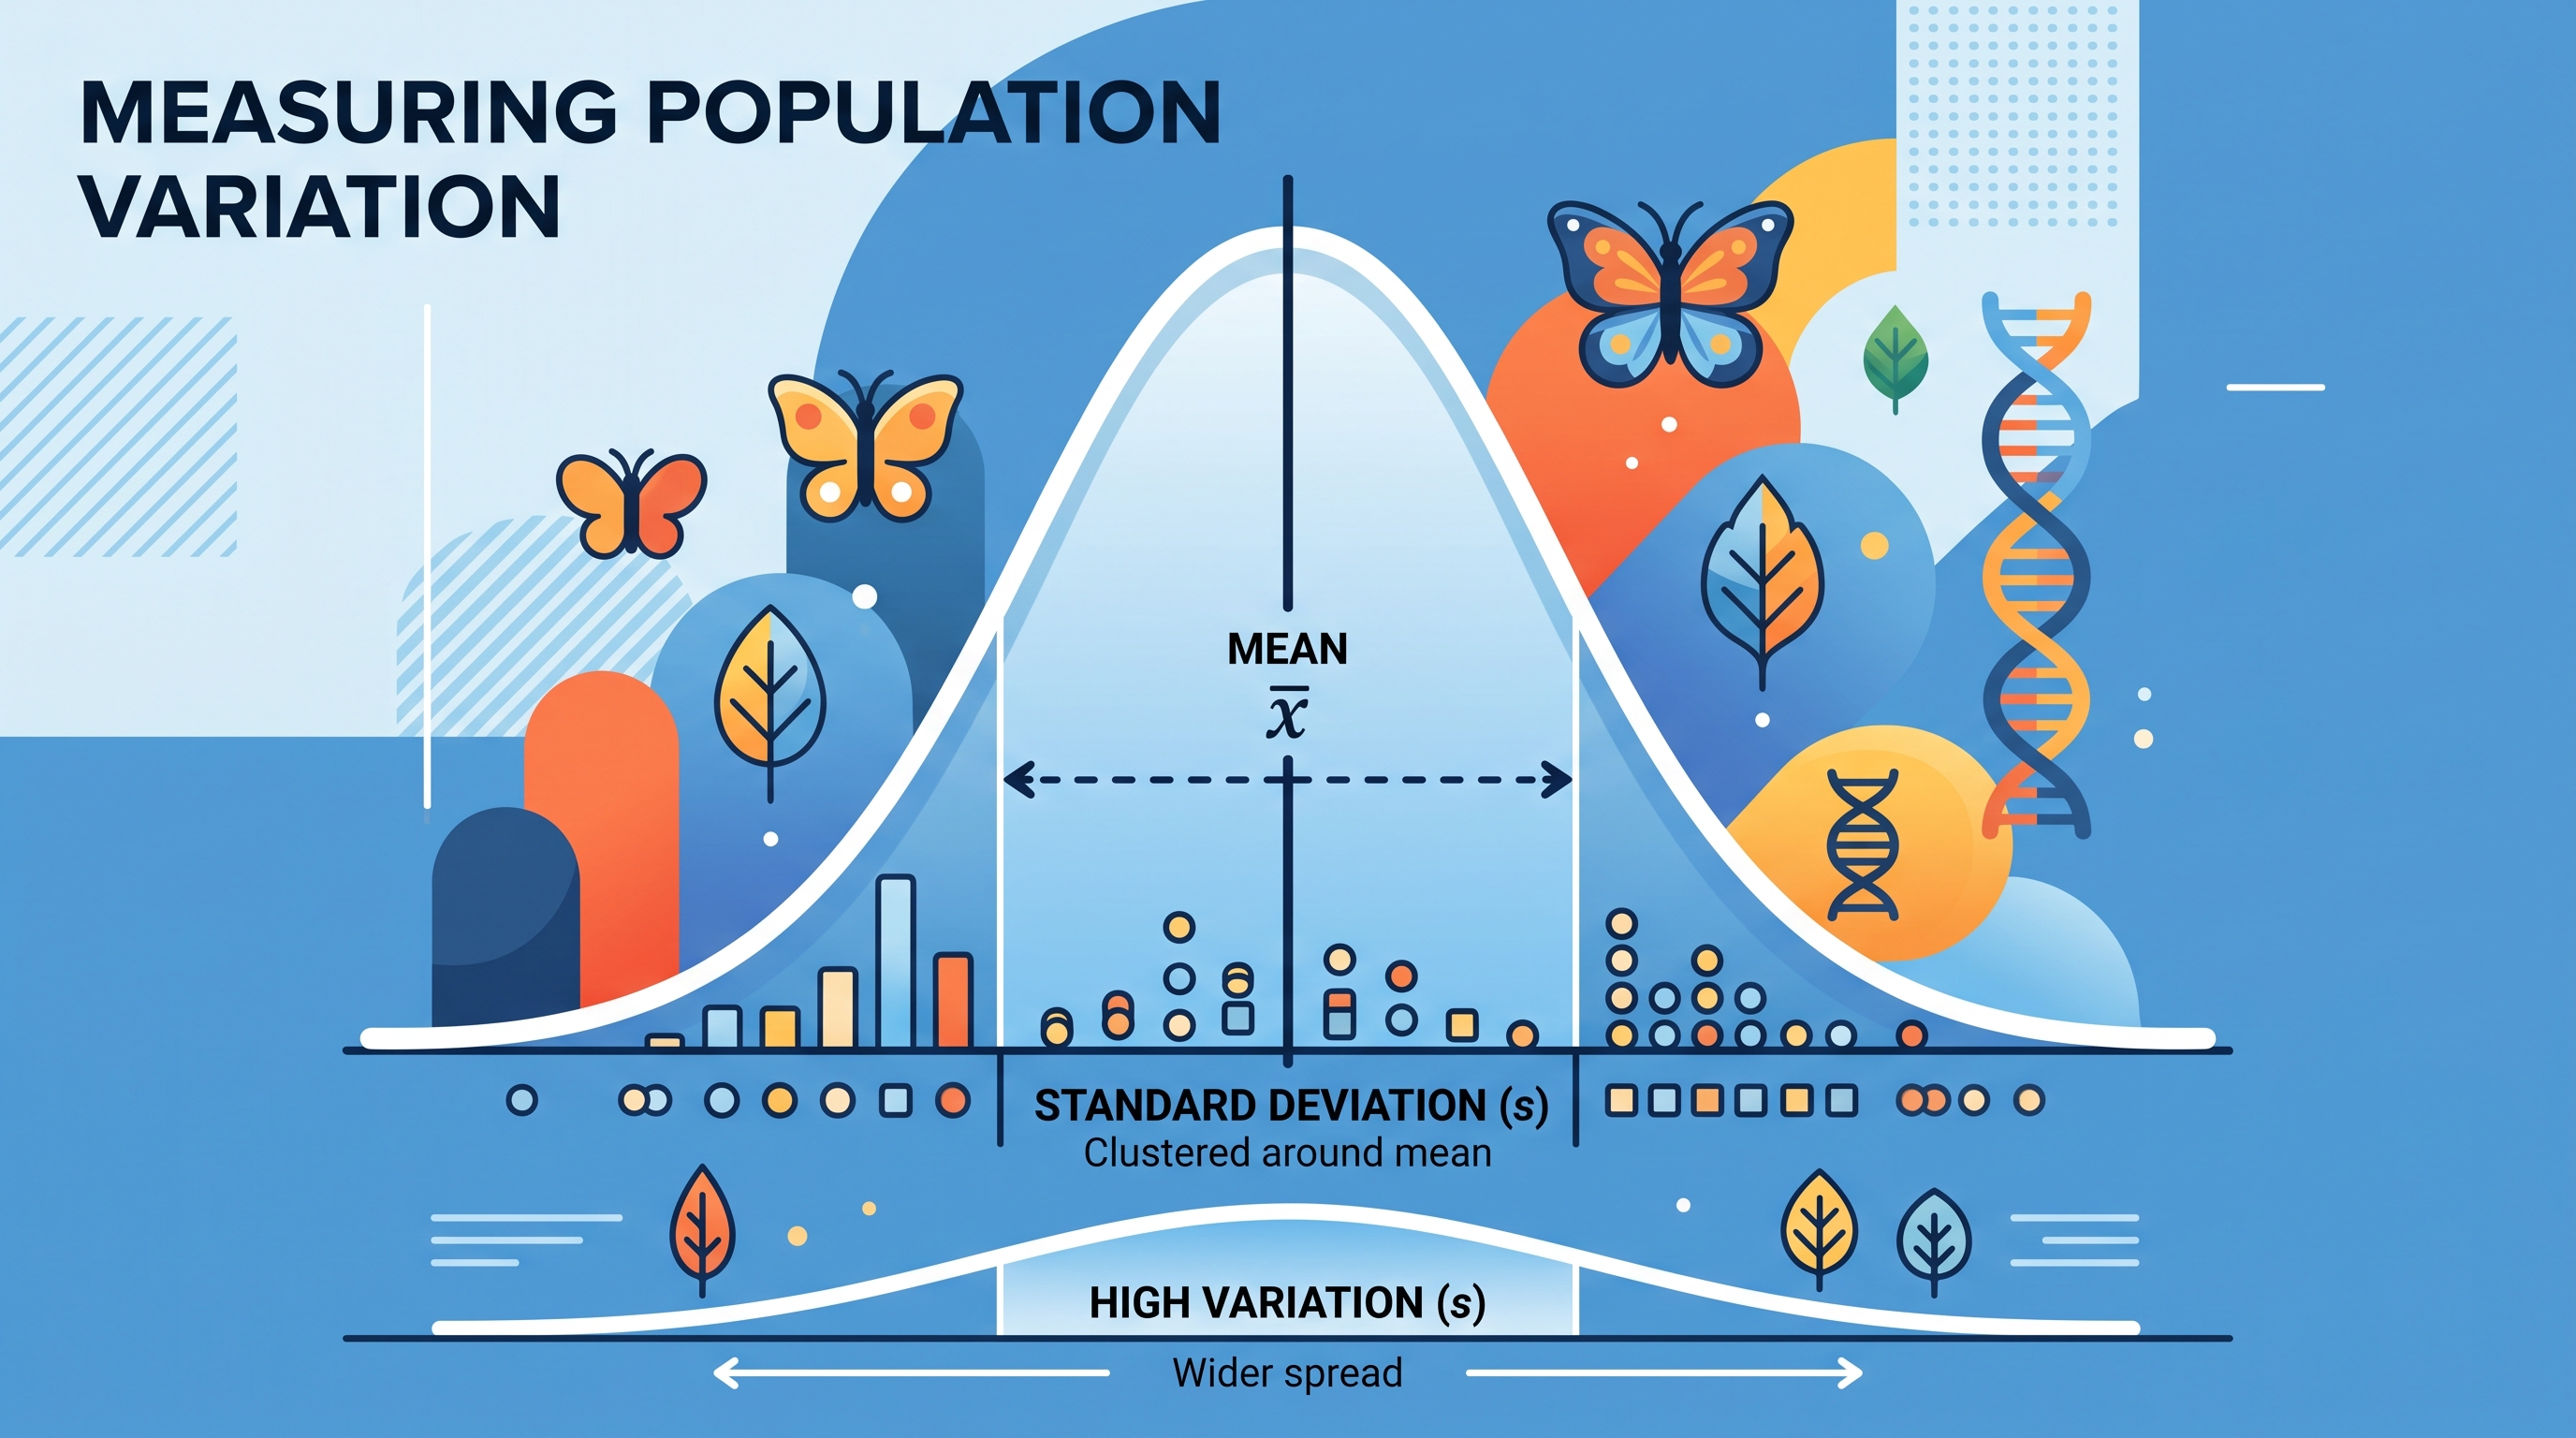
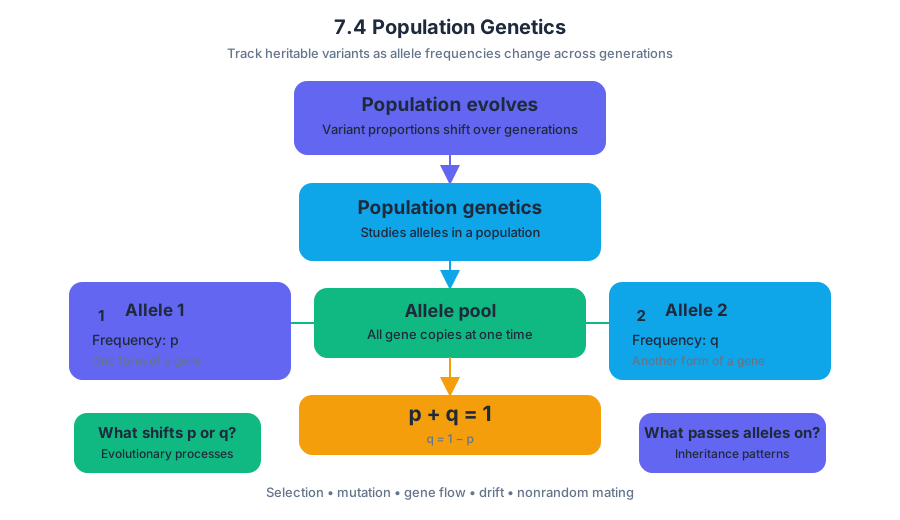
7.5 Hardy–Weinberg Equilibrium
Key concepts: Hardy–Weinberg equilibrium as a mathematical model and null hypothesis · Allele frequencies and genotype frequencies in populations · The relationship between allele frequencies and evolutionary change · Conditions required for a population or allele to be in Hardy–Weinberg equilibrium · Large population size and the effects of genetic drift · Random processes in evolution, including mutation, genetic drift, and gene flow · Using population simulations and mathematical models to investigate evolution · Calculating allele frequencies from population data · Analyzing and interpreting experimental or model-generated data · Applying Hardy–Weinberg concepts to examples such as Rock Pocket Mice or population bottlenecks
A population can evolve without any individual organism changing its genes: evolution is detected when allele frequencies—the proportions of different alleles in a population—change across generations.
7.5 Hardy–Weinberg Equilibrium
A population can evolve without any individual organism changing its genes: evolution is detected when allele frequencies—the proportions of different alleles in a population—change across generations. The Hardy–Weinberg model provides the mathematical “still photograph” against which that change can be measured.
Hardy–Weinberg equilibrium is the predicted genetic state of a population in which allele and genotype frequencies remain constant from generation to generation.
The model: from alleles to genotypes
Imagine a gene with two alleles. Let $p$ represent the frequency of allele $1$ and $q$ represent the frequency of allele $2$. Because these are the only two alleles in the model, their frequencies must sum to the whole population:
$$p+q=1$$
If gametes combine randomly, the expected genotype frequencies follow the binomial expansion:
$$p^2+2pq+q^2=1$$
The terms have precise meanings:
| Mathematical term | Genotype represented | Meaning |
|---|---|---|
| $p^2$ | Homozygous for allele $1$ | Two allele-$1$ gametes combine |
| $2pq$ | Heterozygous | Either allele-$1$ then allele-$2$, or allele-$2$ then allele-$1$ |
| $q^2$ | Homozygous for allele $2$ | Two allele-$2$ gametes combine |
The factor $2$ in $2pq$ matters because the two alleles can occur in either order: $pq$ or $qp$. The equation predicts genotype frequencies from allele frequencies; it does not claim that every real population will match the prediction perfectly.
Worked example: calculating the expected population
Suppose allele $1$ has frequency $p=0.70$ in a population. First calculate the other allele:
$$q=1-p=1-0.70=0.30$$
The expected genotype frequencies are then:
$$p^2=(0.70)^2=0.49$$
$$2pq=2(0.70)(0.30)=0.42$$
$$q^2=(0.30)^2=0.09$$
Thus, the model predicts $49%$ homozygous allele-$1$, $42%$ heterozygous, and $9%$ homozygous allele-$2$. These add to $1.00$, or $100%$. If the population contains $1{,}000$ individuals, the expected genotype counts are $490$, $420$, and $90$, respectively.
Equilibrium as a null hypothesis
The Hardy–Weinberg model is a null hypothesis: it predicts what would happen if no evolutionary process altered allele frequencies. A population or allele in Hardy–Weinberg equilibrium is therefore not evolving with respect to that gene under the model.
The required conditions are idealized:
- a very large population;
- random mating;
- no mutation;
- no migration, or gene flow;
- no natural selection favoring one allele or genotype;
- no other process systematically changing allele frequencies.
These conditions are never fully met in nature. Their value is practical: if observed genotype frequencies differ substantially from Hardy–Weinberg predictions, the difference suggests that one or more evolutionary processes may be operating. The model gives scientists a baseline rather than a claim that real populations are perfectly static.
Why population size matters
In a small population, genetic drift—random change in allele frequencies caused by chance sampling—can overwhelm other evolutionary effects. Imagine a classroom population in which only a few individuals reproduce. By chance alone, one allele may become common or disappear, even if neither allele improves survival.
This is why a small laboratory simulation can be misleading: its population may be too small to approximate the large-population condition. A mathematical model or spreadsheet can instead represent a theoretically very large population and reveal the expected inheritance pattern without drift dominating the result.
Connecting the model to evolution
Hardy–Weinberg analysis becomes powerful when repeated generations are compared. If allele frequency changes from $p=0.70$ to $p=0.62$, then the population is evolving for that gene, regardless of whether the cause is mutation, genetic drift, gene flow, a bottleneck, or natural selection.
A strong scientific argument follows this chain:
$$ \text{calculate allele frequencies} \rightarrow \text{predict } p^2,\ 2pq,\ q^2 \rightarrow \text{compare with observations} \rightarrow \text{identify possible evolutionary change} $$
For example, a bottleneck can randomly remove individuals and alter allele frequencies; gene flow can introduce alleles from another population; mutation can create a new allele; and drift can shift frequencies especially strongly in small populations. The model helps distinguish “genotypes differ from expectation” from the stronger conclusion “allele frequencies changed over time.”
Misconception check
Misconception: Hardy–Weinberg equilibrium describes what evolution does.
Correction: It describes what allele frequencies would do in the absence of evolutionary change. It is the standard used to detect evolution, not a force that prevents evolution.
CED alignment: This topic develops Learning Objective 7.5.A and Essential Knowledge 7.5.A.1, applying mathematical models to allele and genotype frequencies. The principal science practices are Science Practice 2: Visual Representations, when translating between equations and population models; Science Practice 4: Representing and Describing Data, when organizing observed and expected frequencies; Science Practice 5: Statistical Tests and Data Analysis, when evaluating deviations; and Science Practice 6: Argumentation, when using calculations and experimental data to argue whether a population is evolving.
Retrieval check: A population has $q=0.20$. What are $p$, $p^2$, $2pq$, and $q^2$? If the allele frequencies are different in the next generation, is the population in Hardy–Weinberg equilibrium? Explain why in one sentence.
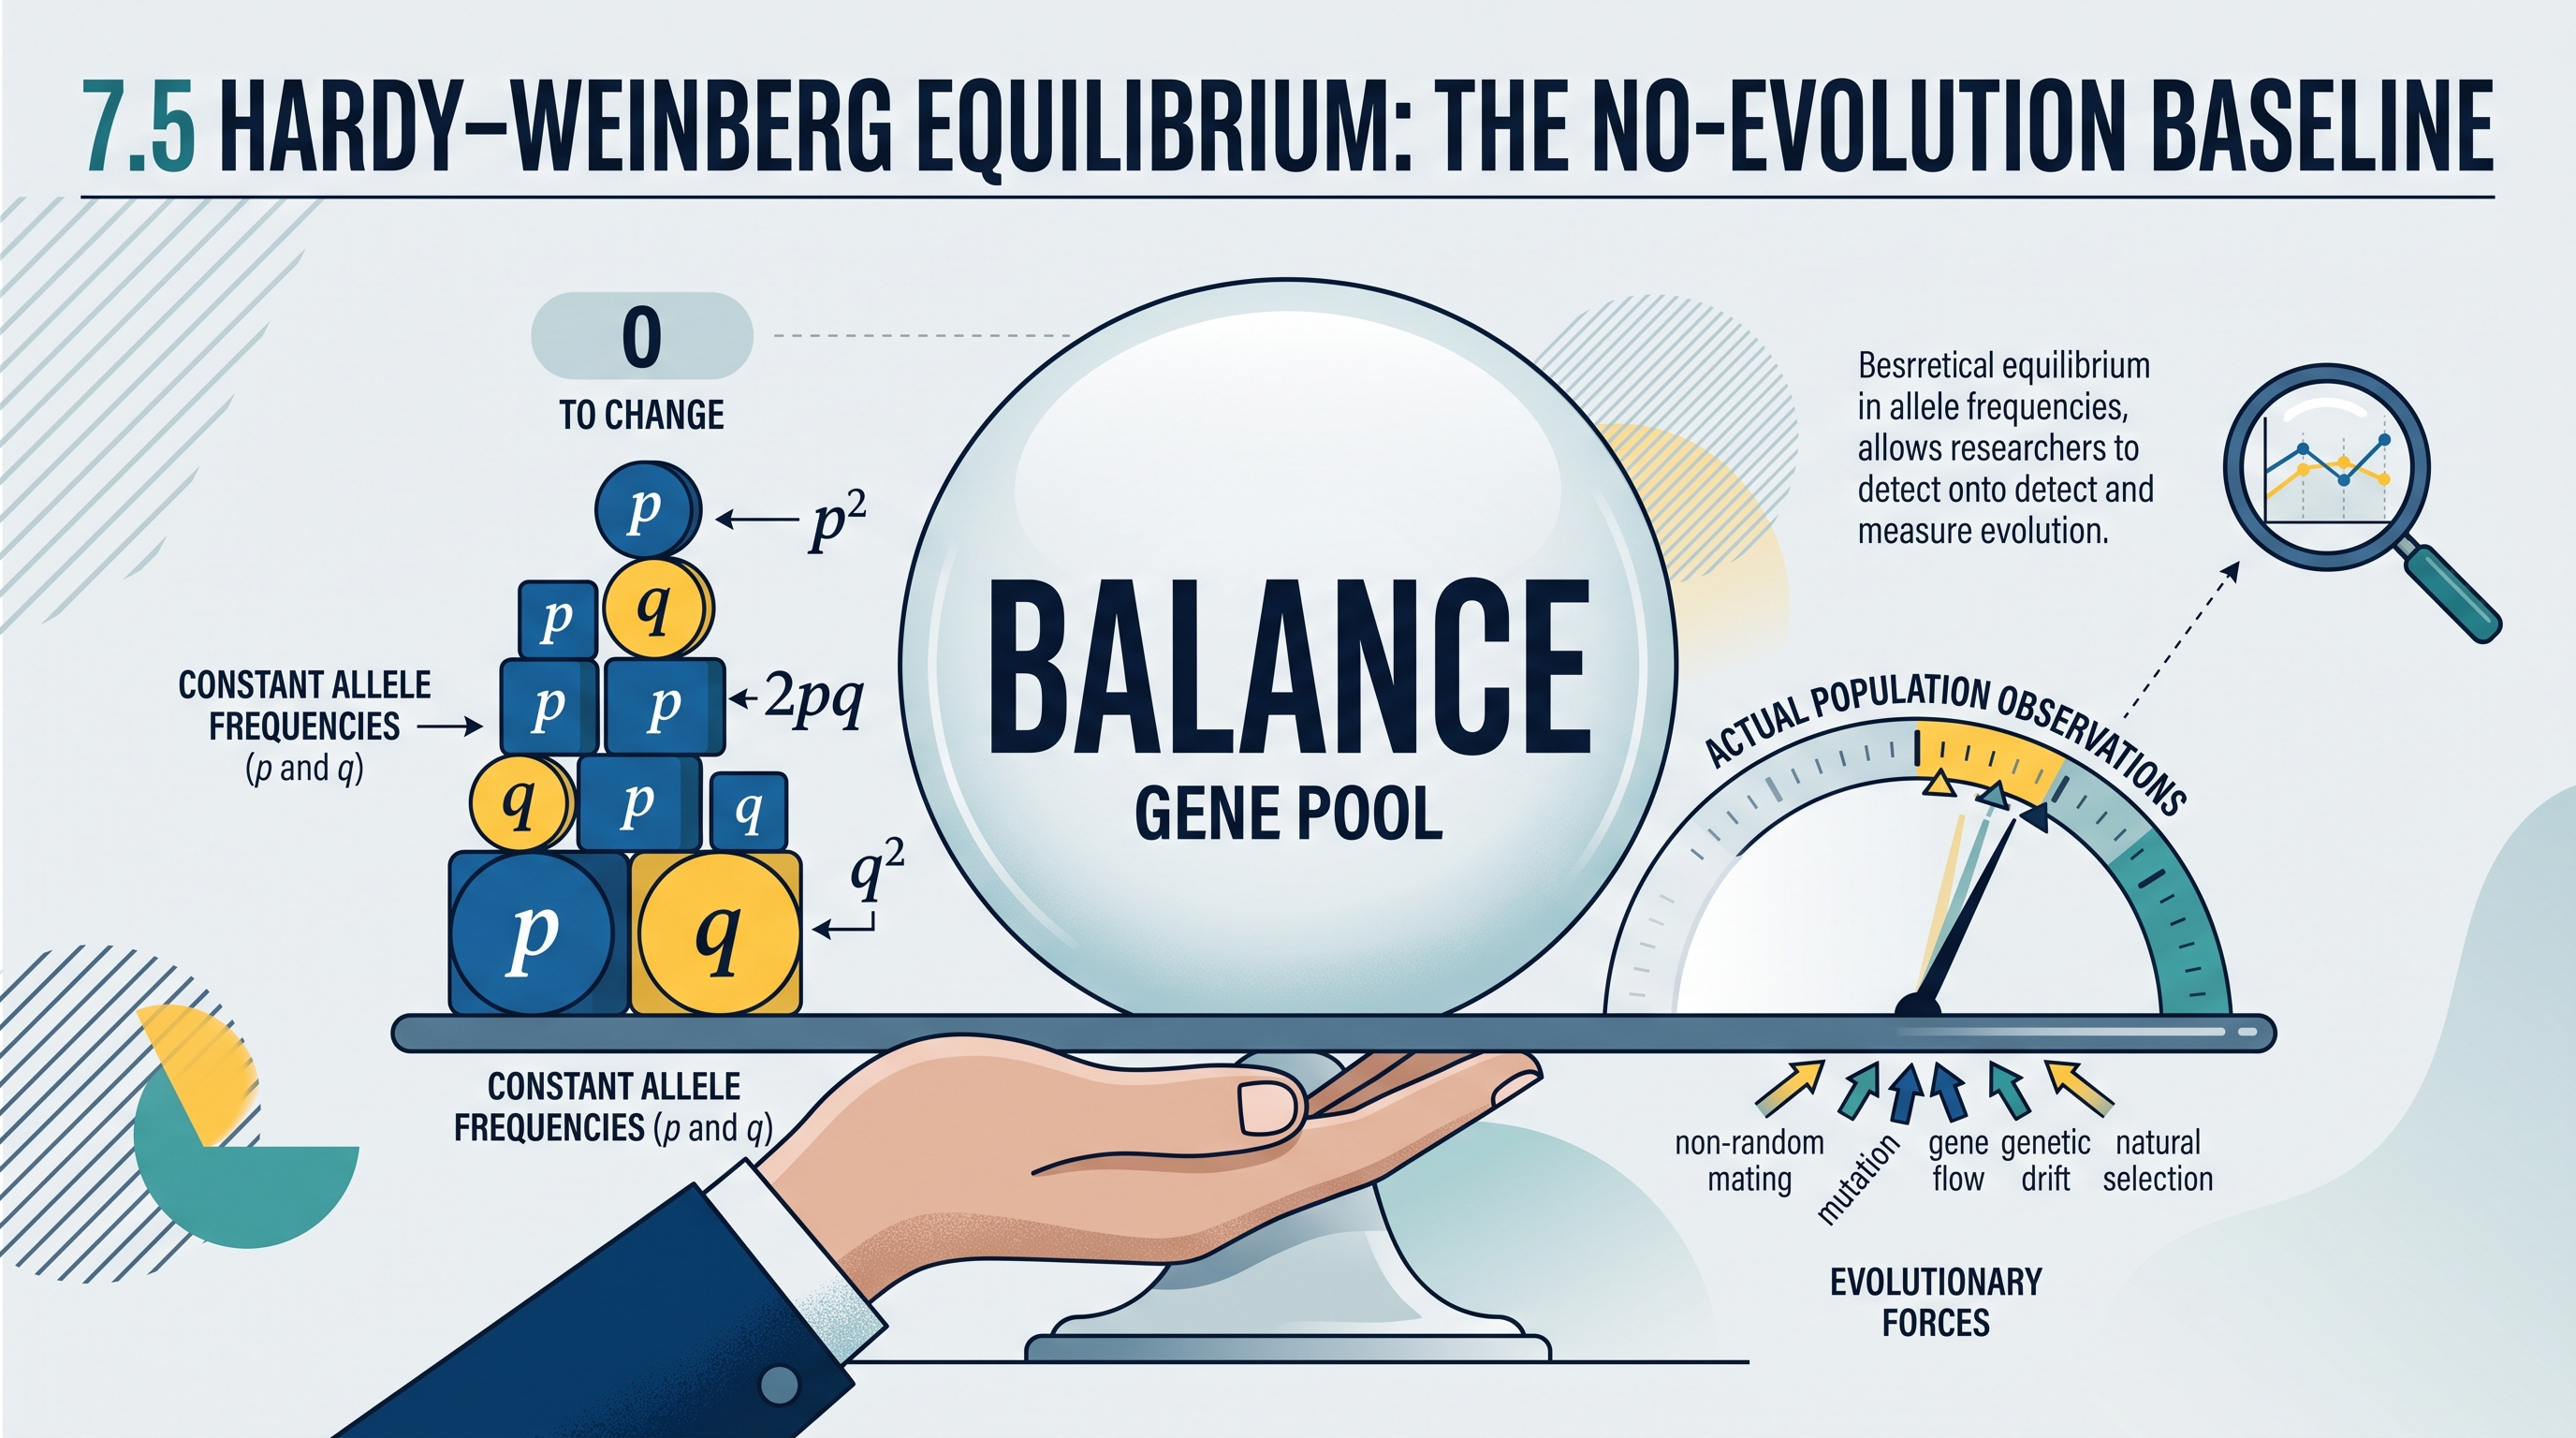
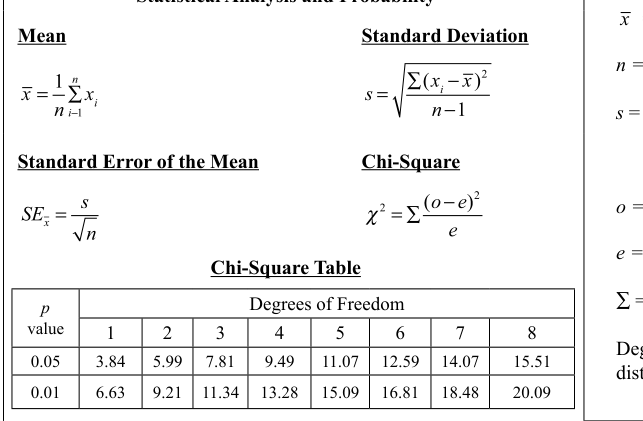
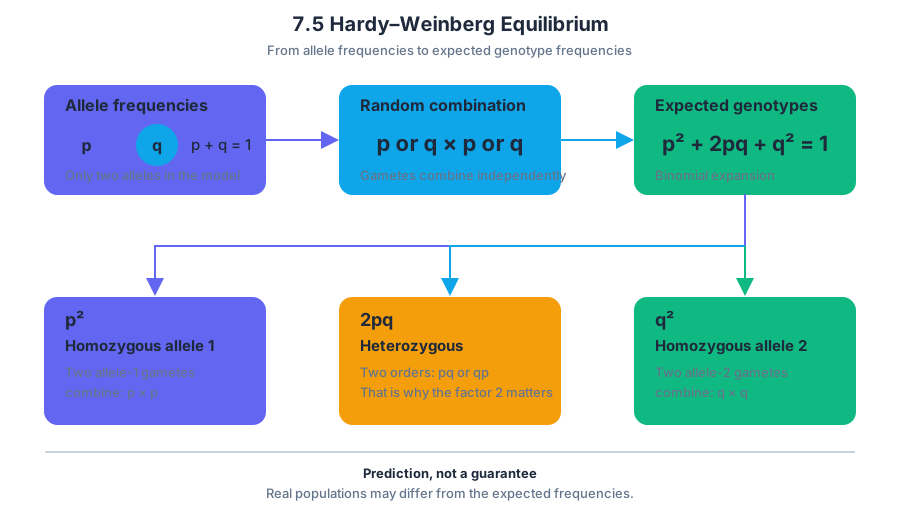
7.6 Evidence of Evolution
Key concepts: Evidence for evolution · Phylogenetic trees · Cladograms · Protein sequence similarities · Evolution as an ongoing process · Changes in the genetic makeup of populations · Allele and genotype frequencies · Hardy-Weinberg mathematical modeling · Interpreting biological data from tables and graphs · Designing investigations based on evidence
Evolution leaves evidence at several scales: DNA and protein sequences reveal molecular similarity, fossils record change through time, and living populations can change genetically while we observe them.
7.6 Evidence of Evolution
Evolution leaves evidence at several scales: DNA and protein sequences reveal molecular similarity, fossils record change through time, and living populations can change genetically while we observe them. The central claim is not that organisms merely resemble one another, but that measurable biological patterns support hypotheses about how populations and lineages have changed.
Evolution is characterized by changes in the genetic makeup of a population over time.
This definition focuses on populations rather than individual organisms. An individual cannot evolve during its lifetime by changing its inherited allele frequencies; a population evolves when the proportions of alleles or genotypes shift across generations. This is the biological meaning behind the Big Idea 1 statement that evolution drives both the diversity and the unity of life.
Evidence at the molecular level
Protein sequences can be compared because proteins are encoded by genes. If two organisms possess proteins with many matching amino acids in the same positions, their genes may have been inherited from a relatively recent common lineage. Fewer sequence differences generally suggest a more distant relationship, although mutation rate, natural selection, and functional constraints must also be considered.
For example, suppose a protein contains $100$ amino acids. Species A and B differ at $4$ positions, while Species A and C differ at $28$ positions. The sequence comparison supports the hypothesis that A and B are more closely related than A and C. It does not prove that A evolved directly into B: the comparison is evidence for branching evolutionary relationships, not a simple ladder from “primitive” to “advanced.”
A strong molecular comparison uses aligned sequences, counts differences, and asks whether the pattern agrees with other evidence. This is associated with EVO-3.B: Describe the types of evidence that can be used to infer an evolutionary relationship. A table of sequence differences, a graph of genetic distance, or a mathematical model can all become evidence when interpreted biologically rather than merely reported.
Reading phylogenetic trees and cladograms
A phylogenetic tree or cladogram is a diagram representing a hypothetical evolutionary relationship among organisms. The branching pattern proposes which groups share more recent common ancestry; it does not show that one modern species is the ancestor of another.
In a tree, a node represents a hypothesized common ancestor or splitting event. A clade contains an ancestor and all of its descendants. The order of species along the page is usually irrelevant: rotating branches around a node does not change the relationships. What matters is which pairs share the most recent node.
Trees and cladograms are hypotheses that are constantly revised as new evidence becomes available.
This is the focus of 7.9.B and 7.9.B.3, which require explaining how phylogenetic trees and cladograms can be used to infer evolutionary relatedness. A defensible interpretation identifies shared nodes, compares branching points, and connects the proposed relationship to evidence such as protein sequences, DNA data, fossils, or anatomical traits.
Evolution happening now
Evolution is an ongoing process in all living organisms. Evidence includes genomic changes over time, continuing changes in the fossil record, resistance to antibiotics, pesticides, herbicides, or chemotherapy drugs, and pathogens that evolve in ways associated with emerging diseases. In each case, the key observation is a change in the genetic composition of a population.
When evolutionary conditions are present, allele and genotype frequencies can change. The conditions summarized by EVO-1.K identify when these frequencies change, while EVO-1.L concerns the population impacts when Hardy-Weinberg conditions are not met. The Hardy-Weinberg model therefore functions as a baseline: observed departures from its expectations can help investigators examine whether evolutionary forces are acting.
Worked investigation: stomata and atmospheric carbon dioxide
Stomata—microscopic openings that regulate gas exchange in leaves—provide a testable example. If atmospheric carbon dioxide changes, plants may experience different selection pressures on stomatal number, density, or behavior. A researcher could compare fossil leaves from periods with different estimated carbon dioxide concentrations and measure stomatal density using the same leaf-area standard.
A complete claim would connect evidence to mechanism: “Leaves from the higher-carbon-dioxide interval have lower stomatal density.” The reasoning would then explain that reduced stomatal density may limit unnecessary water loss while still permitting sufficient carbon dioxide uptake. The claim becomes stronger if the pattern is replicated across species, sites, and independently dated samples; correlation alone does not establish the evolutionary mechanism.
This illustrates Skill 4.B: Describe data from a table or graph, because the investigator must identify trends without confusing description with explanation. It also uses Skill 5.A: Perform mathematical calculations when comparing means or sequence differences, and Skill 3.D: Propose a new investigation based on an evaluation of the experimental design or evidence when existing evidence suggests a follow-up experiment.
Misconception check
Misconception: “Evolution always makes organisms more complex or better.” Evolution changes genetic frequencies in response to forces such as selection, mutation, migration, and genetic drift. A trait can be advantageous in one environment and disadvantageous in another, and evolutionary change can occur without producing greater complexity.
Retrieval check: A cladogram shows species X and Y joining at the most recent shared node, while species Z joins earlier. Which relationship is supported, and what additional evidence could test the hypothesis? The supported conclusion is that X and Y are hypothesized to be more closely related than either is to Z; aligned protein sequences, DNA comparisons, fossils, or anatomical data could provide an independent test.
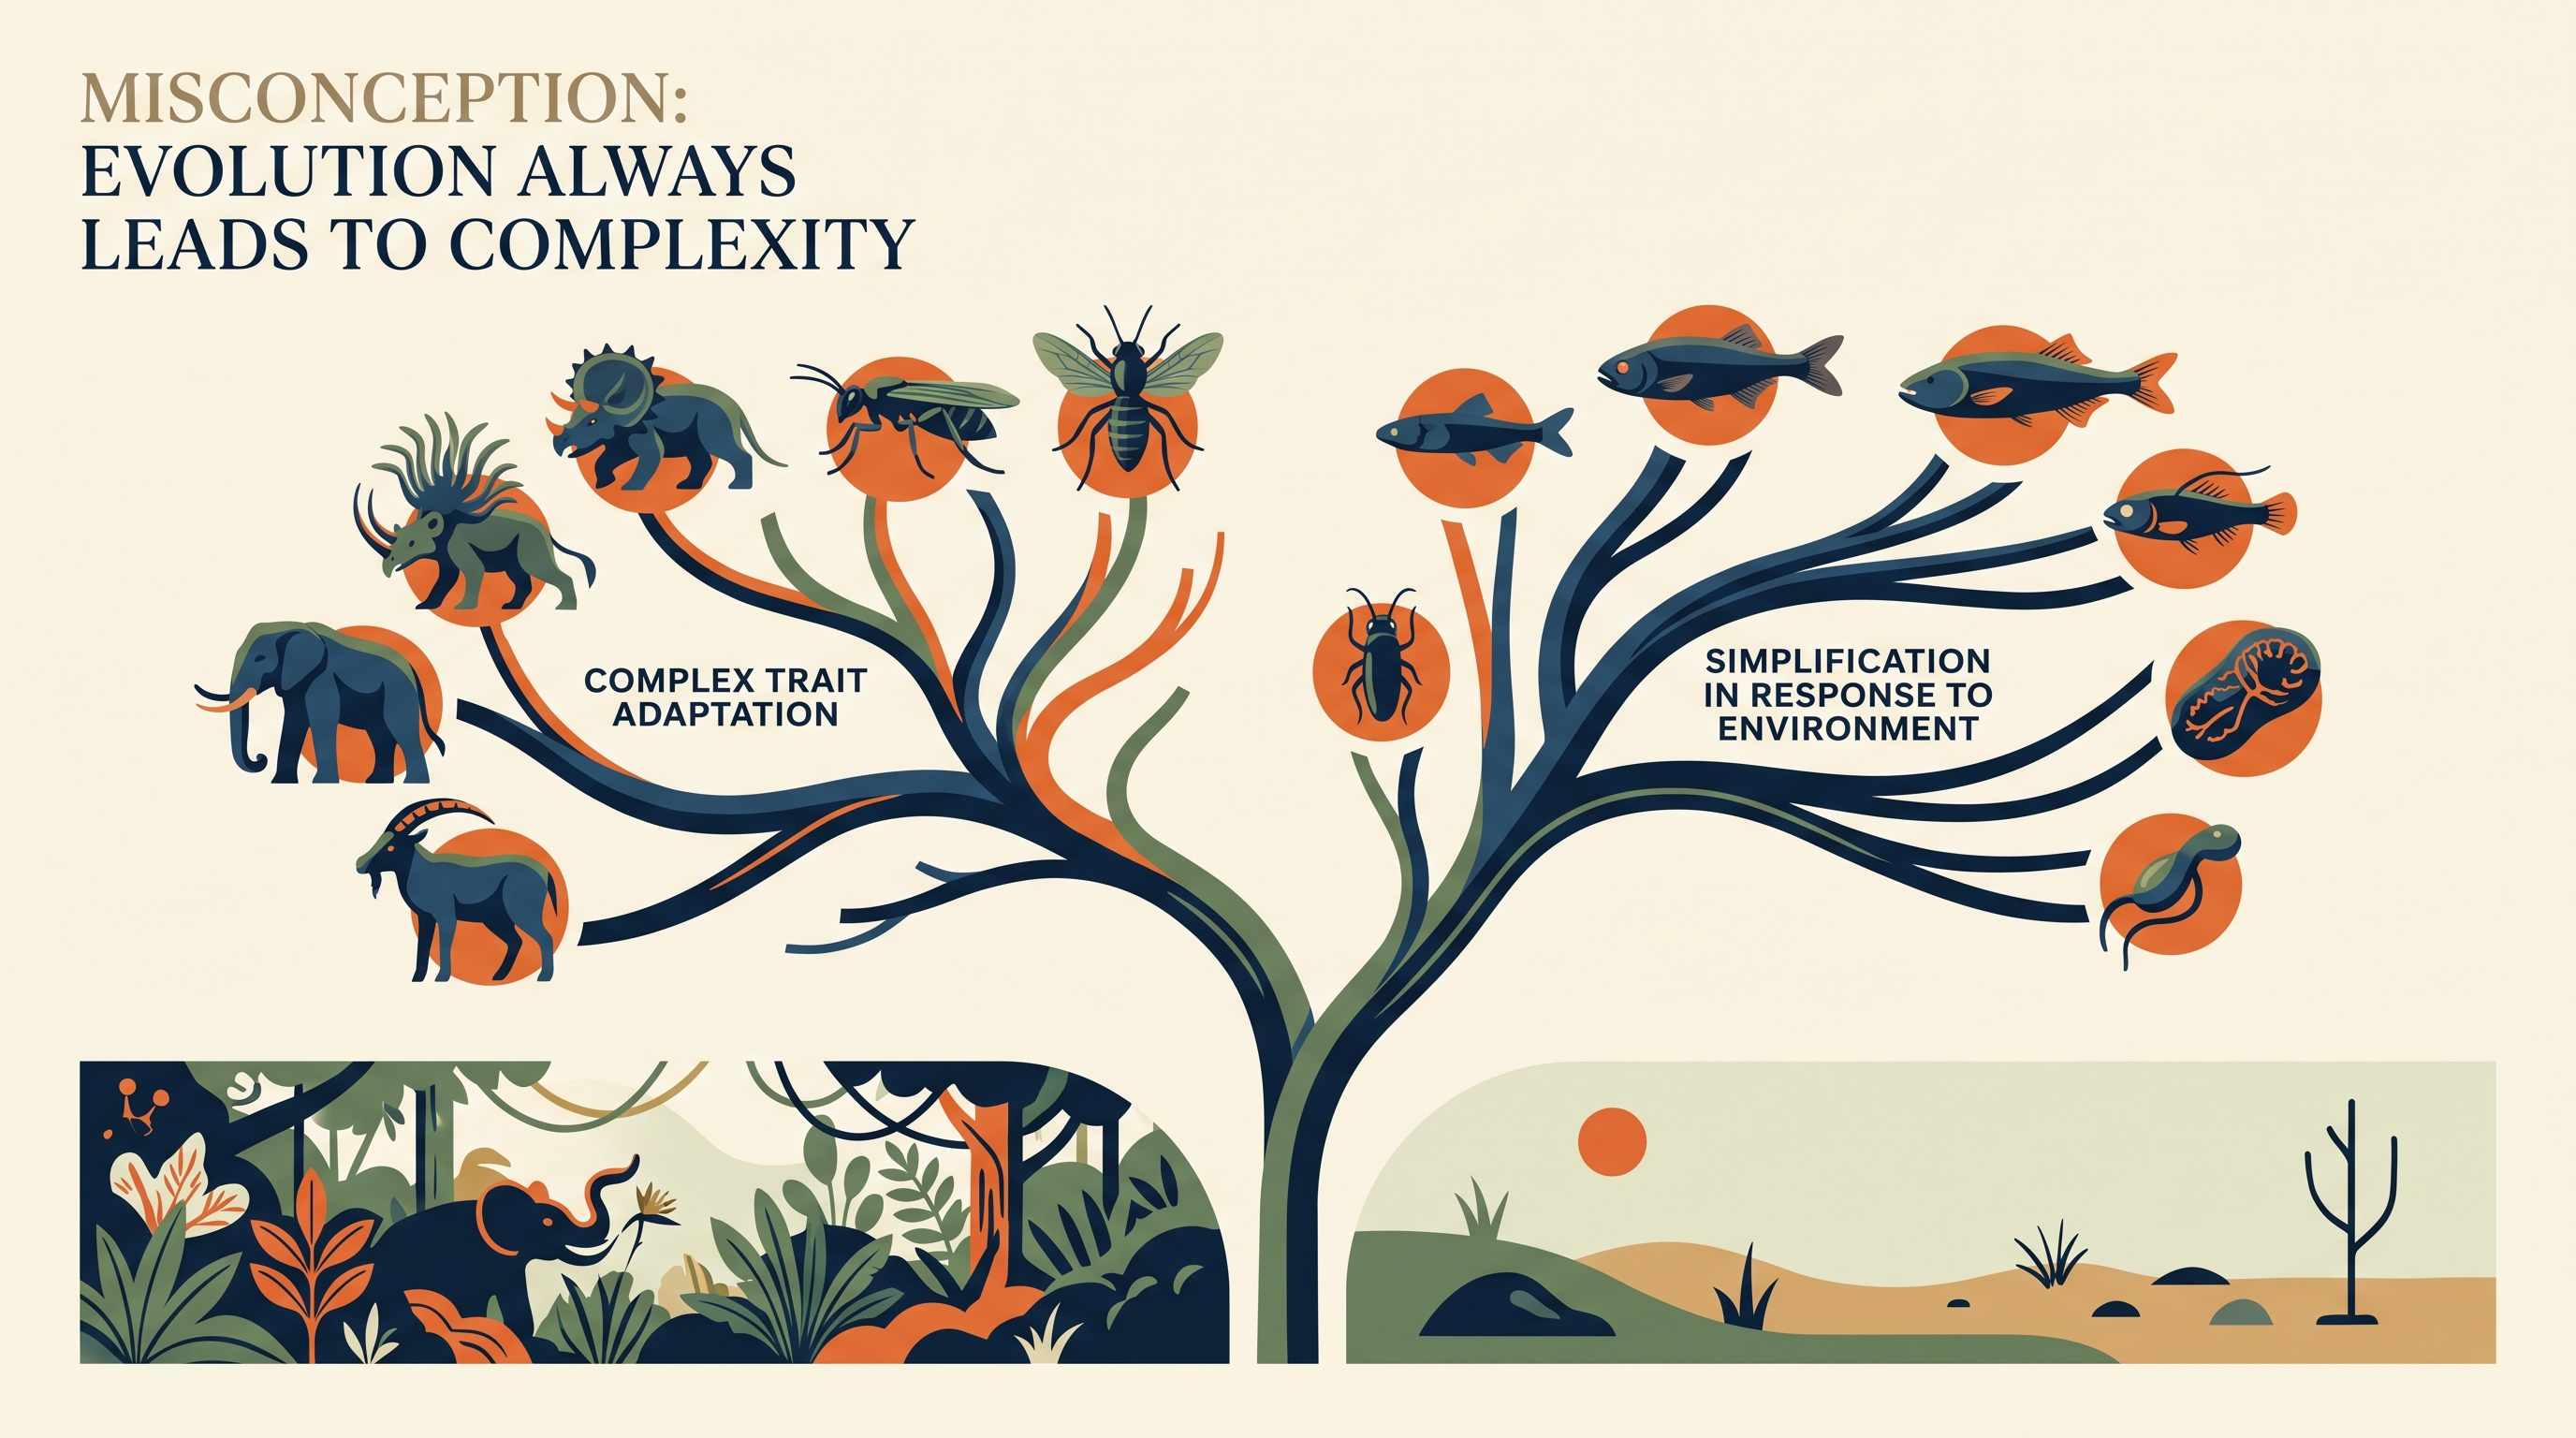
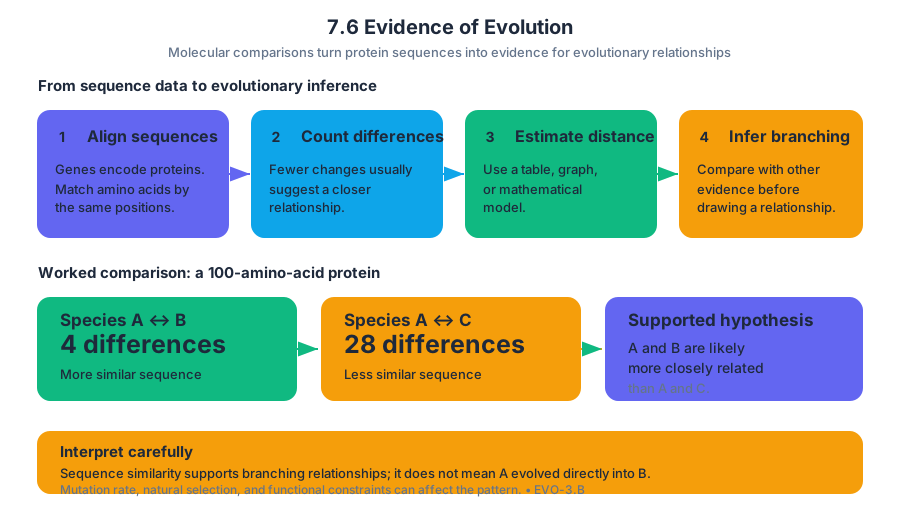
7.7 Common Ancestry
Key concepts: Common ancestry · Shared cellular components and organelles as evidence of common ancestry · Evolutionary relationships represented in cladograms or phylogenetic figures · BLAST comparison of gene sequences · Genome similarity and evolutionary relatedness · Out-groups in evolutionary analysis · Repeated body segments in separate evolutionary lineages · Annelida and mollusks as lineages compared in a phylogenetic context · Caudofoveata and Solenogastres · Genome changes and lineage divergence
Every living cell carries clues to its family history: subcellular structures and organelles found across all forms of life reflect common ancestry. Even organisms that look radically different share fundamental cellular machinery; for example, ribosomes synthesize proteins by reading messenger RNA (mRNA) sequences.
7.7 Common Ancestry
Every living cell carries clues to its family history: subcellular structures and organelles found across all forms of life reflect common ancestry. Even organisms that look radically different share fundamental cellular machinery; for example, ribosomes synthesize proteins by reading messenger RNA (mRNA) sequences. These shared components are difficult to explain as independent inventions, but they make sense if modern organisms inherited core cellular features from ancestral life.
Common ancestry is the evolutionary idea that species share ancestors, with differences accumulating as their lineages change over time.
Essential Knowledge: EK 2.1.A.4. Components and organelles contribute to cell function, and structures found across all forms of life reflect common ancestry. In this context, the shared presence of ribosomes is evidence of deep biological relatedness, even though the organisms containing them may differ in anatomy, habitat, and lifestyle.
Reading evolutionary relationships
A cladogram is a branching diagram that represents hypothesized evolutionary relationships. Each branch endpoint represents a group or species, while each branching point represents a common ancestor. The closer two endpoints are to one another on the same branching pattern, the more recently they share a common ancestor.
A cladogram is not a ladder ranking organisms from “simple” to “advanced.” It is better understood as a map of branching history. For example, if Selaginella and Isoetes join at a node that is not shared with Lycopodium, the two first species share a more recent common ancestor with each other than either shares with Lycopodium.
A trait placed on a branch or node can be a shared derived character, a feature inherited by members of a particular lineage after it separated from other lineages. In a mollusk comparison, features such as a mantle or radula can help identify the mollusk group. However, the position of a trait matters: a similar feature appearing in separate branches may have evolved independently rather than being inherited from the same recent ancestor.
Out-groups and misleading similarities
An out-group is a related group used as a comparison point when interpreting evolutionary relationships. Because the out-group branches outside the focal group, a character found in both the out-group and some members of the focal group is more likely to represent an ancestral condition; a character found only within a particular focal branch may be a derived character.
In a figure comparing mollusks with Annelida, Annelida can function as the out-group. The out-group does not mean “less evolved,” and it does not necessarily represent the direct ancestor of the focal organisms. It provides a reference for deciding which traits likely appeared before the focal group diversified.
One visually tricky example is a body with repeated segments. Separate lineages in the figure contain organisms with this feature: annelids have repeated segments, and a particular mollusk lineage also displays repeated segmentation. Because the trait occurs on separate branches, the pattern may represent convergent evolution, also called homoplasy—the independent evolution of similar features in different lineages.
Misconception check: Similar appearance does not automatically prove close relationship. A trait must be interpreted alongside the branching pattern and other characters.
Genome comparisons and BLAST
Anatomical comparisons can be strengthened with molecular evidence. BLAST, or Basic Local Alignment Search Tool, compares a gene sequence with sequences in a database and identifies regions of similarity. A high sequence similarity can support the inference that genes were inherited from a common ancestral gene, although similarity must be interpreted in context rather than treated as absolute proof of a direct ancestor-descendant relationship.
Suppose researchers compare a gene from two mollusk groups. They enter each sequence into BLAST, examine the matching regions, and compare the degree of similarity. If the sequences are especially similar, the corresponding lineages may have shared a more recent common ancestor—or may have experienced fewer changes in that gene since diverging.
Genome changes help explain why descendant lineages differ. Mutations, gene duplication, deletion, and other changes can alter sequences over time; natural selection, genetic drift, and other evolutionary processes then affect which variants persist. Thus, a phylogenetic figure represents both shared inheritance and the changes that accumulated after lineages separated.
Worked interpretation: the mollusk figure
To analyze the figure systematically:
- Locate the branch containing Annelida and use it as the out-group.
- Identify the node where the relevant mollusk lineages join.
- Trace the character “body with repeated segments” to determine whether it appears once or on separate branches.
- Find the numbered node connecting Caudofoveata and Solenogastres.
- Select the node at which those two lineages were most similar in genome sequence—their most recent shared point in the figure.
- Explain group formation by connecting genome changes after divergence to differences among the four mollusk groups and the one invertebrate group.
The key reasoning is that the node represents a shared ancestor, not a modern organism. The farther evolution proceeds away from that node, the more opportunities exist for genome changes to produce differences among descendant lineages.
AP skills and reasoning processes
This topic is especially assessed through Science Practice 1: Concept Explanation, when explaining how shared cellular structures, genome similarity, and evolutionary change support common ancestry; Science Practice 2: Visual Representations, when interpreting cladograms, nodes, branches, and out-groups; Science Practice 5: Statistical Tests and Data Analysis, when comparing sequence-similarity results; and Science Practice 6: Argumentation, when using a cladogram or BLAST result as evidence for a claim about relatedness.
For a strong argument, state a claim, identify the evidence, and connect the evidence to evolutionary reasoning. For example: The two lineages are closely related because their gene sequences are highly similar and they join at a recent node; this pattern is consistent with inheritance from a relatively recent common ancestor.
Retrieval check
A cladogram shows repeated segmentation in Annelida and in one mollusk branch. Does that automatically establish that the two groups inherited the trait from their most recent common ancestor? Explain why an out-group and the locations of the traits on the branches are needed before deciding.
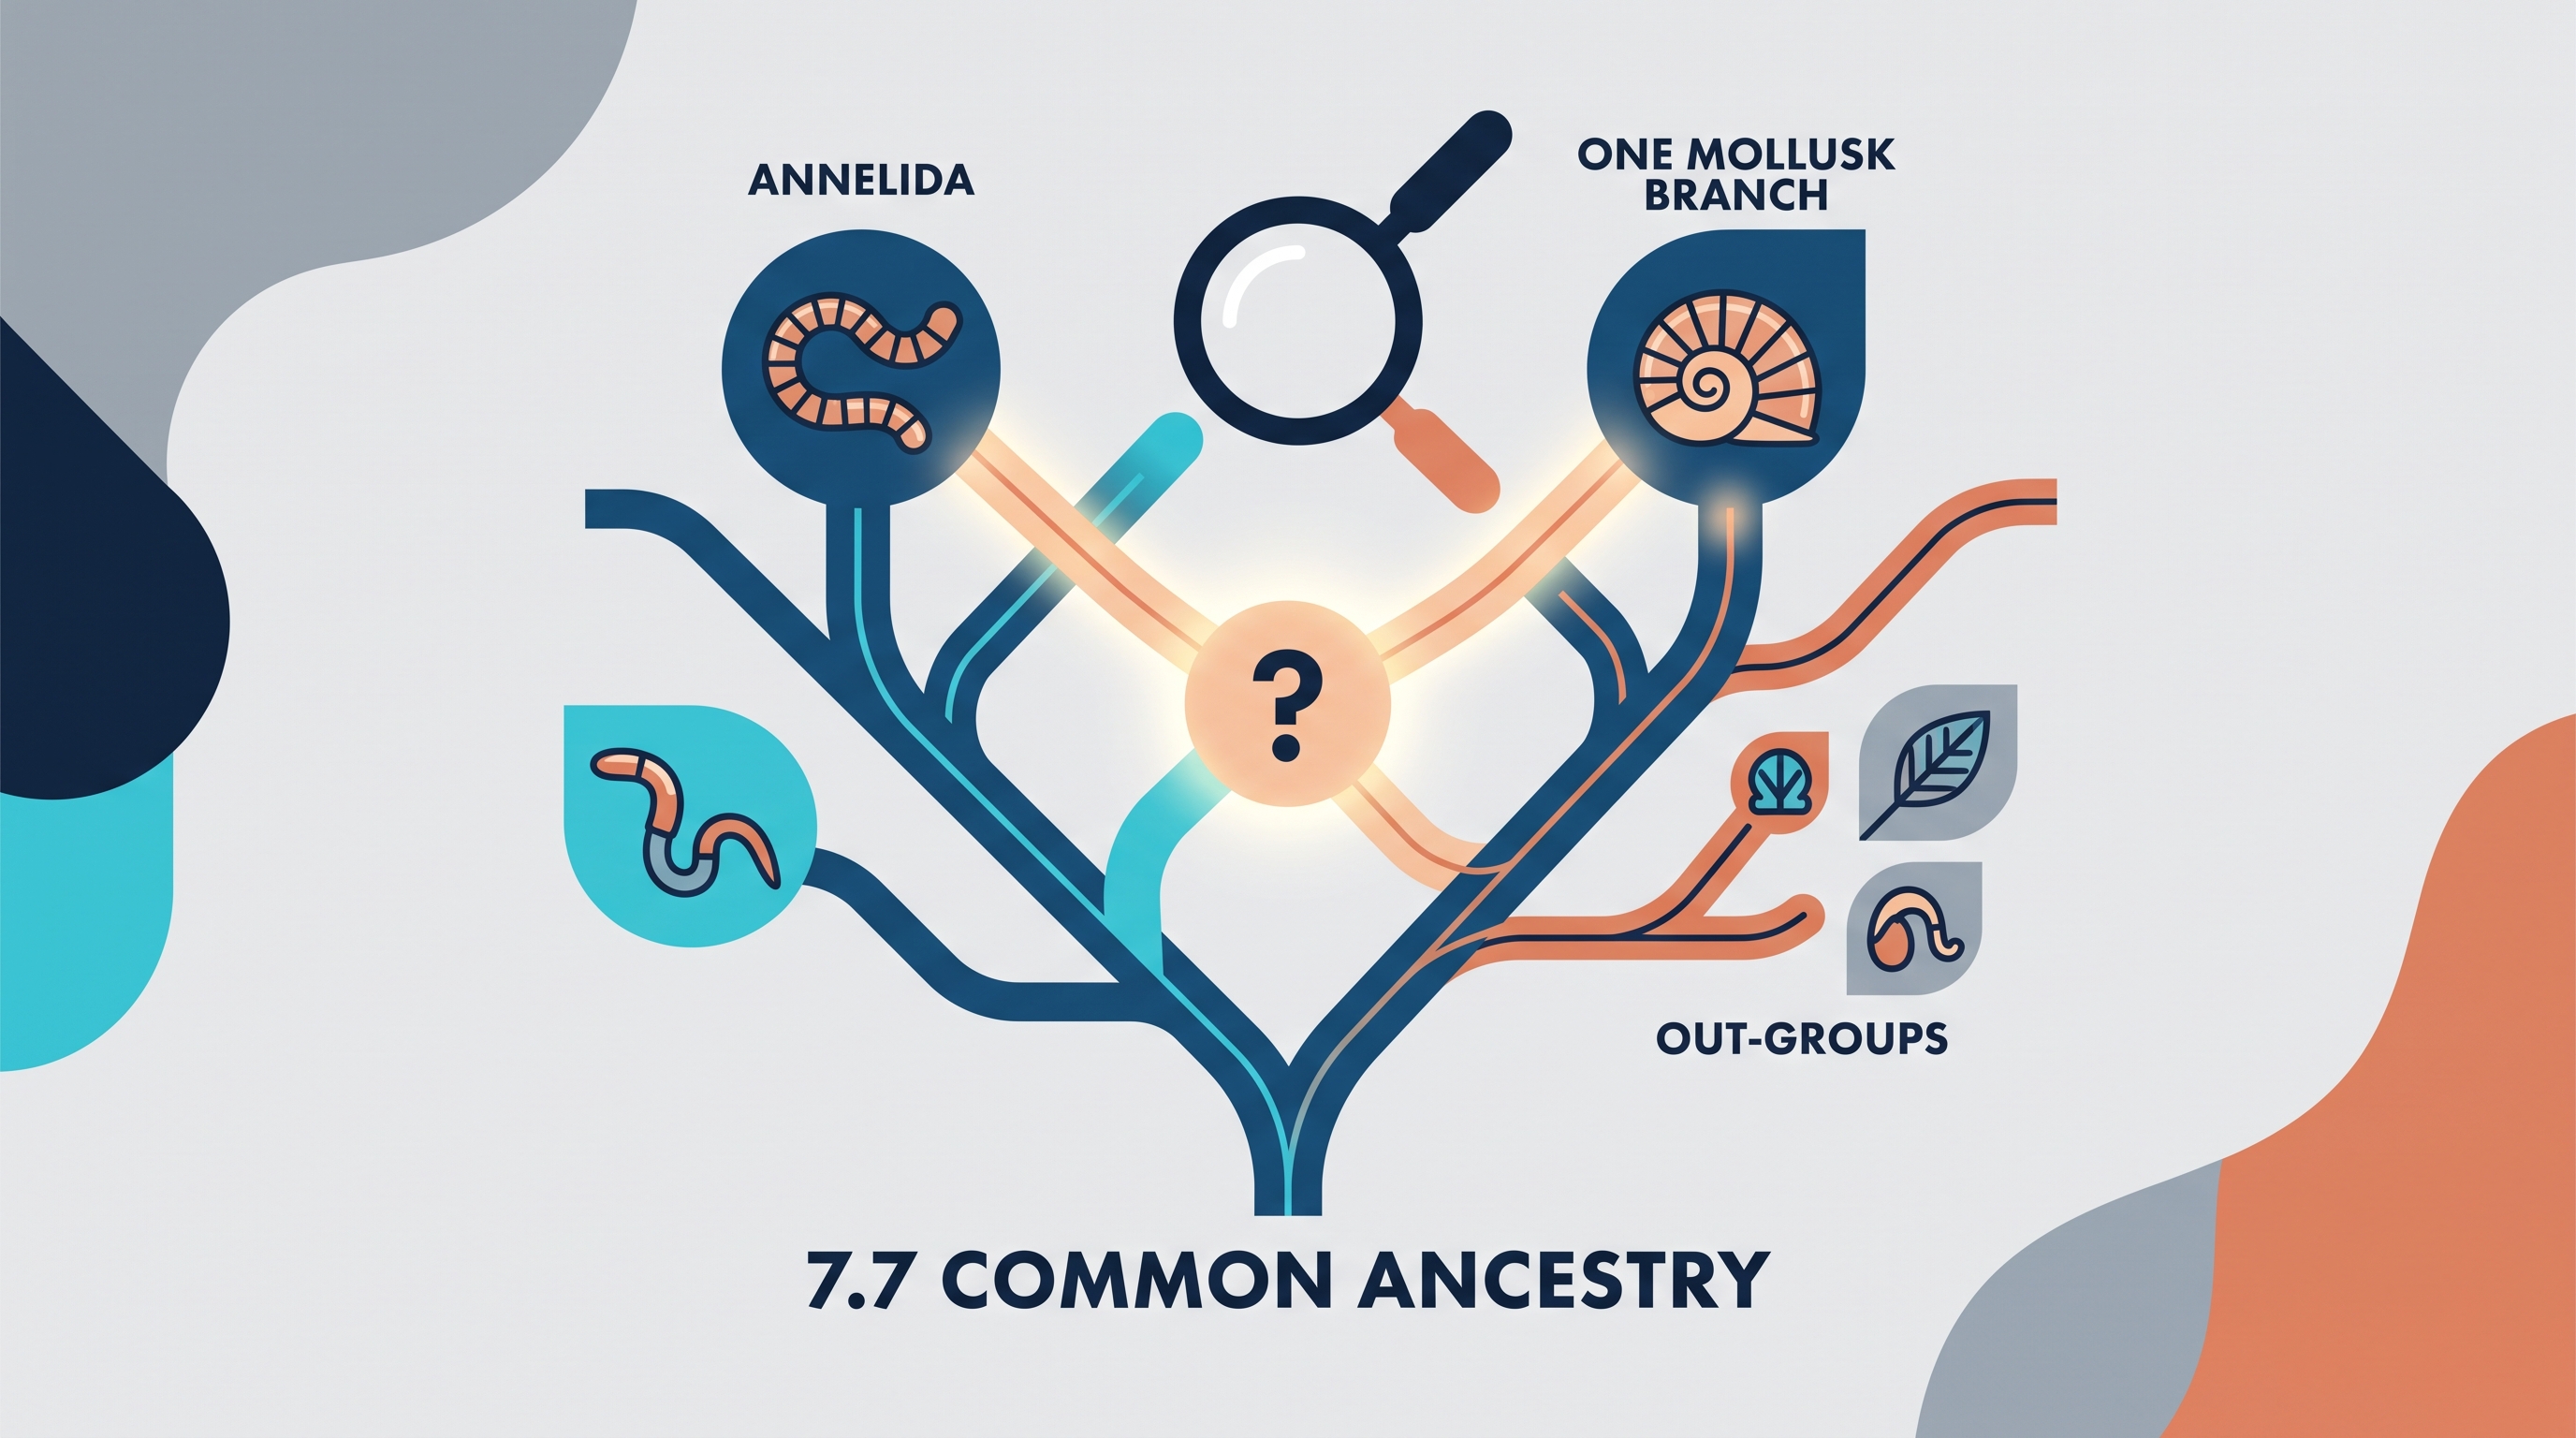
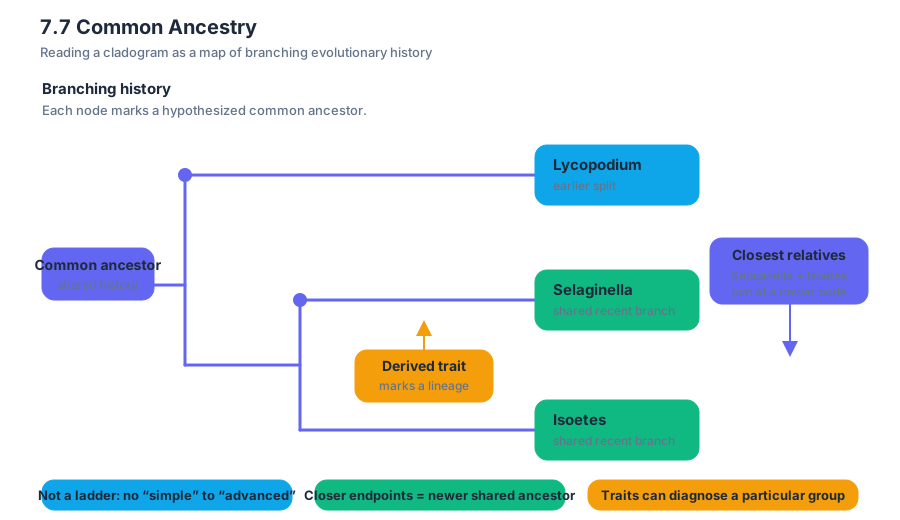
7.8 Continuing Evolution
Key concepts: Rapid-cycling populations · Brassica campestris (Brassica rapa) · Artificial selection and plant breeding · Generation time and reproductive cycling · Population-level evolutionary change
A population can evolve quickly enough for researchers to watch the change occur within a classroom, greenhouse, or laboratory. The key is to combine heritable variation with a short generation time, the interval between the birth of one generation and the birth of its reproductive offspring.
7.8 Continuing Evolution
A population can evolve quickly enough for researchers to watch the change occur within a classroom, greenhouse, or laboratory. The key is to combine heritable variation with a short generation time, the interval between the birth of one generation and the birth of its reproductive offspring.
In 1986, Paul H. Williams and Curtis B. Hill described the development of rapid-cycling populations of Brassica campestris—the species now commonly called Brassica rapa. Their work, published in Science volume $232$, issue $4756$, pages $1385$–$1389$ on June $13$, $1986$, showed how selective breeding could produce plants that completed their reproductive cycle unusually quickly.
Rapid-cycling plants as an evolutionary “fast-forward”
Ordinary plant breeding may require many growing seasons before a breeder can evaluate a trait in descendants. A rapid-cycling population compresses that timeline: plants germinate, grow, flower, produce seeds, and begin the next generation in a much shorter period. Each completed cycle gives selection another opportunity to change the population.
The important word is population. An individual plant does not evolve because it grows faster during its lifetime. Evolution occurs when the frequencies of heritable variants change across generations. If plants with shorter generation times leave more descendants, the genetic variants associated with that trait can become more common in the population.
$$ \text{heritable variation}+\text{differential reproduction}\longrightarrow\text{population-level evolutionary change} $$
How selective breeding shortened generation time
Artificial selection is the deliberate breeding of organisms with traits that humans prefer. Williams and Hill used this process to select plants that reproduced rapidly. Seeds from the fastest-cycling plants were used to establish later generations, so the selected trait was repeatedly favored.
A simplified breeding sequence looks like this:
- Begin with a population containing variation in flowering and seed-production time.
- Identify individuals that complete reproduction earliest.
- Use those individuals as parents for the next generation.
- Grow their offspring under similar conditions.
- Repeat the selection process across generations.
- Test whether the population now completes its cycle more rapidly.
Selection does not create a useful trait because the breeder wants it. Instead, it changes which existing heritable variants contribute most to the next generation. Mutation and recombination provide variation; selection changes its representation in the population.
Why rapid reproduction makes continuing evolution easier to study
A long-lived organism may evolve continuously, but its evolutionary change can be difficult to observe directly because few generations occur during a human research project. Rapid-cycling Brassica populations solve this practical problem. Researchers can observe multiple generations, measure reproductive timing, select parents, and compare descendants with the original population.
This creates a powerful experimental loop:
$$ \text{measure trait}\rightarrow\text{select breeders}\rightarrow\text{produce offspring}\rightarrow\text{measure descendants} $$
If the descendants reproduce earlier than the starting population, that pattern supports the claim that selection changed the population. Strong evidence requires more than a single unusually early-flowering plant: researchers must examine the population across generations and control environmental conditions so that developmental plasticity is not mistaken for inherited evolution.
Population variation supplies the raw material
Plant breeding can improve traits such as rapid flowering, compact growth, or reliable seed production only when individuals differ and at least some of those differences are heritable. If every plant were genetically identical and responded identically to the environment, choosing one plant over another would not produce a lasting change in descendants.
Evolution is a change in the genetic composition of a population across generations, not a change that an individual acquires simply by practice, need, or effort.
The same principle applies outside agriculture. Pesticide resistance, antibiotic resistance, and changes in populations exposed to climate stress all depend on variation among individuals and unequal reproductive success. Artificial selection and natural selection differ in who or what applies the selective pressure, but both can alter population traits over generations.
Misconception check: “The plants evolved because they tried to reproduce faster”
Correction: plants do not consciously adapt, and selection does not manufacture a trait on demand. The population already contained variation in reproductive timing. By repeatedly choosing early-reproducing plants as parents, the breeding process increased the representation of heritable variants associated with rapid cycling.
CED alignment: Learning Objective 7.8 — Explain how evolution is an ongoing process. This topic is anchored in Essential Knowledge 7.C.1, emphasizing that natural selection is an ongoing mechanism that can produce evolutionary change whenever heritable variation affects reproductive success. The rapid-cycling Brassica example demonstrates the same population-level logic through artificial selection.
AP skill connections: Science Practice 1: Concept Explanation, especially 1.B Explain biological concepts and processes, is used when connecting generation time, heritability, and changing trait frequencies. Science Practice 4: Representing and Describing Data, especially 4.A Represent and describe data, applies when comparing reproductive-cycle measurements across generations. Science Practice 6: Argumentation, including 6.A Make a claim and 6.B Support a claim with evidence, applies when deciding whether descendant populations show continuing evolutionary change.
Retrieval check: A breeder selects the earliest-flowering plants each generation, but the offspring do not flower earlier than the original population. What conclusion is most justified? The selection did not produce detectable evolutionary change under those conditions; the trait may have low heritability, the population may lack sufficient genetic variation, or environmental effects may explain the original differences. Selection alone does not guarantee evolution.
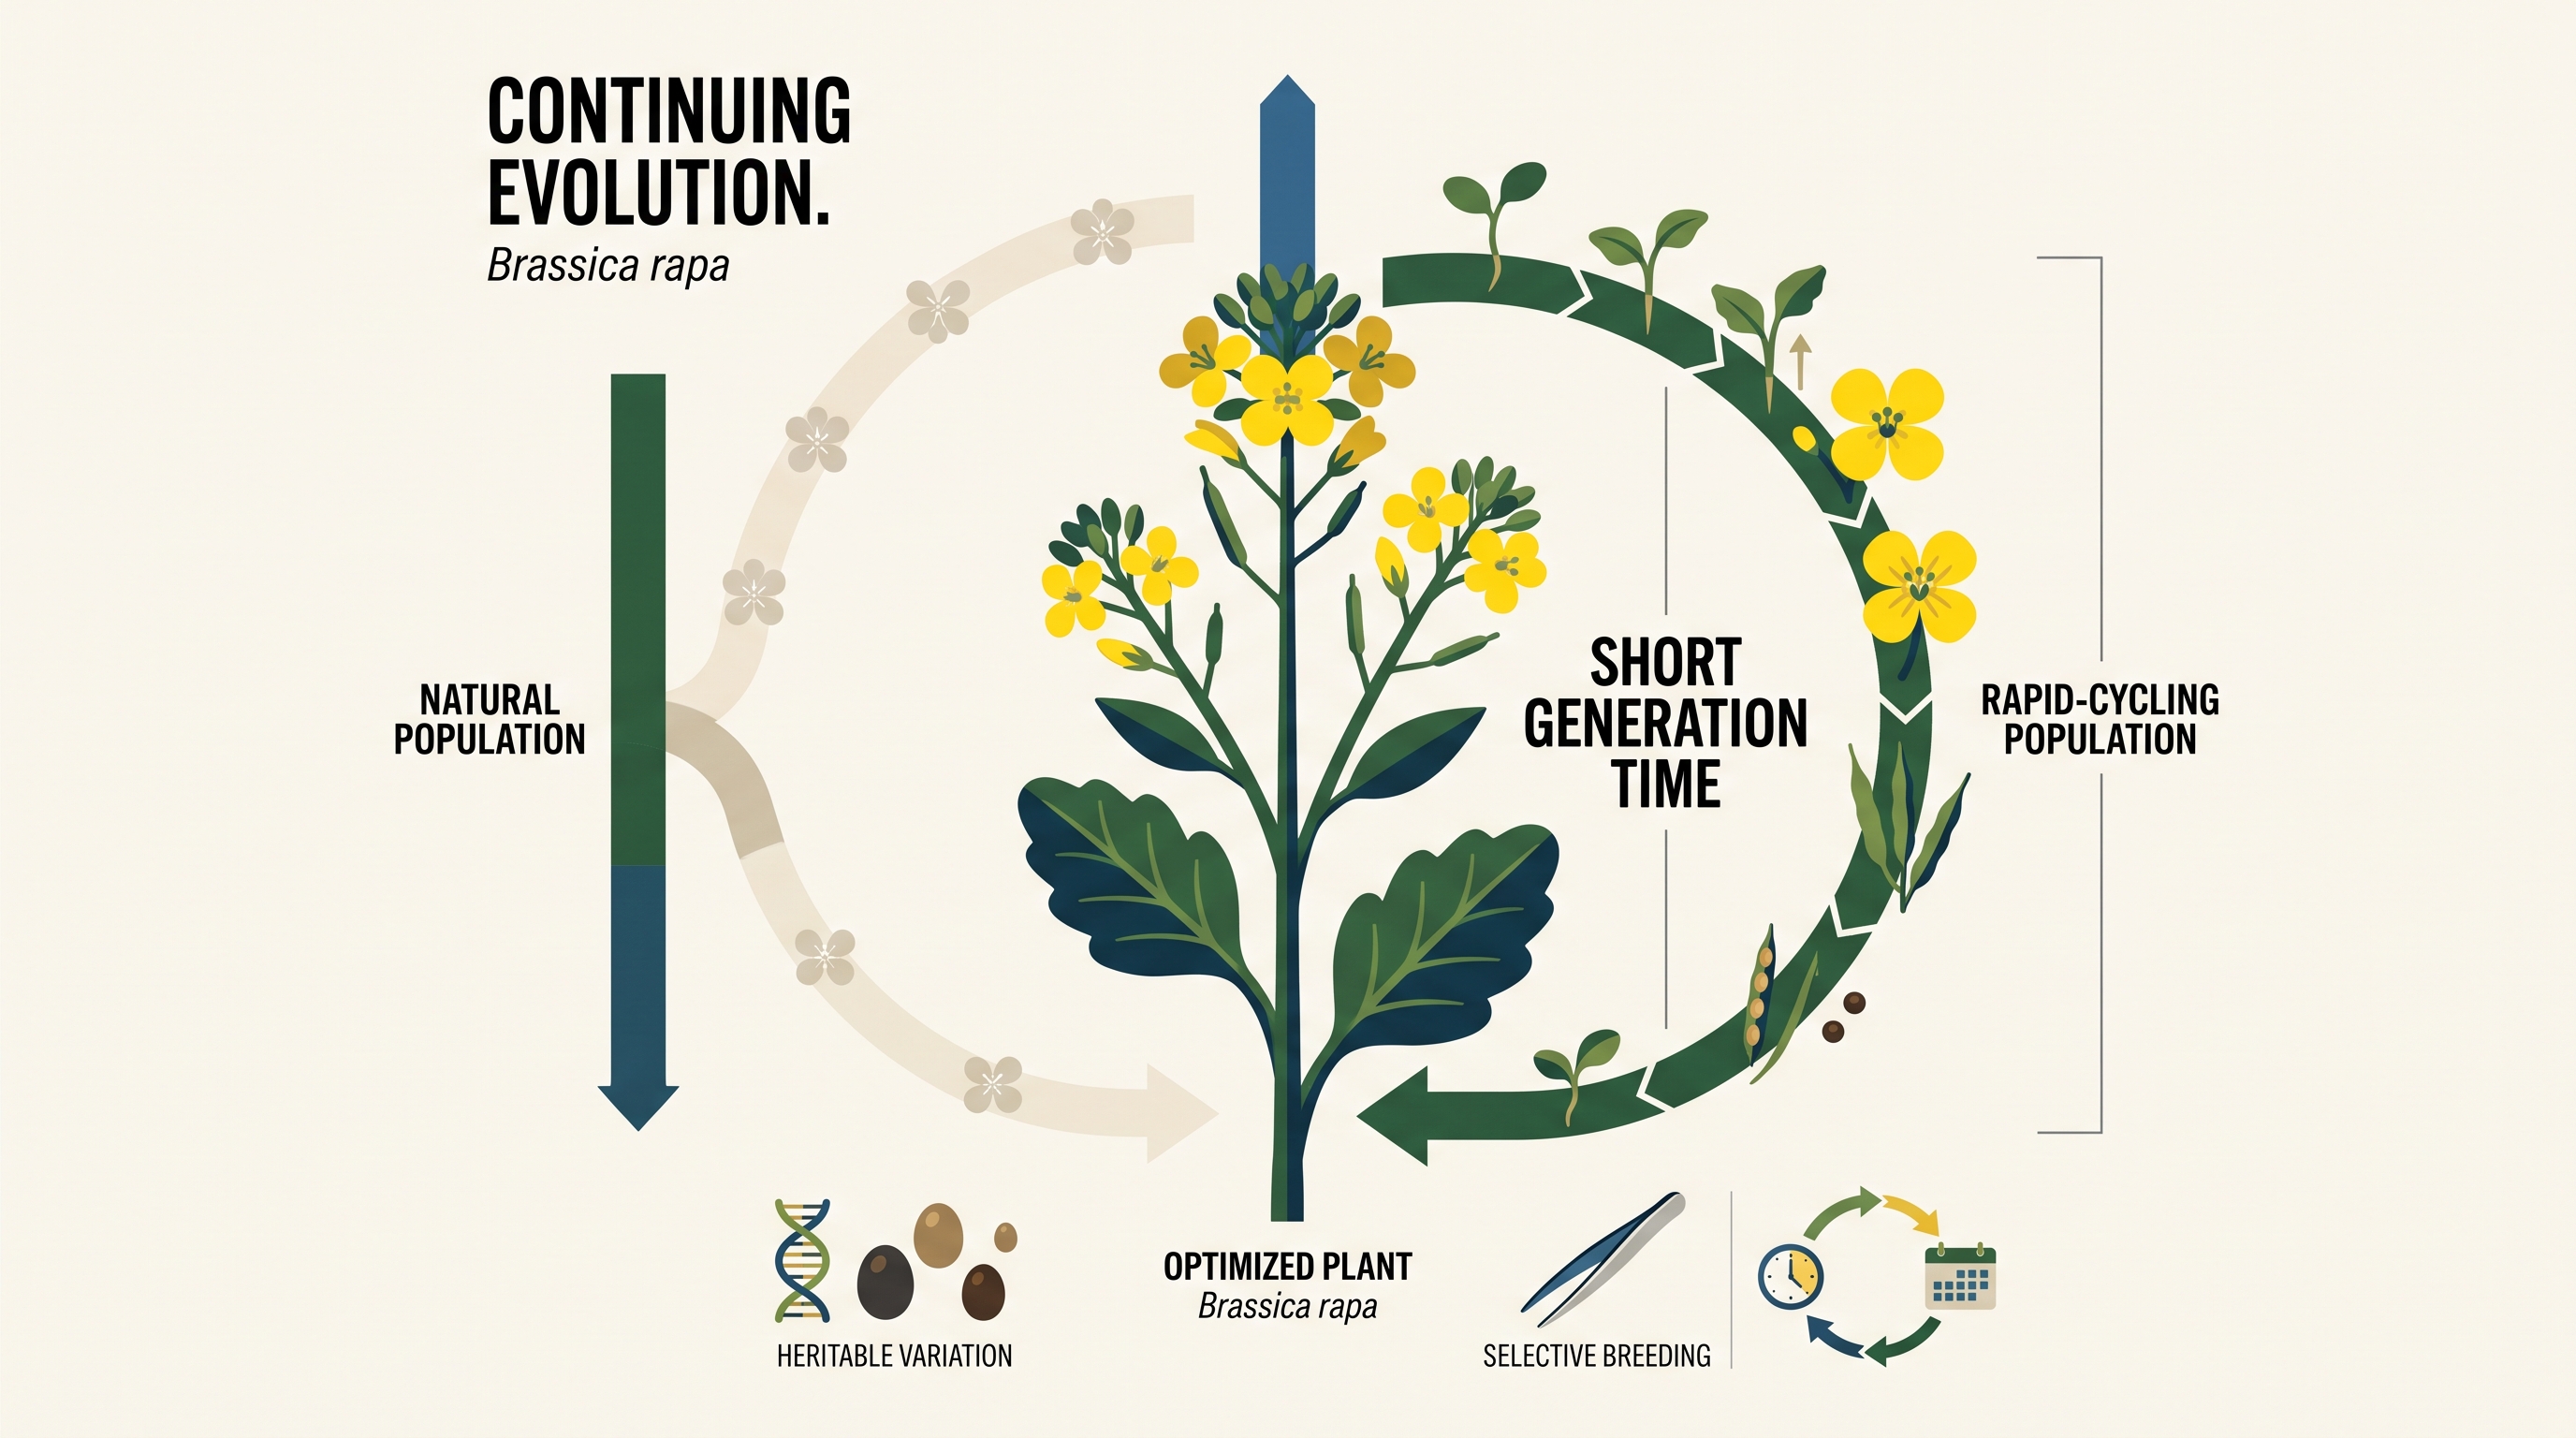
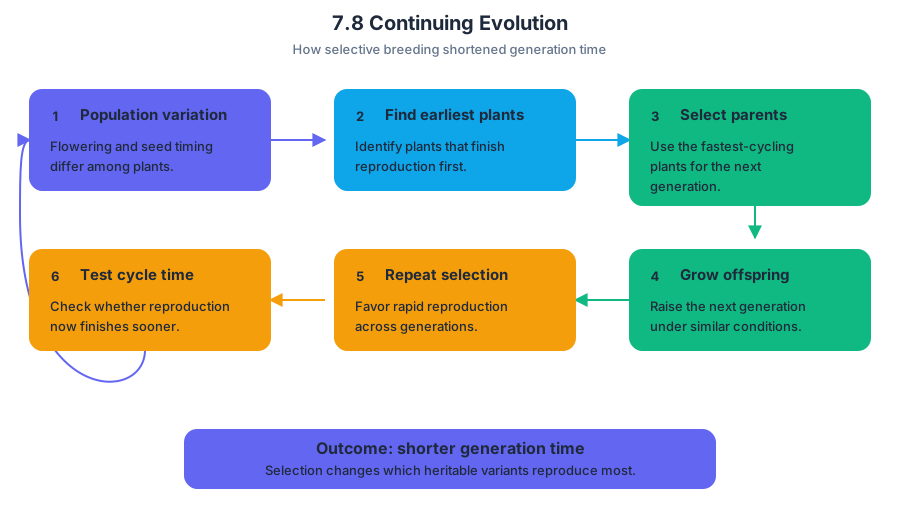
7.9 Phylogeny
A phylogeny is a model of the evolutionary relationships among organisms, showing which groups share more recent common ancestors. A phylogenetic tree is therefore not a ladder from “primitive” to “advanced”; it is a branching hypothesis about ancestry and descent.
7.9 Phylogeny
A phylogeny is a model of the evolutionary relationships among organisms, showing which groups share more recent common ancestors. A phylogenetic tree is therefore not a ladder from “primitive” to “advanced”; it is a branching hypothesis about ancestry and descent.
Investigative question: How can a diagram reveal evolutionary history?
Imagine comparing four organisms—an owl, a lizard, a frog, and a fish—using inherited characteristics. The key question is not “Which organism looks most complex?” but “Which organisms share the most recent inherited features because they share a recent common ancestor?”
In a phylogenetic tree, each branch represents a lineage, each tip represents a taxon—a named biological group being compared—and each node represents a hypothesized common ancestor. A clade is an ancestor and all of its descendants. The point where two branches meet is especially important: it indicates that those two lineages share a common ancestor at that node.
Essential knowledge 7.9.A.1: Phylogenetic trees and cladograms show evolutionary relationships among organisms or groups.
Reading a phylogenetic tree
The most reliable way to read a tree is to trace lineages backward from the tips until they meet. Two taxa are sister taxa when they share the most recent common ancestor with each other. Sister taxa do not have to look alike, live in the same environment, or be physically adjacent on the page; their relationship depends on the branching pattern.
A tree can be rotated around any internal node without changing its meaning. For example, swapping the positions of two branches at the same node produces a visually different diagram but the same evolutionary relationships.
Worked interpretation
Suppose a cladogram groups organisms in this pattern:
- Fish branches off first.
- Frog branches off next.
- Lizard and owl share the most recent node.
The correct conclusions are:
- The lizard and owl are sister taxa.
- Lizard and owl share a more recent common ancestor with each other than either does with the frog.
- All four organisms share a more distant common ancestor.
- The owl did not evolve from the lizard, and the lizard did not evolve from the owl. Both descended from an ancestral lineage represented by their shared node.
The tree does not necessarily show that the owl is “more evolved” than the fish. Every living lineage has been evolving for the same amount of elapsed time since its ancestors diverged. The tree shows branching relationships, not a ranking of living organisms.
Building relationships from shared characteristics
Scientists construct phylogenies by comparing inherited characteristics, including anatomical traits, developmental patterns, and molecular sequences. A characteristic shared because of common ancestry is a homologous character. When a derived homologous character is shared by members of one clade, it is called a shared derived character, or synapomorphy.
For example, consider a comparison in which a backbone is present in fish, frogs, lizards, and owls; four limbs occur in frogs, lizards, and owls; and amniotic eggs occur in lizards and owls. The most economical interpretation places the backbone at the common ancestor of all four groups, four limbs at the common ancestor of frogs and the two amniote lineages, and amniotic eggs at the common ancestor of lizards and owls.
This reasoning uses parsimony: when several evolutionary explanations are possible, the preferred model generally requires the fewest independent evolutionary changes. Parsimony is not an absolute guarantee that the shortest tree is correct, but it provides a testable way to compare hypotheses.
Skill focus: 2.D Visual Representations
2.D — Represent relationships within biological models, including mathematical models, diagrams, flowcharts, and systems. In phylogeny problems, this skill requires more than recognizing vocabulary. You must translate between a branching diagram, a table of traits, and a written claim about common ancestry.
A strong response identifies the relevant node, names the taxa connected by that node, and uses the branching pattern as evidence. For example: “Taxa A and B are sister taxa because they share the most recent common ancestor shown by their immediate shared node.” A statement such as “A and B are related because they are next to each other” does not demonstrate the skill; page position is not evidence.
Misconception check: “The tree’s tips are arranged from oldest to newest”
Correction: The horizontal or vertical order of tips is usually arbitrary. What matters is the sequence of branching events. Unless a scale or time axis is explicitly provided, branch length does not automatically represent elapsed time, amount of evolutionary change, or biological complexity.
Retrieval check
A tree shows taxa A and B joining at one node, while taxon C joins their lineage at an older node. Which pair is more closely related, and what feature of the diagram supports your answer?
Answer: A and B are more closely related because they share the most recent common ancestor—their branches meet at the younger, more immediate node. This conclusion depends on branching order, not on the organisms’ appearance or their positions on the page.
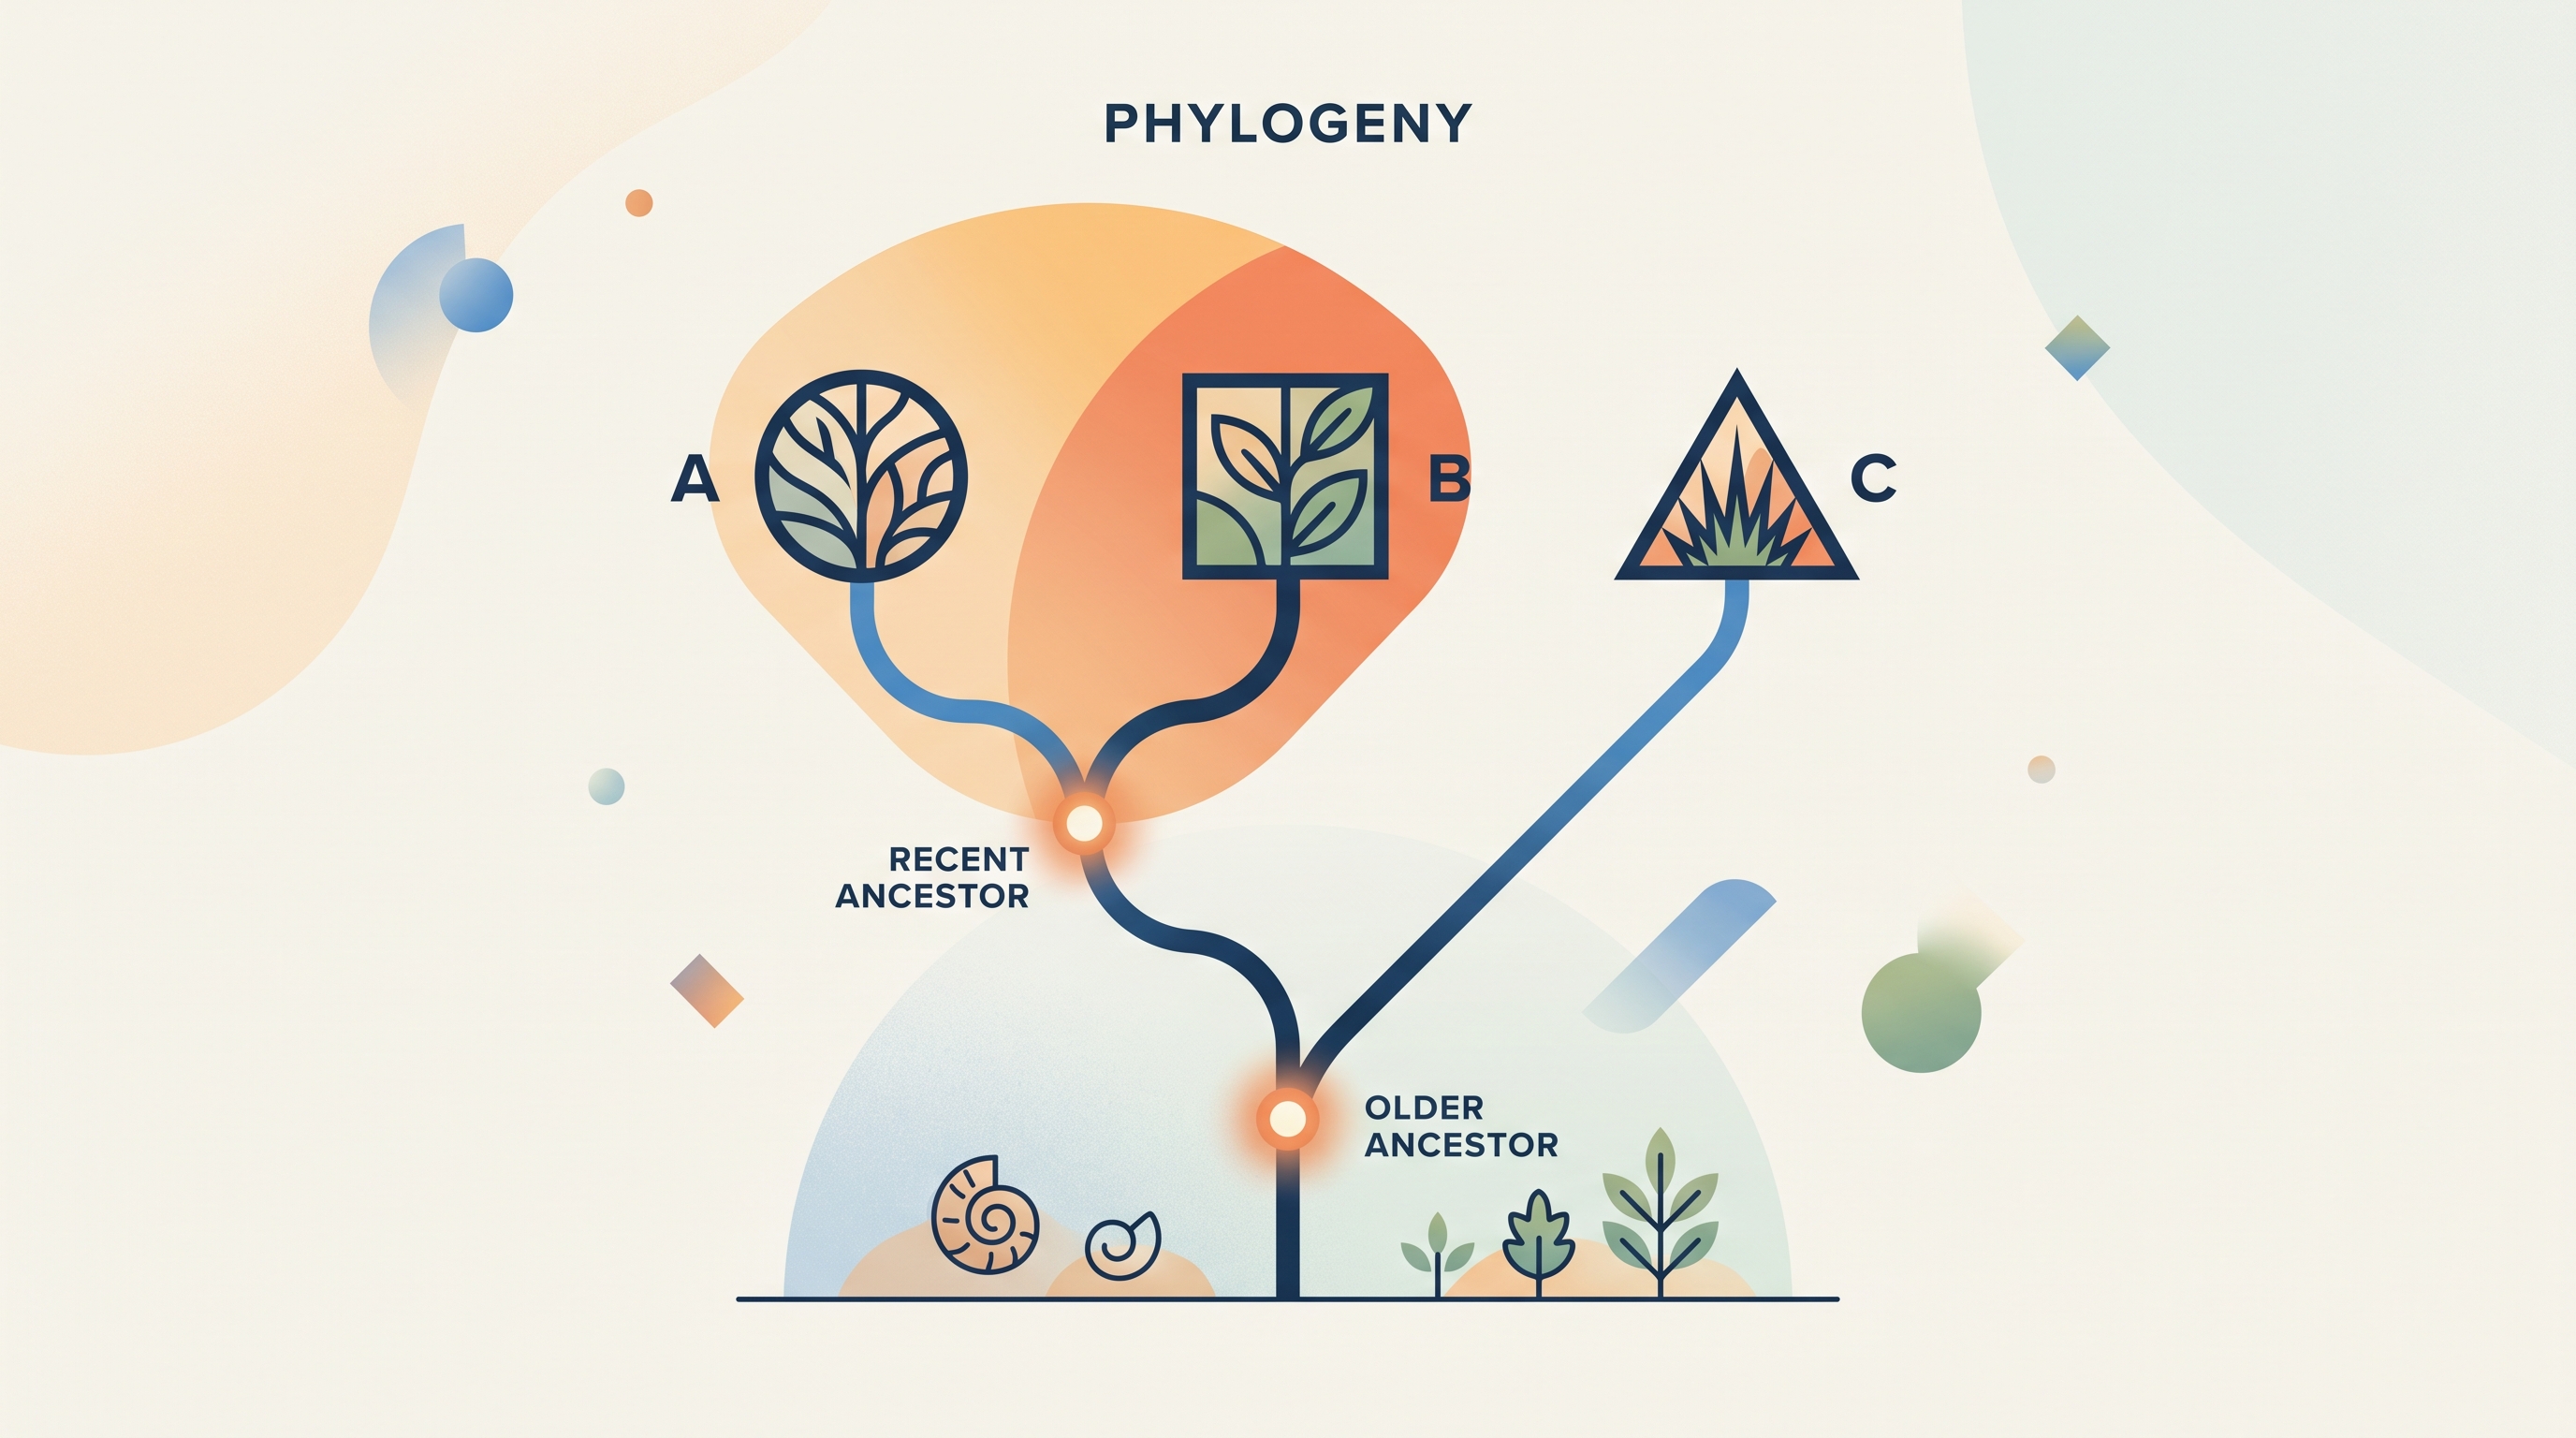
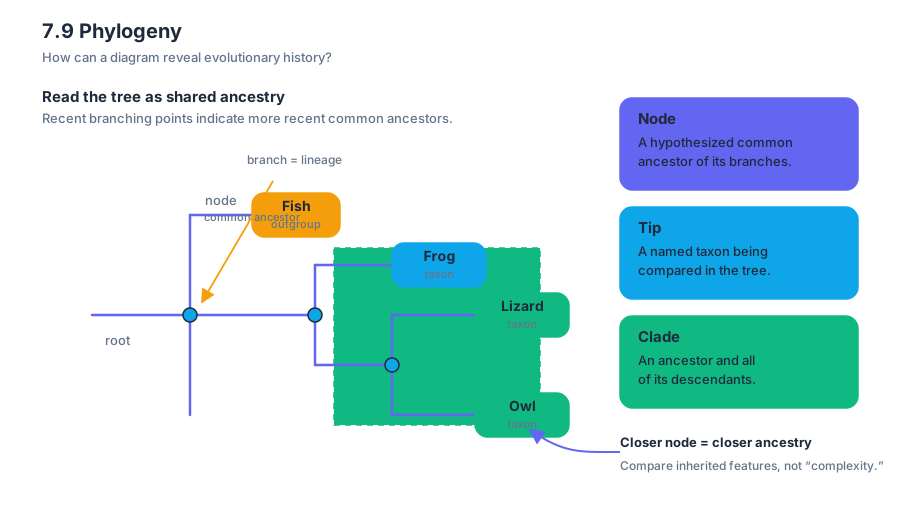
7.10 Speciation
Speciation is the evolutionary process by which one population becomes two or more distinct species, usually because gene flow between the populations has been reduced or stopped.
7.10 Speciation
Speciation is the evolutionary process by which one population becomes two or more distinct species, usually because gene flow between the populations has been reduced or stopped. The decisive question is not simply whether the populations look different; it is whether they remain able to exchange genes successfully.
Learning Objective 7.10: Explain the mechanisms of speciation.
Essential Knowledge 1.C.2: Speciation may occur when two populations become reproductively isolated from each other.
Reproductive isolation: the central mechanism
Reproductive isolation means that members of two populations cannot produce viable, fertile offspring together under natural conditions. Once gene flow stops, mutation, natural selection, genetic drift, and sexual selection can cause the populations to diverge. Over many generations, the differences may become large enough that the populations function as separate species.
Reproductive isolation can occur before fertilization or after fertilization:
| Type | What prevents gene flow? | Example |
|---|---|---|
| Prezygotic isolation | Prevents mating or fertilization | Different breeding seasons, courtship signals, habitats, or reproductive structures |
| Postzygotic isolation | Occurs after fertilization | Hybrid offspring fail to develop, survive poorly, or are sterile |
Prezygotic barriers include habitat isolation, in which populations occupy different environments; temporal isolation, in which they reproduce at different times; behavioral isolation, in which courtship signals are not recognized; and mechanical isolation, in which reproductive structures do not function together. A chemical incompatibility between gametes can also prevent fertilization.
Postzygotic barriers include reduced hybrid viability, when hybrid offspring do not survive well, and reduced hybrid fertility, when the hybrids survive but cannot produce functional gametes. A mule illustrates the latter pattern: a horse and donkey can produce a living offspring, but the mule is generally sterile. Gene flow therefore occurs between the parent species only to a very limited extent.
Allopatric speciation: isolation by geography
Allopatric speciation occurs when a physical barrier separates a population. A river, mountain range, glacier, or newly formed island can divide one population into two geographically isolated populations. Because individuals can no longer mate across the barrier, the two gene pools begin evolving independently.
Worked example — island populations: Imagine a bird population on a mainland. A storm carries a small group to a nearby island, where the birds encounter different food sources and predators. On the mainland, larger beaks may improve access to hard seeds; on the island, narrower beaks may be favored because soft fruits are abundant. Genetic drift may also have a stronger effect on the smaller island population. If the island and mainland populations later meet but no longer recognize one another’s courtship songs, behavioral isolation has completed an important step toward speciation.
The geographic barrier itself does not automatically create a new species. It initiates separation. Speciation requires continued divergence and, eventually, reproductive isolation. If the populations reunite while they can still mate and produce fertile offspring, they remain one species even if their average traits differ.
Sympatric speciation: isolation without a physical barrier
Sympatric speciation occurs when reproductive isolation develops while populations live in the same geographic area. Different mating behaviors, food preferences, habitats, or reproductive timing can reduce gene flow within the shared environment. In plants, changes in chromosome number can produce reproductive isolation rapidly: a chromosome-duplicated plant may be unable to produce fertile offspring with the original population.
The distinction is therefore geographical: allopatric speciation begins with physical separation, whereas sympatric speciation begins without a physical barrier. Both mechanisms require the same evolutionary outcome—reproductive isolation.
Reading speciation on a phylogenetic tree
Phylogenetic trees and cladograms can illustrate speciation that has occurred. A node represents the most recent common ancestor of the lineages branching from it. A branching event represents the point at which one lineage divided into separate evolutionary trajectories; the diagram does not necessarily show the exact instant when complete reproductive isolation arose.
This is an application of Science Practice 2.B, “Explain relationships between characteristics of biological models in both theoretical and applied contexts.” To interpret a tree, identify the node, trace each descendant lineage, and connect the branching pattern to an isolation mechanism. Do not infer that a species at the end of one branch is “more evolved”; every surviving lineage has continued evolving.
Common misconception check
Misconception: “Any visible difference means two populations are different species.” Correction: differences in color, size, or behavior can appear while gene flow continues. Speciation requires reproductive isolation, not merely different appearances.
Science Practice 6.E, “Predict the causes or effects of a change in, or disruption to, one or more components in a biological system,” is tested when a prompt changes a barrier or mating pattern. For example, if a previously isolated population becomes connected by a migration route, predict increased gene flow and reduced divergence. If a new barrier prevents mating, predict that independent evolutionary change becomes more likely.
Retrieval check
A mountain range separates one population into two. After many generations, the populations come into contact, but their courtship signals differ and mating does not occur. The best explanation is allopatric speciation followed by behavioral prezygotic isolation. The geographic barrier began the separation; the failed mating behavior now maintains reproductive isolation.
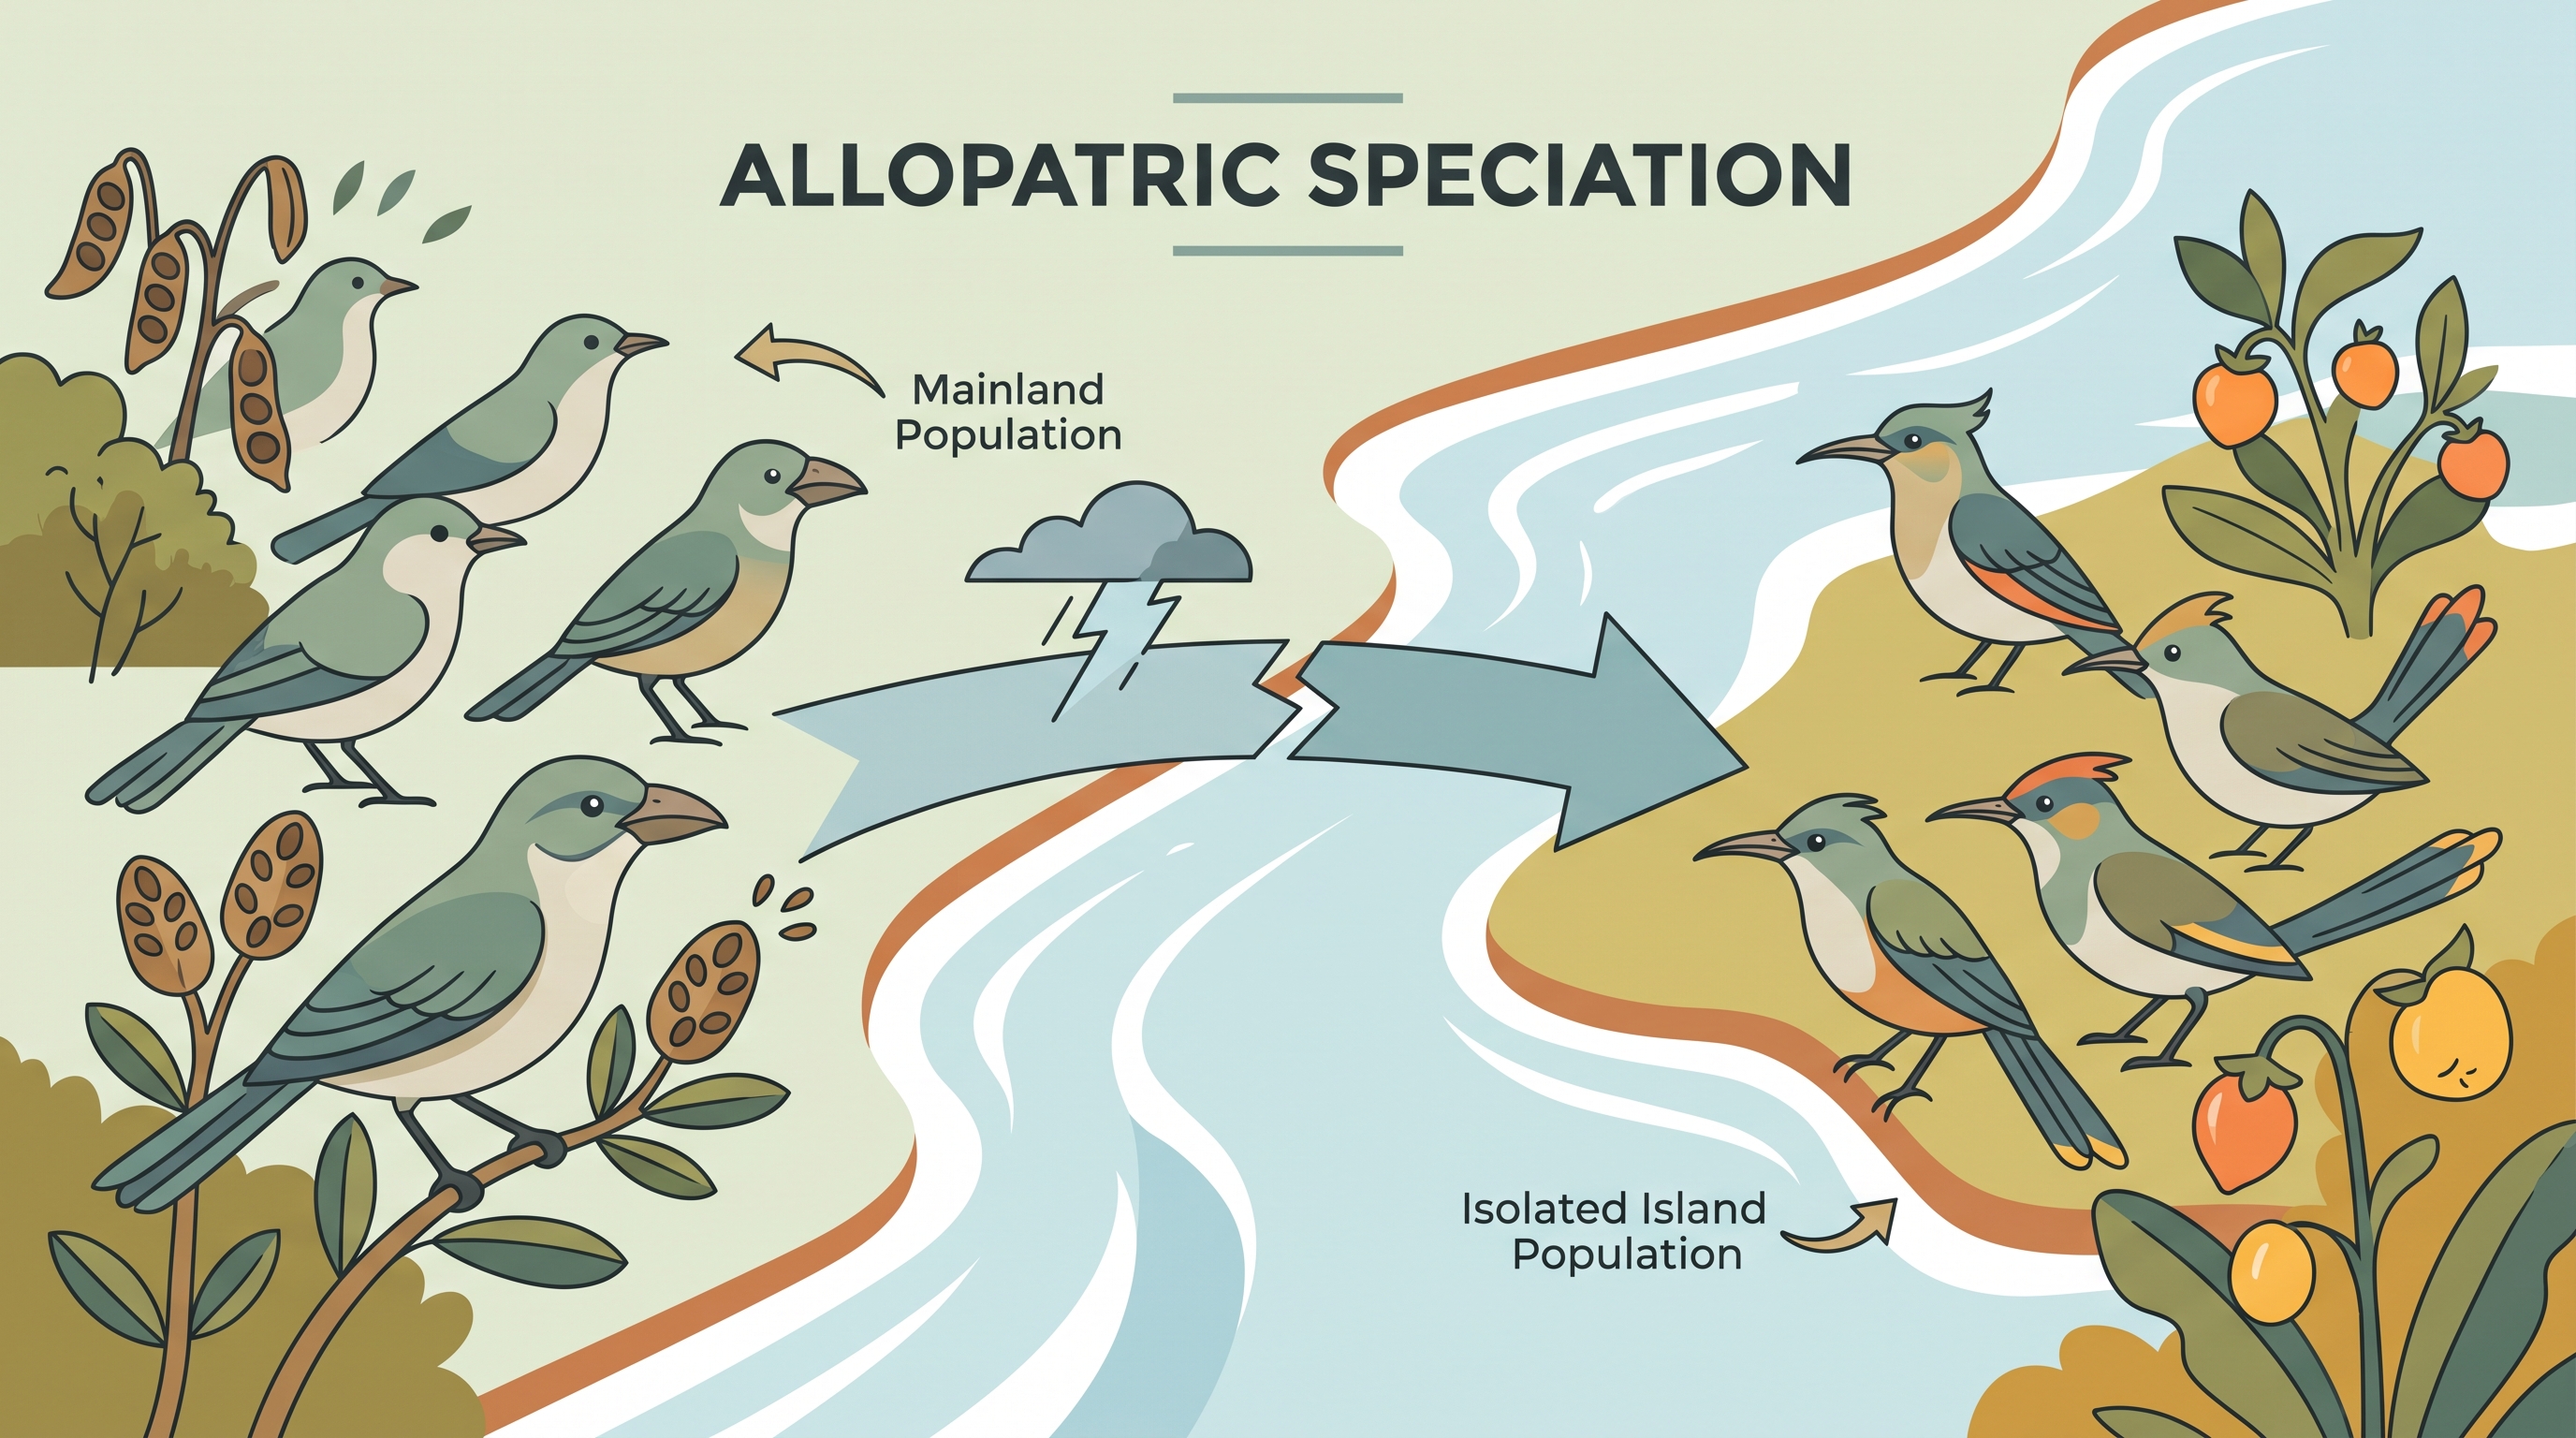
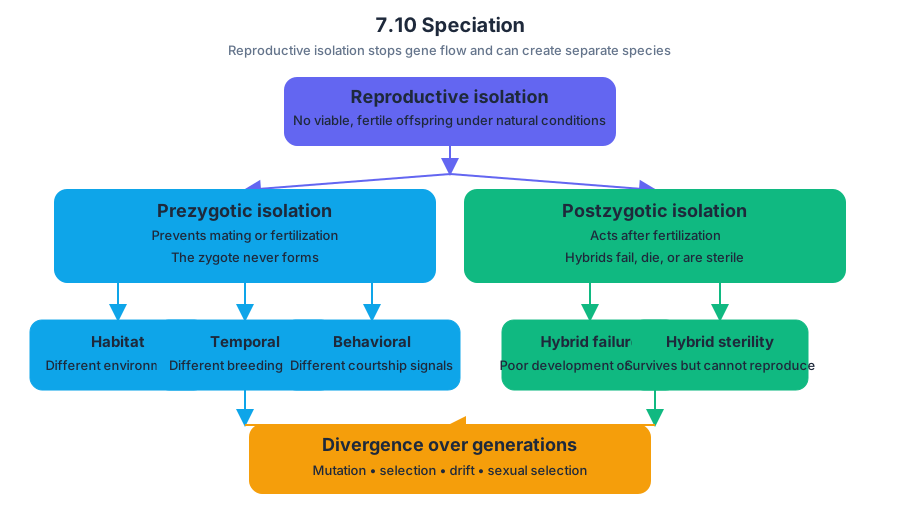
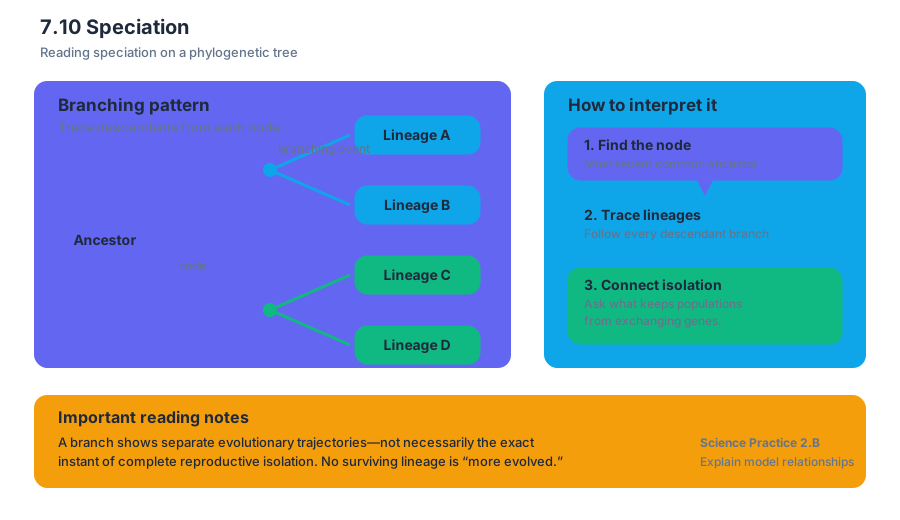
7.11 Variations in Populations
Key concepts: Variations in populations · Environmental change · Selective pressures · Population responses to environments · Interactions among biological systems · Ecosystems · Models of complex biological systems · Limitations of models
Populations contain variation, and environmental change determines which of those differences become advantageous, disadvantageous, or effectively neutral. A population is not a collection of identical organisms: individuals may differ in traits, cellular molecules, physiology, behavior, or responses to…
7.11 Variations in Populations
Populations contain variation, and environmental change determines which of those differences become advantageous, disadvantageous, or effectively neutral. A population is not a collection of identical organisms: individuals may differ in traits, cellular molecules, physiology, behavior, or responses to environmental conditions.
Investigative question: When an environment changes, how do variation and interactions among biological systems shape a population’s response?
Variation meets environmental change
Phenotypic variation means observable differences among individuals, such as body color, enzyme activity, drought tolerance, or resistance to a pathogen. Some variation reflects genetic differences, while some results from environmental effects on organisms with similar genetic information. The biological importance of a trait depends on the environment in which the organism lives.
Under 7.2.A.2, environments change and apply selective pressures to populations. A selective pressure is an environmental condition that causes some phenotypes to survive or reproduce more successfully than others. Temperature, water availability, predators, disease, food supply, toxins, and competition can all act as selective pressures.
Under 7.2.A.3, some phenotypic variations can increase or decrease an organism’s fitness in a particular environment. Fitness means an organism’s relative contribution of viable offspring to the next generation—not simply its strength, size, health, or lifespan.
The causal pattern is:
existing variation → environmental pressure → unequal survival or reproduction → changing trait frequencies
The environment does not “choose” traits because organisms need them. Instead, existing differences are filtered by conditions. If the environment changes again, the same phenotype may no longer provide an advantage.
Worked example: drought and plant populations
Imagine a grass population containing plants with naturally different root depths. During years with regular rainfall, shallow-rooted and deep-rooted plants may produce similar numbers of seeds. A prolonged drought changes the environment: water becomes concentrated deeper in the soil.
Deep-rooted plants now have greater access to water, so they are more likely to survive long enough to reproduce. Shallow-rooted plants may wilt before producing seeds. Over several generations, alleles associated with deeper roots may become more common—not because individual plants deliberately grew deeper roots, but because preexisting variation affected reproductive success under drought.
This example also shows why a population response is measured across generations. Individual plants may acclimate physiologically during their lifetimes, but natural selection changes the frequency of inherited variants in the population.
Variation at the molecular level
7.2.B.1 connects variation in the number and types of molecules within cells to a population’s ability to survive and reproduce in different environments. Individuals may differ in the amount or structure of proteins, pigments, membrane molecules, receptors, or enzymes they produce. Those molecular differences can alter phenotype.
For example, a protein variant that functions efficiently at high temperature may help an organism maintain metabolism during a heat wave. In a cooler environment, that same variant might provide little advantage. The molecular difference matters because it changes a biological function, and the function affects survival or reproduction.
Misconception check: Natural selection does not produce variation because a population “needs” it. Variation must already exist, arise through mutation or recombination, or enter through migration before environmental conditions can filter it.
Populations are interacting biological systems
A population does not respond to climate, resources, or hazards in isolation. Biological systems interact, and those interactions can have complex properties, as emphasized by Systems Interactions. A drought can reduce plant growth, which reduces herbivore food, which changes predator abundance, competition, nutrient cycling, and ecosystem energy flow.
Ecological organization helps locate these interactions:
| Level | What is interacting? | Example response to drought |
|---|---|---|
| Population | Members of one species | More deep-rooted plants survive |
| Community | Multiple populations | Herbivores compete for fewer plants |
| Ecosystem | Organisms plus physical conditions | Reduced plant productivity changes energy flow |
Because effects can move through several levels, population variation should be studied in the context of environmental pressures and system interactions. A trait that benefits one species may alter another species’ resources or predators, producing indirect effects that are difficult to predict from one population alone.
Models: useful, but never reality itself
Models simplify complex biological systems so scientists can identify relationships, generate predictions, and compare possible outcomes. A population model might represent how drought intensity changes survival, or how a trait’s frequency changes when reproduction differs among phenotypes.
Every model has limitations. It may assume constant temperature, random mating, no migration, or independent effects among traits—conditions that rarely hold perfectly in ecosystems. A model should therefore be evaluated by asking: What evidence supports it? Which variables were omitted? What assumptions does it make? Does it successfully predict observations outside the data used to build it?
In-flow retrieval check
A beetle population contains green and brown individuals. After vegetation becomes darker, brown beetles leave more offspring. Identify the selective pressure, the advantageous phenotype, and the population-level change. Then state why the result does not mean that individual green beetles changed color because they needed camouflage.
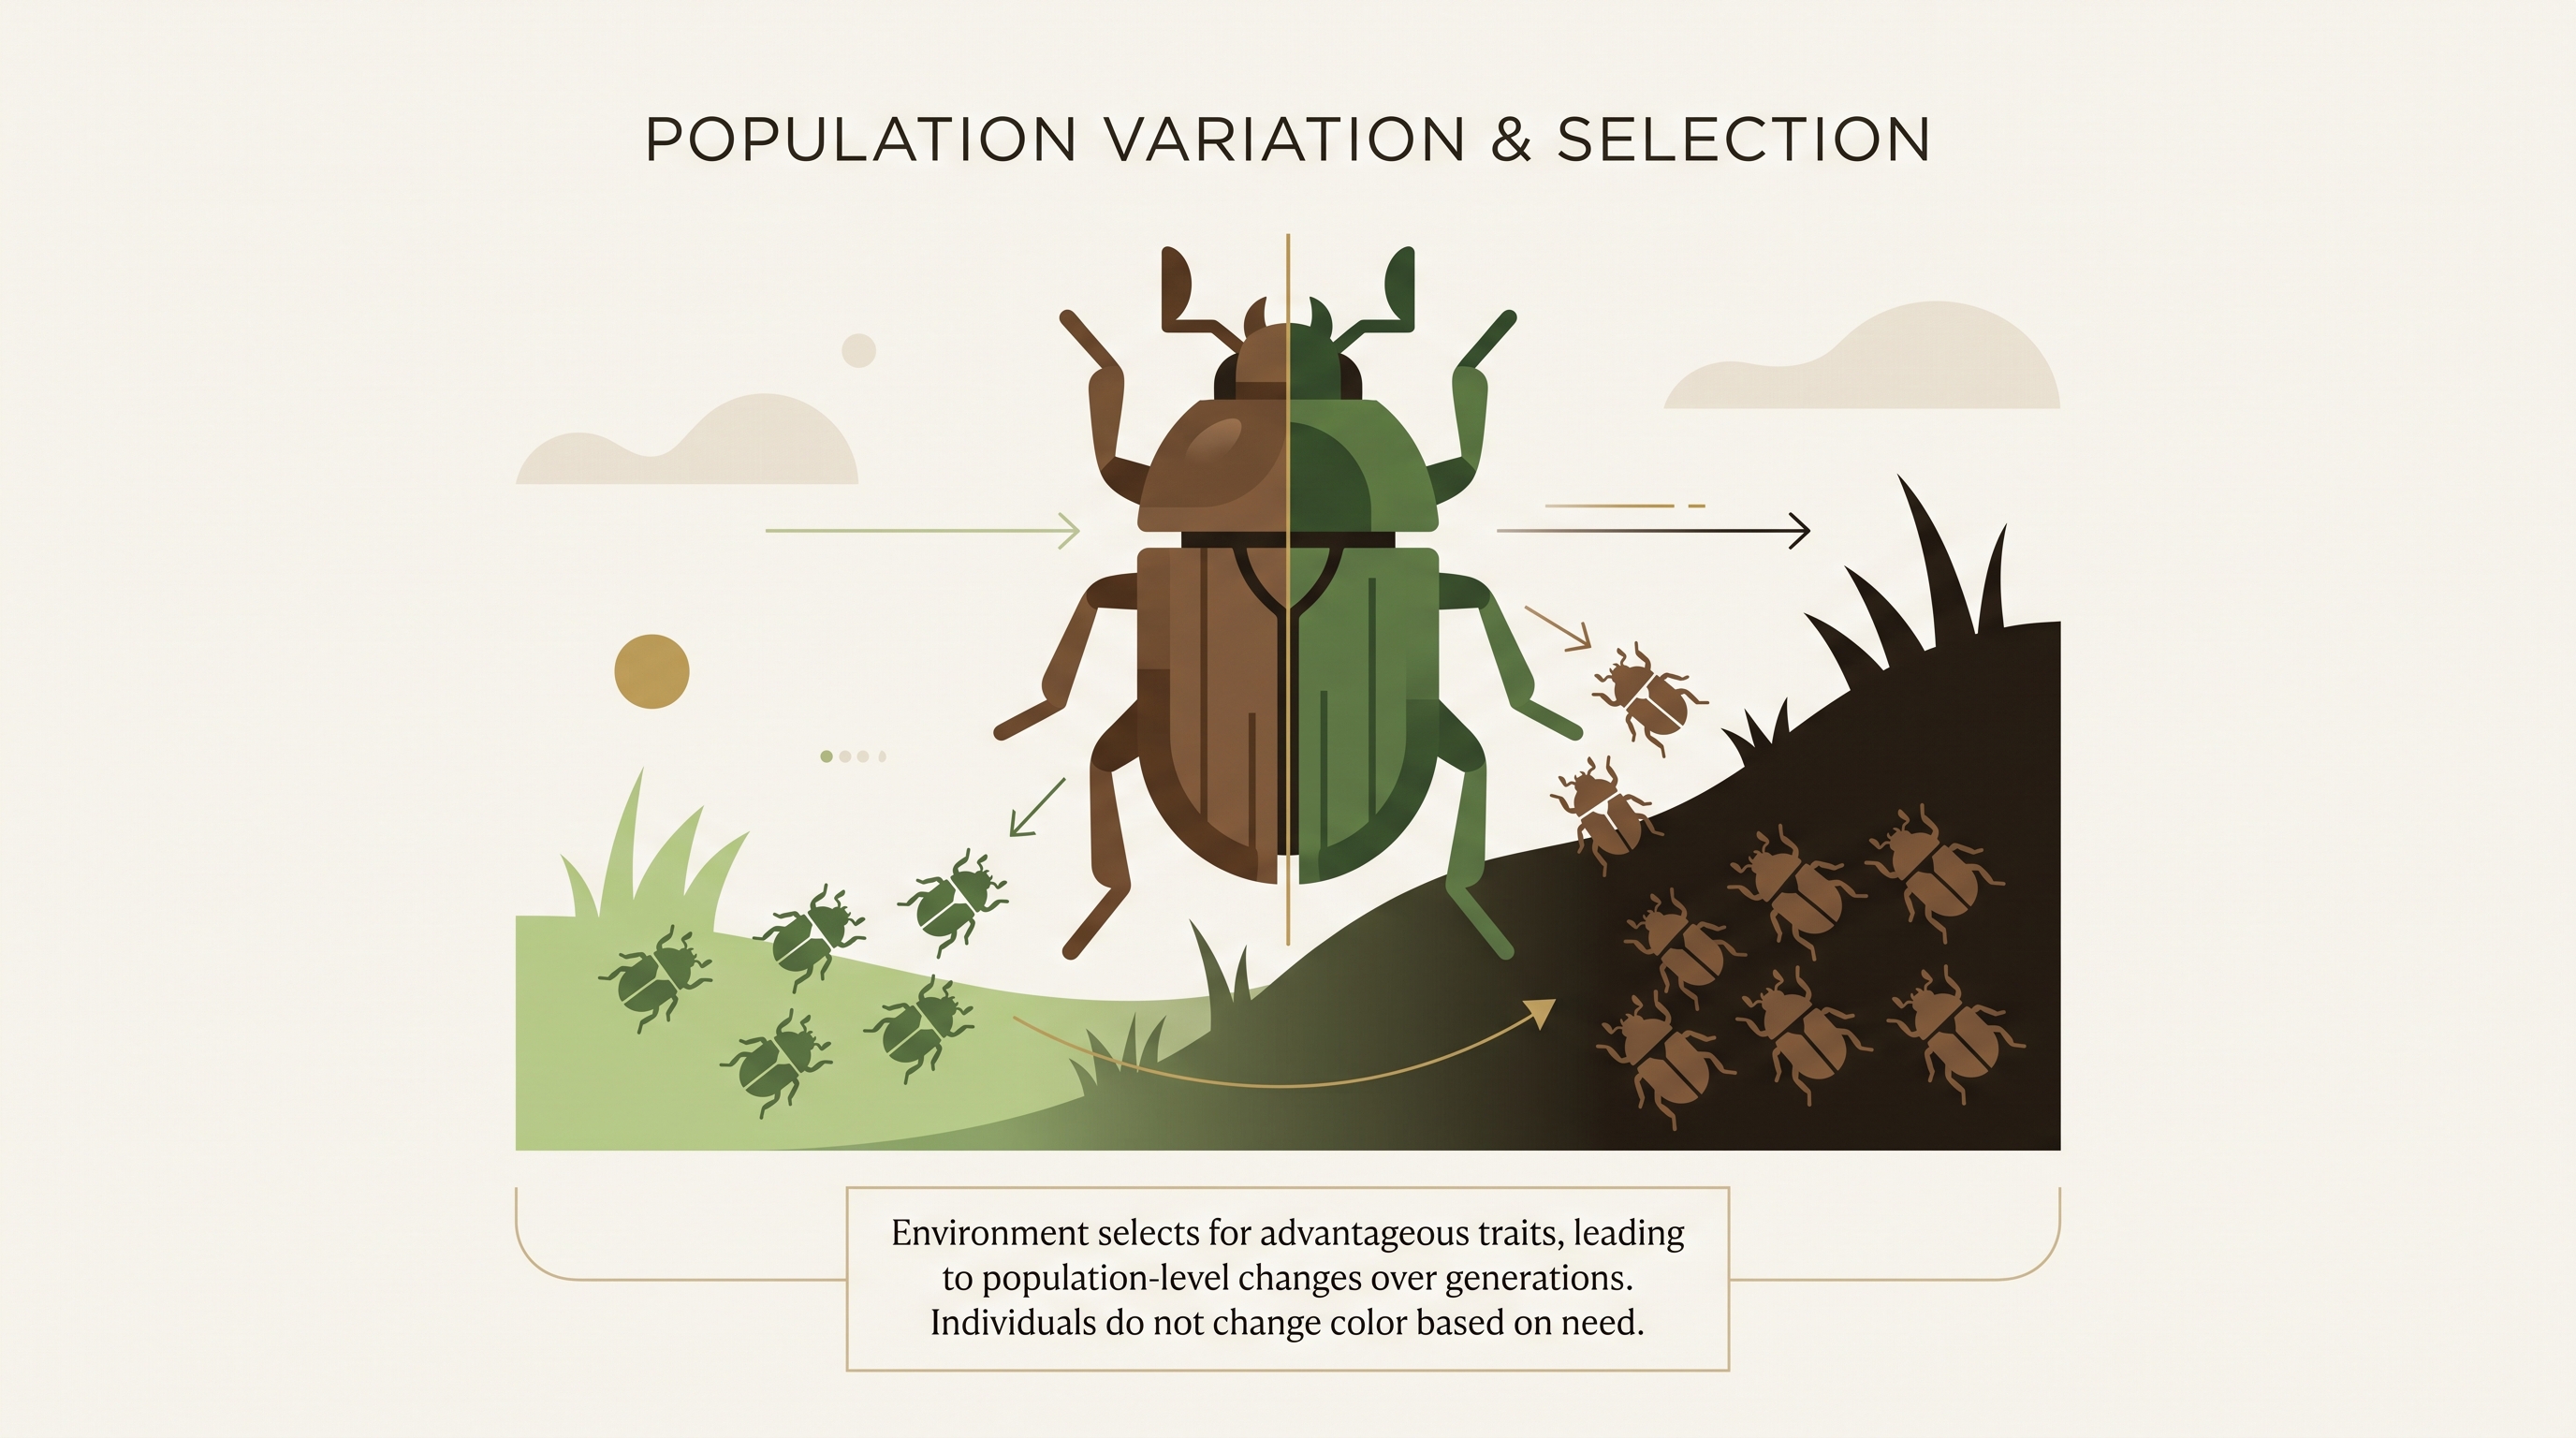
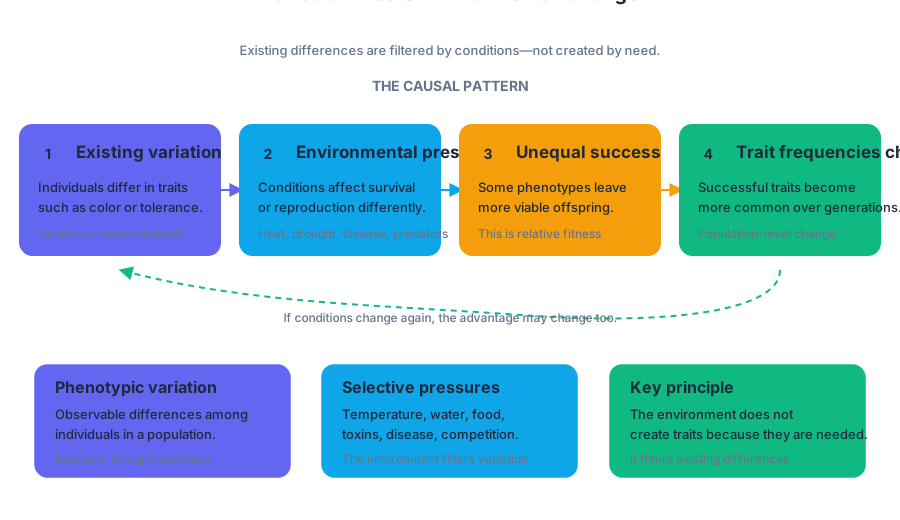
7.12 Origins of Life on Earth
Key concepts: Origins of Life on Earth · Natural Selection · Unit 7 · Big Idea 4 · Mutations · Biotechnology · Phylogeny · Speciation · Variations in organisms · Genes and proteins shared between different organisms
Life on Earth may have begun when nonliving chemistry became capable of storing information, copying itself, and undergoing change across generations. The scientific challenge is not to identify one proven historical sequence, but to evaluate which models of the origin of life on Earth best fit evidence from…
7.12 Origins of Life on Earth
Life on Earth may have begun when nonliving chemistry became capable of storing information, copying itself, and undergoing change across generations. The scientific challenge is not to identify one proven historical sequence, but to evaluate which models of the origin of life on Earth best fit evidence from chemistry, geology, genetics, and evolutionary relationships.
Learning Objective 7.12.A: Describe the scientific evidence that supports models of the origin of life on Earth.
This topic is grounded in Big Idea 4: Systems Interactions: Biological systems interact, and these systems and their interactions exhibit complex properties. Origin-of-life models therefore connect interacting systems: early Earth environments supplied chemicals and energy; chemical reactions produced increasingly complex molecules; and information-bearing molecules made evolutionary change possible.
What counts as evidence for an origin-of-life model?
A model is scientifically useful when it makes testable predictions. For example, if an early-Earth environment could support the formation of biologically important molecules, researchers can recreate some of its chemical conditions and test whether those molecules appear. A result does not prove that exactly the same event occurred billions of years ago, but it can show that a proposed step is chemically plausible.
Scientists evaluate origin-of-life models using several kinds of evidence:
- Geological evidence: ancient rocks and minerals reveal the environments, gases, water, and energy sources that may have existed on early Earth.
- Chemical evidence: laboratory experiments test whether simple substances can form organic molecules under plausible conditions.
- Molecular evidence: shared genes, proteins, and biochemical processes can indicate inheritance from ancient common ancestors.
- Comparative evidence: DNA and protein sequences allow scientists to infer relationships among organisms and identify deeply conserved biological features.
- Experimental evidence: biotechnology can construct, detect, or modify molecules to test whether proposed chemical or genetic mechanisms work.
A key distinction is plausibility versus historical proof. Producing an organic molecule in a laboratory supports the idea that such chemistry could occur; it does not establish that the molecule formed in exactly that way on early Earth. Strong models gain support when independent lines of evidence converge.
From molecules to common ancestry
The same protein can occur in many organisms because the organisms may have inherited the gene for that protein from a common ancestor. The more similar the amino-acid sequences are, and the more similar their functions, the stronger the evidence may be that the genes share evolutionary history—although similarity must be interpreted alongside mutation, selection, and the possibility of independent evolution.
A gene is a DNA sequence containing information that can contribute to a functional product. The same gene can occur in two different kinds of organisms even when the organisms do not produce the same protein in the same way. Mutations may alter the gene’s sequence, and changes in gene regulation may prevent the gene from being expressed in a particular cell, tissue, or life stage.
This distinction matters: finding a gene is not the same as finding its protein product. A gene may be inactive, expressed only under certain conditions, translated differently, or sufficiently changed that its protein is difficult to recognize.
Phylogeny as an evidence tool
Phylogeny is the study of evolutionary relationships. Scientists compare DNA or protein sequences from different organisms and use the similarities and differences to construct a phylogenetic tree, a diagram representing hypotheses about common ancestry.
For example, if organisms A and B share many unique DNA changes that are absent from organism C, a tree may place A and B together as more closely related. The tree does not show that A evolved from modern B; instead, it suggests that A and B inherited those shared features from a more recent common ancestor.
How speciation extends the history of life
Speciation is the formation of new species through divergence of populations and the evolution of reproductive isolation. A population can accumulate mutations, experience natural selection or genetic drift, and become increasingly different from another population. If the groups can no longer successfully exchange genes, they may constitute separate species.
Speciation connects origin-of-life research to the later history of life. Once an early population of self-replicating systems existed, mutation created heritable differences, selection filtered those differences, and continued divergence could produce the branching pattern represented by phylogenies.
Biotechnology: testing ancient biological possibilities
Biotechnology uses biological molecules, cells, or organisms to investigate and solve problems. In origin-of-life research, scientists can synthesize short nucleic-acid sequences, engineer organisms to produce ancient or reconstructed proteins, compare genes across modern species, or analyze molecular systems that may preserve features of early biology.
Suppose researchers identify a highly conserved gene in organisms ranging from bacteria to animals. They can use DNA sequencing to compare versions of the gene, genetic engineering to place one version into another organism, and protein analysis to determine whether it produces a similar product. If the gene is widespread but the protein is absent in some organisms, regulation or mutation may explain the difference.
Misconception check: “If scientists can recreate one step in a laboratory, they have recreated the origin of life.”
Correction: A laboratory result supports one possible mechanism. The complete historical model must also fit geological conditions, molecular evidence, and evolutionary relationships.
Scientific-practice connection
Origin-of-life questions particularly involve Science Practice 1: Concept Explanation, when evidence is used to explain a model; Science Practice 2: Visual Representations, when phylogenetic trees or pathway diagrams are interpreted; Science Practice 3: Questions and Methods, when experiments test chemical or molecular possibilities; Science Practice 4: Representing and Describing Data, when sequence or experimental results are displayed; and Science Practice 6: Argumentation, when competing models are evaluated using evidence.
Retrieval check: A researcher finds the same gene in several organisms, but the gene is expressed in only two of them. What two conclusions are justified? The gene may have been inherited from a common ancestor, and differences in mutation or gene regulation may explain why its protein product is not detected in every organism.
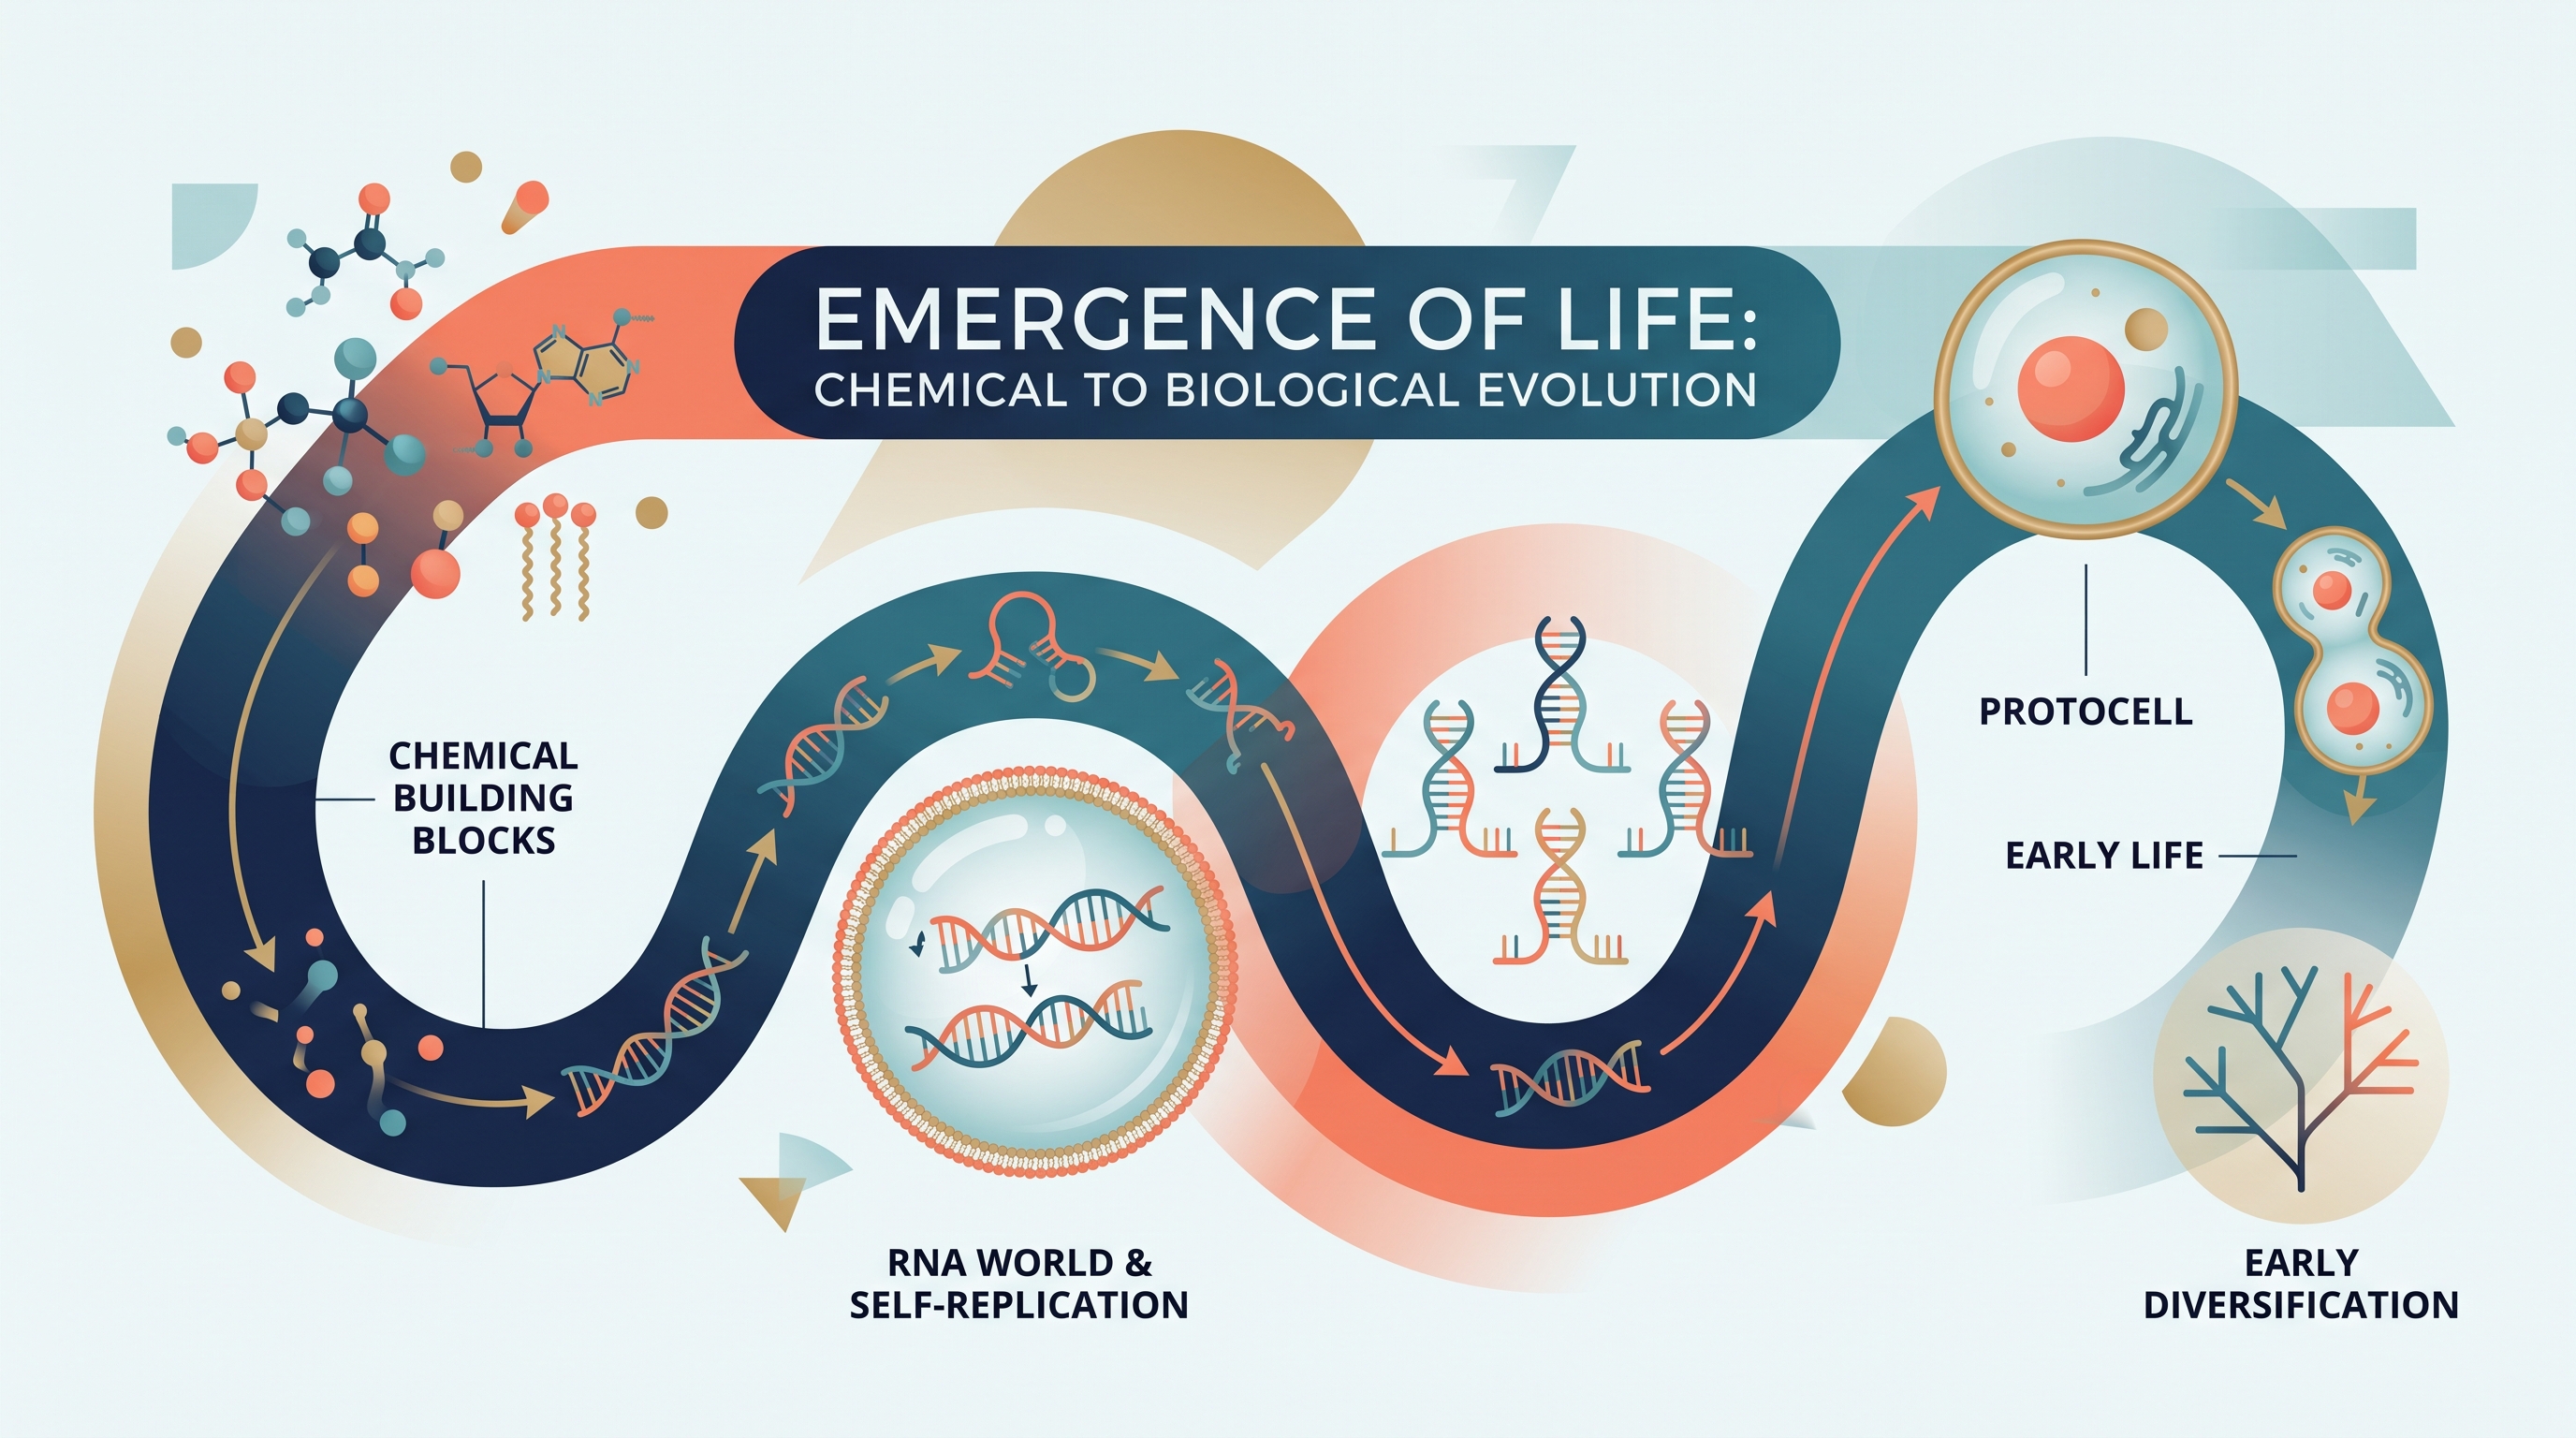
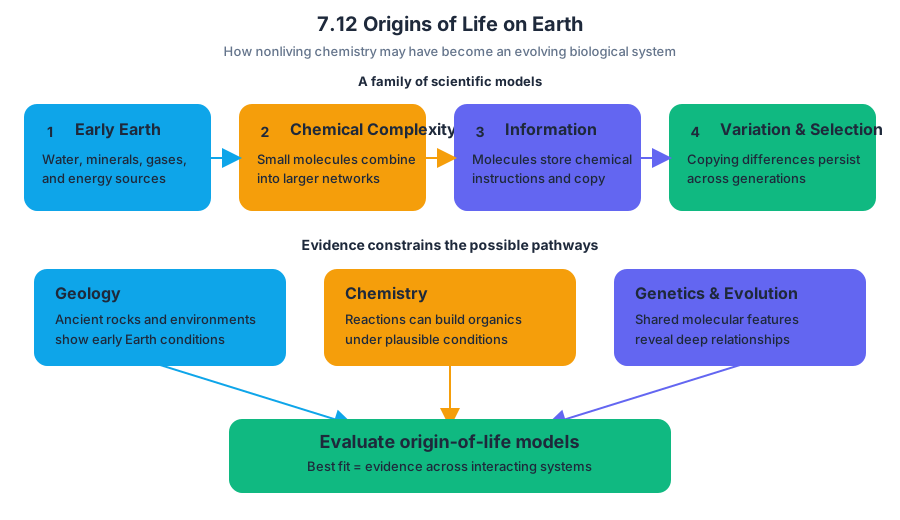
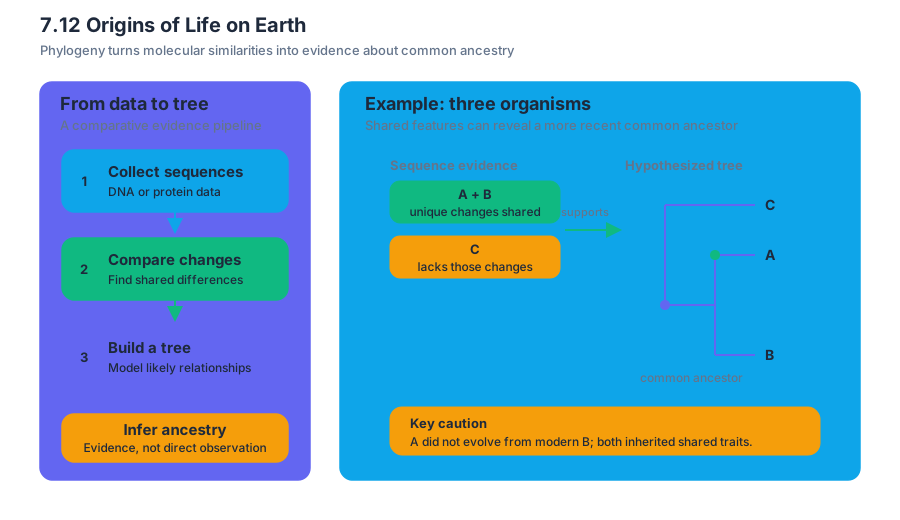
8.1 Responses to the Environment
Key concepts: Responses to environmental stimuli · Physiological mechanisms · Photoperiodism in plants · Phototropism in plants · Taxis · Fight-or-flight response · Predator-warning behaviors · Plant responses to herbivory · Behavioral responses that increase survival and reproductive success · Genetic diversity and resilience to environmental change
An organism survives by detecting environmental change and adjusting its behavior or physiology before that change becomes fatal. A rabbit that freezes when it detects a hawk, a sunflower that bends toward light, and a plant that produces defensive chemicals after being eaten are all responding to environmental…
8.1 Responses to the Environment
An organism survives by detecting environmental change and adjusting its behavior or physiology before that change becomes fatal. A rabbit that freezes when it detects a hawk, a sunflower that bends toward light, and a plant that produces defensive chemicals after being eaten are all responding to environmental stimuli—signals from the internal or external environment that trigger a biological response.
Learning Objective ENE-3.D: Explain how the behavioral and physiological response of an organism is related to changes in the internal or external environment.
Environmental responses: behavior and physiology
A behavioral response is an observable action, such as moving toward food, retreating from a predator, singing, or changing activity from day to night. A physiological response is an internal change, such as releasing hormones, altering metabolism, closing stomata, or producing defensive molecules. Both types of response can increase an organism’s chance of surviving long enough to reproduce.
Under EK 8.1.A.1, organisms respond through mechanisms including photoperiodism, phototropism, taxis, kinesis, and daily activity patterns. Photoperiodism is a plant response to changes in day length. Plants can use seasonal changes in the proportion of daylight and darkness to time flowering, dormancy, or other developmental processes.
Phototropism is plant growth in response to a directional light stimulus. In positive phototropism, a shoot bends toward light. Unequal distribution of the plant hormone auxin causes cells on the shaded side of the shoot to elongate more, bending the shoot toward the light source.
Animals also respond directionally. Taxis is directed movement toward or away from an environmental stimulus: movement toward light is positive phototaxis, while movement away from a harmful chemical is negative chemotaxis. Kinesis, by contrast, is a change in the rate or pattern of movement rather than movement toward a specific direction. Nocturnal and diurnal activity are additional behavioral patterns: nocturnal organisms are primarily active at night, whereas diurnal organisms are primarily active during the day.
| Response | Stimulus | What changes? | Example |
|---|---|---|---|
| Photoperiodism | Day length | Plant development or physiology | Seasonal flowering |
| Phototropism | Directional light | Direction of plant growth | Shoot bends toward light |
| Taxis | Light, chemicals, temperature, or another cue | Direction of animal movement | Movement toward food |
| Kinesis | Environmental condition | Speed or turning frequency | More movement in an unfavorable area |
| Diurnal/nocturnal activity | Light–dark cycle | Time of activity | Foraging during day or night |
Threat responses and predator warnings
Under EK 8.1.A.2, the fight-or-flight response is a physiological response to a threat. Sensory information about danger activates signaling pathways that increase readiness: heart rate and breathing rise, blood flow is redirected toward skeletal muscles, and stored energy becomes rapidly available. The organism may confront the threat or flee from it. This response is useful when immediate action matters, but maintaining it continuously consumes energy and can disrupt normal maintenance.
Predator-warning behaviors can also increase survival. An animal may freeze, flee, emit an alarm call, display warning coloration, or gather with others. A bird’s alarm call can warn nearby individuals; conspicuous coloration may cause a predator to hesitate if it associates that pattern with toxicity or danger. These responses do not guarantee survival, but they can reduce the probability of capture and increase the chance that the organism reproduces.
Plants responding to herbivory
Plants cannot run from herbivores, but they can respond physiologically when tissues are damaged. Herbivory can activate internal signaling that increases production of defensive chemicals, strengthens tissues, or changes volatile compounds released into the air. Those airborne signals may attract predators or parasites of the herbivore, reducing further damage.
Worked example: A caterpillar begins chewing a tomato plant’s leaves. Damaged cells release chemical signals that activate defense pathways. The plant produces compounds that make the leaves less nutritious or more difficult to digest and releases volatile molecules that attract a caterpillar predator. The response is adaptive because it links an external stimulus—herbivore damage—to physiological changes that can reduce tissue loss and preserve future reproduction.
From individual responses to population resilience
A response affects fitness, meaning an organism’s ability to survive and produce viable offspring. Territorial marking, bird songs, pack behavior, coloration, and predator warnings are examples listed under EK 8.1.B.1 because they can improve access to resources, protect offspring, attract mates, or reduce predation. IST-5.A requires connecting these behavioral responses to overall fitness and to the success of the population.
A population’s ability to respond to environmental change also depends on its genetic diversity, the variety of alleles present among its individuals. Populations with little genetic diversity face greater risk of decline or extinction because they are less likely to contain individuals able to withstand a new environmental pressure. Genetically diverse populations are more resilient because different individuals may possess different tolerances or defenses; however, an allele advantageous in one environment may be harmful in another.
AP skill in action
For Science Practice 3, Skill 3.C: Identify experimental procedures that are aligned to the question, a valid investigation must match the procedure to the response being tested. To test whether herbivory induces plant defense, compare damaged and undamaged plants while keeping species, age, light, water, soil, and herbivore exposure time consistent. To test phototropism, measure shoot curvature after exposing plants to light from one direction and compare them with plants receiving uniform light.
For Science Practice 5, Skill 5.A: Perform mathematical calculations, calculate a response proportion such as
$$ \text{proportion responding}=\frac{\text{number of organisms showing the response}}{\text{total number observed}}. $$
A larger proportion of prey fleeing after an alarm signal supports a difference in behavior, but the conclusion must still consider replication and variation.
Retrieval check: A caterpillar begins feeding on a plant, and the plant later releases volatile chemicals that attract predators of the caterpillar. Is this a behavioral response, a physiological response, or both? Explain the stimulus, the plant’s response, and how the response could increase fitness.
Answer: It is primarily a physiological response: herbivory triggers internal defense signaling and chemical production. The response may increase fitness by reducing additional tissue damage, improving survival, and preserving the plant’s ability to reproduce.
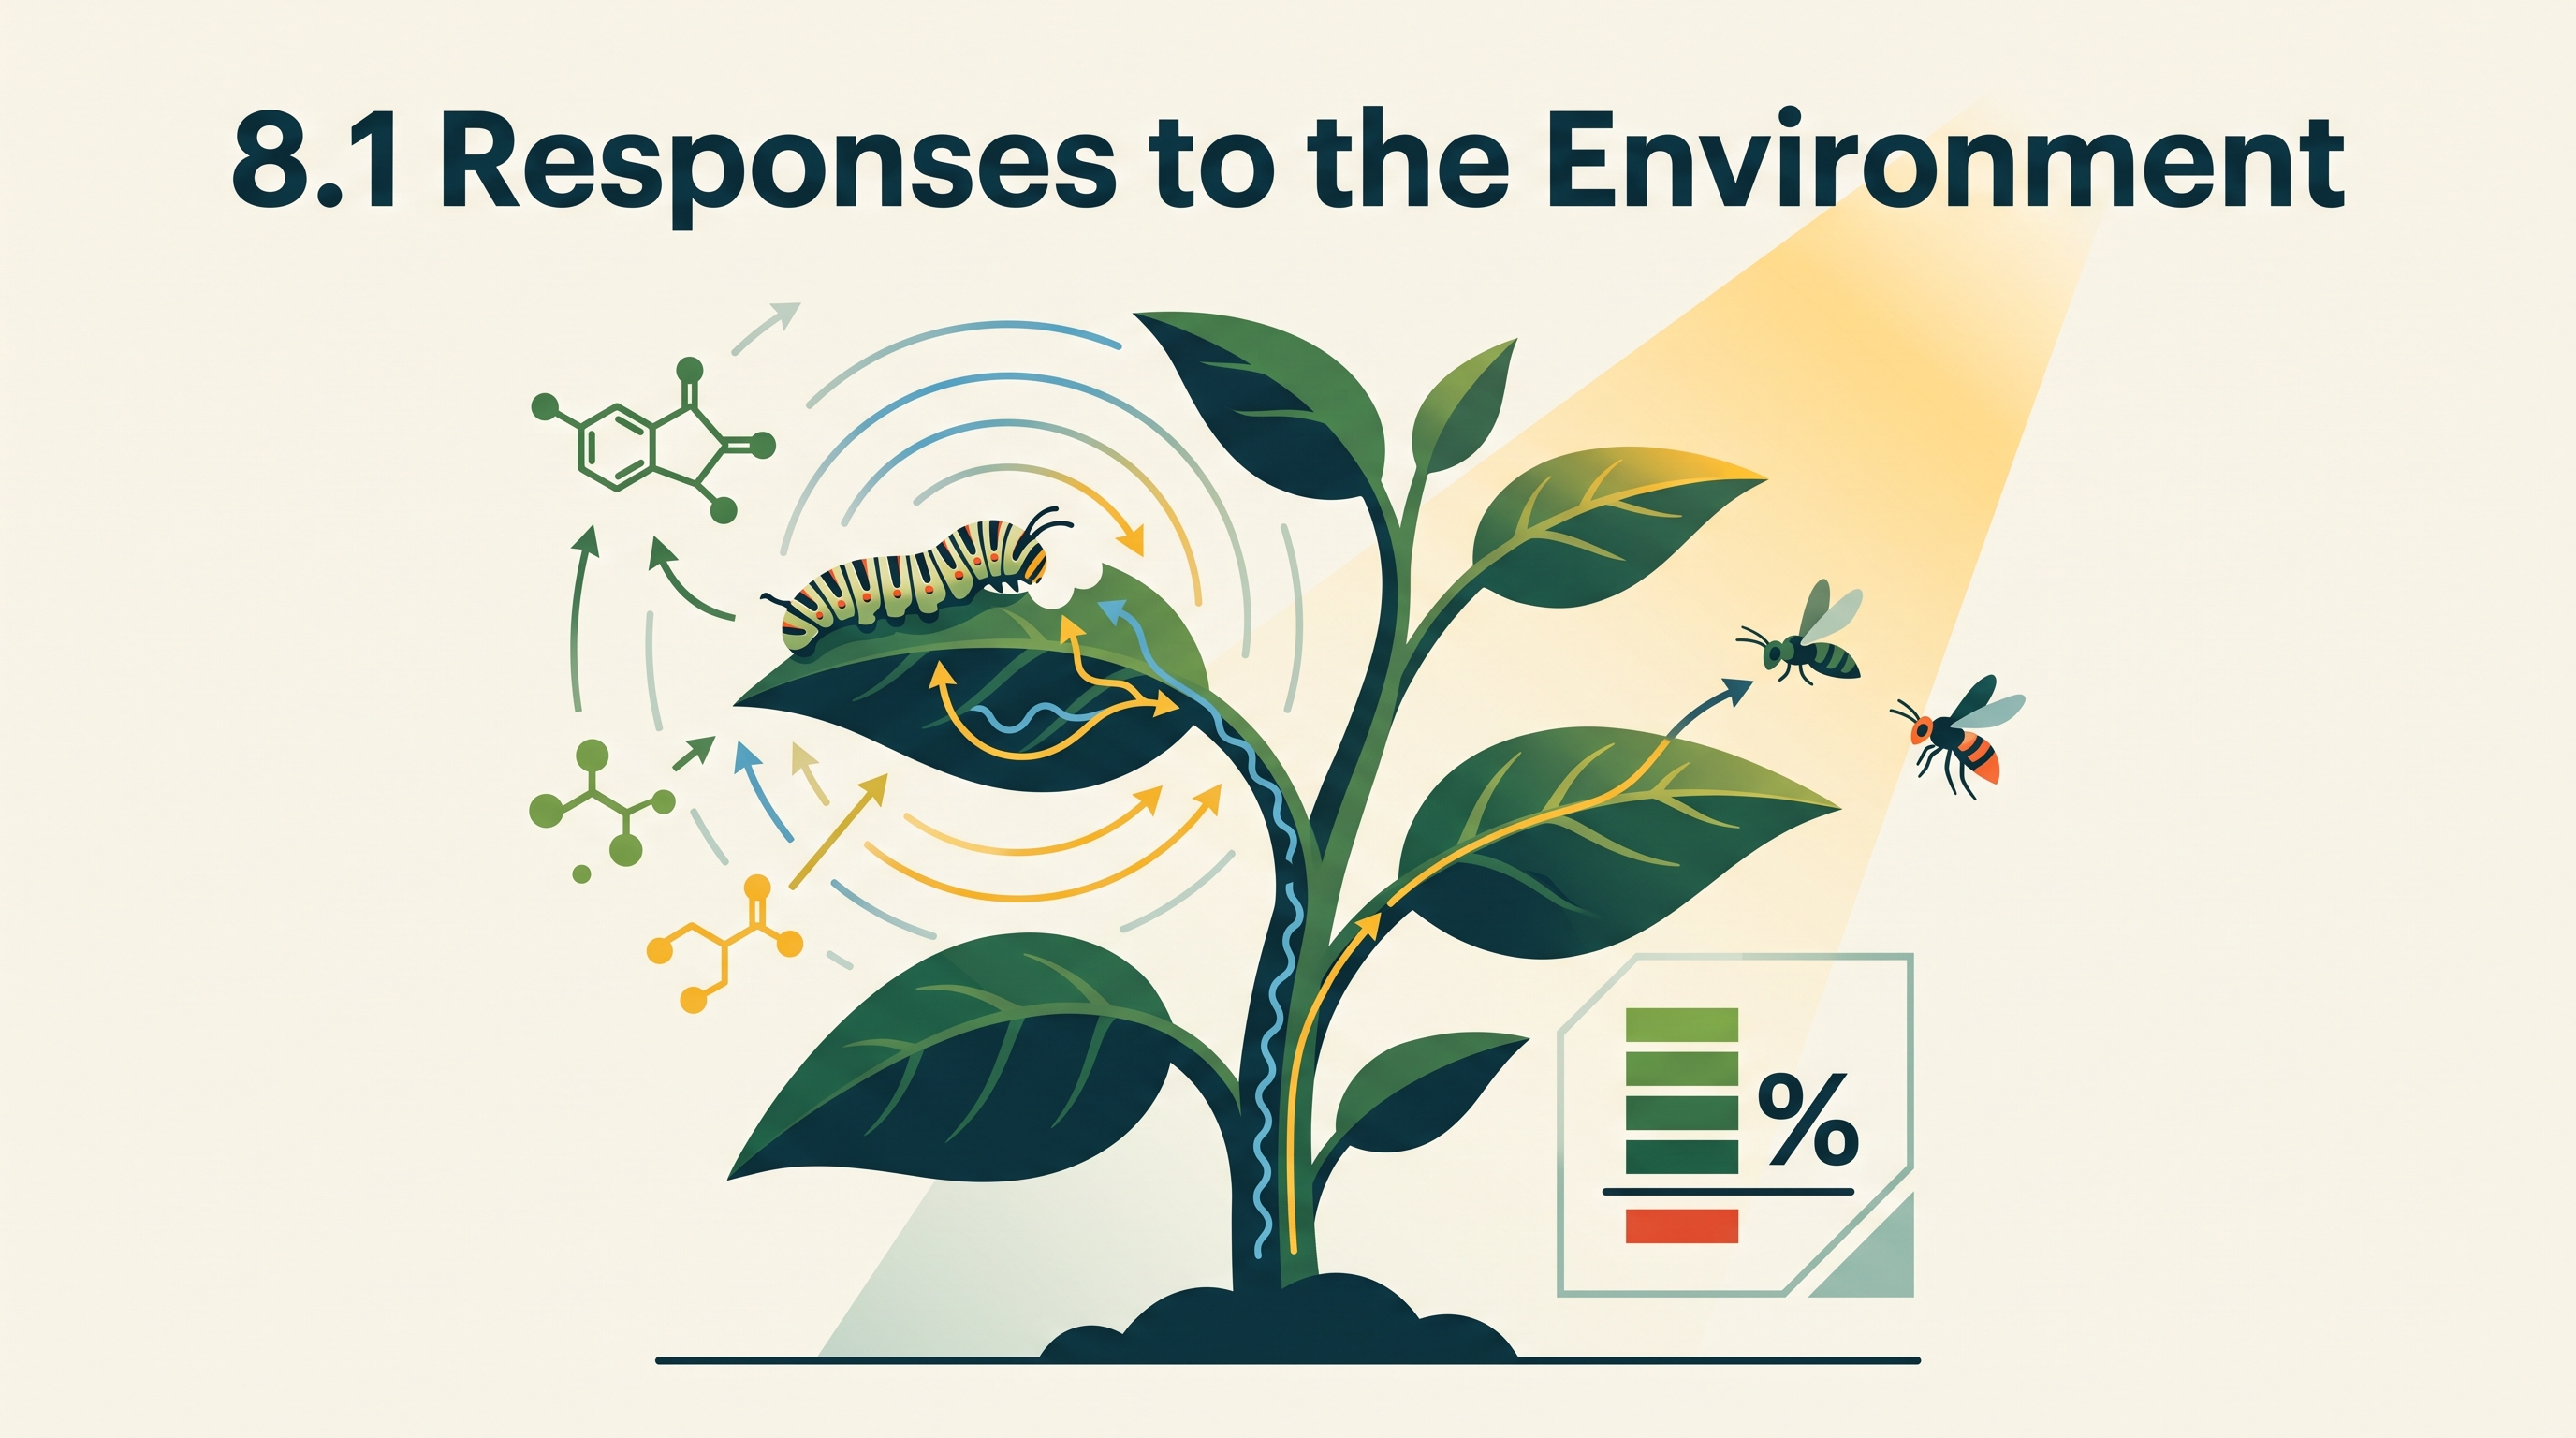

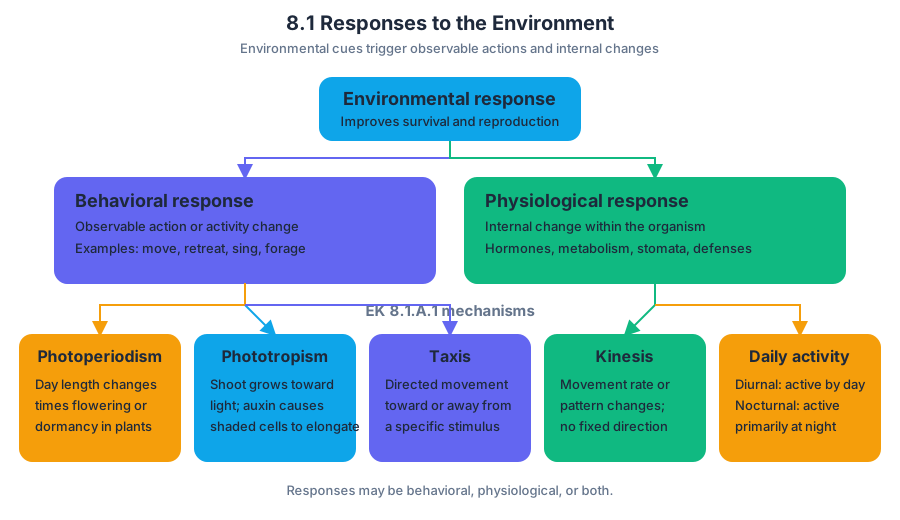
8.2 Energy Flow Through Ecosystems
Key concepts: Energy flow and matter cycling through trophic levels · Effects of energy availability on populations, communities, and ecosystems · Autotrophs as organisms that capture environmental energy · Photosynthesis and primary productivity · Chemosynthesis using small inorganic molecules · Carbon cycling through ecosystems · Nitrogen cycling through ecosystems · Phosphorus cycling through ecosystems · Decomposition and excretion as nutrient-return processes
Energy flows in one direction through an ecosystem, but matter cycles repeatedly between organisms and the nonliving environment. A leaf can capture sunlight, a caterpillar can consume the leaf’s stored chemical energy, and a bird can consume the caterpillar—but the atoms in the leaf do not disappear.
8.2 Energy Flow Through Ecosystems
Energy flows in one direction through an ecosystem, but matter cycles repeatedly between organisms and the nonliving environment. A leaf can capture sunlight, a caterpillar can consume the leaf’s stored chemical energy, and a bird can consume the caterpillar—but the atoms in the leaf do not disappear. Through waste, death, decomposition, and environmental exchange, those atoms return to forms that can be used again.
Learning Objective 8.2.B: Explain how energy flows and matter cycles through trophic levels.
Energy flow versus matter cycling
A trophic level is a feeding position in an ecosystem. Producers occupy the first trophic level; primary consumers eat producers, secondary consumers eat primary consumers, and higher-level consumers may follow. Decomposers and scavengers process organic matter from organisms at every level.
The distinction is easiest to see as two linked pathways:
Energy enters most ecosystems as sunlight, becomes chemical energy in autotrophs, and moves through consumers and decomposers. At each transfer, organisms use some energy for cellular work and release much of it as heat, so energy does not cycle back to the producer.
Matter behaves differently. Carbon, water, phosphorus, nitrogen, and other nutrients move between biotic reservoirs—living organisms—and abiotic reservoirs—soil, water, air, and sediments. These movements form biogeochemical cycles, and the cycles are interdependent: water transports dissolved nutrients, carbon is incorporated into biomass, and decomposition returns materials to the environment.
Autotrophs capture environmental energy
Autotrophs are organisms that make energy-rich organic molecules from inorganic materials by capturing energy from their surroundings. This is the focus of Learning Objective ENE-1.M: Describe the strategies organisms use to acquire and use energy.
Most familiar autotrophs are photosynthetic organisms. Plants, algae, and some bacteria capture energy from sunlight and use it to build carbohydrates from carbon dioxide and water. The rate at which producers capture and store energy as organic matter is called primary productivity. That stored chemical energy supports the consumers and decomposers connected to the producer.
Other autotrophs are chemosynthetic organisms. Instead of using light, they obtain energy by oxidizing small inorganic molecules such as hydrogen sulfide or ammonia. Because these molecules can provide energy without sunlight—and because some chemosynthetic pathways do not require oxygen—chemosynthesis can occur in oxygen-poor or dark environments, including habitats associated with deep-sea vents.
Heterotrophs transfer stored chemical energy
Heterotrophs cannot capture usable energy directly from sunlight or inorganic chemical sources. They obtain energy by consuming organic matter produced by autotrophs or by consuming organisms that previously consumed that organic matter. Carnivores, herbivores, omnivores, decomposers, and scavengers are all heterotrophs.
During metabolism, heterotrophs break down carbohydrates, lipids, and proteins. The released energy powers movement, growth, repair, reproduction, and other life processes; carbon compounds are also incorporated into the consumer’s tissues. When organisms die or release waste, decomposers make additional energy transfers while returning matter to environmental reservoirs.
Nutrients return through decomposition
Phosphorus illustrates matter cycling clearly. Plants absorb phosphate from soil or water and incorporate it into biological molecules. Animals obtain phosphorus by eating plants or other animals. When biomass decomposes or organisms excrete waste, phosphorus returns to the soil; phosphate can also reenter the environment as decaying organic matter is decomposed.
Carbon follows a connected cycle: photosynthetic autotrophs remove carbon dioxide from the environment and incorporate carbon into organic molecules; consumers acquire that carbon by feeding; cellular respiration, waste, and decomposition return carbon dioxide or other carbon-containing compounds to the environment. The carbon atoms cycle, even though the energy that powered their movement is progressively dissipated as heat.
Energy availability reshapes ecosystems
Learning Objective 8.2.C: Explain how changes in energy availability affect populations, communities, and ecosystems. A change in sunlight, producer biomass, or another energy resource can change population size and disrupt the number and size of trophic levels.
Worked example: Suppose prolonged cloud cover reduces light reaching an aquatic producer. Lower photosynthetic productivity means less chemical energy enters the ecosystem. Algal biomass may decline first; zooplankton then face less food, fish populations may decrease, and predators that depend on those fish may also decline. The initial change occurred at the producer level, but its effects propagated through the community.
The same logic applies in reverse. If producer biomass increases because light and nutrients become more available, primary consumers may increase, followed by consumers at higher trophic levels—provided habitat, predation, and other limiting factors do not prevent the response.
Misconception check
Misconception: “Energy is recycled when decomposers break down dead organisms.” Decomposers recycle matter, not energy. They use some chemical energy in dead biomass for metabolism and release much of it as heat; the atoms remain available for future biological use.
Retrieval check
A dark ecosystem contains bacteria that oxidize hydrogen sulfide, mussels that consume the bacteria, and crabs that consume the mussels. Identify the autotroph, explain why the system can function without sunlight, and predict one likely population-level effect if the hydrogen sulfide supply decreases.
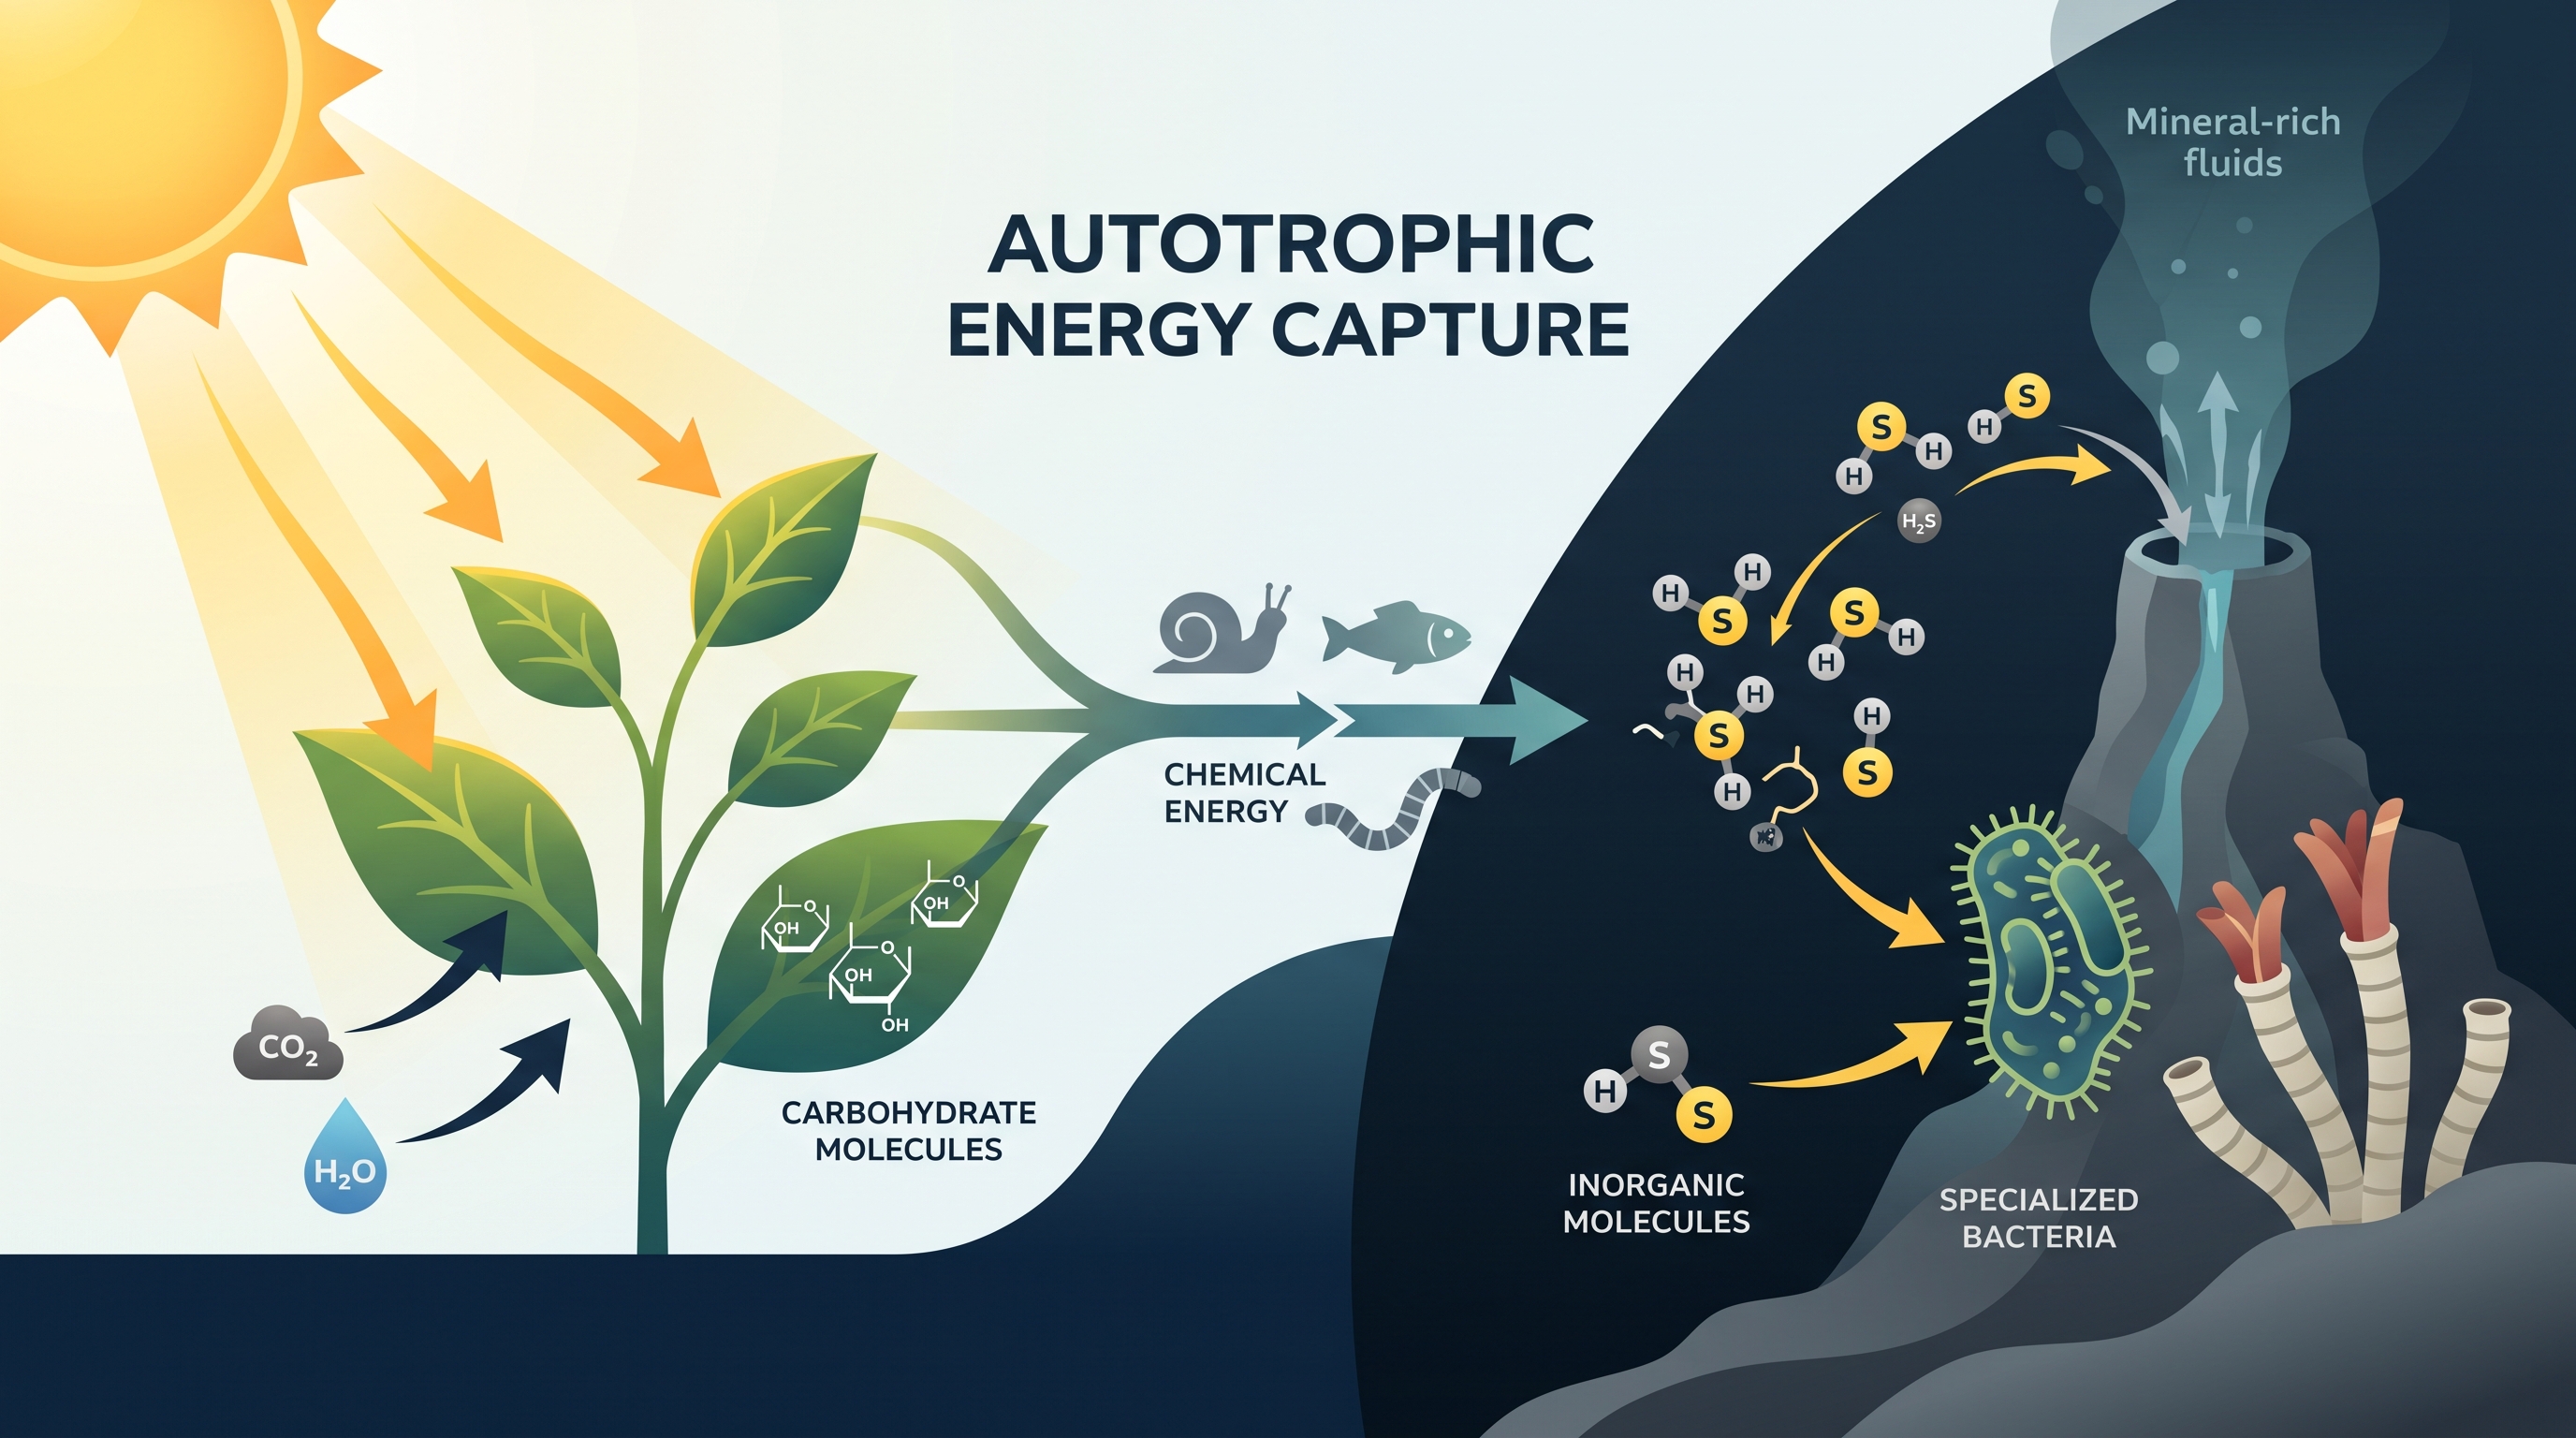
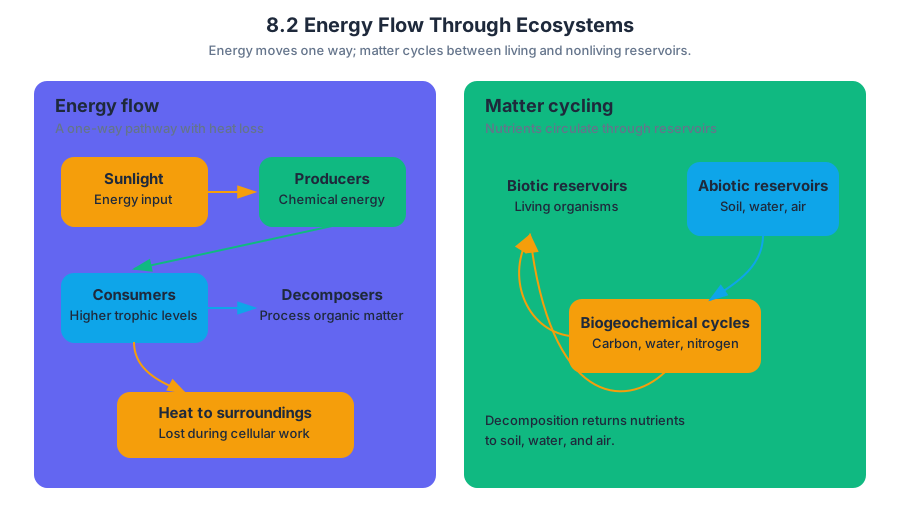
8.3 Population Ecology
A population can double rapidly, stall at a limit, or collapse when births, deaths, immigration, and emigration change the balance of individuals. Population ecology examines these changes quantitatively: not simply how many organisms exist, but how population size, density, distribution, and growth change through…
8.3 Population Ecology
A population can double rapidly, stall at a limit, or collapse when births, deaths, immigration, and emigration change the balance of individuals. Population ecology examines these changes quantitatively: not simply how many organisms exist, but how population size, density, distribution, and growth change through time.
Investigative question: What determines whether a population grows exponentially, levels off, or declines?
CED alignment: Topic 8.3 Population Ecology; Learning Objective 8.3.A; Essential Knowledge 8.3.A.1, 8.3.A.2, 8.3.A.3, and 8.3.A.4. The topic is assessed especially through Science Practice 2: Visual Representations, Science Practice 4: Representing and Describing Data, Science Practice 5: Statistical Tests and Data Analysis, and Science Practice 6: Argumentation.
Population size is a balance, not a single rate
Population size is the number of individuals in a population. Its change depends on four demographic processes:
$$\Delta N = (B + I) - (D + E)$$
where $N$ is population size, $B$ is births, $I$ is immigration, $D$ is deaths, and $E$ is emigration. Births and immigration add individuals; deaths and emigration remove them.
Two populations may contain the same number of organisms but have very different ecological conditions. Population density is the number of individuals per unit of area or volume:
$$\text{Population density}=\frac{\text{number of individuals}}{\text{area or volume}}$$
A population of $200$ plants spread across $100\ \text{m}^2$ has a density of $2\ \text{plants}\cdot\text{m}^{-2}$. If the same $200$ plants occupy $20\ \text{m}^2$, density is $10\ \text{plants}\cdot\text{m}^{-2}$.
Population dispersion describes how individuals are arranged in space. A clumped pattern may occur when resources are patchy or when organisms live socially. Uniform spacing can result from territorial behavior or competition. Random spacing occurs when individuals neither strongly attract nor repel one another. Dispersion is different from density: density asks how many; dispersion asks how arranged.
Exponential growth: the J-shaped model
When resources are effectively unlimited, a population can grow at a rate proportional to its current size. This is exponential growth, represented by a J-shaped curve:
$$\frac{dN}{dt}=rN$$
Here, $r$ is the per-capita rate of increase and $N$ is population size. The larger the population becomes, the more individuals are available to reproduce, so the absolute increase becomes faster.
Worked example: Suppose a bacterial population begins with $100$ cells and doubles every hour. After one hour it has $200$ cells; after two hours, $400$; after three hours, $800. The increase is not a constant number of cells per hour—the population adds $100$, then $200$, then $400$. That accelerating pattern is the signature of exponential growth.
Exponential growth is most plausible for a population entering a new environment with abundant resources, few predators, and little competition. It cannot continue indefinitely because every real environment imposes limits.
Logistic growth: the S-shaped model
Logistic growth incorporates environmental limits. The population initially grows almost exponentially, but growth slows as the population approaches the environment’s carrying capacity, $K$—the largest population size that the environment can sustain over time.
$$\frac{dN}{dt}=rN\left(\frac{K-N}{K}\right)$$
When $N$ is far below $K$, the factor $\frac{K-N}{K}$ is relatively large and growth is rapid. As $N$ approaches $K$, that factor approaches zero, so net growth slows and the curve levels into an S shape.
At carrying capacity, individuals are still being born and dying. Carrying capacity does not mean that reproduction stops; it means that, on average, births plus immigration balance deaths plus emigration. Because environmental conditions fluctuate, $K$ is usually a dynamic estimate rather than a permanent, perfectly fixed number.
Misconception check: “A population at $K$ never changes”
This is the carrying-capacity equilibrium misconception. A population near $K$ may rise above it, fall below it, or fluctuate around it. Drought, disease, seasonal food availability, and changes in predation can all shift the population and may also change the value of $K$ itself.
A second common error is treating $r$ as the number of new individuals. It is a per-capita rate: the average contribution of each individual to population increase. A population with a modest $r$ can still add many organisms if $N$ is large.
AP reasoning in population models
For a graph, first identify the axes and determine whether the curve is J-shaped or S-shaped. Then connect the pattern to mechanism: accelerating growth suggests abundant resources and exponential growth; leveling suggests limiting factors and carrying capacity. Under Science Practice 4: Representing and Describing Data, describe the trend before explaining it. Under Science Practice 6: Argumentation, support the explanation with a specific feature of the graph, such as a declining slope near $K$.
Retrieval check: A fish population contains $500$ individuals in a lake covering $250\ \text{ha}$. Its density is $2\ \text{fish}\cdot\text{ha}^{-1}$. If births and immigration total $90$ fish while deaths and emigration total $120$, then $\Delta N=-30$: the population declines to $470$ fish, assuming no other changes. Is that decline caused by density alone? No—the demographic balance shows what happened; identifying the environmental cause requires additional evidence.
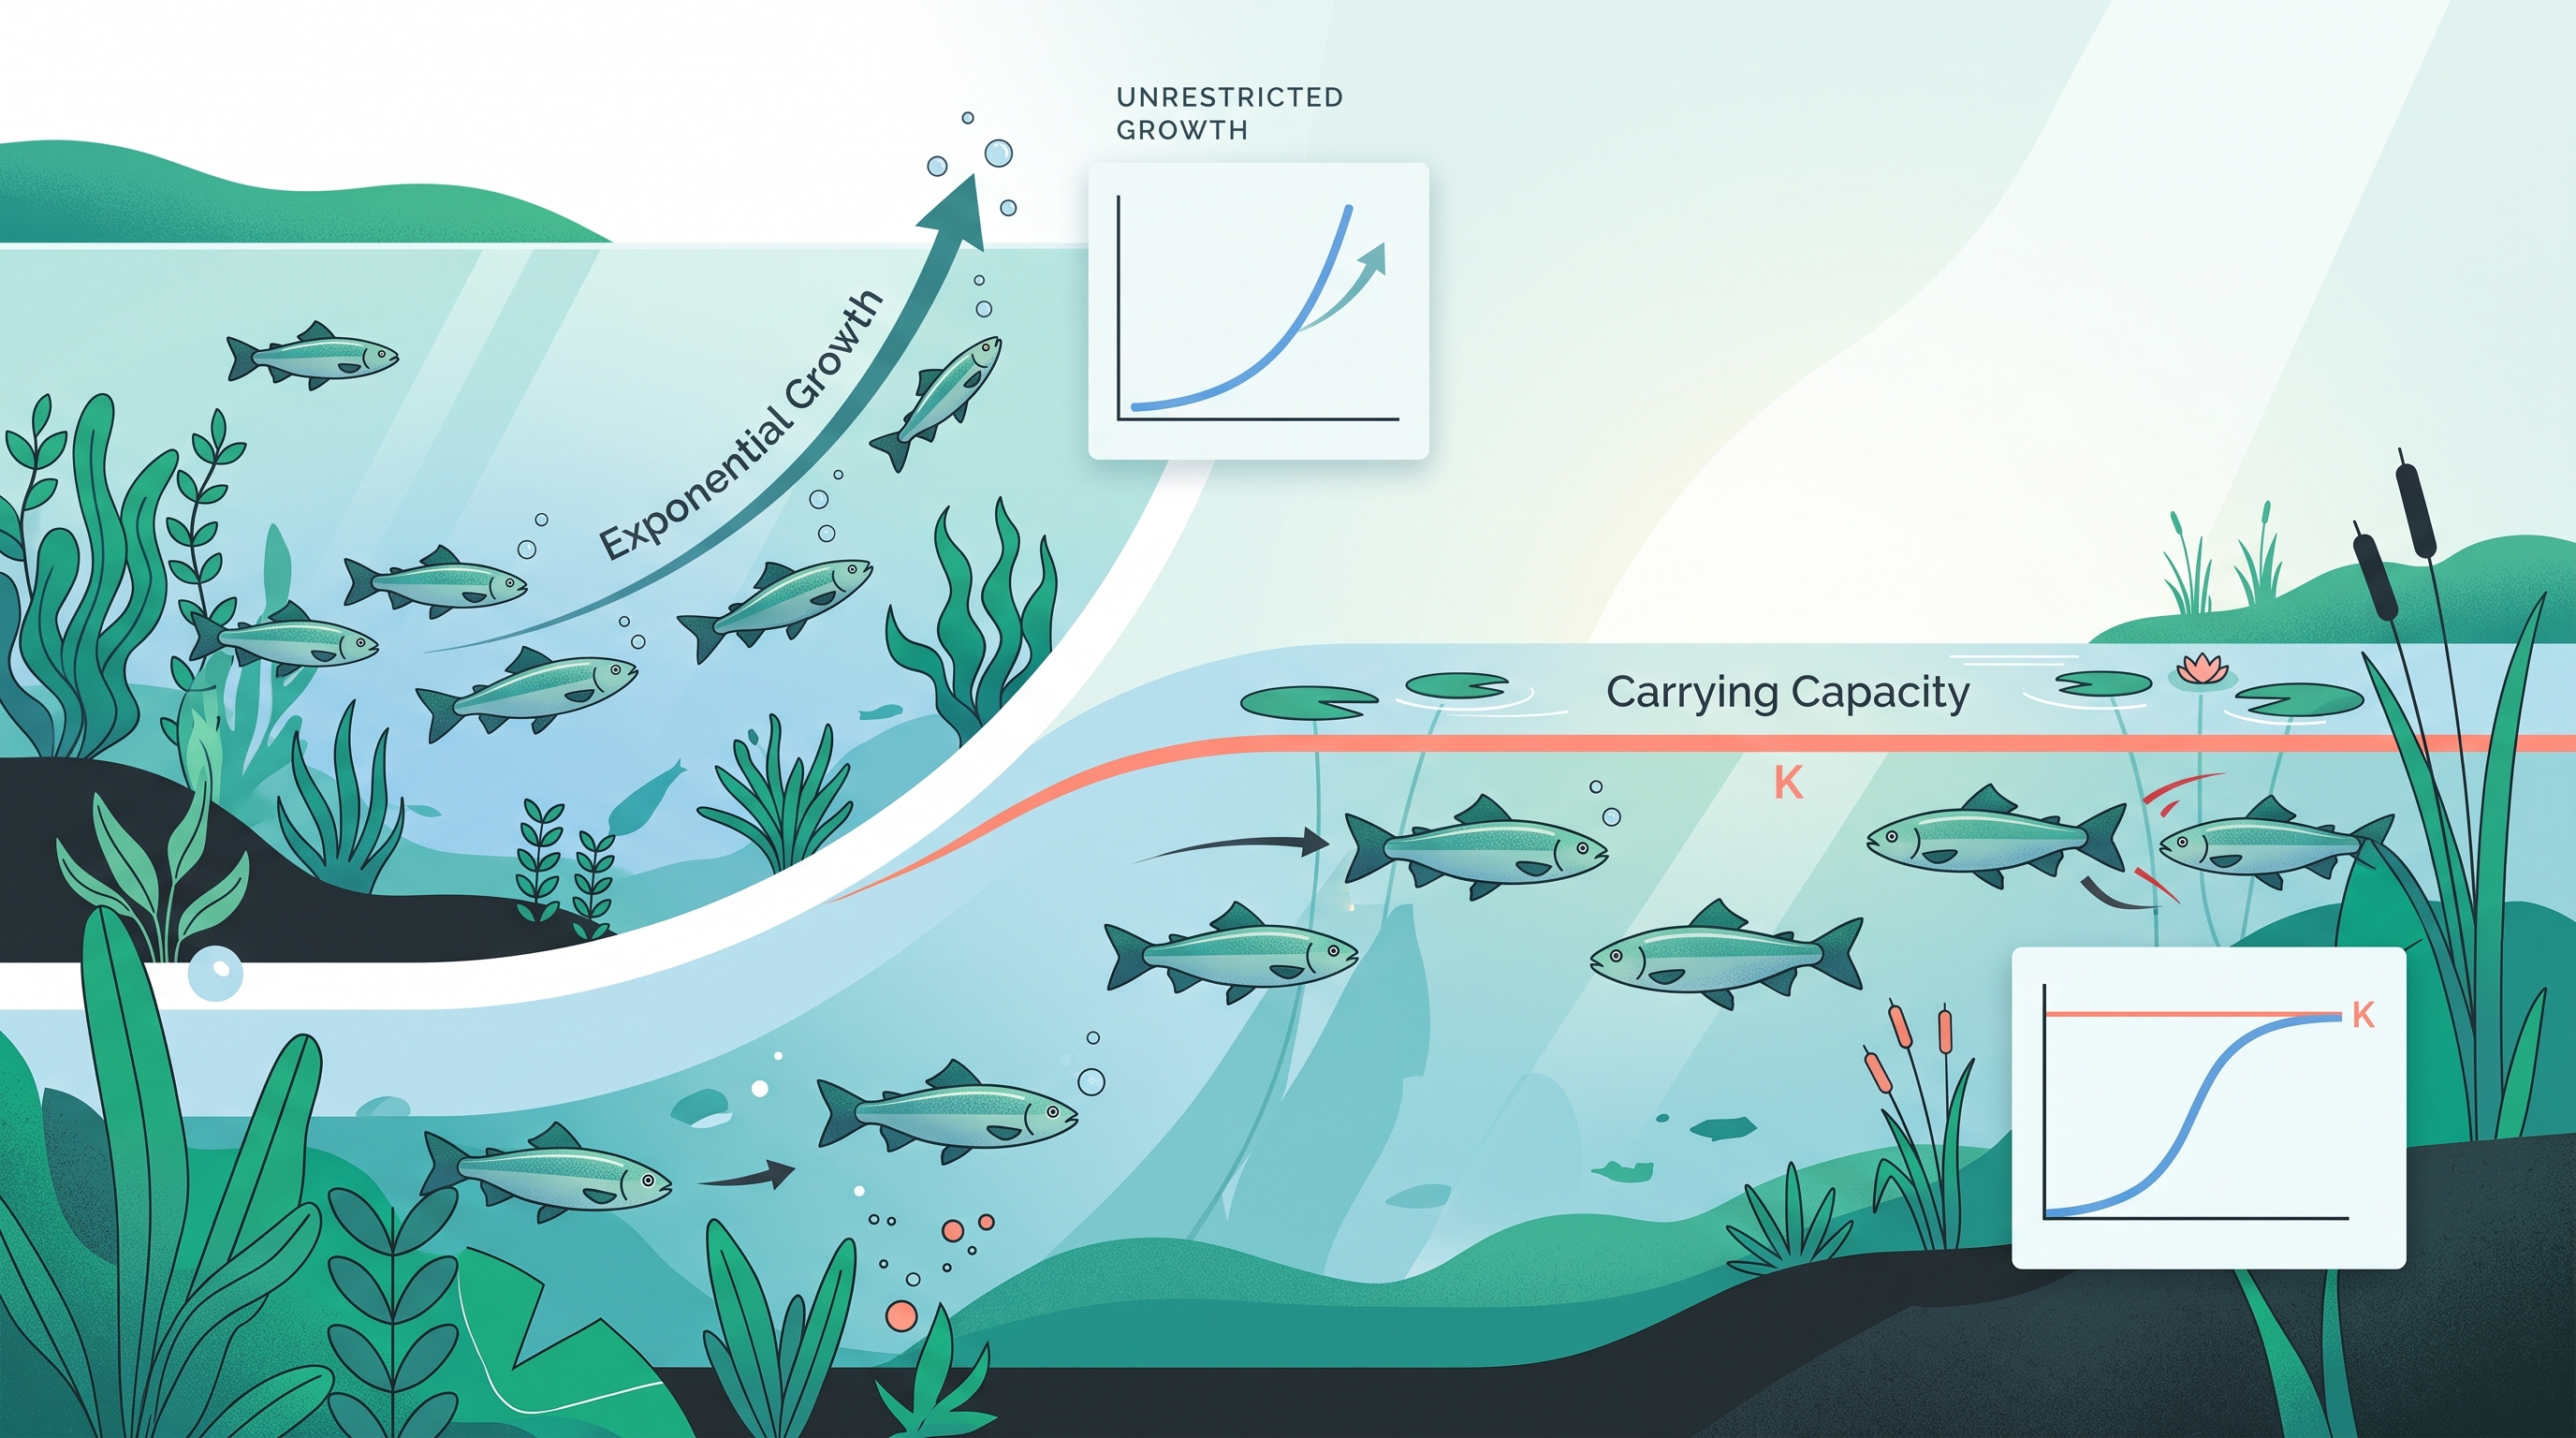
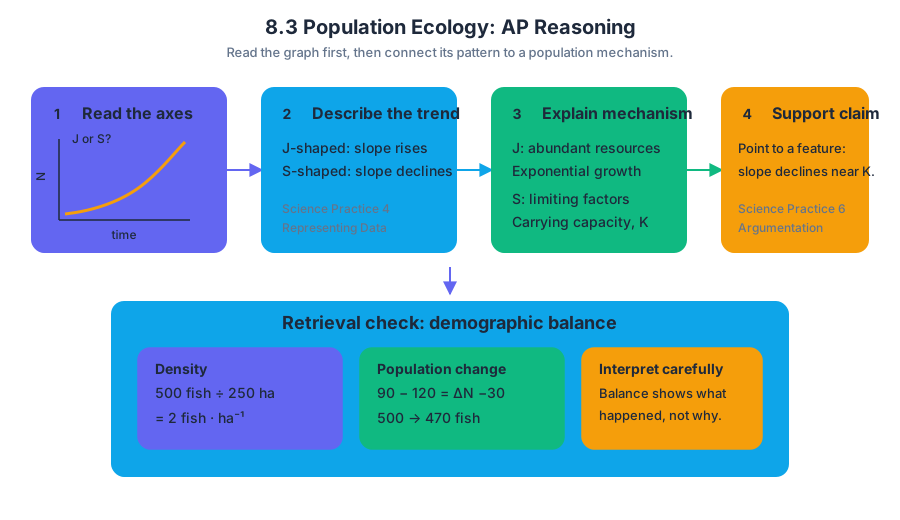
8.4 Effect of Density on Populations
Key concepts: Carrying capacity (K)
A population can grow rapidly when resources are abundant, but competition intensifies as more individuals occupy the same space. Population density is the number of individuals of a species per unit of area or volume; its effects are central to understanding why populations often stop growing rather than expanding…
8.4 Effect of Density on Populations
A population can grow rapidly when resources are abundant, but competition intensifies as more individuals occupy the same space. Population density is the number of individuals of a species per unit of area or volume; its effects are central to understanding why populations often stop growing rather than expanding forever.
Carrying capacity, represented by $K$, is the largest population size that an environment can sustain over time under its current conditions.
The value of $K$ is not a permanent species trait. It depends on available food, water, shelter, nesting sites, nutrients, disease pressure, predators, and other environmental conditions. If a drought reduces plant growth, the carrying capacity for herbivores may fall. If rainfall returns, $K$ may rise again.
Density-dependent effects
A density-dependent factor has an effect that becomes stronger as population density increases. These factors are often caused by interactions among members of the same species or between organisms in the same community. When individuals are crowded together, each individual has fewer resources available and is more likely to encounter competitors, parasites, or pathogens.
Common density-dependent factors include:
- Competition: Individuals require the same limited food, water, space, light, or mates.
- Predation: A dense prey population may be easier for predators to locate.
- Disease: Pathogens spread more efficiently when infected and uninfected individuals are frequently close together.
- Territoriality: Limited nesting or breeding sites may prevent additional individuals from reproducing.
- Accumulation of waste: Waste products can become harmful when many organisms occupy a small area.
These effects produce negative density dependence: as density rises, the per-capita growth rate generally falls. At low density, individuals may reproduce successfully because resources are plentiful. Near $K$, births and deaths tend to balance, so the population size fluctuates around $K$ rather than increasing indefinitely.
Density-independent effects
A density-independent factor affects populations regardless of how crowded they are. Severe storms, wildfires, floods, freezes, droughts, volcanic eruptions, and other abiotic events can reduce a population at low, intermediate, or high density.
Density independence does not mean that every individual is affected equally. A flood may kill organisms in low-lying areas while sparing others at higher elevations. The key distinction is that the strength of the event is not primarily determined by how many individuals were already present.
The same event can also have both types of effects. A drought is density independent if it reduces water availability across a habitat. However, the competition for the remaining water becomes density dependent because crowded populations experience stronger resource limitation.
Worked example: estimating the effect of crowding
Suppose researchers place the same plant species into identical containers. One group contains $5$ plants per container, and another contains $20$ plants per container. After four weeks, the researchers measure average plant mass and record the number of fungal infections.
| Treatment | Plant density | Mean mass per plant | Infected plants |
|---|---|---|---|
| Low density | $5$ plants/container | $18\ \mathrm{g}$ | $1$ of $20$ |
| High density | $20$ plants/container | $9\ \mathrm{g}$ | $9$ of $20$ |
The high-density plants have lower mean mass, consistent with stronger competition for light, water, or nutrients. They also show more fungal infection, consistent with easier pathogen transmission. To decide whether these differences are unlikely to be caused by random variation, researchers could apply Science Practice 5: Statistical Tests and Data Analysis, using an appropriate statistical test and reporting the associated probability or confidence measure.
A strong conclusion would not claim that density caused every difference automatically. It would identify the manipulated variable, compare the treatment means, consider variation and sample size, and explain whether the statistical evidence supports a density effect. Replicated containers and controlled environmental conditions strengthen the inference.
Carrying capacity in a changing environment
In a logistic-growth model, population growth slows as population size approaches $K$. A compact representation is:
$$ \frac{dN}{dt}=rN\left(\frac{K-N}{K}\right) $$
where $N$ is population size and $r$ is the intrinsic rate of increase. When $N$ is much smaller than $K$, the factor $\frac{K-N}{K}$ is close to $1$, so growth is relatively rapid. When $N$ approaches $K$, that factor approaches $0$, and net growth slows.
Named misconception — “$K$ is the maximum number of organisms that can ever exist.” Not quite. Carrying capacity is an ecological estimate under particular conditions, not an unbreakable ceiling. A population can temporarily exceed $K$, producing overshoot, followed by resource depletion and a decline. Conversely, habitat restoration can increase $K$.
Retrieval check: A rabbit population rises after predators are removed, then levels off near a stable average. Which concept best explains the leveling: density-independent control, density-dependent limitation, or mutation? Explain what happens to resource availability and per-capita growth as the population approaches $K$.
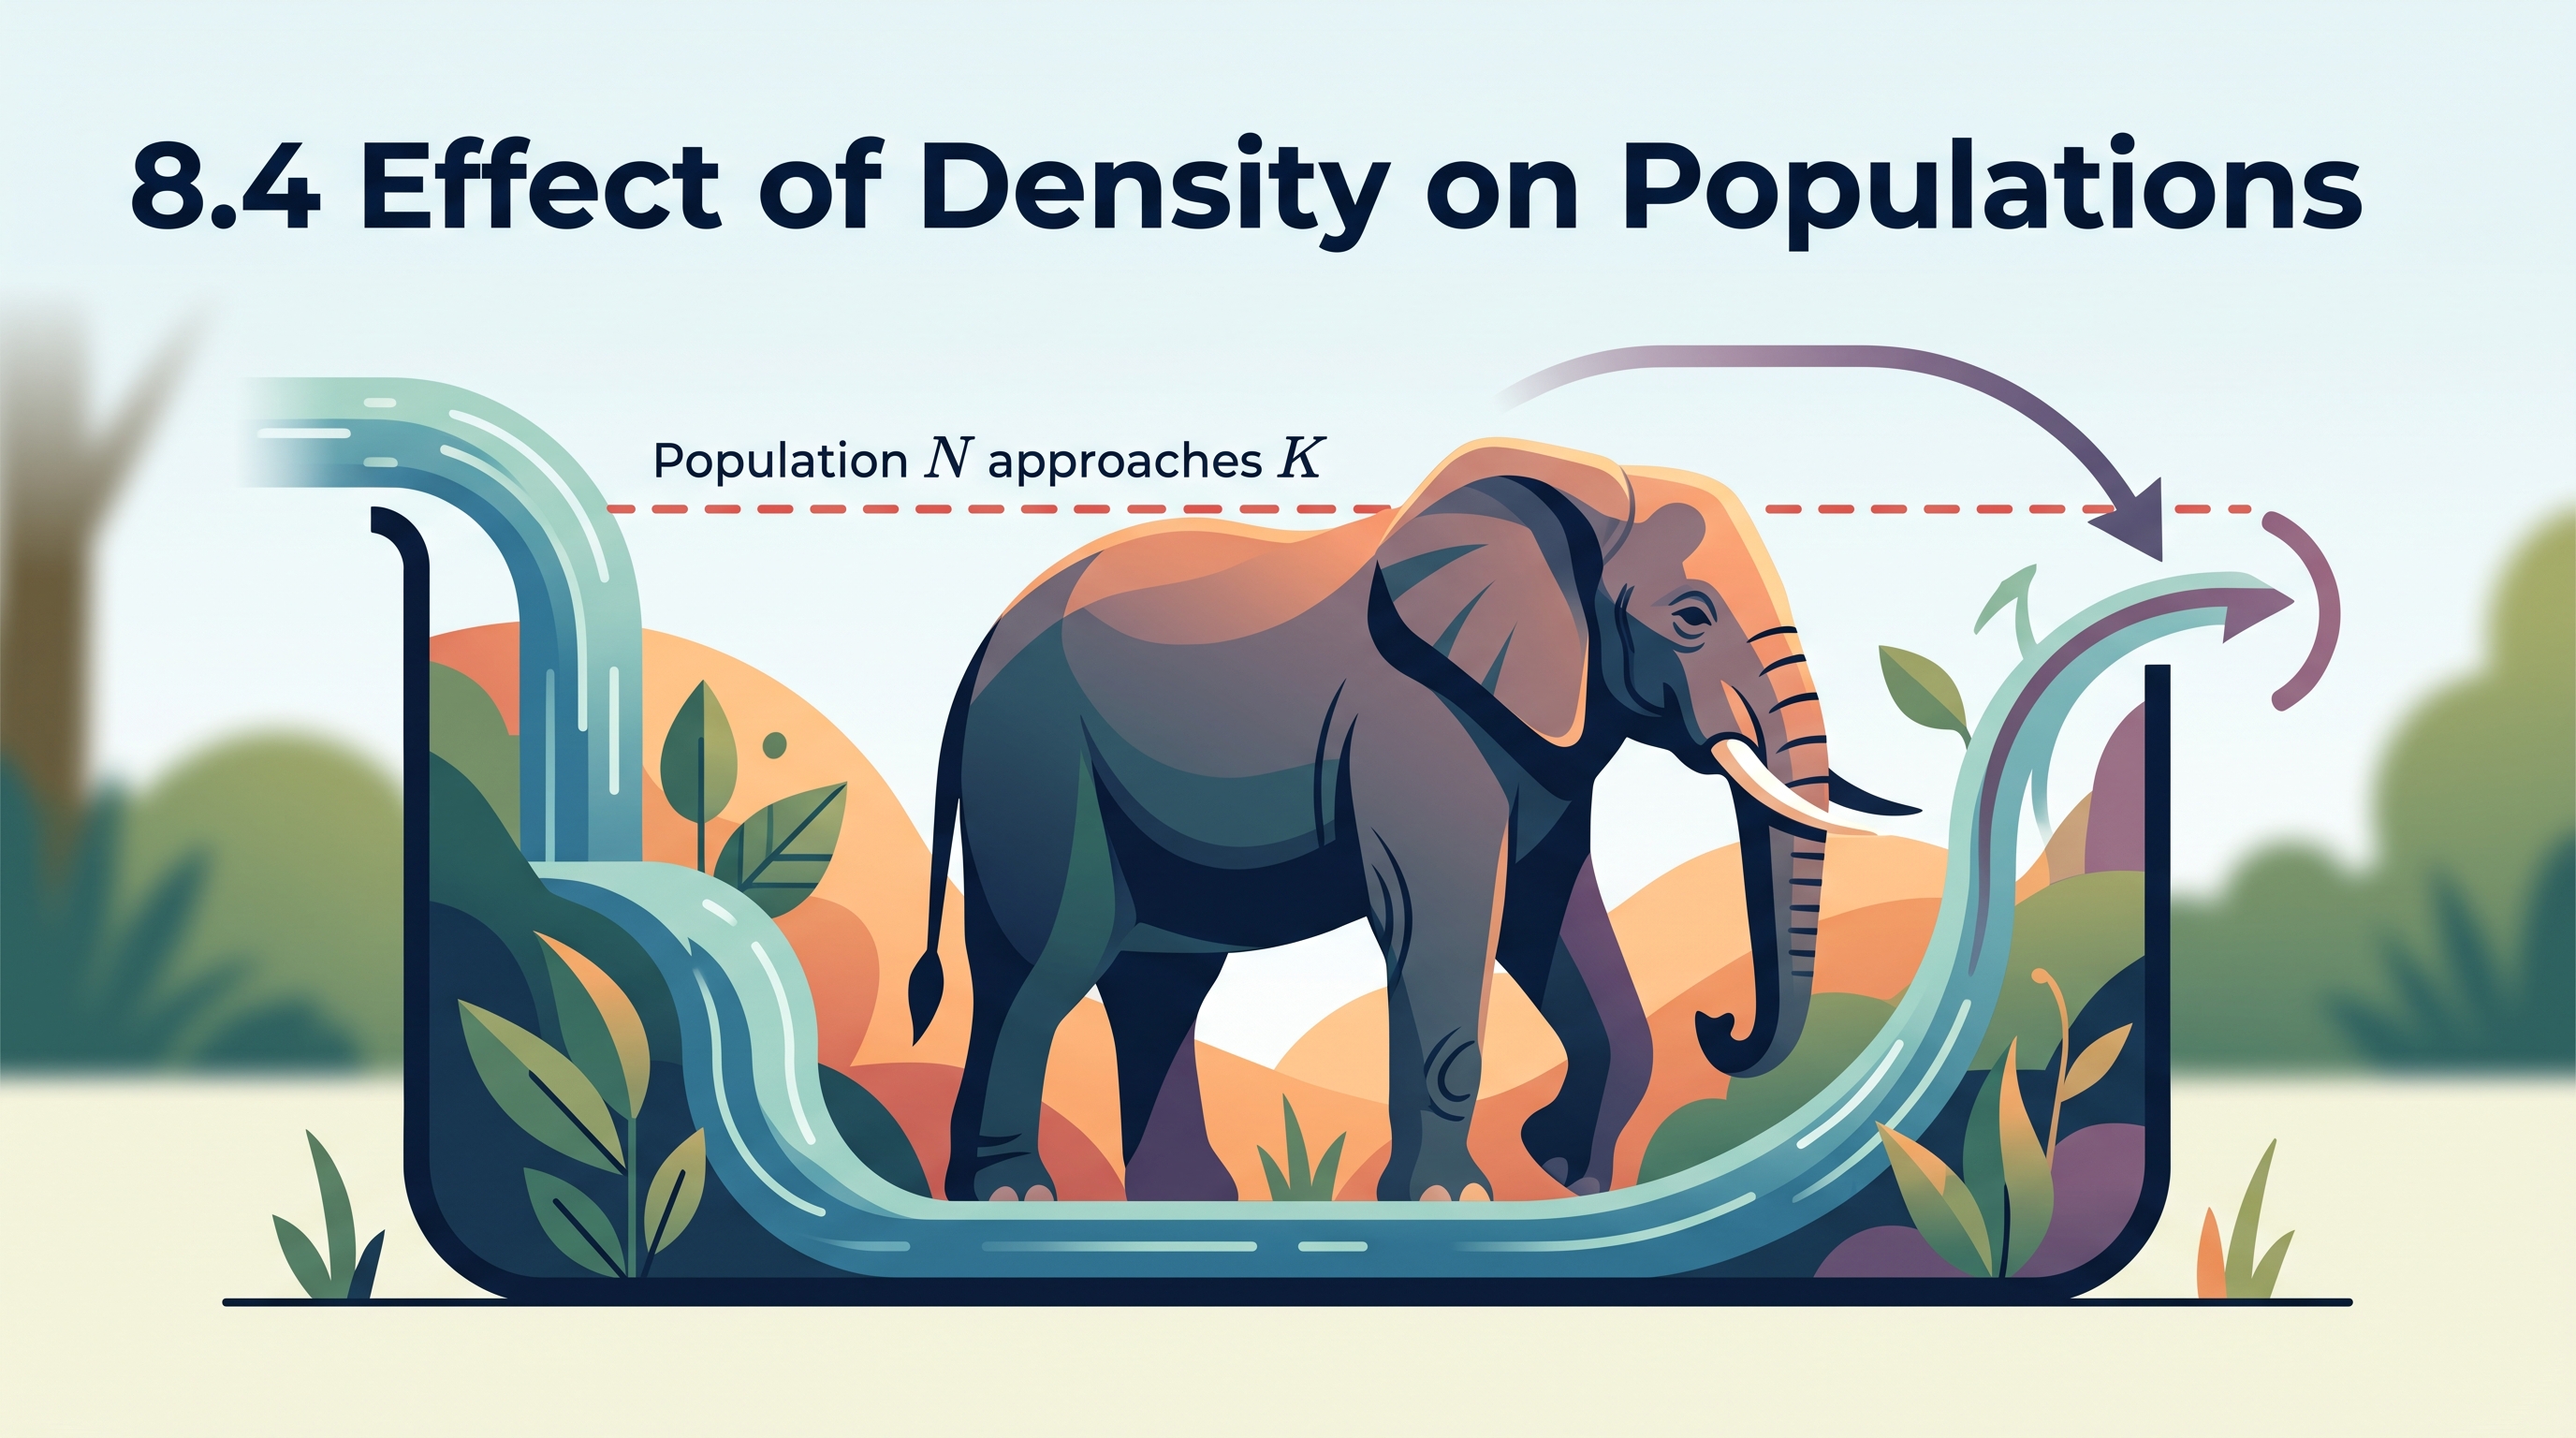
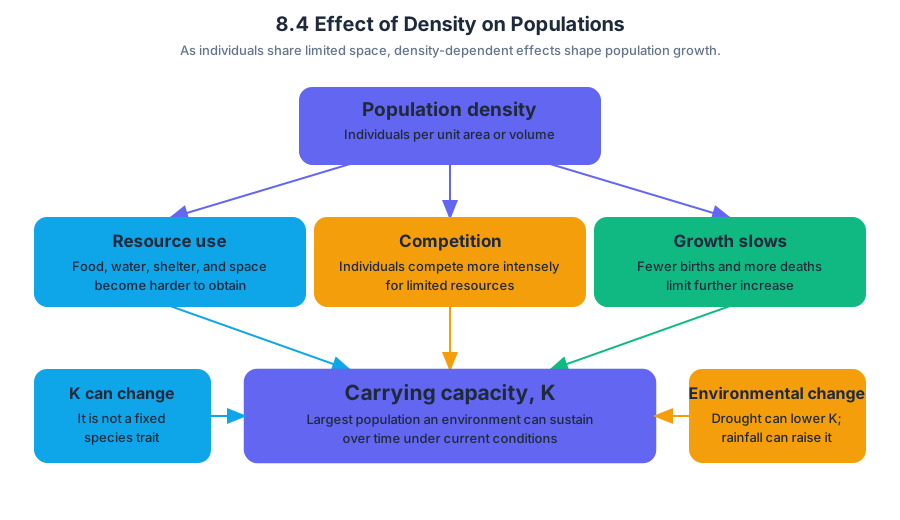
8.5 Community Ecology
Key concepts: Community structure · Competition · Predation · Symbioses · Positive and negative interactions between populations · Extinctions · Biomagnification · Eutrophication · Defense against herbivores · Trichome production in Brassica rapa
A community is shaped not only by which species live in the same place, but by what those populations do to one another. A plant competing for light, a spider capturing an insect, and a fungus living inside a root all change the abundance, distribution, and persistence of other populations.
8.5 Community Ecology
A community is shaped not only by which species live in the same place, but by what those populations do to one another. A plant competing for light, a spider capturing an insect, and a fungus living inside a root all change the abundance, distribution, and persistence of other populations. Community ecology examines these interactions and how they organize biological communities.
CED alignment: Learning Objective 8.5.B — Explain how interactions within and among populations influence community structure. Essential Knowledge 8.5.B.4 — Competition, predation, and symbioses, including parasitism, mutualism, and commensalism, can drive population dynamics.
Interaction signs: who benefits, who loses?
An interaction can be modeled by recording its effect on each population. A positive effect is represented by $+$, a negative effect by $-$, and no measurable effect by $0$. These signs describe the outcome for the populations, not whether the interaction is morally “good” or “bad.”
| Interaction | Effect on population 1 | Effect on population 2 | Example |
|---|---|---|---|
| Competition | $-$ | $-$ | Two plant species using the same limited soil nitrogen |
| Predation or herbivory | $+$ | $-$ | A hawk consumes a mouse; a caterpillar consumes a leaf |
| Parasitism | $+$ | $-$ | A tapeworm obtains nutrients from a host |
| Mutualism | $+$ | $+$ | A pollinator obtains food while transferring pollen |
| Commensalism | $+$ | $0$ | One population gains while the other is not detectably affected |
The same pair of species may show different interaction strengths under different conditions. For example, a plant and a fungus may have a mutualistic relationship when the fungus improves mineral uptake, but the relationship can become less beneficial if environmental conditions change the costs and benefits for either population.
Competition and niche partitioning
Competition occurs when populations use the same limited resource. Because both competitors expend energy and obtain fewer resources, the direct effect is usually $-/-$. Competition can reduce growth, survival, or reproduction and therefore alter which species are common in a community.
Niche partitioning reduces competition when populations use resources differently. Two bird species might feed in different parts of the same tree, or two plants might absorb nutrients at different soil depths. They still occupy the same community, but their resource use overlaps less, allowing both populations to persist.
Competition can also produce an indirect community effect. If one plant species grows taller and blocks light, a shorter plant may decline even though the taller species does not consume it. The interaction is still competition because both populations depend on a limited resource: light.
Predation, herbivory, and trophic cascades
Predation is an interaction in which one population captures and consumes another. The predator gains energy, while the prey loses individuals. Predation therefore changes population size directly and can change community structure indirectly by altering the abundance of organisms at other trophic levels.
A trophic cascade occurs when an effect moves through several feeding levels. If predators reduce herbivore abundance, plants may experience less grazing and increase. Removing the predator can reverse the pattern: herbivores increase, plant biomass decreases, and the community changes even though the predator never consumes plants directly.
Symbioses
Symbiosis is a close biological relationship between different species. The major forms required here are parasitism, mutualism, and commensalism. These relationships influence population dynamics by changing access to nutrients, protection, reproductive opportunities, or habitat.
- Parasitism is $+/-$: the parasite benefits while the host is harmed, although the host is not necessarily killed immediately.
- Mutualism is
$+/$+$: both populations benefit, as when one species provides food and the other provides transport, protection, or another service. - Commensalism is
$+/$0$: one population benefits while the other experiences no detectable effect.
The cost of plant defense
Plants cannot flee from herbivores, so they may defend themselves with structures or chemicals that make feeding more difficult. Trichomes—hair-like structures on plant surfaces—can discourage herbivores, but producing them requires materials and energy that could otherwise support growth, reproduction, or competition for light.
The experimental study of trichome production in Brassica rapa illustrates this trade-off. A plant that produces more trichomes may suffer less herbivory, yet defense is not free: resources invested in defense can reduce the plant’s ability to grow or compete. The correct conclusion is not “defense always lowers fitness,” but rather that defense can improve survival under herbivory while carrying a growth or resource-allocation cost when herbivory is weak.
Misconception check: A defense trait is not automatically beneficial in every environment. Natural selection favors the balance of benefits and costs under particular conditions.
Interactions, extinctions, and ecosystem change
Ecological interactions can contribute to extinction, the permanent loss of a population or species. A population may decline when competition prevents access to resources, predation becomes unusually intense, a mutualistic partner disappears, or parasites and pathogens spread through a small population. Interactions can therefore amplify an environmental disturbance rather than merely respond to it.
Biomagnification is the increasing concentration of a persistent pollutant in organisms at progressively higher trophic levels. A contaminant present at low concentration in water may accumulate in prey, become more concentrated in predators, and reach harmful levels in top consumers. Reproductive failure or death in those populations can contribute to population collapse and extinction.
Eutrophication is nutrient enrichment of an aquatic ecosystem, often involving excess nitrogen or phosphorus. Rapid algal growth can block light; decomposition of the algae consumes dissolved oxygen; and oxygen depletion can kill fish, invertebrates, and other aquatic organisms. If these changes persist, the resulting loss of populations can contribute to extinctions.
AP reasoning in this topic
Community-ecology problems commonly assess Science Practice 1: Concept Explanation when you explain how an interaction changes population size; Science Practice 2: Visual Representations when you interpret or construct a $+/-$ interaction model or trophic cascade; Science Practice 3: Questions and Methods when you identify a testable defense-cost hypothesis; Science Practice 4: Representing and Describing Data when you graph herbivory, trichome production, or dissolved oxygen; Science Practice 5: Statistical Tests and Data Analysis when you decide whether treatment differences support a claim; and Science Practice 6: Argumentation when you connect evidence to a conclusion about community change or extinction.
Retrieval check: A lake receives excess phosphorus, algae increase, decomposition accelerates, and dissolved oxygen falls. Identify the ecological process, predict the effect on fish, and classify the fish–algae relationship only if the evidence supports a direct interaction. The process is eutrophication; fish populations are expected to decline under oxygen depletion. Do not automatically label the fish–algae relationship as predation or competition—the evidence given supports an indirect ecosystem effect, not a direct $+/-$ interaction.
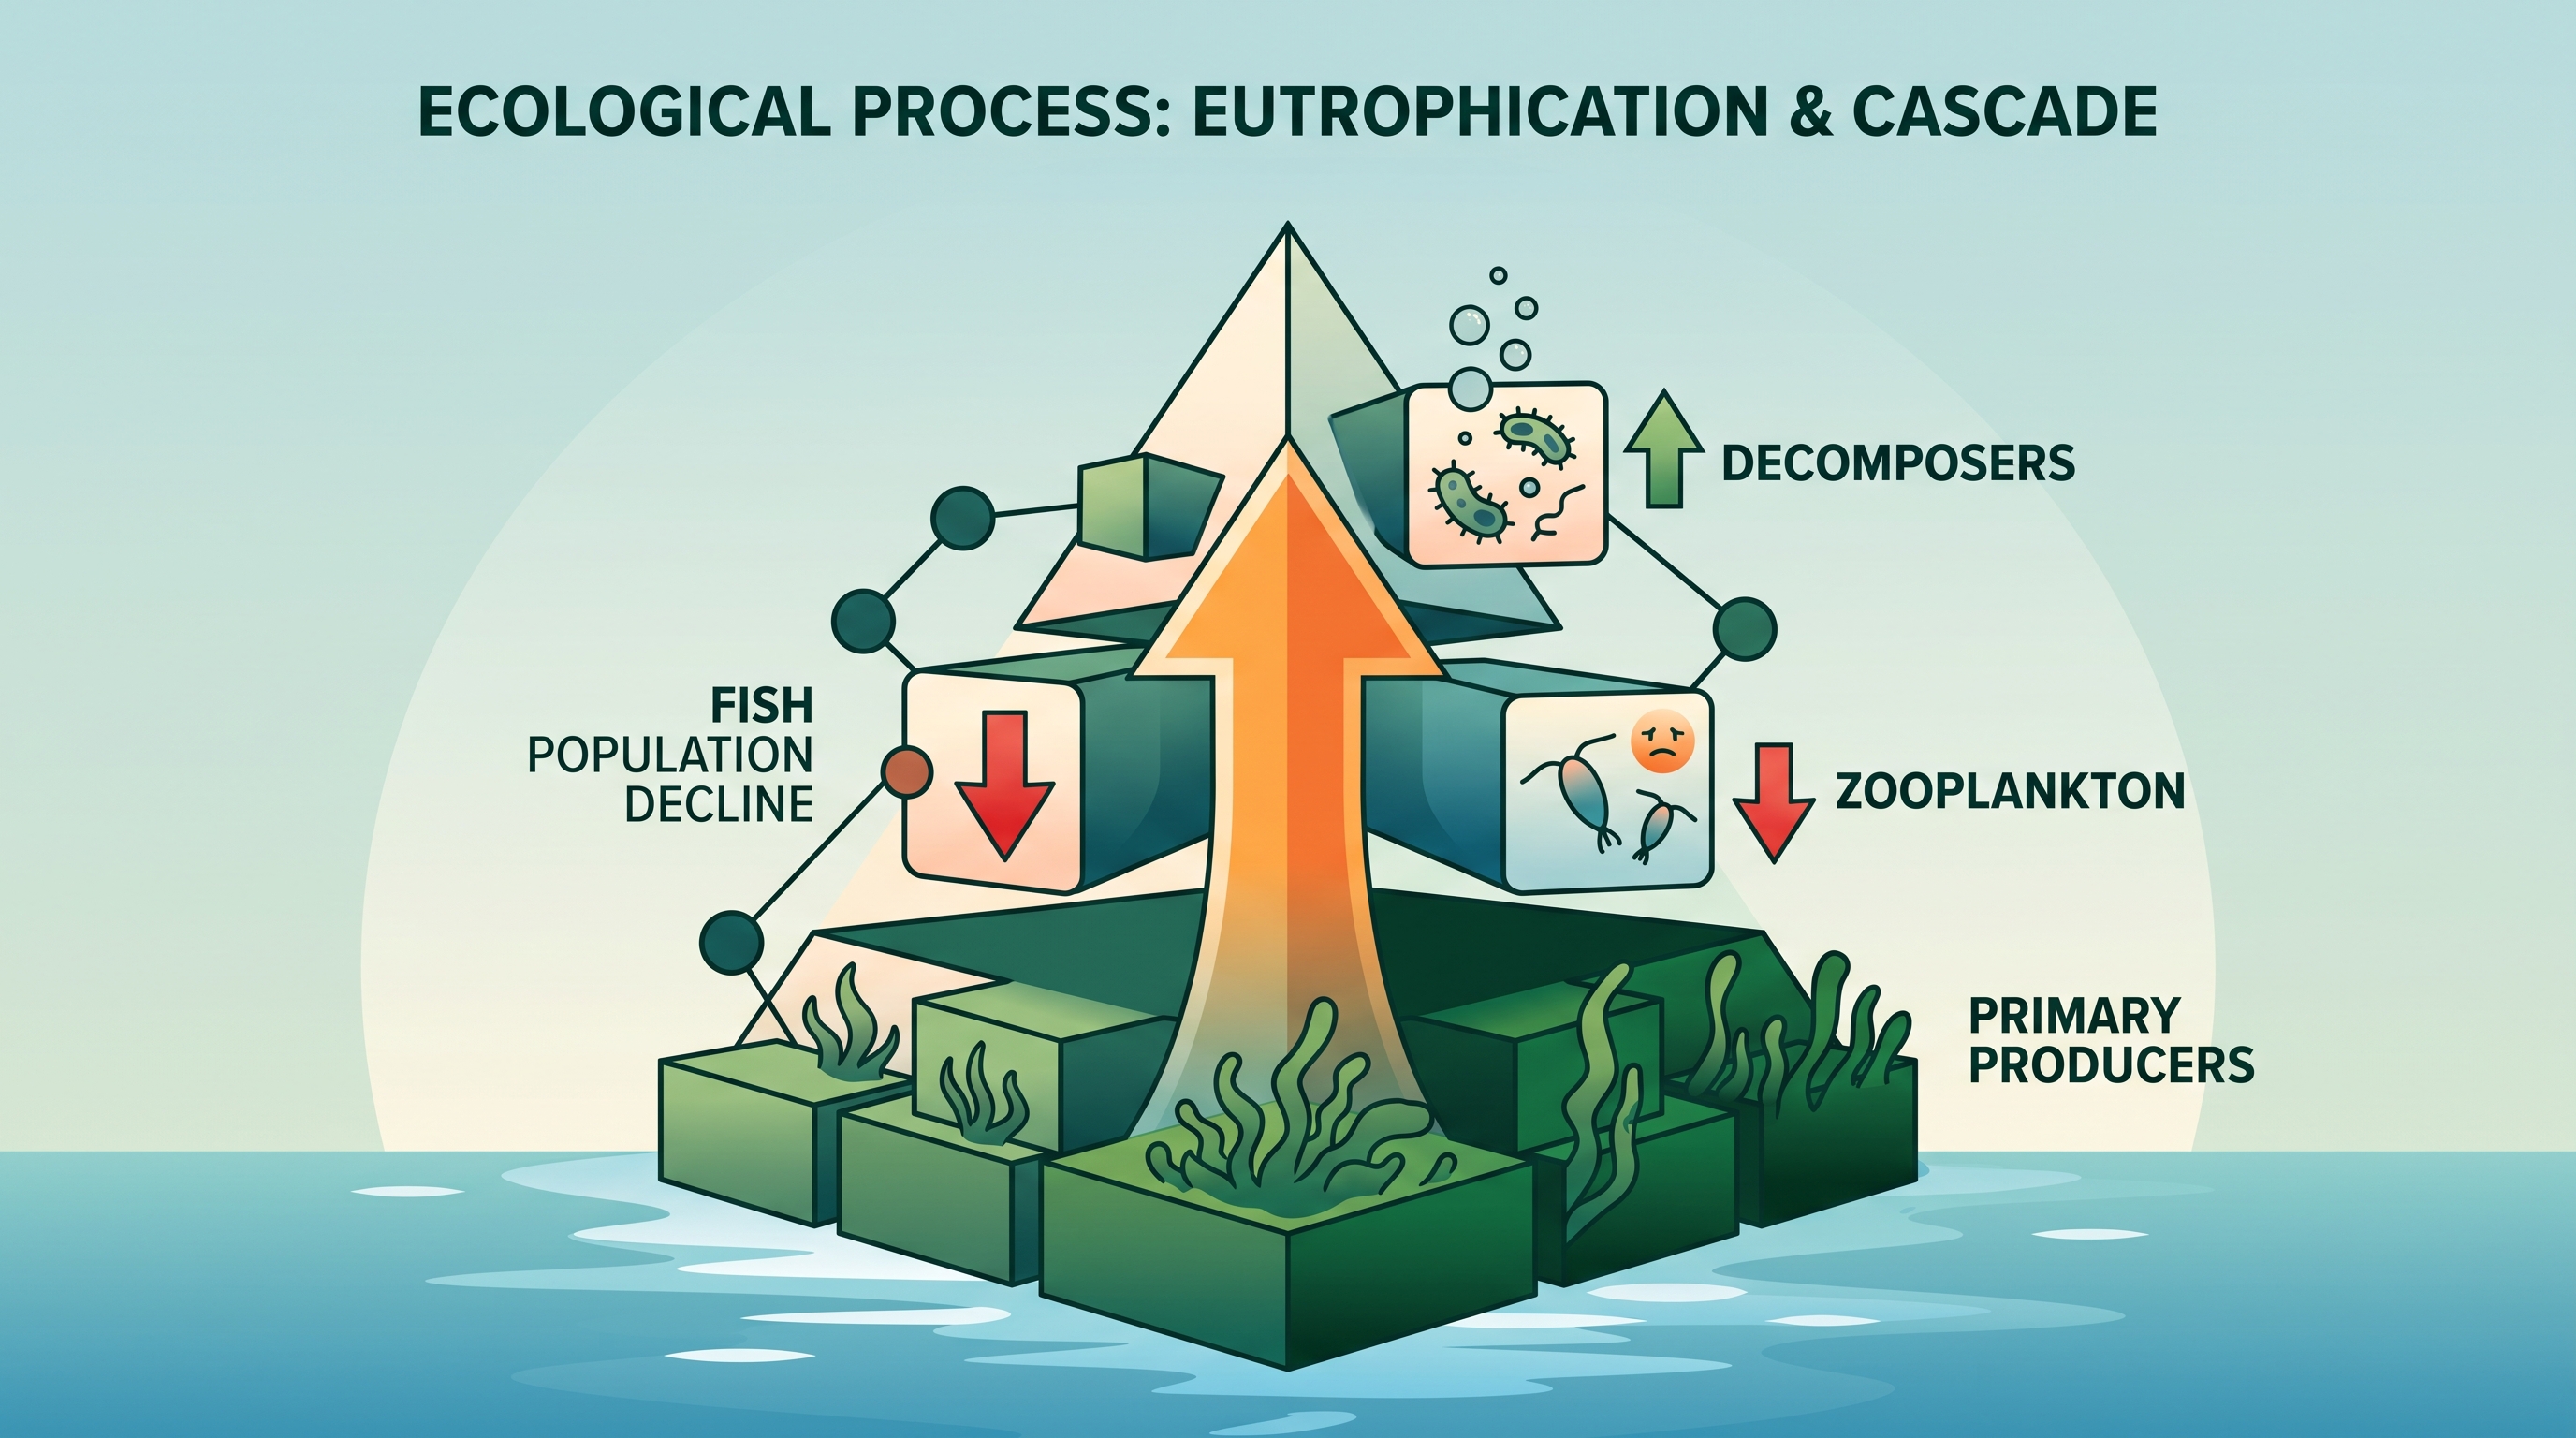
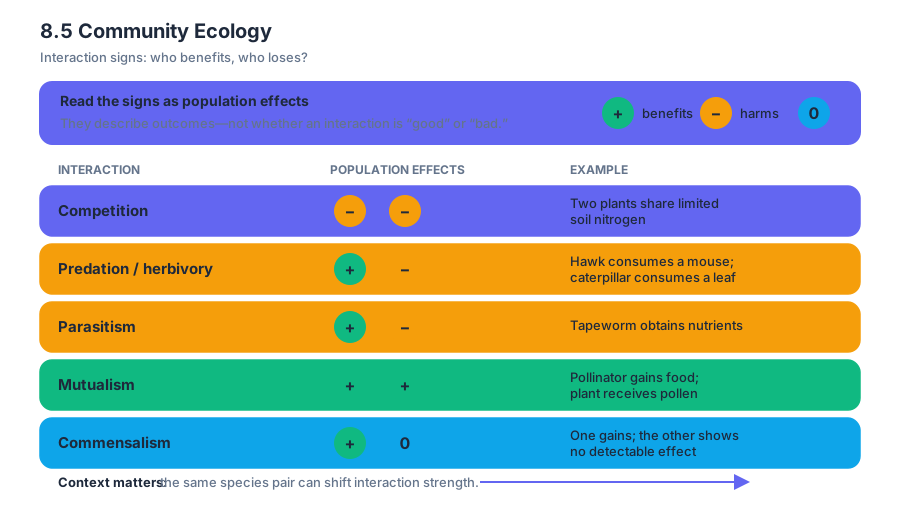
8.6 Biodiversity
A diverse ecosystem is more likely to remain functional when conditions change because it contains more biological “backup plans.” Biodiversity is the variety of living organisms in a biological system, including variation among individuals, species, and ecosystems.
8.6 Biodiversity
A diverse ecosystem is more likely to remain functional when conditions change because it contains more biological “backup plans.” Biodiversity is the variety of living organisms in a biological system, including variation among individuals, species, and ecosystems.
The key question is not simply How many species are present? It is also How evenly is abundance distributed among those species? A forest containing ten species dominated almost entirely by one species may be less resilient than a forest containing eight species with more balanced abundances.
Measuring biodiversity
Two important components of biodiversity are species richness, the number of different species present, and relative abundance, the proportion of the community represented by each species. Species richness counts categories; relative abundance describes how the individuals are distributed among those categories.
A community with high richness and high evenness generally has greater biodiversity than a community with the same richness but extreme dominance by one species. The distinction matters because two communities can contain the same number of species yet differ substantially in ecological stability.
The AP Biology reference information includes Simpson’s Diversity Index, which combines richness and relative abundance. One common form is
$$D = 1-\sum \left(\frac{n_i}{N}\right)^2$$
Here, $n_i$ is the number of individuals belonging to species $i$, and $N$ is the total number of individuals sampled. Larger values of $D$ indicate greater diversity in this form of the index.
Worked example: two ponds
Suppose researchers sample two ponds, collecting $100$ organisms from each.
| Pond | Species counts | Simpson’s Diversity Index |
|---|---|---|
| A | $80$, $10$, $10$ | $1-(0.80^2+0.10^2+0.10^2)=0.34$ |
| B | $40$, $30$, $20$, $10$ | $1-(0.40^2+0.30^2+0.20^2+0.10^2)=0.70$ |
Pond B has both greater species richness and a more even distribution of individuals. Its larger value of $D$ supports the conclusion that Pond B is more diverse. The calculation does not by itself prove that Pond B will survive every disturbance; it provides quantitative evidence relevant to comparing the two communities.
Biodiversity and ecosystem resilience
Ecosystem resilience is the capacity of an ecosystem to maintain or recover its structure and function after a disturbance. Biodiversity can increase resilience through functional redundancy: different species may perform similar ecological roles, so the loss of one species does not necessarily eliminate an essential process.
For example, several plant species may contribute to primary production, while several decomposer species may break down organic matter. If drought reduces one plant population, other plants may continue capturing energy and supplying organic material to the food web. Energy still flows through the system, although the community may change.
Biodiversity can also increase the range of responses available to an ecosystem. Species differ in tolerance to temperature, water availability, pathogens, and other environmental conditions. When conditions shift, at least some members of a diverse community may remain well suited to the new conditions.
A crucial distinction: diversity is not invulnerability
A common misconception is “More biodiversity means an ecosystem cannot be disrupted.” Biodiversity usually increases the likelihood that ecosystem functions will persist, but a sufficiently severe disturbance can still cause major losses. Resilience is a probability and systems property, not an absolute guarantee.
Another misconception is “Species richness alone measures biodiversity completely.” Richness ignores relative abundance. A community with one species making up $99%$ of its individuals and nine rare species may have the same richness as a community in which all ten species are similarly abundant, but the second community has greater evenness and typically a higher diversity index.
AP Biology reasoning in Topic 8.6
Science Practice 1: Explanation of Concepts is used to connect biodiversity to ecosystem resilience. A strong explanation identifies a mechanism, such as functional redundancy or differing environmental tolerances, rather than merely stating that “biodiversity is helpful.”
Science Practice 2: Visual Representations applies when interpreting species-abundance graphs, food webs, or diagrams showing ecosystem responses before and after disturbance. Science Practice 4: Representing and Describing Data applies when calculating or comparing diversity indices and describing patterns without claiming more than the data show.
Science Practice 5: Statistical Tests and Data Analysis applies when researchers determine whether observed differences in diversity or recovery are larger than expected from sampling variation. Science Practice 6: Argumentation requires a claim about resilience supported by numerical or graphical evidence and linked to biological reasoning. Science Practice 3: Questions and Methods appears when evaluating how researchers sampled organisms or designed a biodiversity comparison.
Retrieval check
Community X contains four species with abundances $25$, $25$, $25$, and $25$. Community Y contains four species with abundances $97$, $1$, $1$, and $1$. Which community has the greater species richness? Which has the greater biodiversity, and why?
Both communities have species richness of $4$. Community X has greater biodiversity because its relative abundances are more even, producing a larger Simpson’s Diversity Index and generally greater functional redundancy.
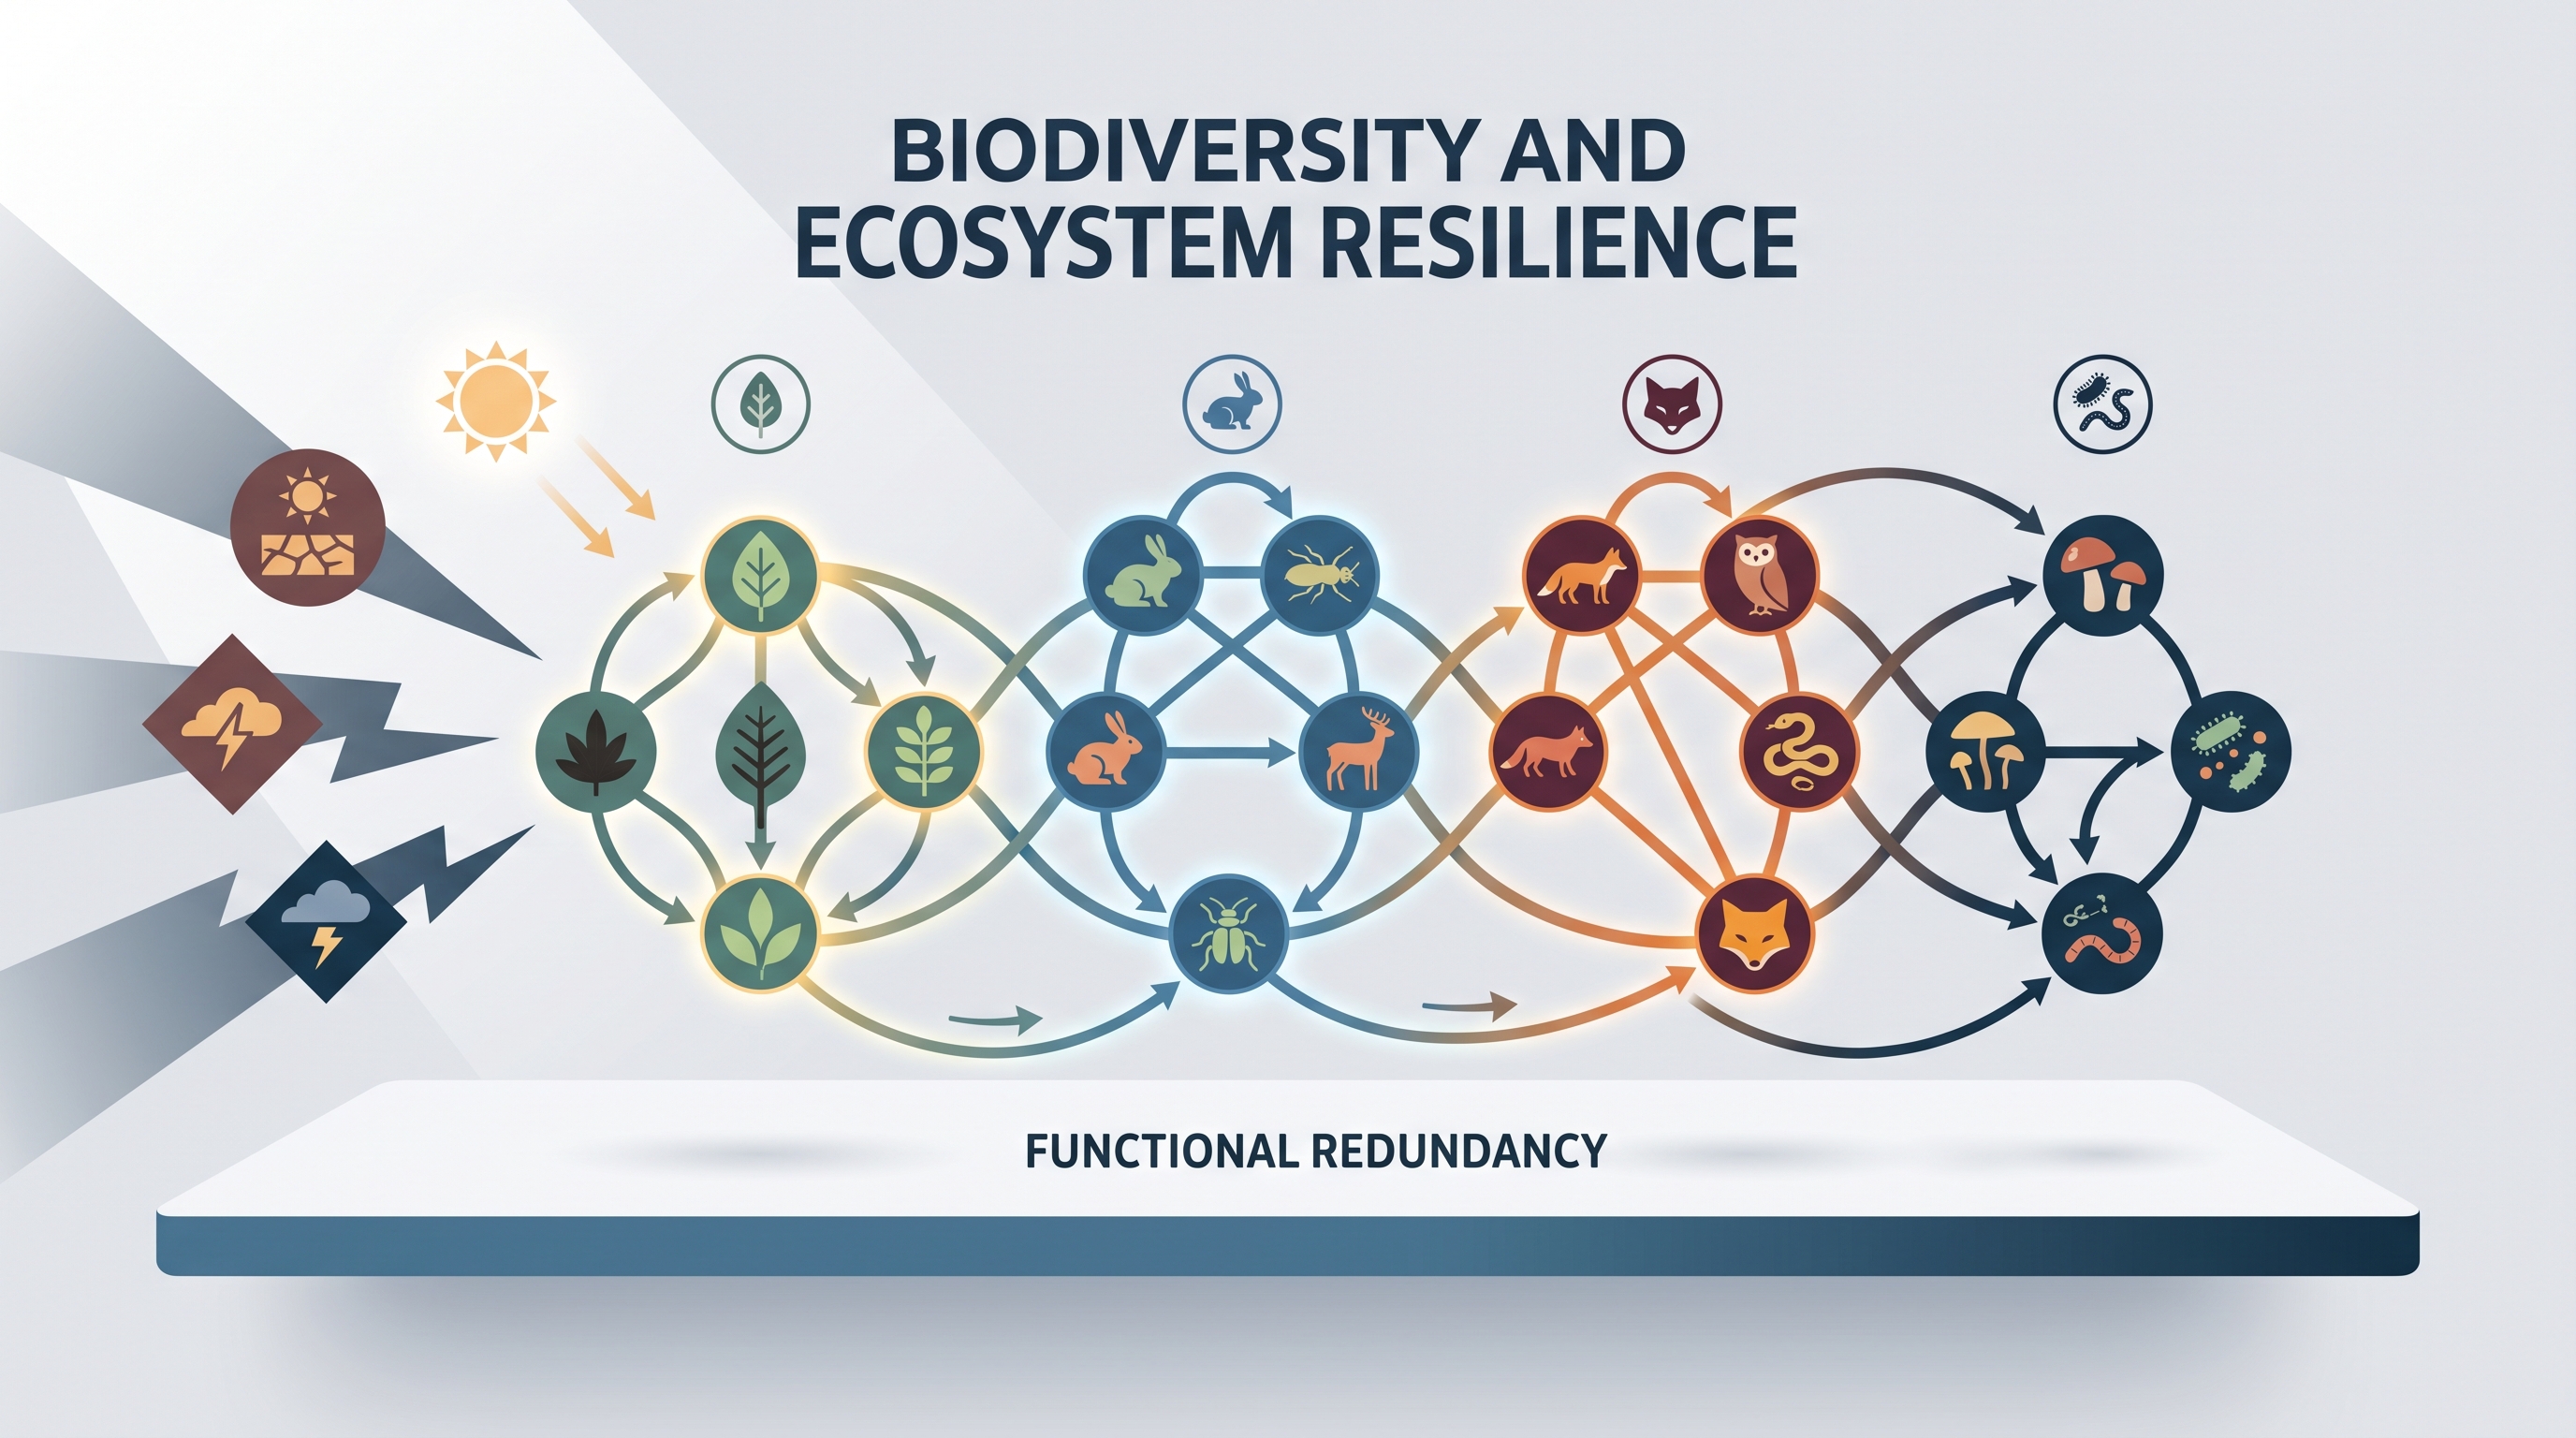
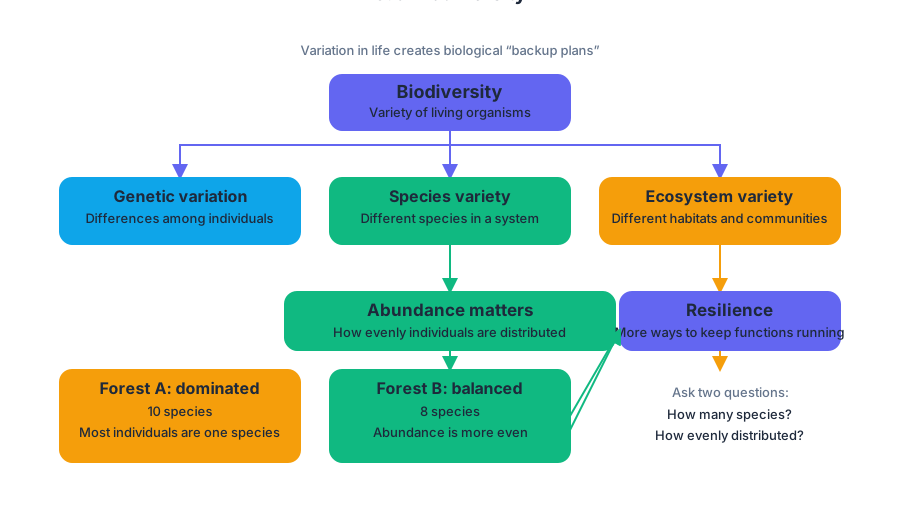
8.7 Disruptions in Ecosystems
A disruption can change an ecosystem’s ability to provide the services on which organisms—and human societies—depend. A drought, wildfire, invasive species, pollutant, disease, or human land-use change may alter population sizes, energy flow, nutrient cycling, and the ecosystem services produced by the system.
8.7 Disruptions in Ecosystems
A disruption can change an ecosystem’s ability to provide the services on which organisms—and human societies—depend. A drought, wildfire, invasive species, pollutant, disease, or human land-use change may alter population sizes, energy flow, nutrient cycling, and the ecosystem services produced by the system.
Learning Objective 8.7.A: Explain how disruptions to ecosystems affect ecosystem services.
Essential Knowledge 8.7.A.1: Human activities can cause disruptions in ecosystems.
Essential Knowledge 8.7.A.2: Ecosystems can be disrupted by natural events.
Essential Knowledge 8.7.A.3: Ecosystem disruptions can affect biodiversity and ecosystem services.
What counts as an ecosystem disruption?
An ecosystem disruption is a change that substantially alters the interactions among organisms or between organisms and their physical environment. The disruption may be abiotic, such as a hurricane, flood, drought, fire, or temperature shift, or biotic, such as the introduction of an invasive species, the spread of a pathogen, or the removal of a major predator.
Human activities can intensify or introduce disruptions through habitat destruction, pollution, overharvesting, urbanization, and climate change. The key biological question is not simply whether one species declines; it is whether the disturbance changes relationships and processes throughout the ecosystem.
For example, removing a predator can allow its prey population to increase. The prey may then consume more vegetation, reducing plant biomass and changing soil stability, nutrient cycling, and habitat available to other organisms. One population-level change can therefore propagate through several trophic levels.
Ecosystem services: what ecosystems provide
Ecosystem services are benefits that organisms and ecosystems provide to other organisms, including humans. They depend on functioning biological interactions rather than on the presence of isolated species alone.
| Ecosystem service | Biological process supporting it | Possible disruption |
|---|---|---|
| Pollination | Animal movement transfers pollen among flowers | Decline of pollinators or habitat loss |
| Water purification | Wetlands, microbes, and plants remove or transform pollutants | Wetland drainage or chemical contamination |
| Carbon storage | Plants, soils, and aquatic systems capture and retain carbon | Deforestation, fire, or soil disturbance |
| Soil formation and retention | Decomposition, microbial activity, and plant roots build and stabilize soil | Vegetation removal or erosion |
| Fisheries | Reproduction, food webs, and habitat support fish populations | Overharvesting, warming, or habitat destruction |
A disruption can reduce a service directly or indirectly. If an insecticide lowers the abundance of bees, fewer flowers may be pollinated. Reduced pollination can lower seed and fruit production, which decreases food availability for other organisms and may reduce crop yields. The ecosystem service—pollination—has been damaged because a biological interaction was disrupted.
Worked example: wetland loss and water purification
Imagine a wetland bordering a lake. Water flowing through the wetland slows down, sediments settle, plant roots absorb nutrients, and microbial communities transform or decompose some pollutants before the water reaches the lake.
Now suppose the wetland is drained for construction. The immediate change is habitat loss, but the consequences extend beyond the organisms living there:
- Less vegetation means less nutrient uptake.
- Faster water flow carries more sediment into the lake.
- Increased nutrient input can stimulate algal growth.
- Algal decomposition consumes dissolved oxygen.
- Low oxygen can stress or kill fish and aquatic invertebrates.
- Water purification and fisheries services both decline.
The claim is that wetland drainage reduces ecosystem services. The evidence would include increased nutrient or sediment concentration downstream, lower dissolved oxygen, and reduced abundance of aquatic organisms. The reasoning connects the evidence to wetland structure and function: removing plants, soils, and microbial habitats weakens nutrient removal and sediment retention.
Natural disruption does not mean “no ecological effect”
Natural disturbances such as fires, floods, storms, and droughts can also alter ecosystem services. A fire may temporarily reduce carbon storage and increase erosion, while a later recovery of vegetation may restore soil retention and carbon uptake. The effect depends on the disturbance’s intensity, duration, frequency, and the ecosystem’s ability to recover.
Misconception check — “Every disturbance permanently destroys an ecosystem.” Disturbance and recovery are not opposites. Some ecosystems are adapted to periodic disturbance, but a disturbance that is unusually intense, frequent, or combined with human pressure may prevent recovery and cause a lasting shift in ecosystem structure and services.
AP skills in this topic
This topic commonly engages Science Practice 1: Concept Explanation, when you explain how a disturbance changes populations, interactions, or services; Science Practice 2: Visual Representations, when you interpret a food web, nutrient-cycle diagram, or disturbance-response graph; Science Practice 4: Representing and Describing Data, when you graph service indicators such as dissolved oxygen or pollinator abundance; and Science Practice 6: Argumentation, when you make a claim supported by ecological evidence and reasoning.
Retrieval check: A forest is cleared beside a river, and downstream water contains more sediment while fish abundance falls. Identify one disrupted ecosystem service, name the biological process that normally supports it, and connect the two observations in a causal chain. A strong response could identify water purification or fisheries, explain that vegetation and soil normally retain sediment and support aquatic habitat, and link clearing to sedimentation and reduced fish survival.
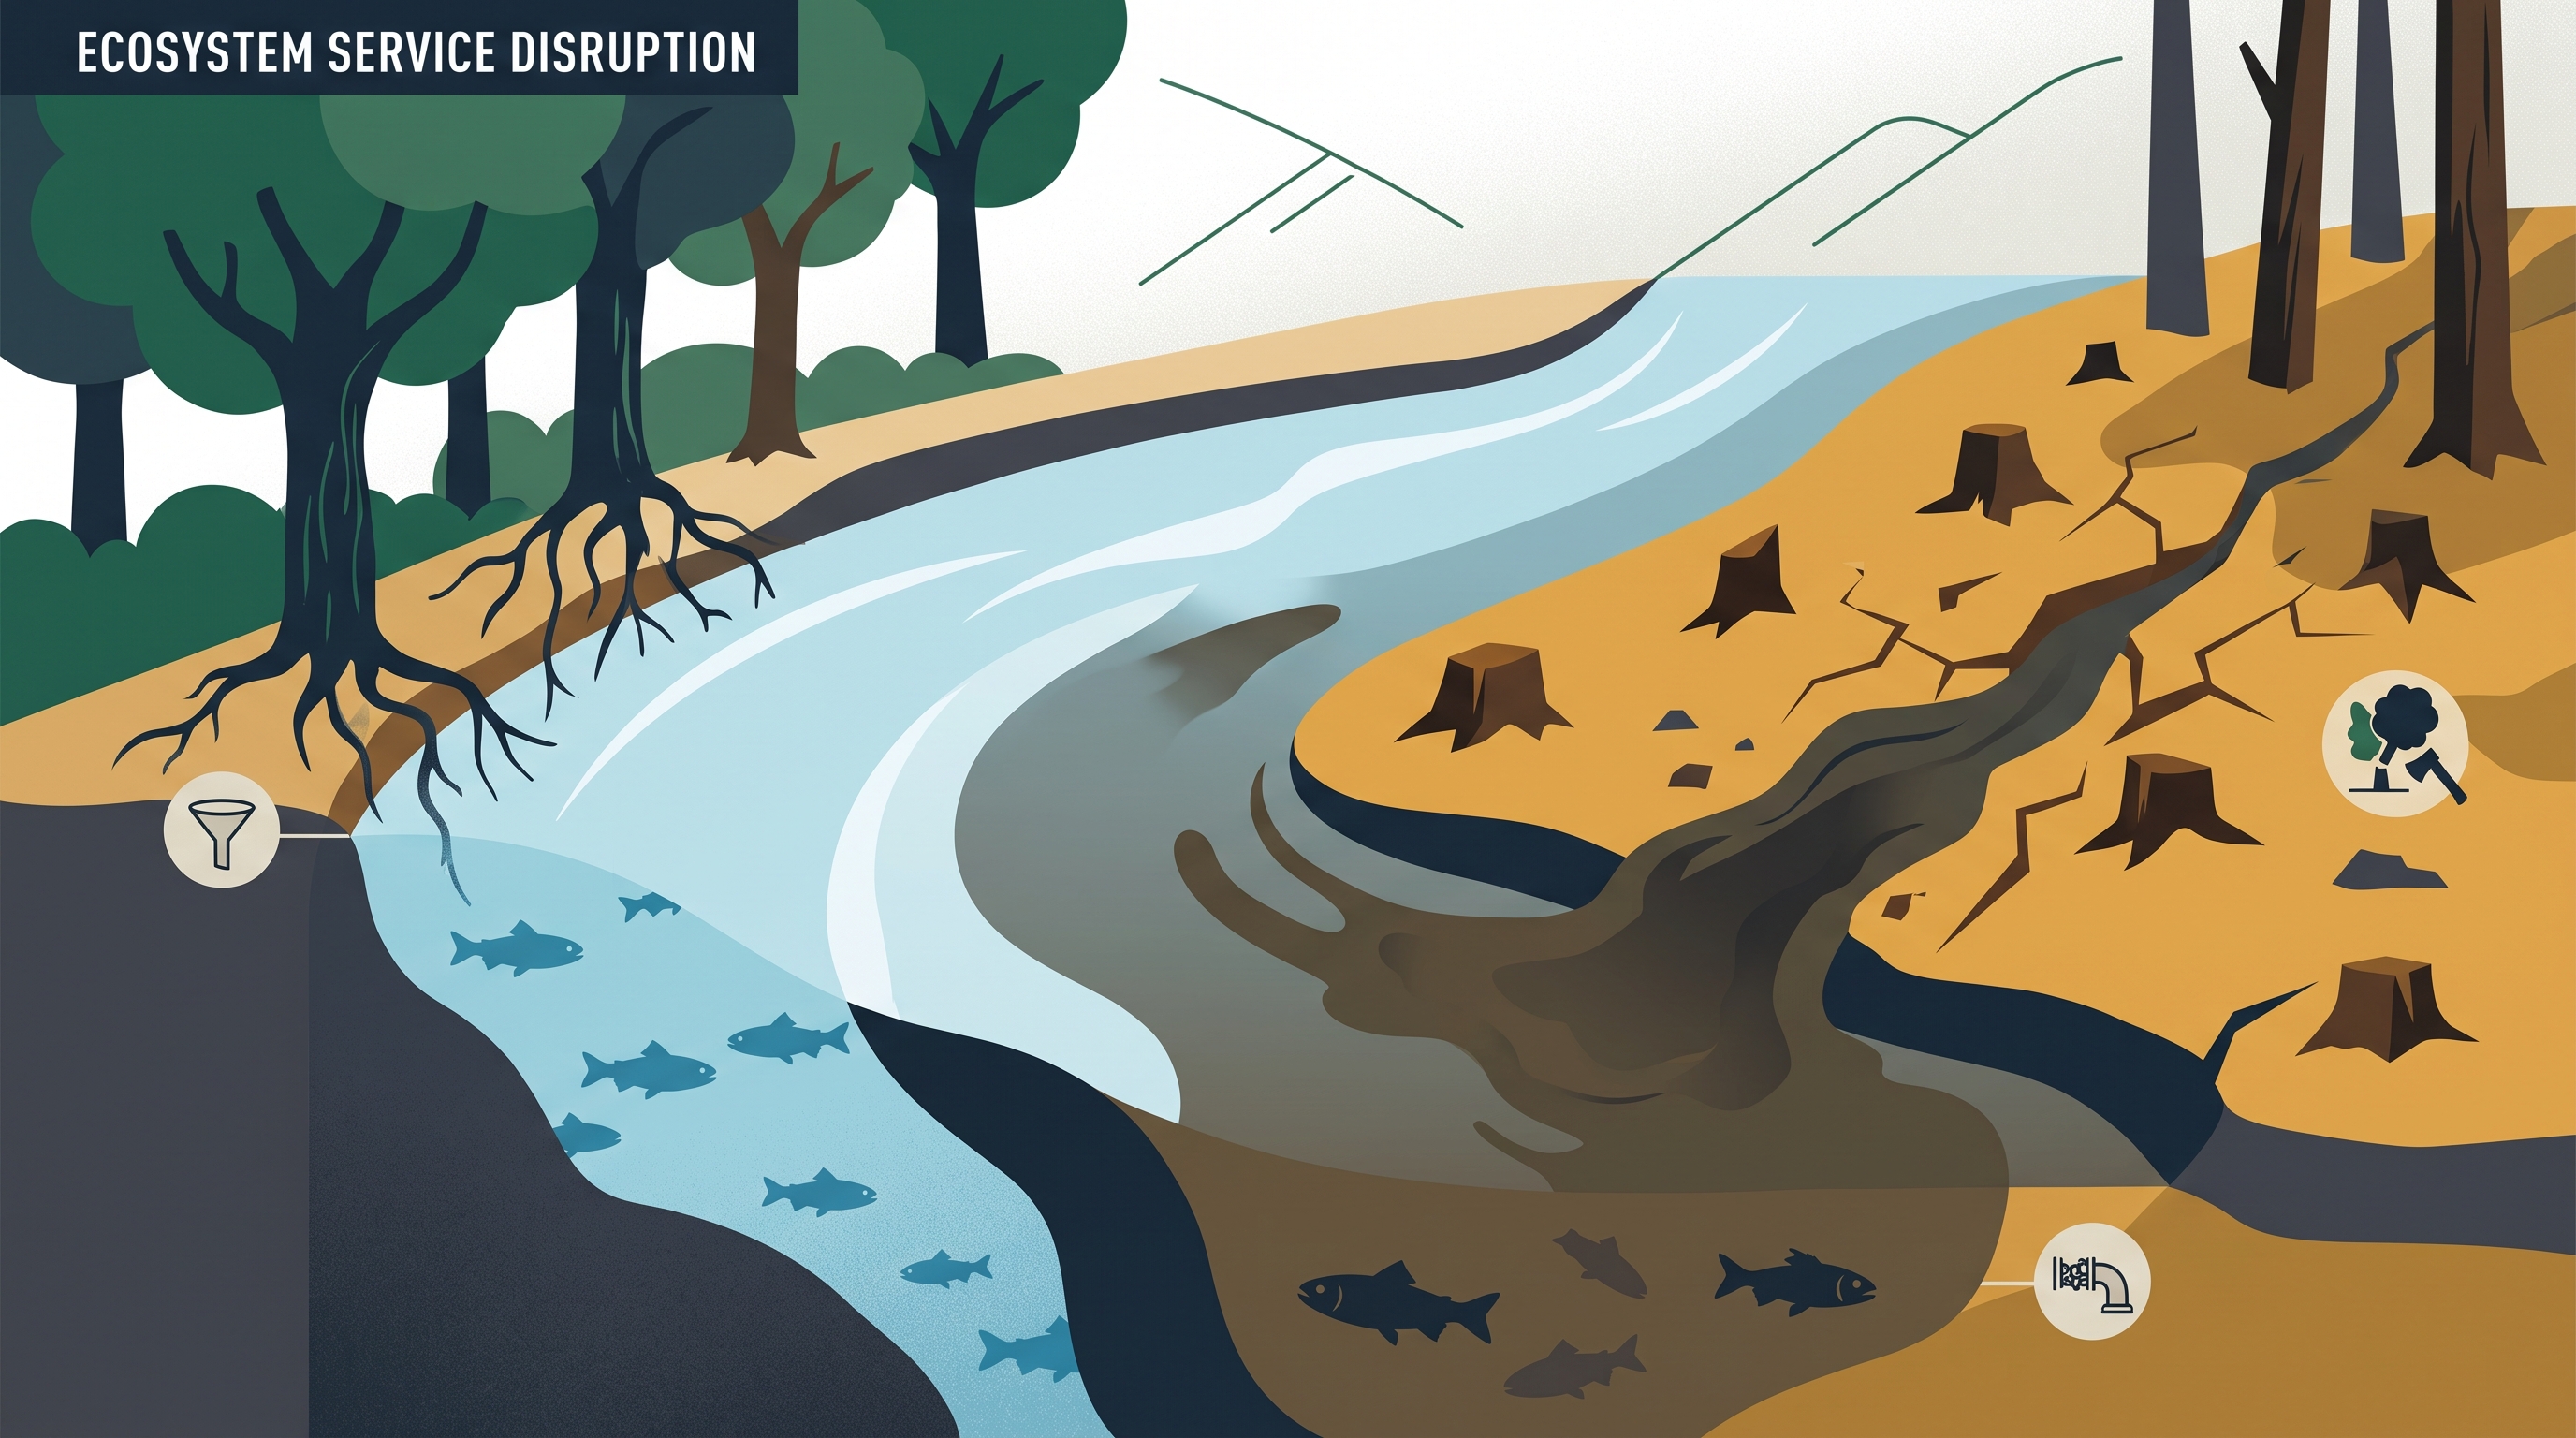
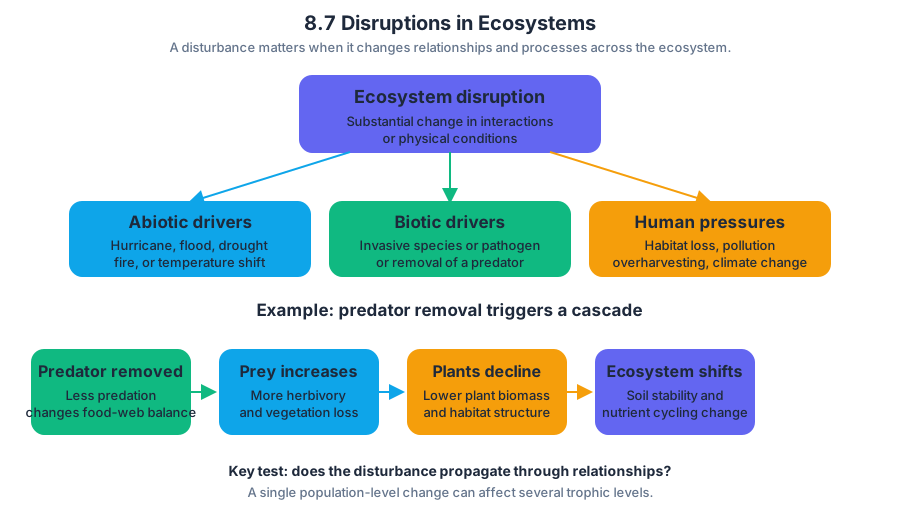
AP Practice 1
Key concepts: AP course principles: clarity, transparency, academic challenge, and student autonomy · AP opposition to indoctrination and emphasis on evaluating multiple perspectives · Evidence-based argumentation and respectful evaluation of others’ arguments · AP Biology course framework and Big Ideas · Evolution as the process driving the diversity and unity of life · Scientific practices: concept explanation, visual representations, questions and methods, data description, statistical tests and data analysis, and argumentation · Chi-square hypothesis testing · Using primary sources so students can evaluate evidence and experiences themselves · Formative assessment through unit Progress Checks · AP course organization, including class sections, join codes, and exam ordering
A population can become harder to kill without changing what an individual organism “tries” to do: if heritable variation already exists and an antibiotic eliminates susceptible bacteria, resistant variants leave more descendants.
AP Practice 1
A population can become harder to kill without changing what an individual organism “tries” to do: if heritable variation already exists and an antibiotic eliminates susceptible bacteria, resistant variants leave more descendants. Evolution is a change in the genetic makeup of a population over time, and that process helps explain both the astonishing diversity of life and the shared biological features—the unity—of life.
In this original, unofficial practice task, you will interpret experimental results, construct a visual representation, evaluate competing explanations, and make an evidence-based argument. The biological situation connects directly to the AP Biology course framework:
- Big Idea 1: Evolution — natural selection changes allele frequencies and produces adaptation.
- Big Idea 2: Energetics — antibiotics impose a survival-related environmental pressure, although the central evidence here concerns inheritance and selection.
- Big Idea 3: Information Storage and Transmission — genetic information is transmitted from parents to offspring, allowing resistance to persist.
- Big Idea 4: Systems Interactions — organisms interact with their environment, including chemical conditions created by antibiotic exposure.
The task spirals through all six AP Biology science practices: 1. Concept Explanation, 2. Visual Representations, 3. Questions and Methods, 4. Representing and Describing Data, 5. Statistical Tests and Data Analysis, and 6. Argumentation. A strong response does not merely name evolution; it uses data to show a mechanism.
Investigation: antibiotic exposure and allele frequency
Researchers began with genetically variable bacterial populations containing a resistance allele, $R$, and a susceptible allele, $S$. Each culture received the same antibiotic concentration for four generations. A parallel control culture was grown without antibiotic. The table reports the frequency of $R$ among sampled bacteria.
| Generation | Control: frequency of $R$ | Antibiotic: frequency of $R$ |
|---|---|---|
| $0$ | $0.20$ | $0.20$ |
| $1$ | $0.21$ | $0.31$ |
| $2$ | $0.22$ | $0.47$ |
| $3$ | $0.22$ | $0.65$ |
| $4$ | $0.23$ | $0.79$ |
These values are a practice dataset, not a quotation from a released AP question. They represent the kind of primary experimental evidence students must interpret directly: identify what was measured, compare treatment and control, and separate an observation from an explanation.
Question 1 — Describe the data. Describe the pattern in the antibiotic-treated culture and compare it with the control. Include numerical evidence.
Worked reasoning: The frequency of $R$ increased from $0.20$ to $0.79$ in the antibiotic treatment, an increase of $0.59$. In the control, it changed only from $0.20$ to $0.23$, an increase of $0.03$. The treated culture therefore shows a much larger increase in resistance-allele frequency across the four generations.
The rewarded reasoning is precise: state the direction of change, give values from the table, and make a treatment-versus-control comparison. Saying “resistance increased” without identifying the population, time interval, or evidence is incomplete Science Practice 4: Representing and Describing Data.
Build the evolutionary representation
Question 2 — Construct a visual representation. Create either a line graph of allele frequency against generation or a population model showing how selection changes the relative abundance of $R$ and $S$. Put generation on the horizontal axis, allele frequency on the vertical axis, use a scale from $0$ to $1$, and include separate, labeled lines for control and antibiotic treatment.
A correct graph reveals more than a list of numbers: the antibiotic line rises steeply while the control line remains nearly flat. In a model, show that antibiotic exposure reduces the relative reproductive success of susceptible bacteria, so descendants increasingly inherit $R$. The antibiotic does not need to create the resistance allele; selection changes the proportion of existing variants.
This required product assesses Science Practice 2: Visual Representations and Big Idea 1: Evolution. You may choose a graph, flow diagram, or annotated population model, but your representation must preserve the causal sequence: heritable variation $\rightarrow$ differential survival or reproduction $\rightarrow$ changed allele frequency.
Evaluate two interpretations
Two students make the following claims:
- Claim A: “The antibiotic caused individual bacteria to mutate into resistant bacteria, and those same bacteria became stronger.”
- Claim B: “The population already contained heritable variation. Antibiotic exposure favored bacteria carrying $R$, so those bacteria contributed disproportionately to later generations.”
Question 3 — Compare and critique. Which claim is better supported by the dataset? Use evidence from the treatment and control, identify one limitation, and respond to the weaker claim respectfully.
Worked reasoning: Claim B is better supported because the resistance frequency rose sharply under antibiotic exposure but changed little in the control. That pattern is consistent with selection favoring resistant bacteria. Claim A incorrectly treats evolution as a change in an individual during its lifetime; the measured change occurred in the genetic composition of a population across generations. The dataset alone does not prove whether resistance arose by mutation before the experiment or through another inherited mechanism, so the researchers would need additional evidence about initial variation and inheritance.
A respectful scientific response evaluates the argument, not the person: “Claim A does not fit the population-level pattern as well because it describes individual strengthening, whereas the data show a generational shift in allele frequency.” This is Science Practice 6: Argumentation—a claim supported by evidence and biological reasoning, with uncertainty stated honestly.
Statistical analysis and methods
Question 4 — Plan a test. Propose one method that would distinguish whether the observed increase in $R$ is reproducible rather than a chance result. Identify the independent variable, dependent variable, control, and replication.
A strong design would use several independently started control cultures and several independently started antibiotic-treated cultures. The independent variable is antibiotic exposure; the dependent variable is the frequency of $R$ after a specified number of generations; the no-antibiotic culture is the control; and independent cultures provide replication. Researchers could calculate means and variation among replicate frequencies, then apply an appropriate statistical test.
If the experiment tests expected genetic proportions, a chi-square hypothesis test may be appropriate. The listed biology learning objective includes performing chi-square hypothesis testing, using
$$\chi^2=\sum\frac{(o-e)^2}{e},$$
where $o$ is an observed result and $e$ is an expected result. The test does not prove that evolution occurred; it helps evaluate whether differences between observed and expected results are larger than would be likely from chance under the chosen null hypothesis.
Evolution, diversity, and unity
The same logic scales beyond bacteria. Heritable variation supplies differences, natural selection changes their frequencies when environments favor some variants, and common ancestry explains why different organisms retain shared biological features. Repeated divergence produces diversity; inherited molecular systems—such as DNA-based information storage and shared cellular chemistry—reveal unity.
Antibiotic resistance is therefore not an exception to evolution but a compact example of it. The population becomes more resistant because selection alters inherited variation over generations, not because the population makes a conscious decision or because every individual transforms in the same way.
Autonomy and evidence check
Choose your representation and your argument format: a graph with a written explanation, a causal diagram with an oral explanation, or a population model with an evidence table. Then complete an independent evidence check: mark each sentence in your response as observation, inference, or limitation, and revise any inference that is presented as though it were directly measured.
For timing, spend about $8$ minutes interpreting the dataset, $6$ minutes constructing the visual, and $6$ minutes writing the argument and method. Review errors by asking: Did I define evolution correctly? Did I compare treatment with control? Did my visual show allele-frequency change? Did I distinguish evidence from interpretation? Did I evaluate the argument rather than the person?
Progress Checks extend this kind of practice with formative multiple-choice and free-response questions. In AP Classroom, a teacher or AP coordinator creates the class section, and students join with a teacher-provided join code; the purpose is feedback about reasoning, not agreement with a particular viewpoint. AP exam points reward clear, evidence-based biology, while students retain responsibility for evaluating evidence and forming conclusions.

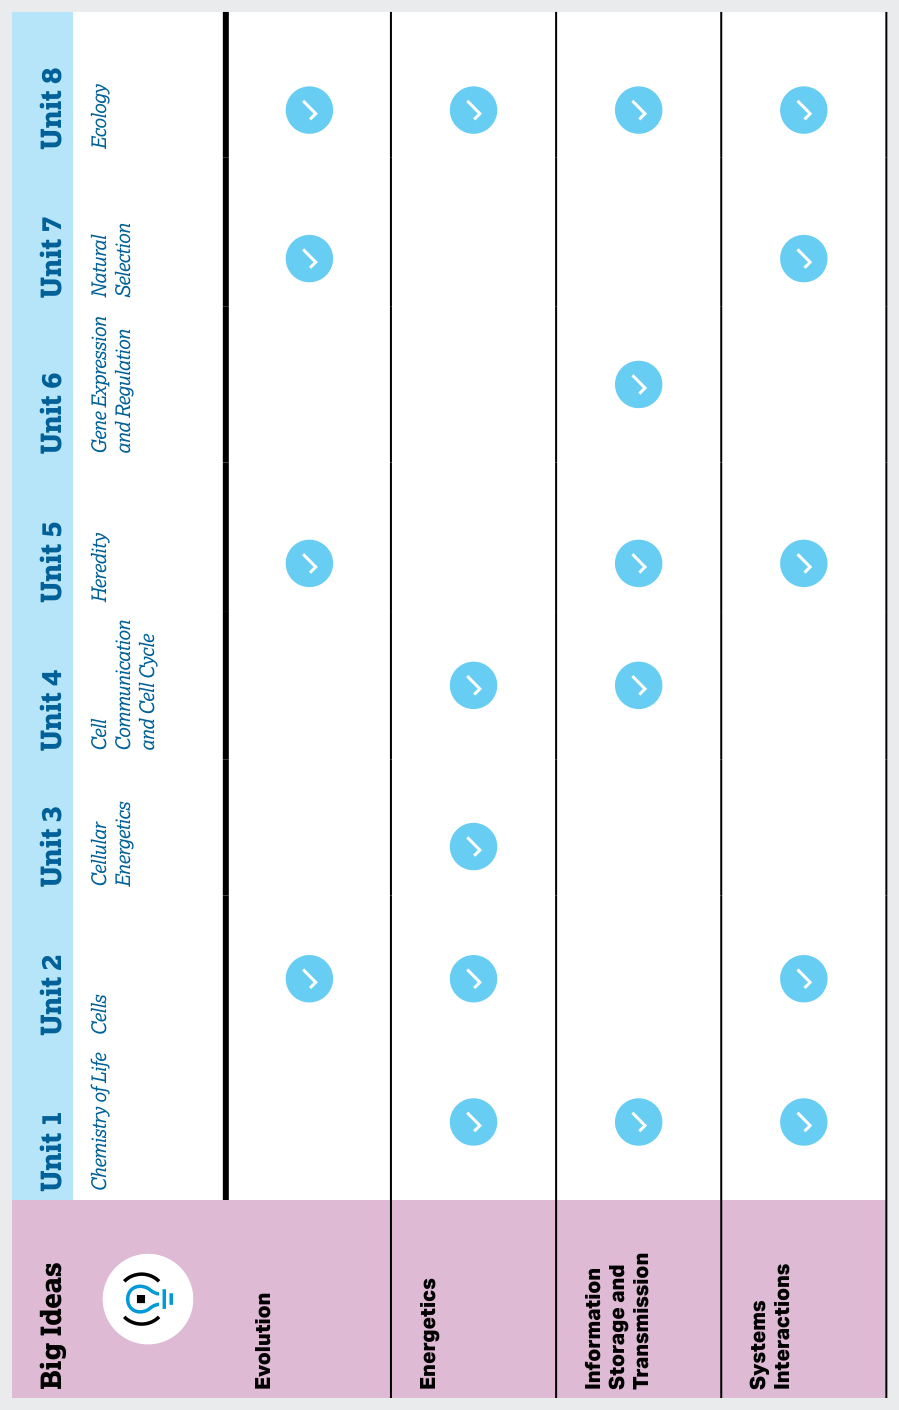
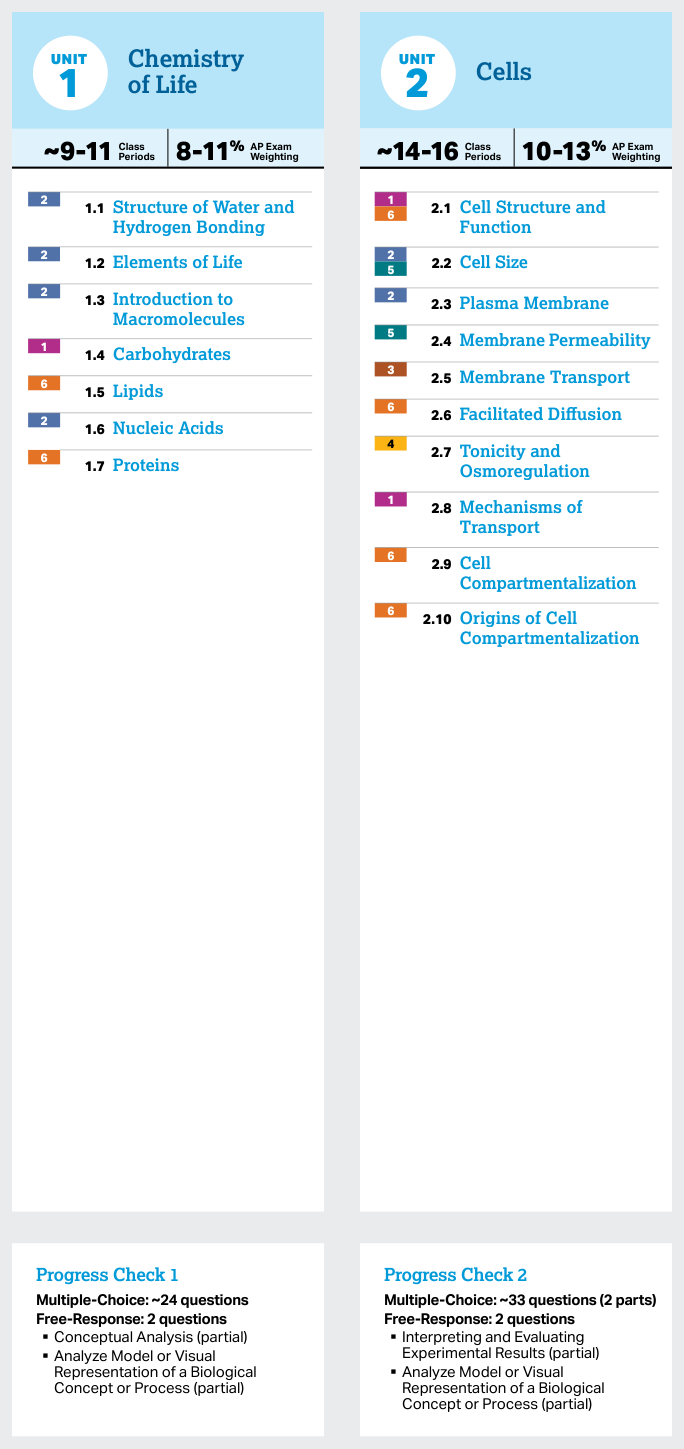

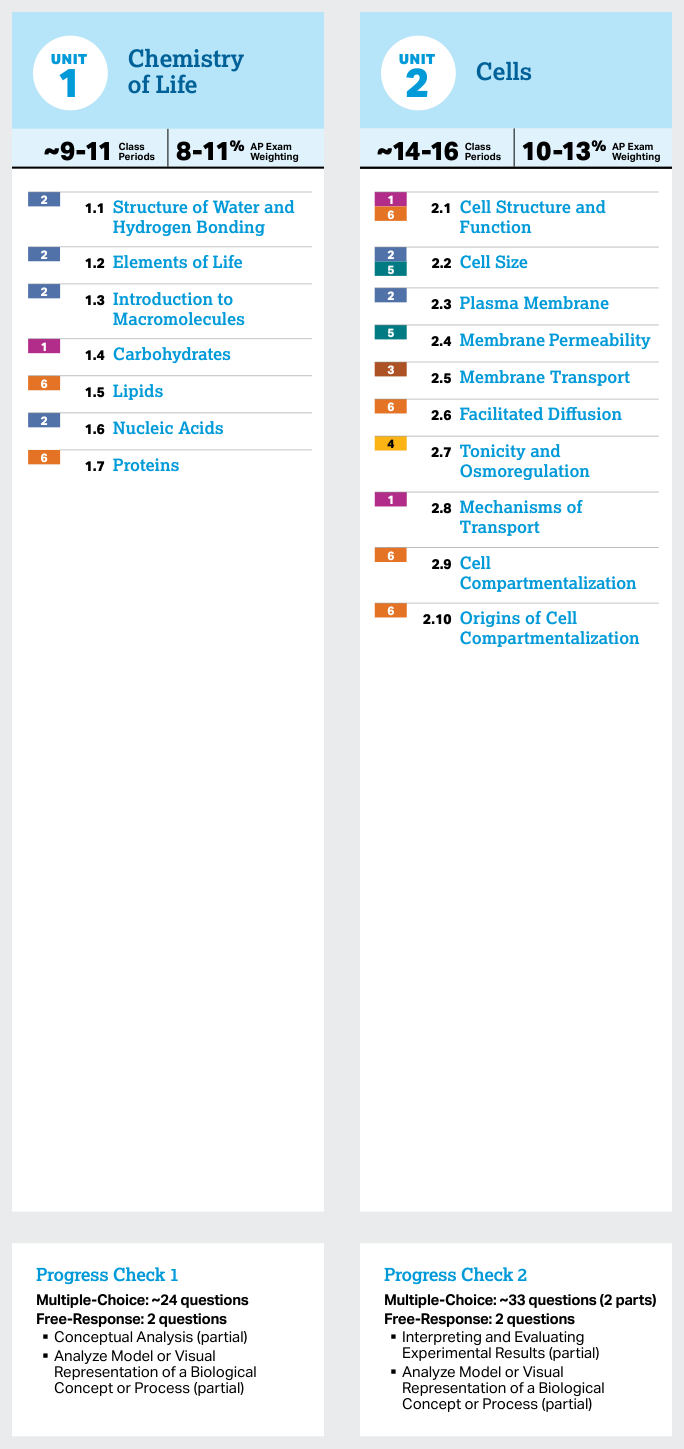


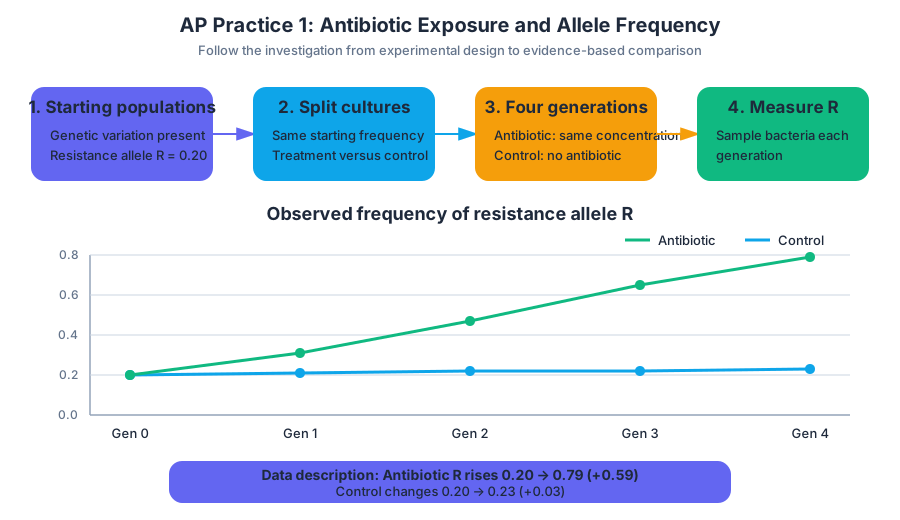
AP Practice 2
Key concepts: Science practices in experimental design and data analysis · Evolution, biodiversity, and the importance of genetic diversity · Cellular organelles and compartmentalization · Membrane transport and metabolic energy · Cell signaling and communication between cells · Meiosis, chromosome behavior, and crossing over · Mendelian genetics and inheritance · Chi-square hypothesis testing · Embryonic development and gene expression · Modeling biological processes such as transcription
A population survives environmental change only when some individuals carry heritable variation that gives them a chance to persist. That biological story connects chromosome behavior, Mendelian inheritance, cellular compartments, membrane transport, signaling, and the statistical tests used to decide whether…
AP Practice 2
A population survives environmental change only when some individuals carry heritable variation that gives them a chance to persist. That biological story connects chromosome behavior, Mendelian inheritance, cellular compartments, membrane transport, signaling, and the statistical tests used to decide whether experimental evidence supports an explanation.
Task type: Interpreting and Evaluating Experimental Results, with integrated Science Practice 3: Questions and Methods, Science Practice 4: Representing and Describing Data, Science Practice 5: Statistical Tests and Data Analysis, and Science Practice 6: Argumentation.
Question 1 — Design the investigation before collecting data
Researchers want to test whether ATP-dependent transport helps animal cells maintain their internal ion concentration. They place equal numbers of cultured cells into solutions containing the same external ion concentration. One group receives a treatment that reduces ATP production; the control group receives an otherwise identical treatment that does not reduce ATP production. After a fixed interval, the researchers measure the average internal ion concentration in each culture.
Student tasks
- Identify the independent variable, dependent variable, control condition, and one controlled variable.
- Predict the result for the ATP-reduced group.
- Explain why the prediction is biological rather than merely descriptive.
- State a suitable null hypothesis.
- Name one design improvement that would make the conclusion stronger.
Worked reasoning
The independent variable is ATP availability or ATP-production treatment. The dependent variable is the measured internal ion concentration. The control group receives the same handling and solution but does not receive the ATP-reducing treatment. Controlled variables could include cell number, solution volume, external ion concentration, temperature, exposure time, and measurement method.
The prediction is that cells with reduced ATP production will show a smaller ability to maintain the normal internal ion concentration. Active transport moves molecules or ions against a concentration gradient and requires metabolic energy such as ATP. If ATP-dependent transport decreases, ions may no longer be moved across the membrane at the normal rate, allowing the internal concentration to shift.
A suitable null hypothesis is: Reducing ATP production has no effect on the mean internal ion concentration compared with the control treatment. The hypothesis is tied directly to the experimental variables; it is not the vague claim that “nothing happens.”
A stronger design would use several independent cultures per treatment, randomize their positions, and repeat the experiment across multiple trials. Replication helps distinguish a treatment effect from random variation, while randomization reduces the possibility that position, handling order, or another hidden variable explains the pattern.
Question 2 — Analyze data and distinguish correlation from causal support
The researchers obtain the following internal ion-concentration data, measured in arbitrary concentration units:
| Treatment | Replicate measurements | Mean |
|---|---|---|
| Control | $9.8,\ 10.1,\ 10.0,\ 9.9,\ 10.2$ | $10.0$ |
| Reduced ATP | $7.1,\ 7.5,\ 7.2,\ 7.4,\ 7.3$ | $7.3$ |
Student tasks
- Describe the pattern in the data, including variation within each treatment.
- Calculate the percent decrease in mean internal ion concentration.
- Explain how the results support the role of ATP in active transport.
- Explain why the result is stronger than a simple correlation but does not prove that ATP directly transports the ions.
- Predict what would happen if ATP production were restored.
Worked reasoning
The control measurements cluster closely around $10.0$, ranging from $9.8$ to $10.2$. The reduced-ATP measurements also cluster relatively closely, ranging from $7.1$ to $7.5$, but their entire range lies below the control range. The separation between group means is therefore much larger than the variation among replicates within either group.
The percent decrease is
$$ \frac{10.0-7.3}{10.0}\times 100 = 27%. $$
The reduced-ATP cells maintained an average ion concentration approximately $27%$ lower than the control cells. Because the researchers deliberately changed ATP availability while holding other conditions as constant as possible, the result provides causal support for the claim that ATP-dependent processes are needed to maintain the ion gradient.
This is stronger than correlation because ATP availability was experimentally manipulated. However, the treatment could affect several ATP-dependent cellular processes, not only the transport protein itself. The data support the causal explanation that ATP availability is required for normal maintenance of the ion concentration, but they do not demonstrate that ATP physically carries ions through the membrane.
If ATP production were restored, ion concentrations would be predicted to move back toward the control value, provided that the transport proteins and membranes were not permanently damaged. A follow-up “rescue” treatment would test that prediction.
Examiner-rewarded reasoning: identify a numerical trend, connect ATP to active transport, distinguish manipulation from observation, and avoid claiming more than the experiment establishes.
Question 3 — Organelles, compartmentalization, and transport
A protein destined for secretion is synthesized on ribosomes associated with the rough endoplasmic reticulum. It is transported in vesicles to the Golgi apparatus, a membrane-bound structure consisting of a series of flattened membrane sacs. The Golgi modifies, sorts, and packages the protein for delivery to its final destination.
Mitochondria have a double membrane, creating compartments with different chemical conditions and functions. Internal membranes also increase the surface area available for reactions and minimize competing interactions between pathways. These compartments are not decorative walls: they make incompatible or specialized reactions possible in the same cell.
Student tasks
- Predict one consequence of disrupting Golgi membranes.
- Explain why the mitochondrial double membrane supports ATP production.
- Compare vesicle transport with active transport across the plasma membrane.
- Predict the effect of blocking ATP production on an ion pump.
Worked reasoning
Disrupting Golgi membranes would be expected to interfere with protein modification, sorting, or packaging. A secreted protein might be synthesized but fail to reach the correct cellular destination.
The mitochondrial double membrane separates regions where different steps of energy conversion occur. This separation permits the cell to establish chemical gradients across a membrane and use those gradients to produce ATP. If the membranes became freely permeable, the gradient would dissipate and ATP production would decrease.
Vesicle transport moves a membrane-enclosed package through the cytoplasm, whereas active transport moves specific molecules or ions across a membrane using energy. Both are organized cellular processes, but they are not interchangeable mechanisms.
Blocking ATP production would reduce the activity of an ion pump that moves ions against their concentration gradient. The pump would not necessarily stop every membrane movement: passive diffusion can continue, but the cell would lose the energy-dependent process that maintains unequal ion concentrations.
Misconception check — “All transport requires ATP.” Passive diffusion and facilitated diffusion do not directly require ATP because substances move down an electrochemical gradient. Active transport requires metabolic energy because it moves substances against that gradient.
Question 4 — Cell signaling across distance
Signals released by one cell type can travel long distances to target cells of another type. A signaling molecule may circulate through a body, but only cells with the appropriate receptor respond. The receptor converts the external signal into an intracellular change, such as altered enzyme activity or gene expression.
Student task
Predict the result if a target cell produces no functional receptor for the signal, and explain why neighboring nontarget cells may remain unaffected.
Worked reasoning
The target cell would fail to initiate the normal response because signal binding and signal transduction require a functional receptor. Nontarget cells may remain unaffected even when exposed to the same circulating molecule because they lack the receptor or the downstream pathway needed to interpret the signal.
A useful experimental test would compare cells with a functional receptor, cells with a receptor-blocking treatment, and untreated controls. Measuring a downstream response would connect receptor function to cellular behavior.
Question 5 — Meiosis, crossing over, and Mendelian inheritance
A diploid organism has homologous chromosomes carrying alleles $A$ and $a$. During meiosis, homologous chromosomes pair during prophase I. Crossing over can exchange corresponding DNA segments between nonsister chromatids. Homologs then separate in meiosis I; sister chromatids separate in meiosis II. The final products are haploid because each contains one chromosome from each homologous pair.
Student tasks
- Predict the haploid allele products of meiosis for an organism with genotype $Aa$.
- Identify the mistake if homologous chromosomes separate during meiosis II instead of meiosis I.
- For a cross between $Aa$ and $Aa$, calculate the genotypic and phenotypic ratios when $A$ is completely dominant.
- Explain how meiosis and crossing over contribute to biodiversity and population resilience.
Worked reasoning
An $Aa$ organism produces haploid gametes carrying either $A$ or $a$. Under ordinary segregation, approximately half the gametes carry $A$ and half carry $a.
If homologous chromosomes fail to separate during meiosis I, both homologs may enter the same daughter cell. This produces cells with abnormal chromosome numbers after meiosis. Confusing homolog separation with sister-chromatid separation is a common error: homologs separate in meiosis I, while sister chromatids separate in meiosis II.
The cross is
$$ Aa \times Aa. $$
Each parent produces gametes $A$ and $a$. The possible offspring are $AA$, $Aa$, $Aa$, and $aa$. Therefore, the genotypic ratio is
$$ 1\ AA : 2\ Aa : 1\ aa, $$
while the phenotypic ratio is
$$ 3\ \text{dominant phenotype} : 1\ \text{recessive phenotype}. $$
The genotypic ratio counts allele combinations; the phenotypic ratio counts observable traits. A dominant allele is expressed in a heterozygote, but “dominant” does not mean more common, stronger, or better.
Mutation introduces new alleles, while independent assortment, crossing over, and fertilization rearrange existing alleles. A diverse gene pool is vital because environmental conditions change: if a new pathogen, temperature pattern, or food shortage affects a population, genetically diverse populations are more likely to contain individuals with traits that permit survival and reproduction.
Question 6 — Chi-square hypothesis testing
A researcher crosses two heterozygous organisms and observes $78$ offspring with the dominant phenotype and $22$ with the recessive phenotype. The researcher expects a $3:1$ phenotypic ratio.
Student tasks
- State the null hypothesis.
- Calculate the expected counts.
- Calculate $\chi^2$.
- Determine the degrees of freedom.
- Using a critical value of $3.84$ at $p=0.05$, decide whether to reject or fail to reject the null hypothesis.
- State the biological conclusion.
Worked reasoning
The null hypothesis is that the observed offspring numbers are consistent with the expected $3:1$ phenotypic ratio and that deviations are caused by chance.
There are $100$ total offspring. The expected dominant count is
$$ E_{\text{dominant}}=\frac{3}{4}(100)=75, $$
and the expected recessive count is
$$ E_{\text{recessive}}=\frac{1}{4}(100)=25. $$
Using
$$ \chi^2=\sum \frac{(o-e)^2}{e}, $$
the calculation is
$$ \chi^2= \frac{(78-75)^2}{75} + \frac{(22-25)^2}{25}
\frac{9}{75}+\frac{9}{25}
0.12+0.36
0.48. $$
There are two outcome categories, so
$$ df=2-1=1. $$
Because $0.48<3.84$, the researcher fails to reject the null hypothesis. The observed data do not differ significantly from the expected $3:1$ ratio at the $p=0.05$ threshold. This does not prove that the ratio is exactly $3:1$; it means the observed deviation is plausibly explained by random sampling variation.
Chi-square testing also applies beyond genetics, but it is not automatically appropriate for every data set. The investigator must match the test to the type of data and the hypothesis. A strong investigation chooses the statistical method before data collection, considers sample size and possible errors, and clearly connects the null hypothesis to the experimental variables.
Communication and model-building
Scientific reasoning includes communicating how a model produces a prediction. Students can model transcription with pool noodles representing DNA strands or RNA, then use labeled sketches or photographs to document the biological stages. The model is useful only when its parts and limitations are explained: a pool noodle can represent a strand, but it cannot reproduce molecular interactions or enzyme specificity.
Retrieval check
A population has low genetic diversity, an ion pump loses access to ATP, and a cell’s Golgi apparatus is disrupted. Predict one consequence of each change, then identify which prediction depends most directly on chromosome behavior during meiosis. A complete response should connect genetic diversity to changing environments, ATP to active transport, Golgi structure to protein sorting, and homolog separation plus crossing over to inherited variation.
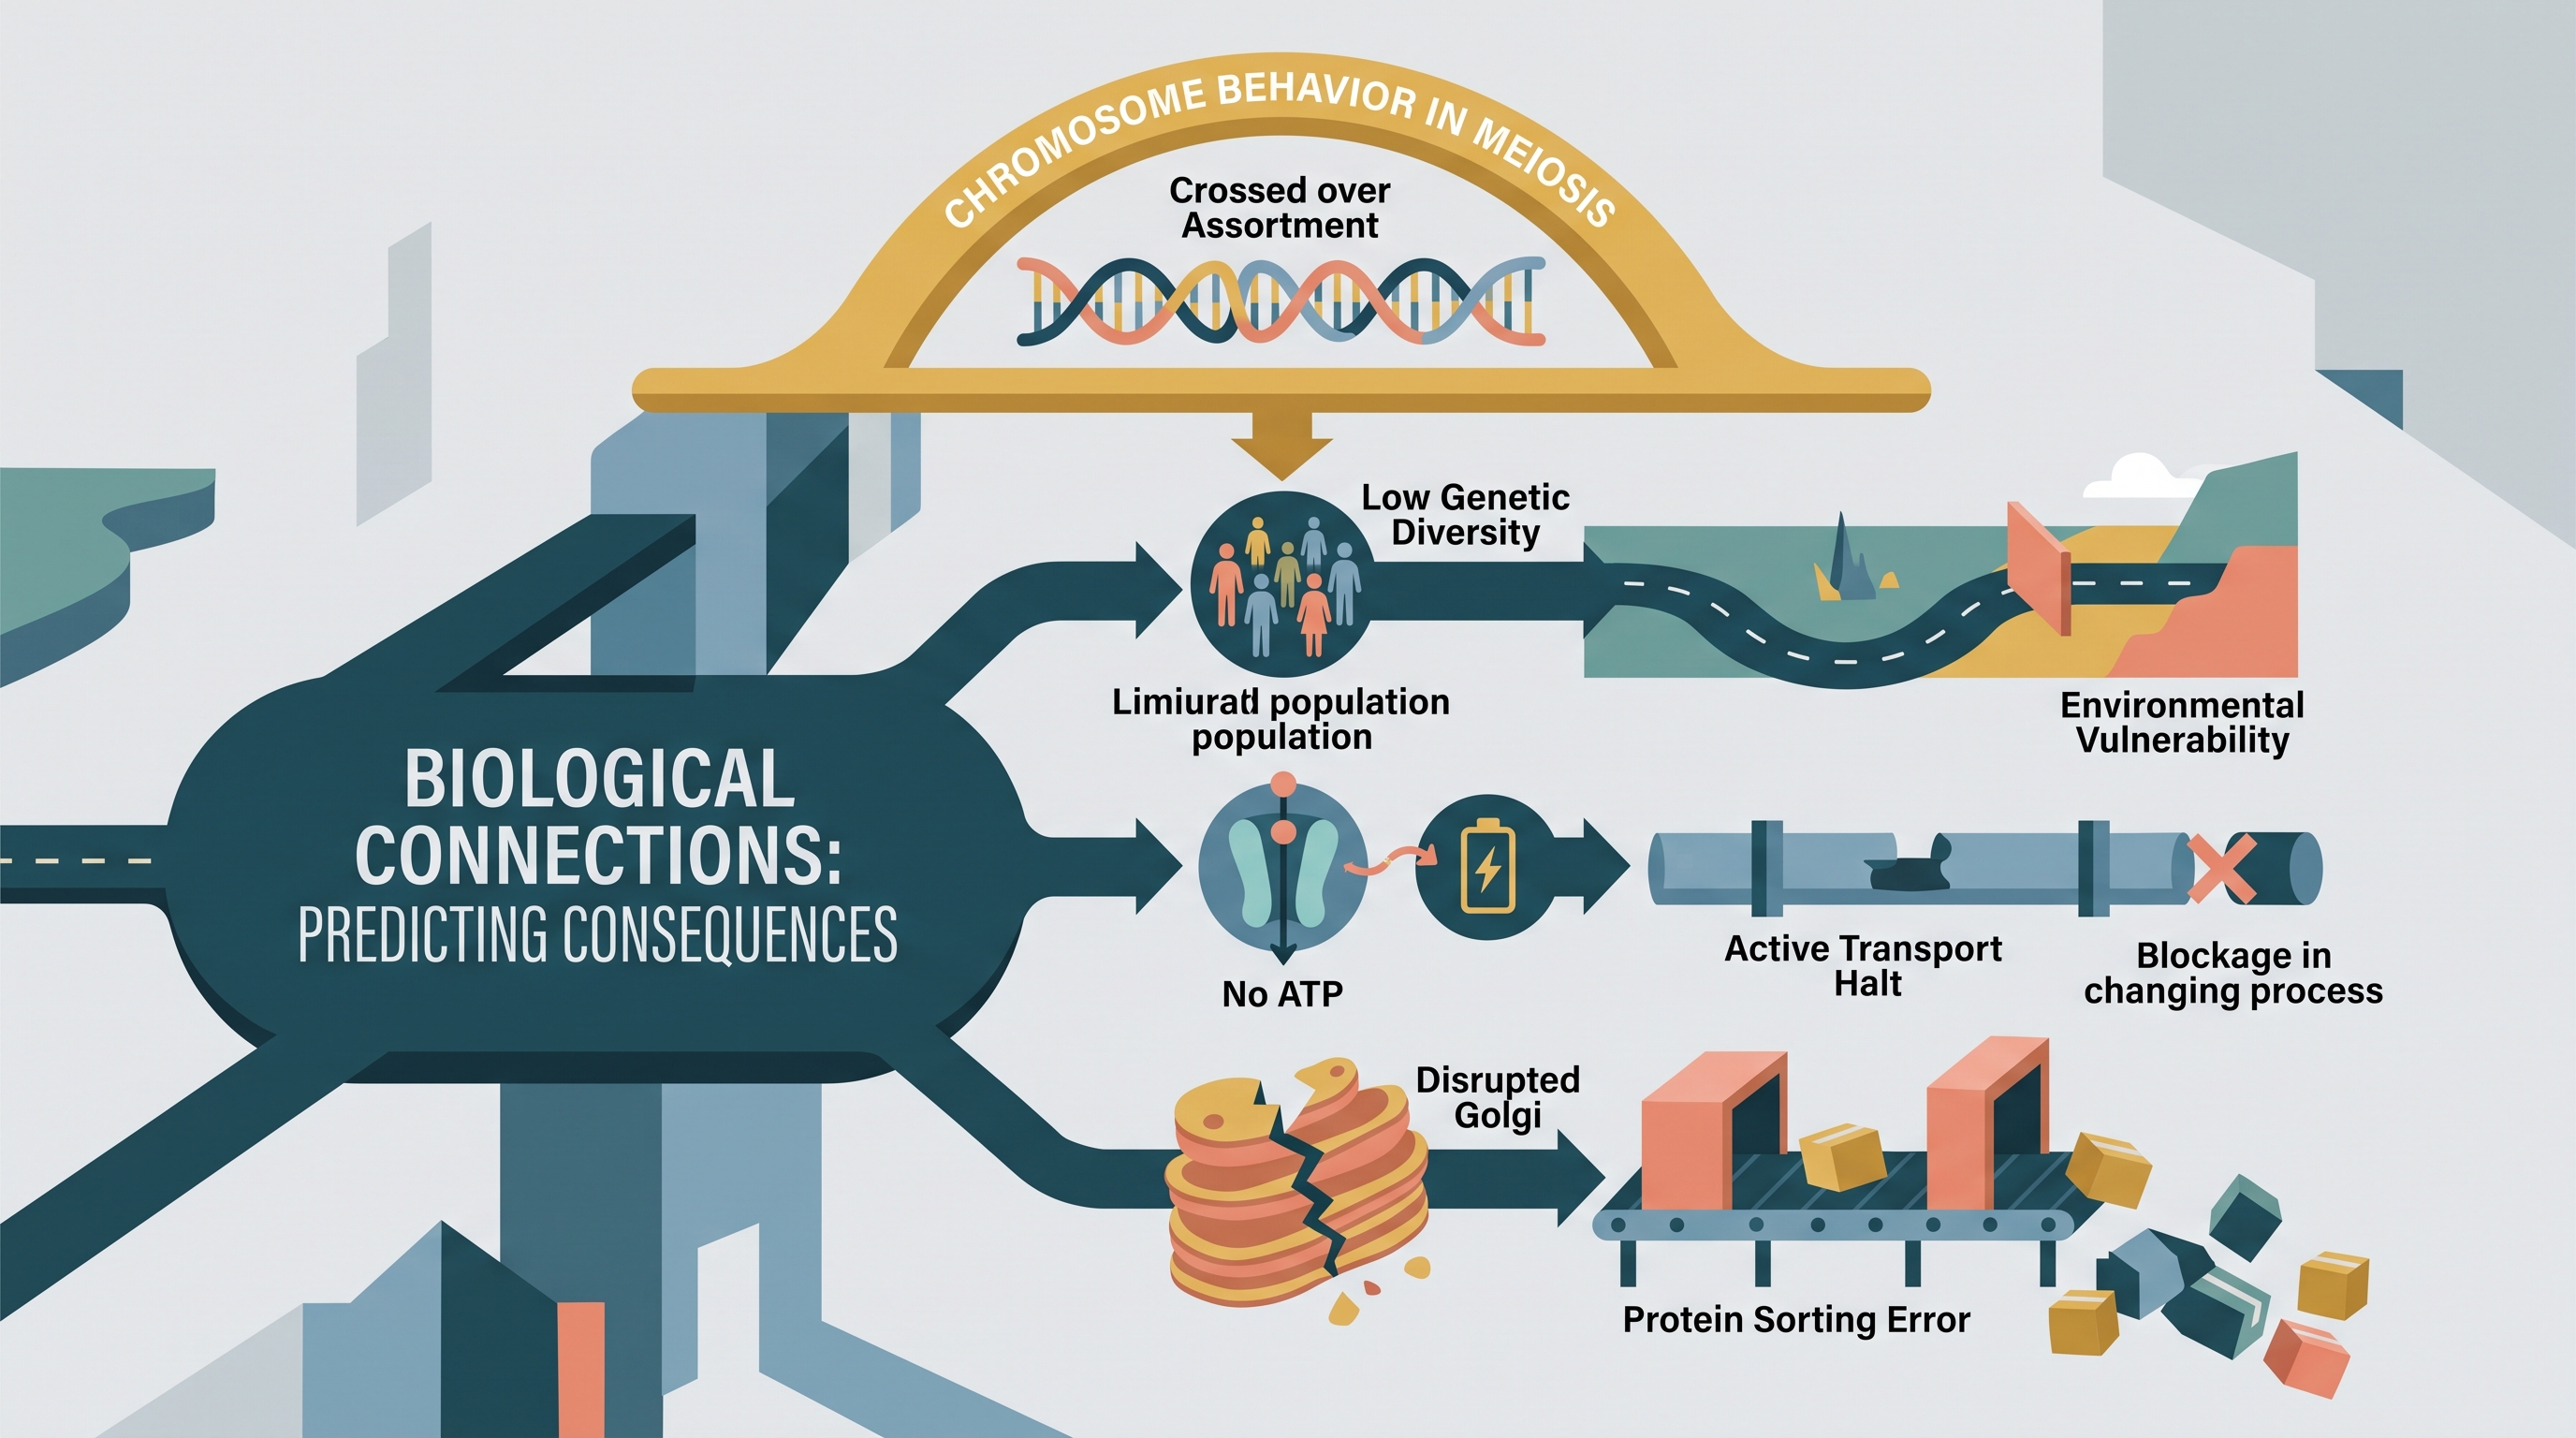
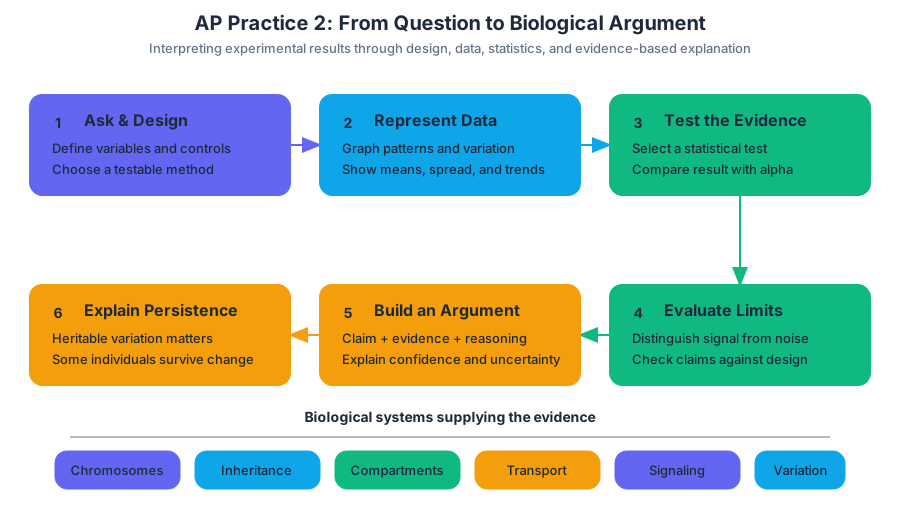
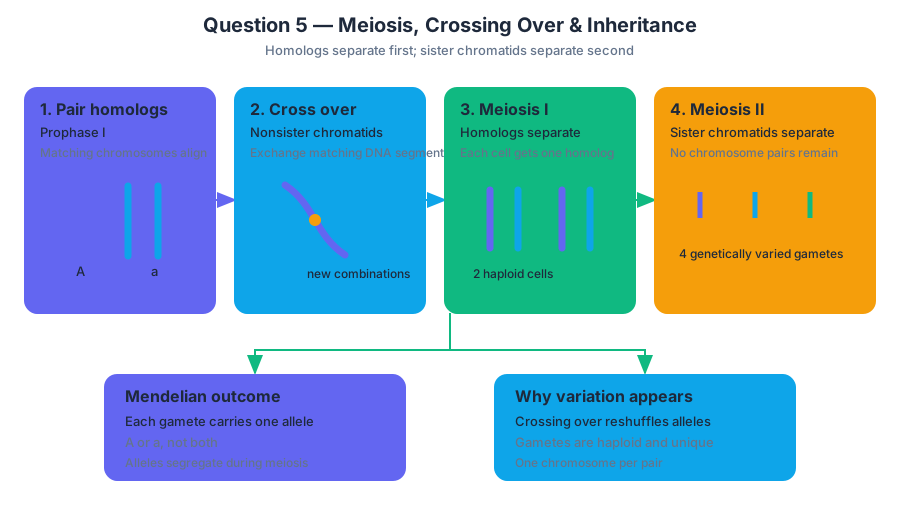
AP Practice 3
A biological claim becomes scientifically useful only when evidence supports it. In a data-based free-response task, the goal is not merely to identify a trend; it is to connect a variable, a biological mechanism, and a defensible conclusion.
AP Practice 3
A biological claim becomes scientifically useful only when evidence supports it. In a data-based free-response task, the goal is not merely to identify a trend; it is to connect a variable, a biological mechanism, and a defensible conclusion.
This original practice task focuses on interpreting experimental data, explaining a biological relationship, and constructing an evidence-based argument. It especially activates Science Practice 1: Concept Explanation, Science Practice 4: Representing and Describing Data, Science Practice 5: Statistical Tests and Data Analysis, and Science Practice 6: Argumentation.
Original data-based practice task
Researchers investigated how temperature affects the activity of catalase, an enzyme that breaks down hydrogen peroxide. Equal amounts of catalase extract were placed into separate reaction mixtures maintained at different temperatures. The rate of oxygen production was used as an estimate of catalase activity.
| Temperature | Mean oxygen production rate |
|---|---|
| $10^\circ\text{C}$ | $2.1\ \text{mL min}^{-1}$ |
| $20^\circ\text{C}$ | $4.8\ \text{mL min}^{-1}$ |
| $30^\circ\text{C}$ | $7.2\ \text{mL min}^{-1}$ |
| $40^\circ\text{C}$ | $5.9\ \text{mL min}^{-1}$ |
| $50^\circ\text{C}$ | $1.4\ \text{mL min}^{-1}$ |
(a) Identify the independent variable and dependent variable in the investigation.
(b) Describe the relationship between temperature and catalase activity from $10^\circ\text{C}$ to $50^\circ\text{C}$.
(c) Explain the decrease in catalase activity between $40^\circ\text{C}$ and $50^\circ\text{C}$.
(d) Propose one controlled variable that should be kept constant and explain why controlling it improves the investigation.
(e) The researchers claim that catalase functions most effectively near $30^\circ\text{C}$. Evaluate whether the data support the claim.
Worked reasoning
Part (a): Identify variables
The independent variable is temperature because the researchers deliberately changed it. The dependent variable is the rate of oxygen production because it was measured as the response.
A common error is naming oxygen production as the independent variable because it appears in the results. The deciding question is: Which factor did the researchers manipulate? The manipulated factor is the independent variable; the measured outcome is the dependent variable.
Part (b): Describe the pattern
Catalase activity increases as temperature rises from $10^\circ\text{C}$ to $30^\circ\text{C}$, reaching a maximum measured rate of $7.2\ \text{mL min}^{-1}$. Activity then decreases at $40^\circ\text{C}$ and falls sharply at $50^\circ\text{C}$.
A strong description reports the overall pattern and uses specific data. “Temperature affects the enzyme” is too vague because it does not identify the direction, the turning point, or the relevant measurements.
Part (c): Explain the mechanism
At temperatures above the enzyme’s optimal range, increased molecular motion can disrupt the interactions that maintain catalase’s three-dimensional shape. Changes to the enzyme’s shape can alter the active site, reducing the enzyme’s ability to bind hydrogen peroxide and catalyze its breakdown.
Key distinction: High temperature can reduce enzyme activity by changing protein structure; it does not necessarily destroy the substrate.
This explanation earns more biological credit than “the enzyme gets too hot.” It links the environmental change to protein structure, active-site function, and reaction rate.
Part (d): Control an alternative explanation
The concentration of hydrogen peroxide should remain constant in every reaction mixture. If substrate concentration changed between treatments, differences in oxygen production could result from unequal substrate availability rather than temperature.
Other defensible controlled variables include the amount of catalase extract, reaction volume, reaction time, and pH. A variable is not automatically a good control merely because it is present; the response must explain how changing it could affect the measured rate.
Part (e): Evaluate the claim
The data support the claim that catalase functions most effectively near $30^\circ\text{C}$ because the highest measured oxygen-production rate occurred at $30^\circ\text{C}$: $7.2\ \text{mL min}^{-1}$. However, the data do not establish that exactly $30^\circ\text{C}$ is the true optimum because temperatures between the tested values were not examined.
This is an argument, not a repetition of the table: the claim is stated, numerical evidence is cited, and a limitation is identified. The cautious conclusion is that $30^\circ\text{C}$ produced the highest activity among the temperatures tested.
Timing and scoring logic
Allow approximately $12$–$15$ minutes for a task of this size. First identify what each command asks for: identify requires a label, describe requires a pattern supported by data, explain requires a biological mechanism, propose requires a reasonable experimental choice, and evaluate requires a claim supported by evidence and qualified by limitations.
The strongest responses make the reasoning visible. A useful evidence chain is:
$$ \text{experimental change} \rightarrow \text{biological mechanism} \rightarrow \text{measured response} \rightarrow \text{conclusion} $$
For this task:
$$ \text{higher temperature} \rightarrow \text{altered catalase structure} \rightarrow \text{reduced active-site function} \rightarrow \text{lower oxygen-production rate} $$
Error-review routine
After completing the task, classify each missed or weak point as one of four errors: data error—the numerical trend was misread; command error—the response did not perform the requested action; mechanism error—the explanation lacked a biological cause; or argument error—the conclusion lacked evidence or ignored a limitation.
Retrieval check: If the catalase extract were boiled before the experiment, predict the effect on oxygen production and explain your prediction using protein structure and enzyme function.

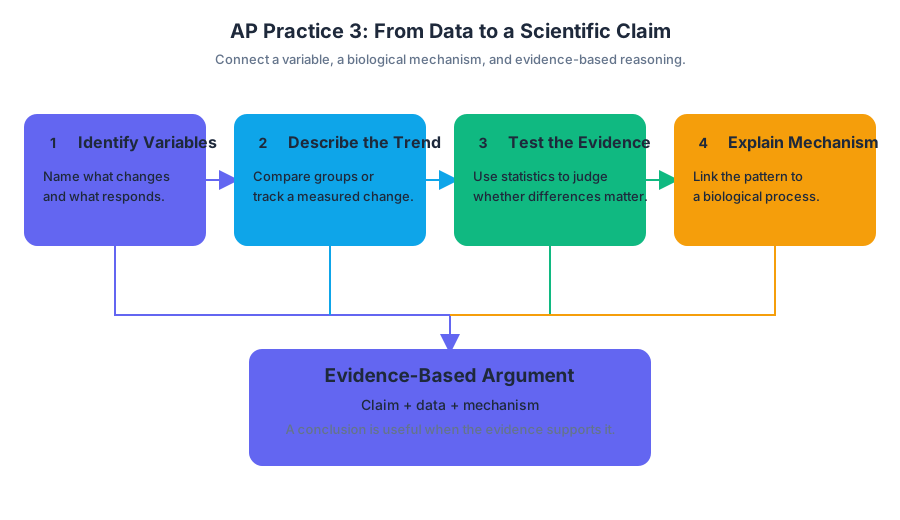
AP Practice 4
A data-analysis free-response task asks you to turn biological measurements into a defensible claim. The strongest response does not merely report that one group is “higher”; it identifies the variables, represents the data accurately, quantifies uncertainty when appropriate, and connects the observed pattern to a…
AP Practice 4
A data-analysis free-response task asks you to turn biological measurements into a defensible claim. The strongest response does not merely report that one group is “higher”; it identifies the variables, represents the data accurately, quantifies uncertainty when appropriate, and connects the observed pattern to a biological mechanism.
This original, unofficial practice targets Science Practice 4: Representing and Describing Data, Science Practice 5: Statistical Tests and Data Analysis, and Science Practice 6: Argumentation. It uses an enzyme investigation because biological data become meaningful only when experimental design, patterns, variation, and mechanism are considered together.
The task
A student investigates how temperature affects the activity of an enzyme that breaks down a colored substrate. Equal amounts of enzyme and substrate are mixed, and enzyme activity is estimated from the decrease in substrate concentration over one minute. Each temperature is tested in four independent trials.
| Temperature ($^\circ\mathrm{C}$) | Trial 1 ($\mu\mathrm{mol\ min^{-1}}$) | Trial 2 ($\mu\mathrm{mol\ min^{-1}}$) | Trial 3 ($\mu\mathrm{mol\ min^{-1}}$) | Trial 4 ($\mu\mathrm{mol\ min^{-1}}$) |
|---|---|---|---|---|
| $10$ | $12$ | $14$ | $13$ | $11$ |
| $25$ | $28$ | $30$ | $29$ | $31$ |
| $40$ | $46$ | $49$ | $45$ | $48$ |
| $55$ | $21$ | $18$ | $20$ | $19$ |
Prompt 1. Identify the independent variable and dependent variable. State one variable that should be held constant.
Prompt 2. Calculate the mean enzyme activity at $40^\circ\mathrm{C}$.
Prompt 3. Describe the relationship between temperature and enzyme activity shown by the data.
Prompt 4. The student plans to display the results using a graph. Identify an appropriate graph type and describe the axes.
Prompt 5. Explain why the student should include measures of variation on the graph.
Prompt 6. Construct an argument explaining why the data support an optimal temperature near $40^\circ\mathrm{C}$ rather than $55^\circ\mathrm{C}$.
Worked reasoning
Prompts 1–2: Variables and calculation
The independent variable is temperature because the student deliberately changes it. The dependent variable is enzyme activity, measured in $\mu\mathrm{mol\ min^{-1}}$, because it responds to temperature. A suitable controlled variable is the amount of enzyme, amount of substrate, reaction time, or solution volume.
For $40^\circ\mathrm{C}$, add the four trial values and divide by the number of trials:
$$ \bar{x}=\frac{46+49+45+48}{4} =\frac{188}{4} =47\ \mu\mathrm{mol\ min^{-1}} $$
The awarded reasoning must show the setup, not only the final number. A response that gives $47$ without units is weaker because the measurement represents a rate, not simply an amount of product.
Prompts 3–4: Pattern and representation
Activity increases from a mean of $12.5\ \mu\mathrm{mol\ min^{-1}}$ at $10^\circ\mathrm{C}$ to $29.5\ \mu\mathrm{mol\ min^{-1}}$ at $25^\circ\mathrm{C}$ and $47\ \mu\mathrm{mol\ min^{-1}}$ at $40^\circ\mathrm{C}$. It then decreases to $19.5\ \mu\mathrm{mol\ min^{-1}}$ at $55^\circ\mathrm{C}$. Thus, activity rises with temperature up to approximately $40^\circ\mathrm{C}$ and declines at the highest temperature tested.
A line graph is appropriate because temperature is a quantitative independent variable and the investigation examines a trend across ordered temperatures. The horizontal axis should show temperature in $^\circ\mathrm{C}$; the vertical axis should show mean enzyme activity in $\mu\mathrm{mol\ min^{-1}}$. Each axis needs a scale, numerical values, and units.
Prompts 5–6: Variation and argumentation
Measures of variation show how consistently the trials produced the mean. Two temperatures can have similar means but very different spreads, so the mean alone does not reveal the reliability of the estimate. Error bars based on standard deviation or standard error would help readers judge the variation among trials; the type of error bar must be identified rather than drawn ambiguously.
The data support an optimum near $40^\circ\mathrm{C}$ because the mean activity is greatest there, at $47\ \mu\mathrm{mol\ min^{-1}}$, whereas activity falls to $19.5\ \mu\mathrm{mol\ min^{-1}}$ at $55^\circ\mathrm{C}$. A biological explanation is that moderate warming increases molecular motion and enzyme–substrate collisions, while excessive heat can disrupt the enzyme’s three-dimensional structure and alter the active site. The data support this explanation, but they do not prove irreversible denaturation because enzyme structure was not measured directly.
High-scoring argument: claim + quantitative evidence + biologically relevant reasoning.
Timing and error review
Allow approximately $12$–$15$ minutes for a data-analysis task of this size: $2$ minutes to identify variables, $3$ minutes for calculations, $3$ minutes for graph interpretation, and $4$–$7$ minutes for the evidence-based argument. Reserve the final minute to check units, labels, and whether every claim is tied to data.
Use this error-review routine after completing the task:
- Did the response name variables by their experimental roles?
- Did every calculation include a formula, substitution, answer, and unit?
- Did the graph place the independent variable on the horizontal axis?
- Did the description report a trend without claiming more than the data show?
- Did the argument include numerical evidence and a mechanism?
- Did the response distinguish variation from proof of statistical significance?
Misconception check
Misconception: “The highest measured value proves the enzyme’s exact optimum temperature.” The data identify $40^\circ\mathrm{C}$ as the highest point among the temperatures tested. A temperature between $40^\circ\mathrm{C}$ and $55^\circ\mathrm{C}$ could produce greater activity, so the precise optimum would require additional temperature levels and replicated trials.
Retrieval check: If the mean activity at $40^\circ\mathrm{C}$ were high but the trials varied greatly, would the mean alone establish a reliable difference from $25^\circ\mathrm{C}$? No. Variation must be considered, and an appropriate statistical analysis may be needed before concluding that the treatments differ significantly.
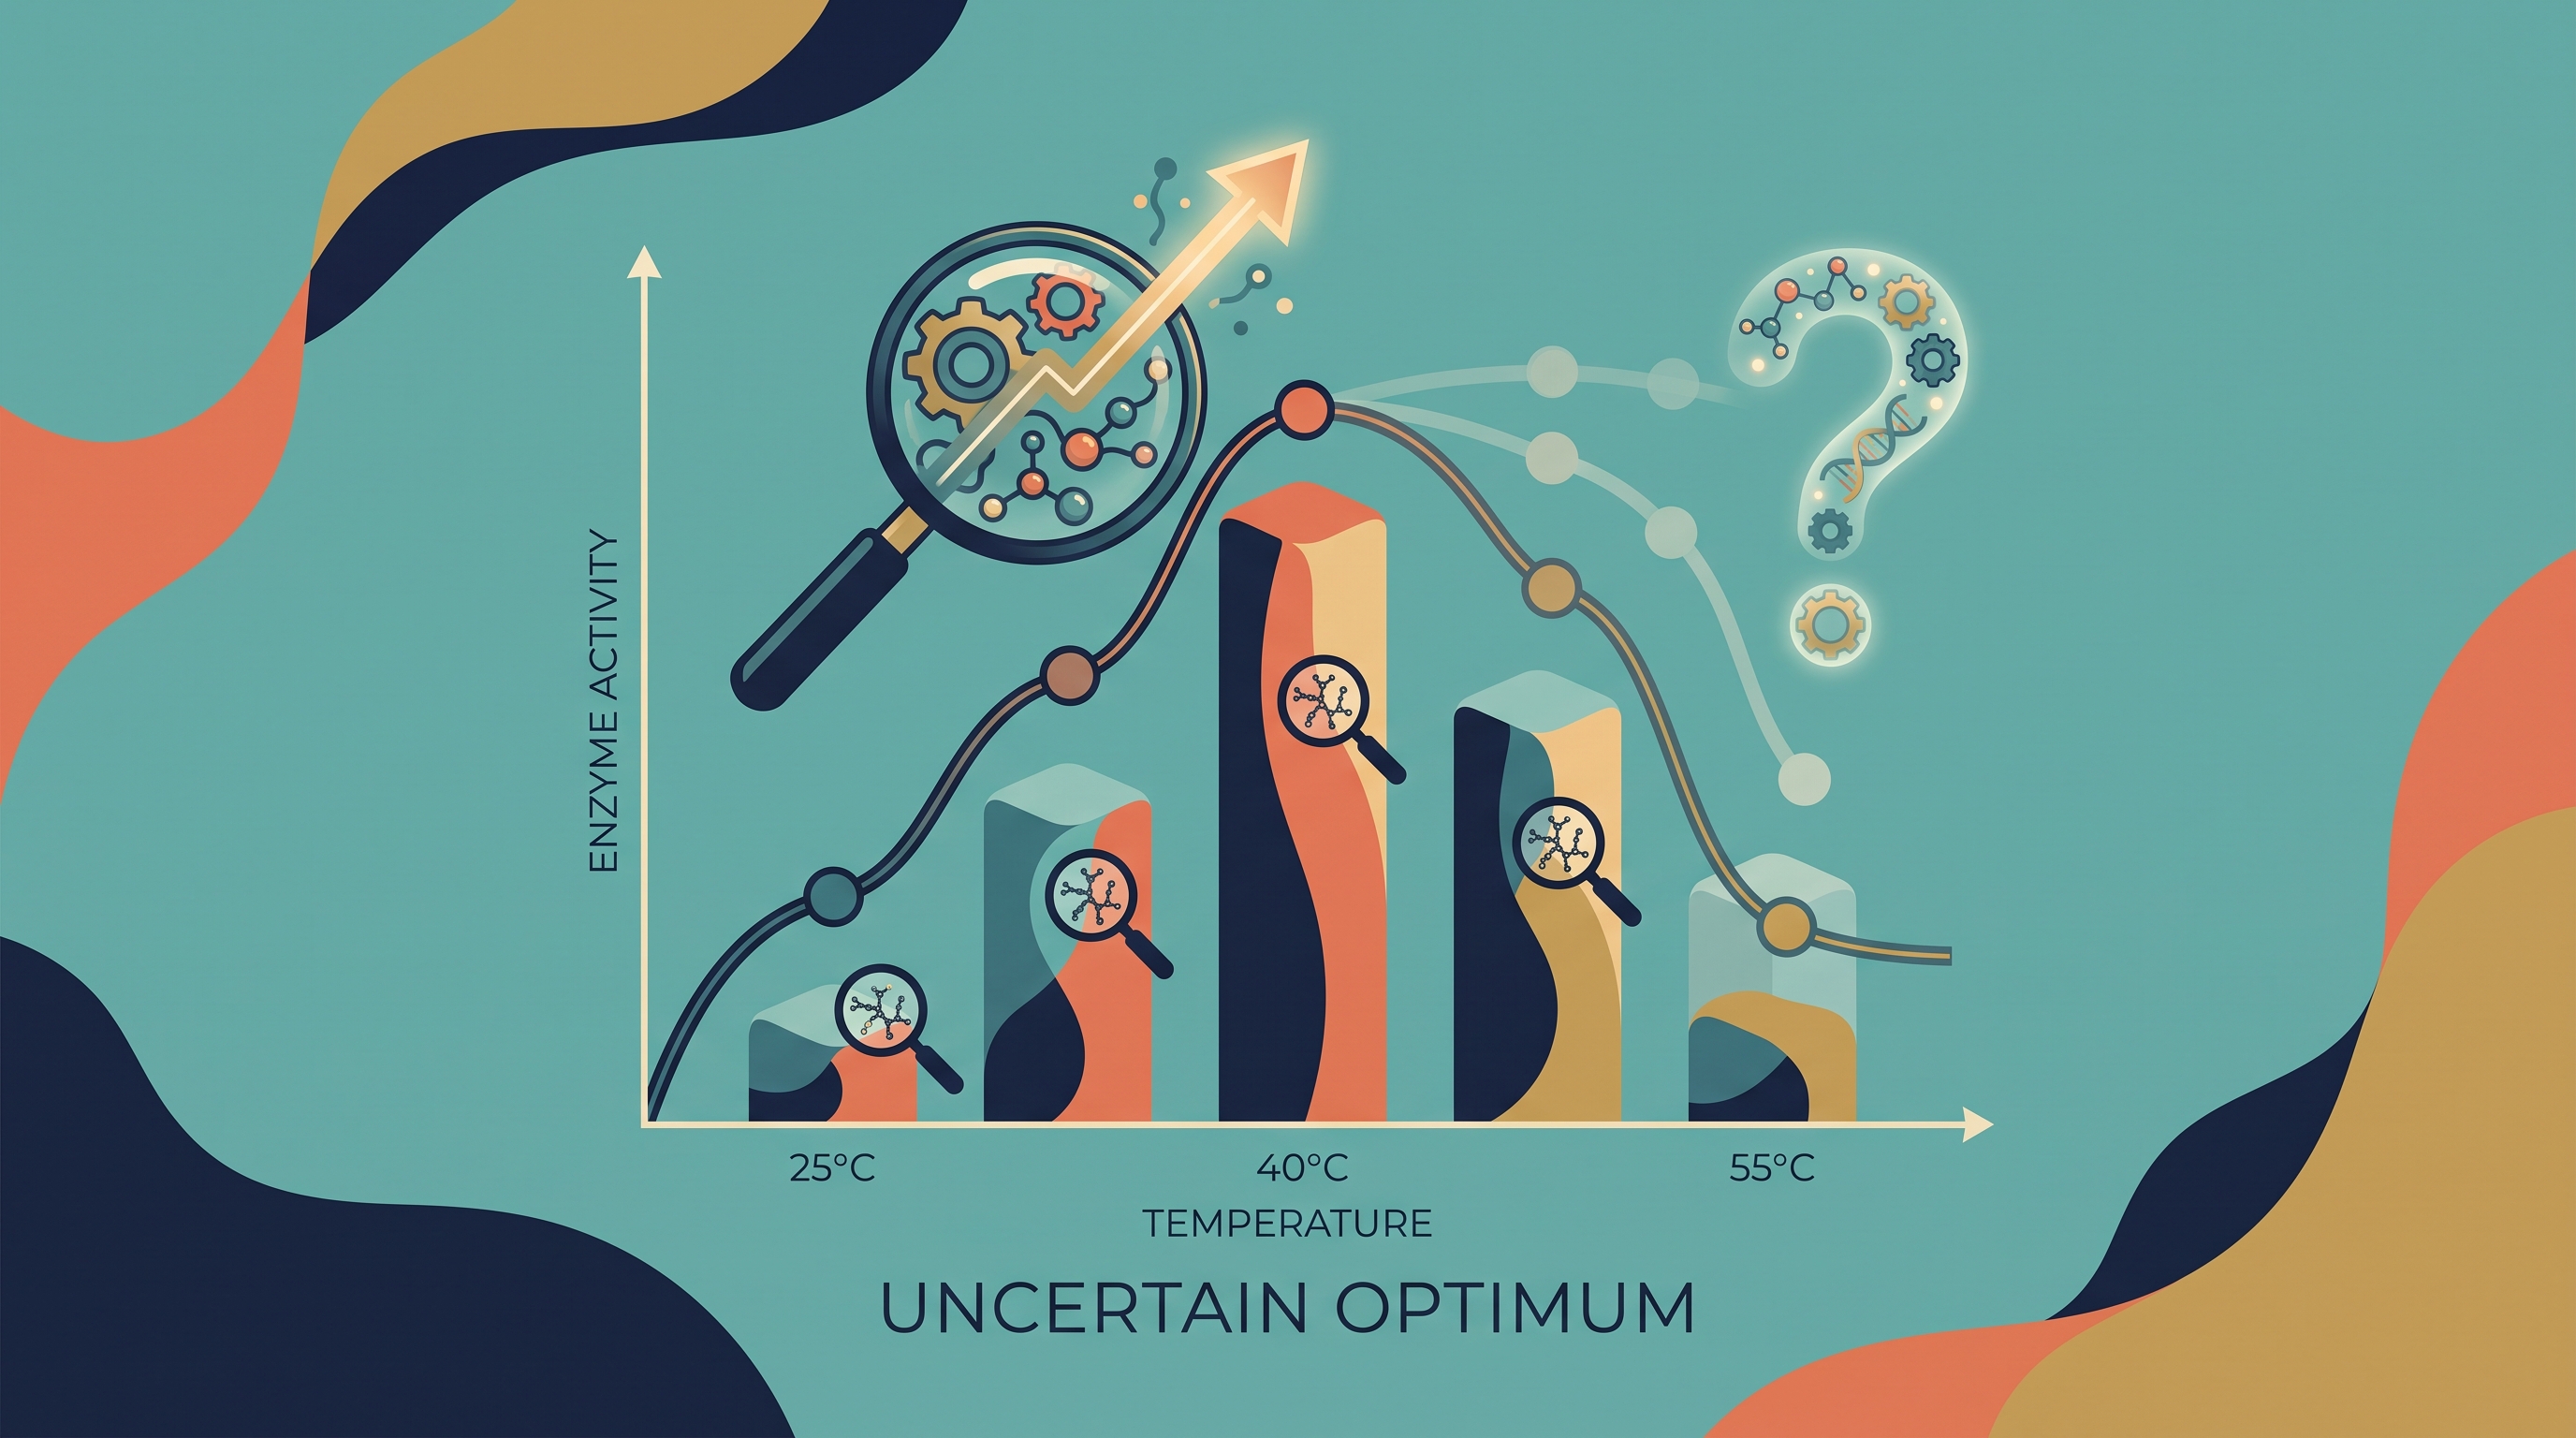
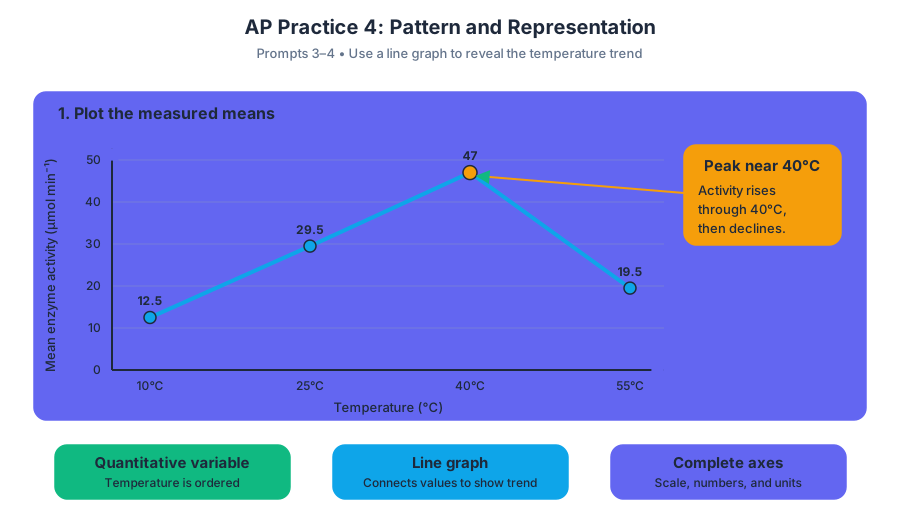
AP Practice 5
A strong short free-response answer does more than name a biological fact: it connects a claim to specific evidence and explains the biological mechanism linking them.
AP Practice 5
A strong short free-response answer does more than name a biological fact: it connects a claim to specific evidence and explains the biological mechanism linking them. This practice focuses on an original data-analysis task in which you must interpret an experiment, perform a quantitative test, and construct a defensible scientific argument.
Task profile: data-based short free response
This task most directly exercises Science Practice 4: Representing and Describing Data, Science Practice 5: Statistical Tests and Data Analysis, and Science Practice 6: Argumentation. It may also require Science Practice 1: Concept Explanation when you explain why a treatment changes a biological process.
A useful response chain is:
Data pattern $\rightarrow$ calculation or comparison $\rightarrow$ biological interpretation $\rightarrow$ claim supported by evidence
Do not treat these as separate tasks. A calculation earns little value if you never interpret it, and a conclusion is weak if it does not identify the data that support it.
Original practice prompt
Researchers investigated whether salinity affects the germination of a marsh plant. They placed equal numbers of seeds in solutions containing different sodium chloride concentrations. After $72$ hours, they recorded the number of seeds that germinated.
| Sodium chloride concentration | Germinated seeds | Ungerminated seeds |
|---|---|---|
| $0%$ | $86$ | $14$ |
| $1%$ | $74$ | $26$ |
| $2%$ | $51$ | $49$ |
| $3%$ | $28$ | $72$ |
The researchers repeated the experiment using a second group of seeds. Their predicted numbers under the null hypothesis that salinity has no effect were $60$ germinated and $40$ ungerminated seeds at each concentration.
Answer the following.
-
Describe the relationship between sodium chloride concentration and germination percentage.
-
Calculate the chi-square statistic for the $3%$ treatment using observed values of $28$ germinated and $72$ ungerminated seeds and expected values of $60$ germinated and $40$ ungerminated seeds.
-
Explain how increased salinity could reduce germination.
-
State whether the data support rejecting the null hypothesis for the $3%$ treatment if the critical value is $\chi^2=3.84$.
-
Identify one limitation of the investigation and propose a specific improvement.
Worked reasoning and scoring logic
1. Describe the relationship
First calculate or compare percentages rather than merely repeating raw counts. Because each treatment contains $100$ seeds, the germinated-seed count is also the germination percentage: germination decreases from $86%$ at $0%$ sodium chloride to $28%$ at $3%$ sodium chloride.
Rewardable reasoning: identify the direction of the relationship and support it with at least two values. “Salinity lowers germination” is a claim; “germination falls from $86%$ to $28%$ as salinity rises from $0%$ to $3%$” is an evidence-based description.
2. Calculate chi-square
Use the equation:
$$ \chi^2=\sum\frac{(o-e)^2}{e} $$
For germinated seeds:
$$ \frac{(28-60)^2}{60}
\frac{1024}{60} \approx 17.07 $$
For ungerminated seeds:
$$ \frac{(72-40)^2}{40}
\frac{1024}{40} =25.60 $$
Add the category values:
$$ \chi^2=17.07+25.60=42.67 $$
Rewardable reasoning: show the observed value, expected value, subtraction, squaring, division, and final sum. A calculator result without a setup may not demonstrate that the correct categories were used.
3. Explain the biological mechanism
A concentrated salt solution has lower water potential than the seed cells. Water therefore enters the seed less readily, reducing the hydration needed to activate enzymes, mobilize stored molecules, and begin growth. The explanation must connect salinity to water availability and then to germination; simply saying “salt is harmful” is incomplete.
4. Interpret the statistical test
The calculated value, $\chi^2=42.67$, is greater than the critical value, $\chi^2=3.84$. The researchers should reject the null hypothesis for the $3%$ treatment because the difference between observed and expected outcomes is statistically significant under the stated criterion.
The precise conclusion is not “salinity causes every seed to fail.” It is that the $3%$ treatment produced a germination pattern unlikely under the null hypothesis that salinity has no effect.
5. Evaluate the investigation
One limitation is that the investigation reports only one group of $100$ seeds per concentration, so differences among individual seed batches cannot be separated from the treatment effect. An improvement would be to use several independently prepared groups at each concentration and calculate germination percentages across replicates.
This answer earns the design point because it identifies a concrete limitation and pairs it with a feasible improvement. “Make the experiment better” is not specific enough.
Examiner-style error checks
Misconception: “A larger chi-square value proves the hypothesis.” A large $\chi^2$ indicates a large difference between observed and expected results. It supports rejecting the null hypothesis when compared with the appropriate critical value; it does not automatically prove a particular mechanism.
Misconception: “The expected values are the control-group results.” Expected values are predictions generated by the null hypothesis. They may equal a control pattern in some experiments, but they are conceptually distinct.
Misconception: “Statistical significance proves biological importance.” A statistically significant difference may be small in practical terms, whereas a biologically important pattern may require more evidence to establish statistical significance.
Timing and review routine
Allow approximately $12$–$15$ minutes: $2$ minutes to identify variables and trends, $4$ minutes for calculations, $5$ minutes for explanations and experimental design, and $2$ minutes to check units, comparisons, and conclusions.
Afterward, label each missed point as data reading, mathematical setup, mechanism, statistical interpretation, or experimental design. Rewrite only the weakest response using the pattern: claim, numerical evidence, biological reasoning. That revision targets the science practices rather than merely memorizing the answer.
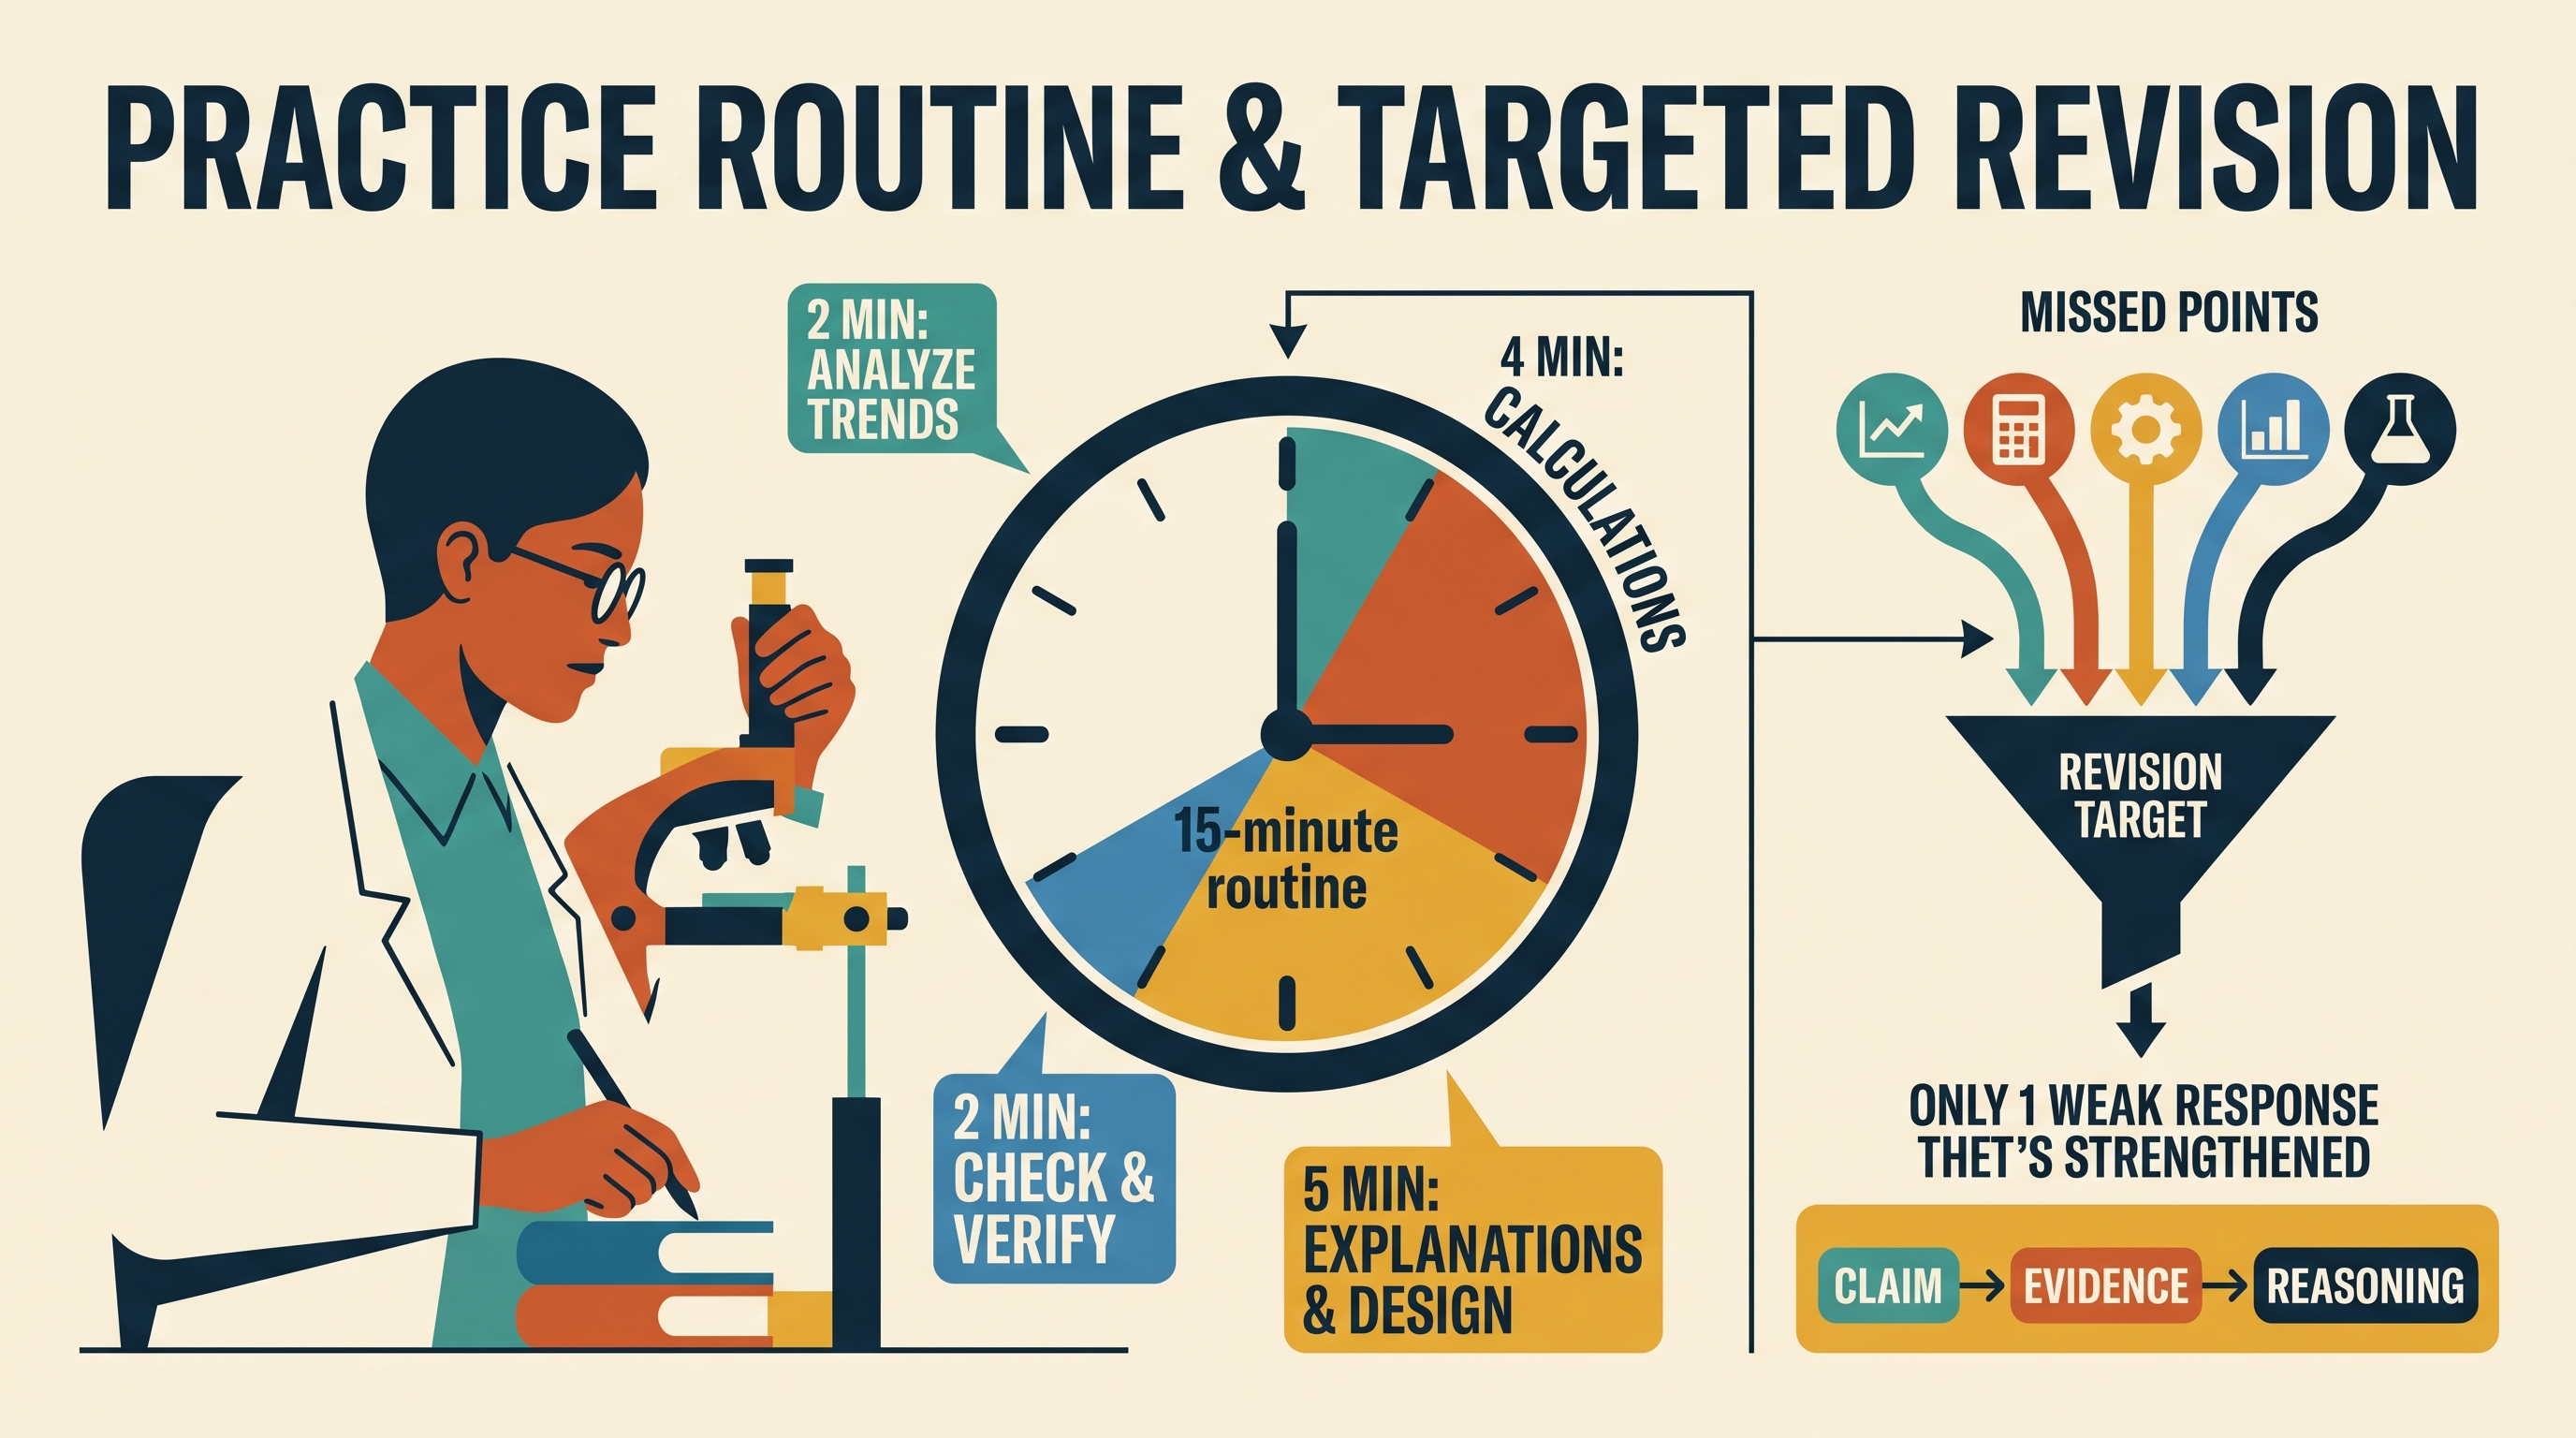
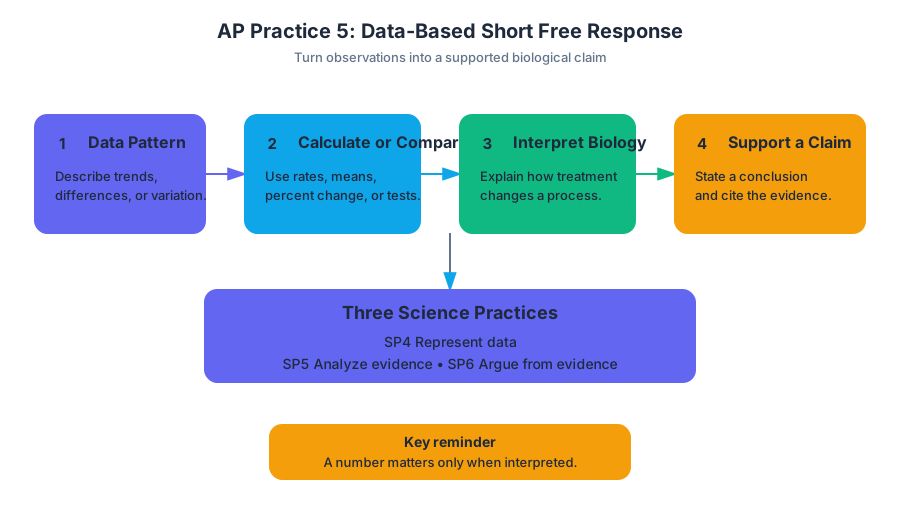
AP Practice 6
A short free-response question rewards a chain of biological reasoning: identify the pattern in the evidence, connect it to a mechanism, and justify the conclusion without claiming more than the data support.
AP Practice 6
A short free-response question rewards a chain of biological reasoning: identify the pattern in the evidence, connect it to a mechanism, and justify the conclusion without claiming more than the data support. The strongest response is not the longest one; it is the one that makes each requested claim visible and evidence-based.
Task type: Short free-response question
On the current AP Biology exam, a short free-response question typically combines a biological context with several focused tasks. A prompt may ask you to describe a trend, calculate or compare values, explain a mechanism, propose an investigation, or justify a conclusion. Treat each command as a separate scoring target.
Suggested timing: spend about $12$–$15$ minutes reading, reasoning, and writing. Reserve the final $2$ minutes to check that every command has an answer, every numerical result includes appropriate units, and every conclusion refers to evidence.
Original practice prompt: enzyme activity and temperature
A researcher measures the initial reaction rate of an enzyme at several temperatures. The enzyme catalyzes the breakdown of a pigment molecule.
| Temperature ($^\circ\mathrm{C}$) | Initial reaction rate ($\mu\mathrm{mol,min^{-1}}$) |
|---|---|
| $10$ | $1.8$ |
| $20$ | $3.7$ |
| $30$ | $6.1$ |
| $40$ | $4.9$ |
| $50$ | $1.2$ |
(a) Describe the relationship between temperature and initial reaction rate from $10^\circ\mathrm{C}$ to $50^\circ\mathrm{C}$.
(b) The researcher claims that the enzyme has an optimum temperature of approximately $30^\circ\mathrm{C}$. Support the claim using the data.
(c) Explain the decrease in reaction rate above $30^\circ\mathrm{C}$.
(d) Design a control for an investigation testing whether the enzyme itself, rather than the pigment substrate, causes the temperature-dependent pattern.
Worked reasoning
(a) Describe the pattern
The rate increases from $1.8\ \mu\mathrm{mol,min^{-1}}$ at $10^\circ\mathrm{C}$ to $6.1\ \mu\mathrm{mol,min^{-1}}$ at $30^\circ\mathrm{C}$. It then decreases to $4.9\ \mu\mathrm{mol,min^{-1}}$ at $40^\circ\mathrm{C}$ and $1.2\ \mu\mathrm{mol,min^{-1}}$ at $50^\circ\mathrm{C}$.
Why this earns credit: the response gives both parts of the relationship—an increase followed by a decrease—and cites values from the table. Saying only “the rate changes with temperature” is too vague.
(b) Support the optimum-temperature claim
The claim is supported because the enzyme has its greatest measured initial reaction rate, $6.1\ \mu\mathrm{mol,min^{-1}}$, at $30^\circ\mathrm{C}$. The rate is lower at both neighboring tested temperatures: $3.7\ \mu\mathrm{mol,min^{-1}}$ at $20^\circ\mathrm{C}$ and $4.9\ \mu\mathrm{mol,min^{-1}}$ at $40^\circ\mathrm{C}$.
The precise wording matters: the data support $30^\circ\mathrm{C}$ as the optimum among the temperatures tested. They do not prove that the exact optimum is $30^\circ\mathrm{C}$, because the researcher did not test temperatures between $20^\circ\mathrm{C}$ and $40^\circ\mathrm{C}$.
(c) Explain the decline at high temperature
Temperatures above approximately $30^\circ\mathrm{C}$ can disrupt the weak interactions that maintain the enzyme’s three-dimensional shape. As the active site changes shape, the substrate binds less effectively, so fewer enzyme-substrate complexes form and the reaction rate decreases. At sufficiently high temperatures, the enzyme may become denatured, meaning that its functional shape is lost.
A complete explanation connects temperature to protein structure, then to active-site function, and finally to reaction rate:
$$ \text{higher temperature} \rightarrow \text{altered enzyme shape} \rightarrow \text{reduced substrate binding} \rightarrow \text{lower reaction rate} $$
(d) Design a control
Prepare reaction mixtures containing the same pigment substrate, buffer, and volume as the experimental mixtures, but omit the enzyme. Incubate these control mixtures at the same temperatures and for the same duration as the experimental mixtures. If the pigment does not break down substantially in the enzyme-free controls, the temperature-dependent pattern in the experimental mixtures is more likely to result from enzyme activity rather than spontaneous pigment degradation.
This is a negative control: it shows what happens when the proposed causal factor—the enzyme—is absent. A strong design also keeps substrate concentration, pH, total volume, incubation time, and measurement method constant, and uses repeated trials at each temperature.
Official science practices exercised
This practice set intentionally combines the six AP Biology science practices:
- Science Practice 1: Concept Explanation — explain how temperature can alter enzyme structure and function.
- Science Practice 2: Visual Representations — interpret or construct a graph showing reaction rate as a function of temperature.
- Science Practice 3: Questions and Methods — identify an appropriate control and controlled variables.
- Science Practice 4: Representing and Describing Data — describe the increase-then-decrease pattern using values.
- Science Practice 5: Statistical Tests and Data Analysis — compare reaction rates and recognize the limitation of measuring only selected temperatures.
- Science Practice 6: Argumentation — support the optimum-temperature claim with quantitative evidence while limiting the conclusion to the tested range.
Examiner-style error check
Common error: confusing an optimum with the highest possible temperature. The optimum is the condition producing the highest measured activity, not necessarily the warmest condition.
Common error: writing a mechanism without a causal link. “High temperature denatures the enzyme” is a useful start, but the explanation should continue to the active site and substrate binding.
Common error: proposing an unrelated control. A second temperature is not a control by itself. The control must remove or alter the factor being tested while preserving the other conditions.
Common error: overclaiming. Because only five temperatures were tested, conclude that $30^\circ\mathrm{C}$ is the best tested temperature—not that it is unquestionably the exact optimum.
Retrieval check
If the reaction rate were high at $50^\circ\mathrm{C}$ but the pigment also degraded rapidly in the enzyme-free control at that temperature, what would happen to the claim that temperature directly increases enzyme activity? The claim would be weakened, because the measured product could result from nonenzymatic pigment breakdown rather than catalysis by the enzyme.
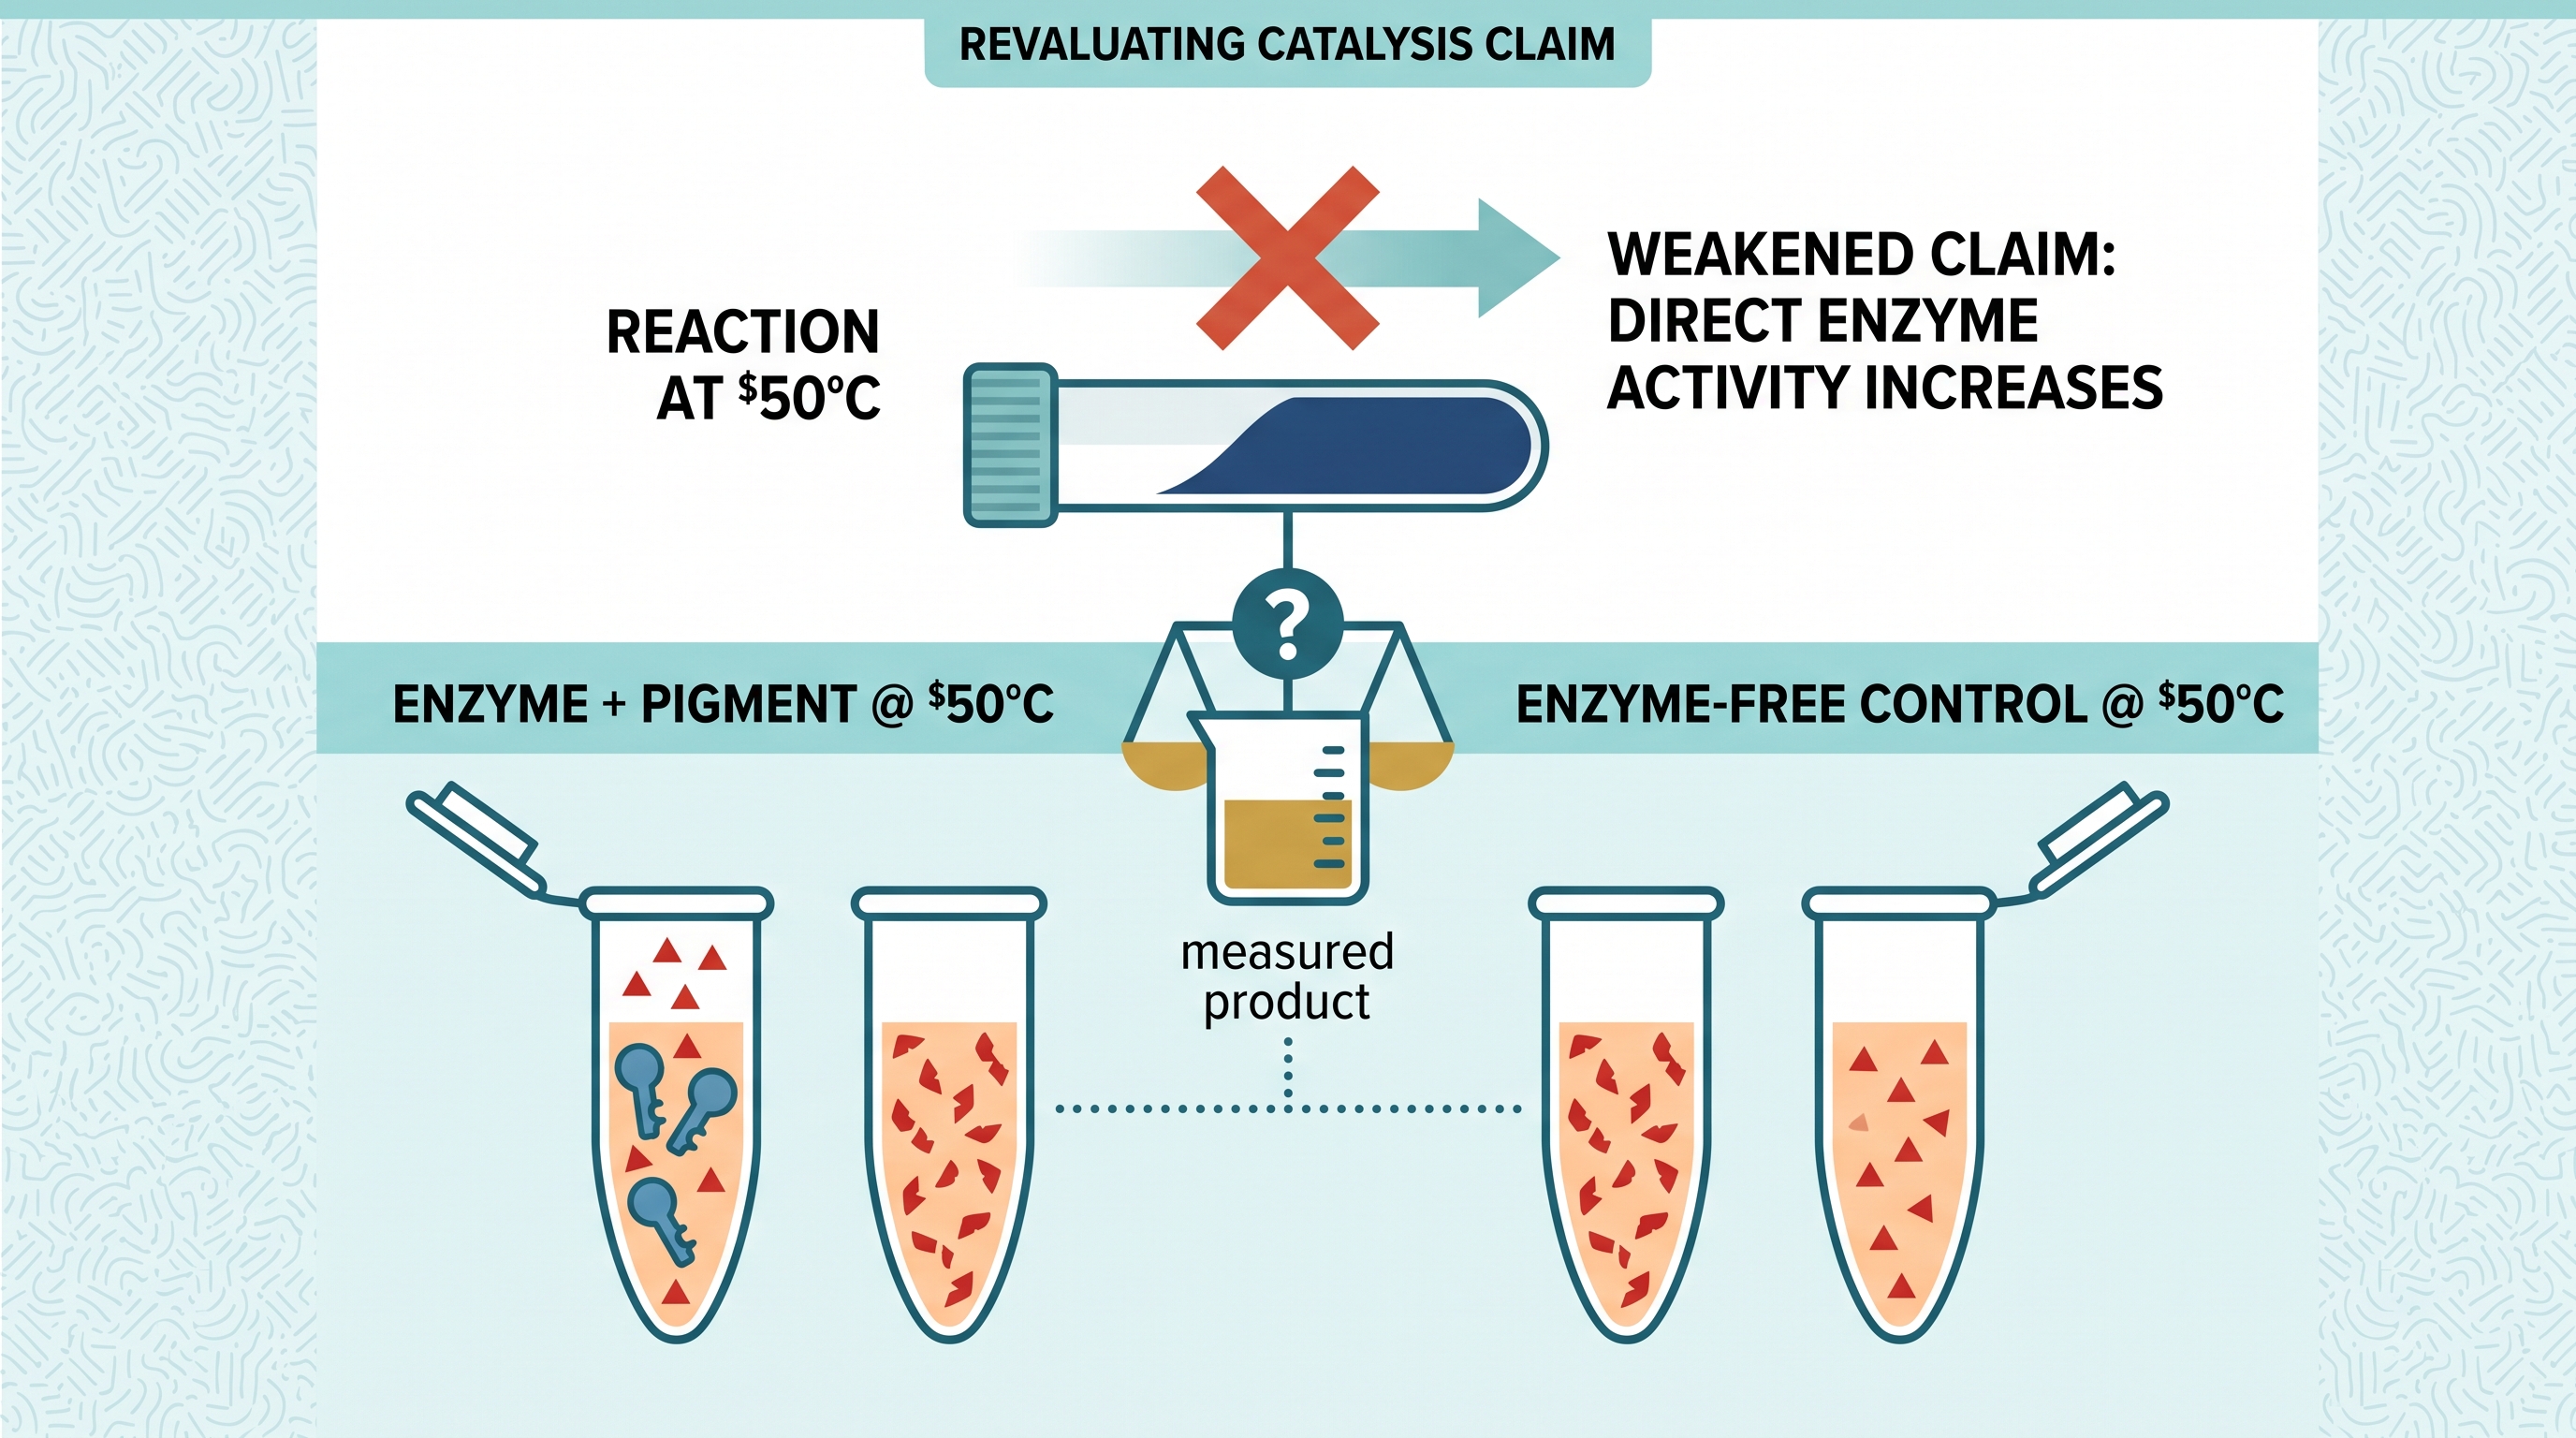
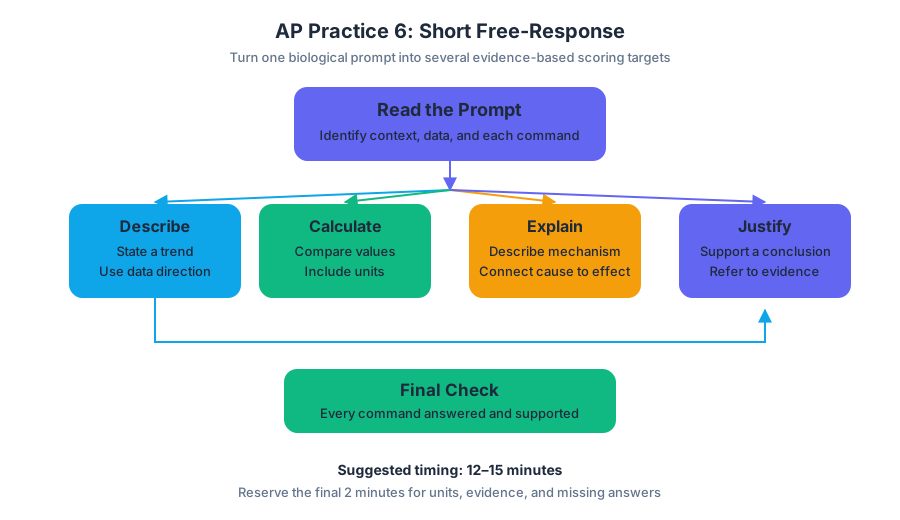
Source Materials
- Ap Biology Course And Exam Description
- Ap Biology Course Overview
- Ap Biology Course At A Glance
- Ap Biology Equations And Formulas Sheet
- Chapter 3 Quantitative Skills In Ap Sciences
- Ap Biology Teacher Lab Manual Effective Fall 2019
- Updates 2025 26
- Figure — Ap Biology Course And Exam Description (p. 1)
- Figure — Ap Biology Course And Exam Description (p. 15)
- Figure — Ap Biology Course And Exam Description (p. 24)
- Figure — Ap Biology Course And Exam Description (p. 29)
- 00762-113-CED-Biology_Unit 1.indd 30 03/12/24 10:05 PM
Study AP Biology with AI — Free on Lykke
Sign up for free to generate personalized flashcards, quizzes, and study guides from this course. Chat with an AI tutor that knows the material.
Get Started FreeView this course wiki on Lykke · Browse all public course wikis