Interactive Demo
Epsilon-Delta Limit Visualizer
Epsilon-Delta Limit Visualizer is a free, interactive learning demo from the Precalculus course on Lykke. It helps you build intuition for Estimating limits from graphs, Algebraic limit properties, The Squeeze Theorem, Intermediate Value Theorem (IVT). Play with it directly in your browser — it features 3 sliders, 1 dropdown and a live visual canvas. This demo lives in the “Limits and Continuity” section of the course.
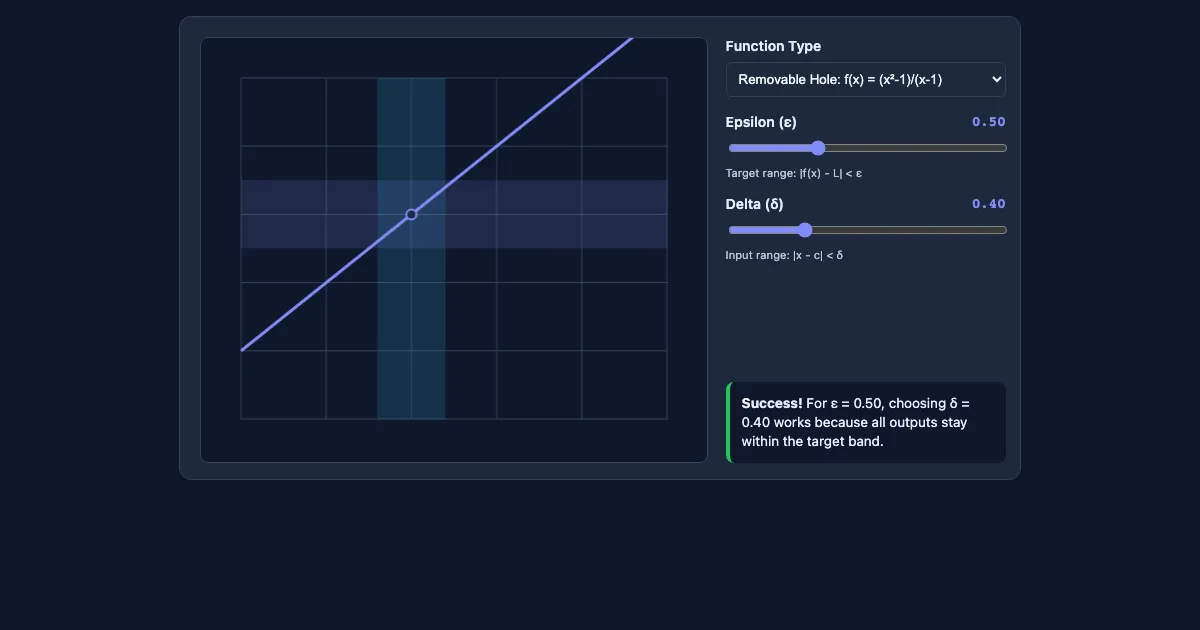
How to use this demo
- Drag the “Function Type” slider to change the inputs and watch the result update live.
- Pick an option from the dropdown to switch between scenarios.
- Experiment freely — there's nothing to break, and every change is reversible.
What you'll explore
- Estimating limits from graphs
- Algebraic limit properties
- The Squeeze Theorem
- Intermediate Value Theorem (IVT)
- Continuity
Frequently asked questions
What does the Epsilon-Delta Limit Visualizer demo do?
Introduces the foundational concepts of calculus, defining how functions behave as they approach specific points or infinity. Epsilon-Delta Limit Visualizer turns that idea into something you can manipulate directly and watch respond.
What Precalculus concept does Epsilon-Delta Limit Visualizer teach?
Introduces the foundational concepts of calculus, defining how functions behave as they approach specific points or infinity. It focuses on Estimating limits from graphs, Algebraic limit properties, The Squeeze Theorem, Intermediate Value Theorem (IVT), Continuity from the “Limits and Continuity” section.
What can I control in Epsilon-Delta Limit Visualizer?
The “Function Type” slider change the key inputs; a dropdown switches between scenarios. Every change updates the visualization in real time, so you can see exactly how each variable affects the outcome.
How does Epsilon-Delta Limit Visualizer fit into the Precalculus course?
The Client Challenge Precalculus course is a comprehensive curriculum designed to bridge the gap between high school algebra and college-level calculus. It covers ten core units ranging from composite functions and trig… This demo is the interactive piece for the “Limits and Continuity” section. Open the full Precalculus course wiki at https://www.getlykke.com/explore/public/precalculus-760426f2-c765-4f63-848e-73deae621c37 for notes, flashcards, quizzes and the other demos.
What will I understand better after using Epsilon-Delta Limit Visualizer?
You'll build intuition for Estimating limits from graphs, Algebraic limit properties, The Squeeze Theorem, Intermediate Value Theorem (IVT), Continuity — and, crucially, see how they behave when you change the inputs, which is hard to get from a textbook or lecture on Precalculus alone.
From the Precalculus course
This interactive demo is part of the Limits and Continuity section. Explore the full Precalculus course wiki on Lykke — with notes, flashcards, quizzes and more interactive demos.
Open the Precalculus course →