Interactive Demo
Data Connection Agent Visualization
Data Connection Agent Visualization is a free, interactive learning demo from the Data connectivity and integration course on Lykke. It helps you build intuition for Data Connection Application, JDBC Drivers, Change Data Capture (CDC), Virtual Tables. Play with it directly in your browser — it features 3 buttons and direct drag interaction. This demo lives in the “Connecting to External Data Sources” section of the course.
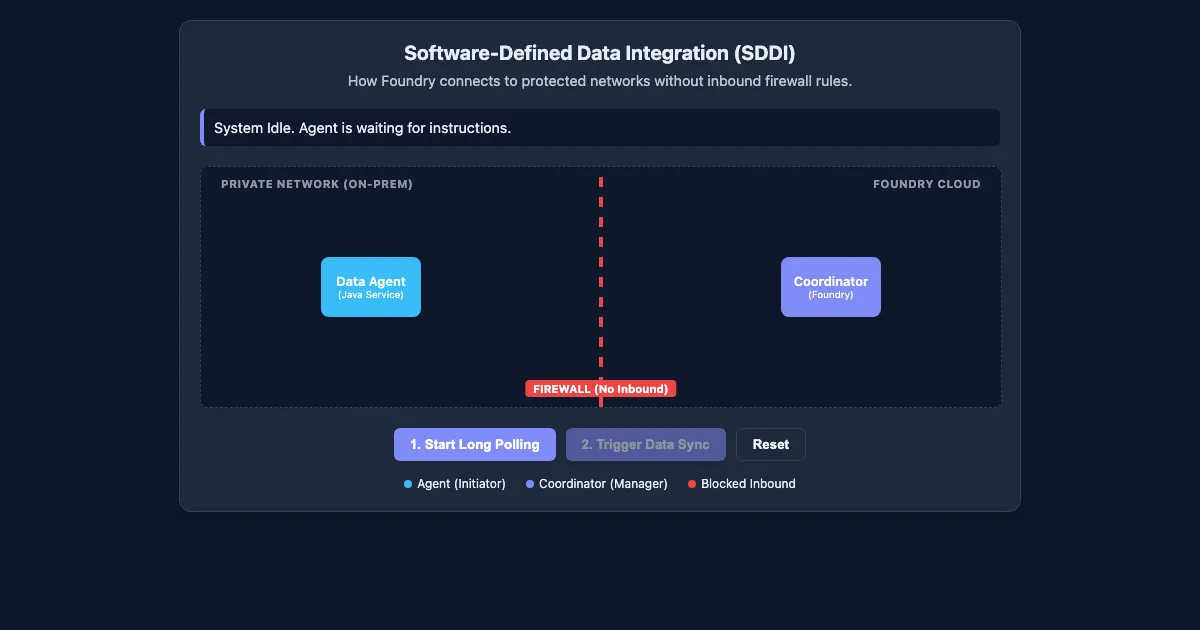
How to use this demo
- Click and drag directly on the canvas to manipulate the scene.
- Use the “1. Start Long Polling”, “2. Trigger Data Sync”, “Reset” buttons to trigger actions or reset the demo.
- Experiment freely — there's nothing to break, and every change is reversible.
What you'll explore
- Data Connection Application
- JDBC Drivers
- Change Data Capture (CDC)
- Virtual Tables
- S3-compatible API
Frequently asked questions
What does the Data Connection Agent Visualization demo do?
Data Connection Agent Visualization Software-Defined Data Integration (SDDI) How Foundry connects to protected networks without inbound firewall rules. Data Connection Agent Visualization lets you explore this hands-on instead of only reading about it.
What Data connectivity and integration concept does Data Connection Agent Visualization teach?
Exploring the tools and protocols used to ingest data from external systems into Foundry, including JDBC, CDC, and Virtual Tables. It focuses on Data Connection Application, JDBC Drivers, Change Data Capture (CDC), Virtual Tables, S3-compatible API from the “Connecting to External Data Sources” section.
What can I control in Data Connection Agent Visualization?
You can drag elements directly on the canvas; the “1. Start Long Polling”, “2. Trigger Data Sync”, “Reset” buttons run actions or reset the demo. Every change updates the visualization in real time, so you can see exactly how each variable affects the outcome.
How does Data Connection Agent Visualization fit into the Data connectivity and integration course?
This course provides a comprehensive deep dive into Palantir Foundry's data connectivity and integration suite, which transcends traditional ETL/ELT methodologies. Students will explore how to build robust, scalable dat… This demo is the interactive piece for the “Connecting to External Data Sources” section. Open the full Data connectivity and integration course wiki at https://www.getlykke.com/explore/public/data-connectivity-and-integration-cfe45305-2201-4c25-a412-cfd1b5648c3e for notes, flashcards, quizzes and the other demos.
What will I understand better after using Data Connection Agent Visualization?
You'll build intuition for Data Connection Application, JDBC Drivers, Change Data Capture (CDC), Virtual Tables, S3-compatible API — and, crucially, see how they behave when you change the inputs, which is hard to get from a textbook or lecture on Data connectivity and integration alone.
From the Data connectivity and integration course
This interactive demo is part of the Connecting to External Data Sources section. Explore the full Data connectivity and integration course wiki on Lykke — with notes, flashcards, quizzes and more interactive demos.
Open the Data connectivity and integration course →