Interactive Demo
Chi-Square Distribution Visualizer
Chi-Square Distribution Visualizer is a free, interactive learning demo from the Introductory Statistics course on Lykke. It helps you build intuition for Goodness-of-Fit, Test of Independence, Contingency Tables, Degrees of Freedom. Play with it directly in your browser — it features 3 sliders, 3 buttons and a live visual canvas. This demo lives in the “The Chi-Square Distribution” section of the course.
How to use this demo
- Drag the “Simulation Speed” slider to change the inputs and watch the result update live.
- Use the “Drop 1 Sample”, “Auto: Off”, “Reset” buttons to trigger actions or reset the demo.
- Experiment freely — there's nothing to break, and every change is reversible.
What you'll explore
- Goodness-of-Fit
- Test of Independence
- Contingency Tables
- Degrees of Freedom
Frequently asked questions
What does the Chi-Square Distribution Visualizer demo do?
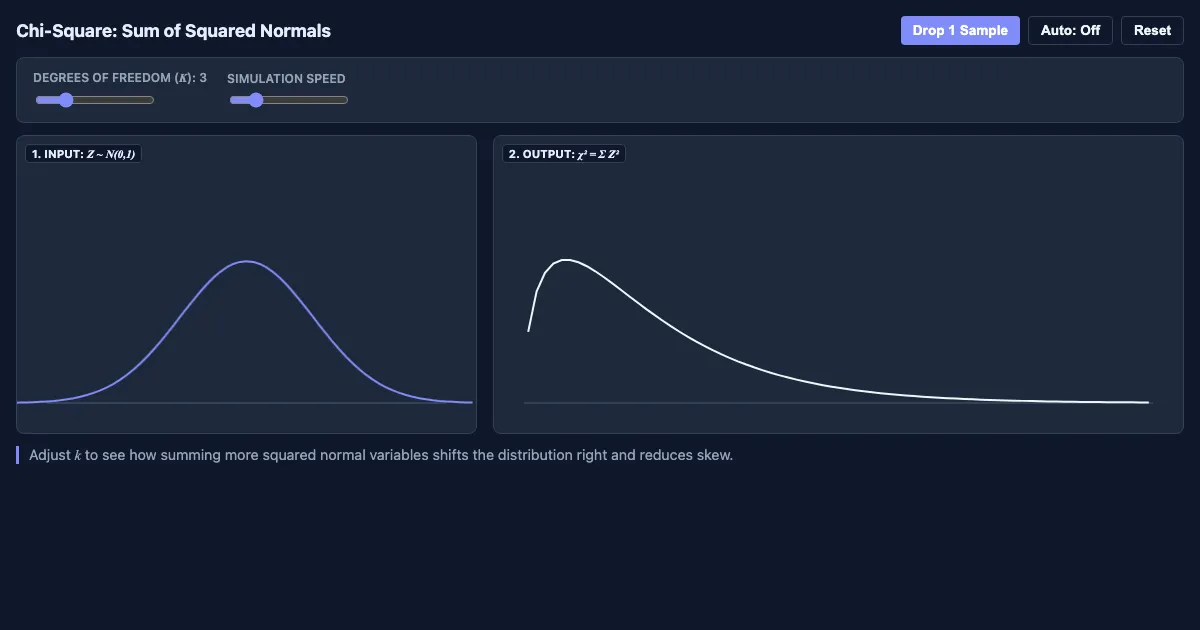
OUTPUT: χ² = Σ Z² Adjust k to see how summing more squared normal variables shifts the distribution right and reduces skew. Chi-Square Distribution Visualizer lets you explore this hands-on instead of only reading about it.
What Introductory Statistics concept does Chi-Square Distribution Visualizer teach?
Testing for relationships between categorical variables and goodness-of-fit. It focuses on Goodness-of-Fit, Test of Independence, Contingency Tables, Degrees of Freedom from the “The Chi-Square Distribution” section.
What can I control in Chi-Square Distribution Visualizer?
The “Simulation Speed” slider change the key inputs; the “Drop 1 Sample”, “Auto: Off”, “Reset” buttons run actions or reset the demo. Every change updates the visualization in real time, so you can see exactly how each variable affects the outcome.
How does Chi-Square Distribution Visualizer fit into the Introductory Statistics course?
Introductory Statistics 2e is a comprehensive, open-source course designed for a one-semester introduction to statistics. The curriculum focuses on practical applications across diverse fields such as business, healthca… This demo is the interactive piece for the “The Chi-Square Distribution” section. Open the full Introductory Statistics course wiki at https://www.getlykke.com/explore/public/introductory-statistics-a4146afb-5db4-4b78-bb6a-8cef9d5ce9e0 for notes, flashcards, quizzes and the other demos.
What will I understand better after using Chi-Square Distribution Visualizer?
You'll build intuition for Goodness-of-Fit, Test of Independence, Contingency Tables, Degrees of Freedom — and, crucially, see how they behave when you change the inputs, which is hard to get from a textbook or lecture on Introductory Statistics alone.
From the Introductory Statistics course
This interactive demo is part of the The Chi-Square Distribution section. Explore the full Introductory Statistics course wiki on Lykke — with notes, flashcards, quizzes and more interactive demos.
Open the Introductory Statistics course →