Interactive Demo
The Statistical Funnel: From Variation to Inference
The Statistical Funnel: From Variation to Inference is a free, interactive learning demo from the AP Statistics course on Lykke. It helps you build intuition for Variation and Distribution, Patterns and Uncertainty, Data-Based Decisions, Selecting Statistical Methods. Play with it directly in your browser — it features 3 sliders, 7 buttons, direct drag interaction and a live visual canvas. This demo lives in the “Course Framework and Statistical Thinking” section of the course.
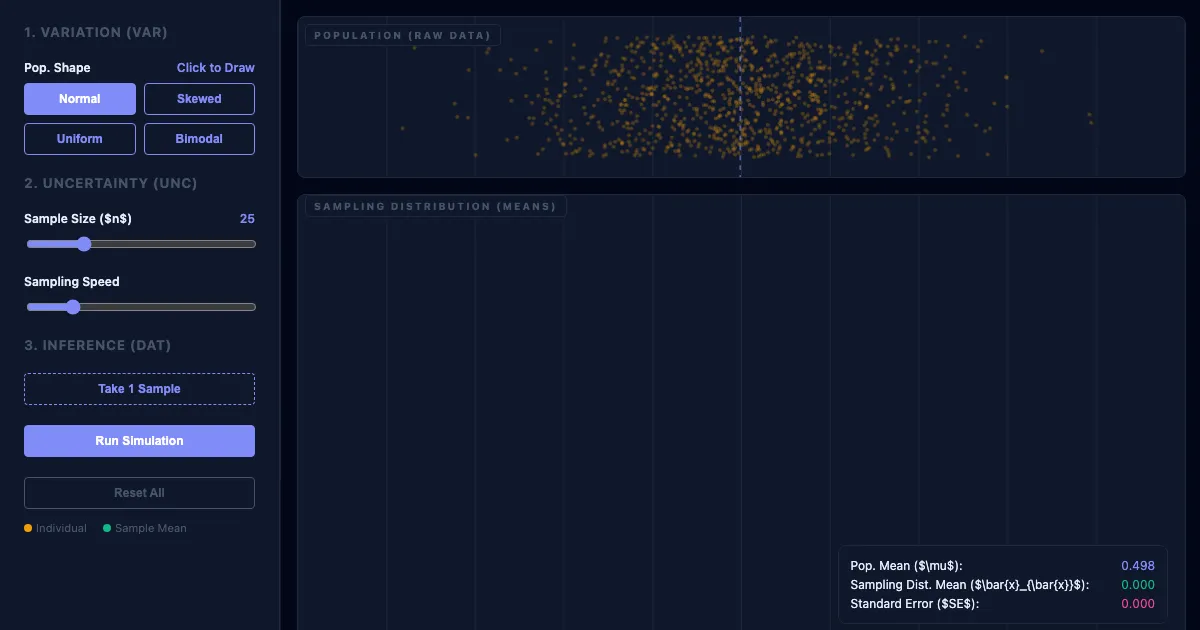
How to use this demo
- Drag the “Pop. Shape Click to Draw”, “Sample Size 25”, “Sampling Speed” sliders to change the inputs and watch the result update live.
- Click and drag directly on the canvas to manipulate the scene.
- Use the “Normal”, “Skewed”, “Uniform”, “Bimodal” buttons to trigger actions or reset the demo.
- Experiment freely — there's nothing to break, and every change is reversible.
What you'll explore
- Variation and Distribution
- Patterns and Uncertainty
- Data-Based Decisions
- Selecting Statistical Methods
- Data Analysis
- Using Probability and Simulation
- Statistical Argumentation
Frequently asked questions
What does the The Statistical Funnel: From Variation to Inference demo do?
This section introduces the foundational structure of the AP Statistics course, focusing on the core principles of evidence-based inquiry and the 'Big Ideas' that spiral through every unit. The Statistical Funnel: From Variation to Inference turns that idea into something you can manipulate directly and watch respond.
What AP Statistics concept does The Statistical Funnel: From Variation to Inference teach?
This section introduces the foundational structure of the AP Statistics course, focusing on the core principles of evidence-based inquiry and the 'Big Ideas' that spiral through every unit. It focuses on Variation and Distribution, Patterns and Uncertainty, Data-Based Decisions, Selecting Statistical Methods, Data Analysis, Using Probability and Simulation from the “Course Framework and Statistical Thinking” section.
What can I control in The Statistical Funnel: From Variation to Inference?
The “Pop. Shape Click to Draw”, “Sample Size 25”, “Sampling Speed” sliders change the key inputs; you can drag elements directly on the canvas; the “Normal”, “Skewed”, “Uniform”, “Bimodal” buttons run actions or reset the demo. Every change updates the visualization in real time, so you can see exactly how each variable affects the outcome.
How does The Statistical Funnel: From Variation to Inference fit into the AP Statistics course?
AP Statistics introduces students to the major concepts and tools for collecting, analyzing, and drawing conclusions from data. The course is equivalent to a one-semester introductory college statistics course and focus… This demo is the interactive piece for the “Course Framework and Statistical Thinking” section. Open the full AP Statistics course wiki at https://www.getlykke.com/explore/public/ap-statistics-70553ac9-70f9-422d-b8b6-c328240d85c1 for notes, flashcards, quizzes and the other demos.
What will I understand better after using The Statistical Funnel: From Variation to Inference?
You'll build intuition for Variation and Distribution, Patterns and Uncertainty, Data-Based Decisions, Selecting Statistical Methods, Data Analysis, Using Probability and Simulation — and, crucially, see how they behave when you change the inputs, which is hard to get from a textbook or lecture on AP Statistics alone.
From the AP Statistics course
This interactive demo is part of the Course Framework and Statistical Thinking section. Explore the full AP Statistics course wiki on Lykke — with notes, flashcards, quizzes and more interactive demos.
Open the AP Statistics course →