Interactive Demo
The Limit Probe: Derivative Visualization
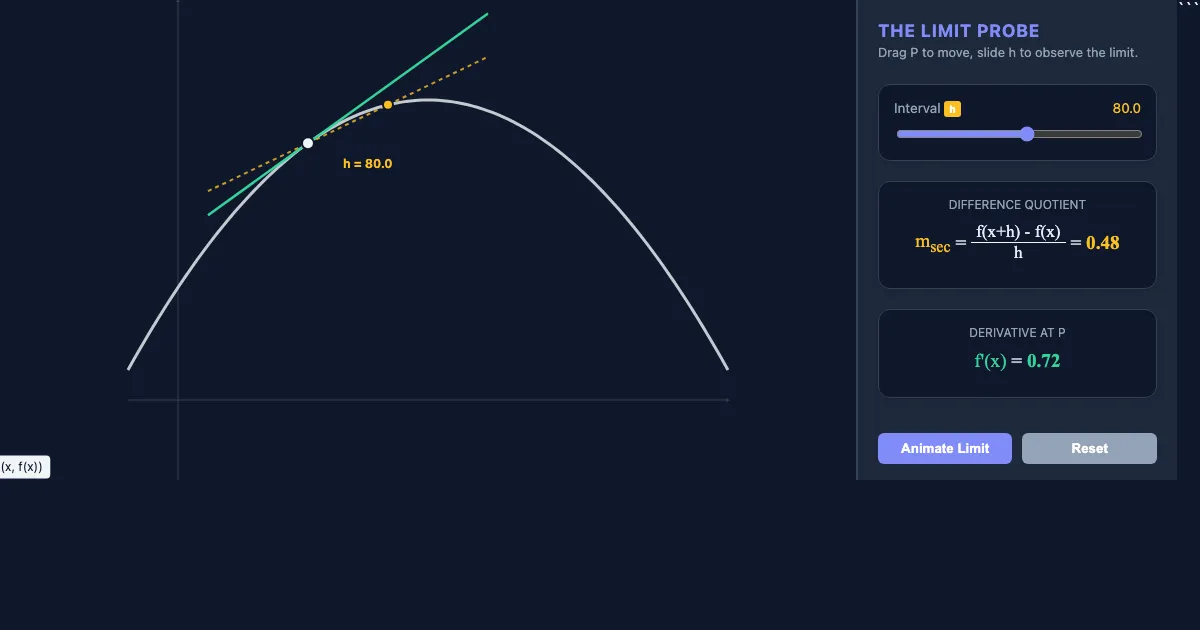
The Limit Probe: Derivative Visualization is a free, interactive learning demo from the AP Calculus AB course on Lykke. It helps you build intuition for Defining the Derivative as a Limit, Instantaneous vs. Average Rate of Change, Differentiability vs. Continuity, The Power Rule. Play with it directly in your browser — it features 1 slider, 2 buttons and direct drag interaction. This demo lives in the “Unit 2: Differentiation: Definition and Fundamental Properties” section of the course.
How to use this demo
- Drag the sliders to change the inputs and watch the visualization update in real time.
- Click and drag directly on the canvas to manipulate the scene.
- Use the “Animate Limit”, “Reset” buttons to trigger actions or reset the demo.
- Experiment freely — there's nothing to break, and every change is reversible.
What you'll explore
- Defining the Derivative as a Limit
- Instantaneous vs. Average Rate of Change
- Differentiability vs. Continuity
- The Power Rule
- The Product and Quotient Rules
- Derivatives of Trigonometric Functions
- The Constant Multiple Rule
Frequently asked questions
What does the The Limit Probe: Derivative Visualization demo do?
The Limit Probe: Derivative Visualization h Point P (x, f(x)) The Limit Probe Drag P to move, slide h to observe the limit. The Limit Probe: Derivative Visualization lets you explore this hands-on instead of only reading about it.
What AP Calculus AB concept does The Limit Probe: Derivative Visualization teach?
This unit introduces the derivative as the instantaneous rate of change. Students learn the formal definition of the derivative and the basic rules for differentiating common functions. It focuses on Defining the Derivative as a Limit, Instantaneous vs. Average Rate of Change, Differentiability vs. Continuity, The Power Rule, The Product and Quotient Rules, Derivatives of Trigonometric Functions from the “Unit 2: Differentiation: Definition and Fundamental Properties” section.
What can I control in The Limit Probe: Derivative Visualization?
The sliders change the key inputs; you can drag elements directly on the canvas; the “Animate Limit”, “Reset” buttons run actions or reset the demo. Every change updates the visualization in real time, so you can see exactly how each variable affects the outcome.
How does The Limit Probe: Derivative Visualization fit into the AP Calculus AB course?
AP Calculus AB is a college-level course that explores the concepts of limits, derivatives, and integrals. Students learn to approach mathematical problems through multiple representations—graphical, numerical, analytic… This demo is the interactive piece for the “Unit 2: Differentiation: Definition and Fundamental Properties” section. Open the full AP Calculus AB course wiki at https://www.getlykke.com/explore/public/ap-calculus-ab-c14bedc7-55ee-4bd3-99ff-a9a537a06a66 for notes, flashcards, quizzes and the other demos.
What will I understand better after using The Limit Probe: Derivative Visualization?
You'll build intuition for Defining the Derivative as a Limit, Instantaneous vs. Average Rate of Change, Differentiability vs. Continuity, The Power Rule, The Product and Quotient Rules, Derivatives of Trigonometric Functions — and, crucially, see how they behave when you change the inputs, which is hard to get from a textbook or lecture on AP Calculus AB alone.
From the AP Calculus AB course
This interactive demo is part of the Unit 2: Differentiation: Definition and Fundamental Properties section. Explore the full AP Calculus AB course wiki on Lykke — with notes, flashcards, quizzes and more interactive demos.
Open the AP Calculus AB course →